Article

Optical Labels Enabled Optical Performance Monitoring in WDM Systems

1
State Key Lab of Information Photonics and Optical Communications, Beijing University of Posts and Telecommunications, Beijing 100876, China
2
ZTE Corporation, Shenzhen 518055, China
*
Author to whom correspondence should be addressed.
Photonics 2022, 9(9), 647; https://doi.org/10.3390/photonics9090647
Submission received: 29 July 2022 / Revised: 4 September 2022 / Accepted: 4 September 2022 / Published: 9 September 2022
(This article belongs to the Special Issue Photonics for Emerging Applications in Communication and Sensing)

Abstract

:
Optical performance monitoring (OPM), particularly the optical power and optical signal-to-noise ratio (OSNR) of each wavelength channel, are of great importance and significance and need to be implemented to ensure stable and efficient operation/maintenance of wavelength division multiplexing (WDM) networks. However, the critical monitoring module of existing solutions generally are too expensive, operationally inconvenient and/or functionally limited to apply over WDM systems with numerous nodes. In this paper, a low-cost and high-efficiency OPM scheme based on differential phase shift keying (DPSK)-modulated digital optical labels is proposed and demonstrated. Each pilot tone is modulated by digital surveillance information and treated as an identity indicator and performance predictor that ties up to each wavelength channel and thereby can monitor the performance of all wavelength channels simultaneously by only one low-bandwidth photoelectric detector (PD) and by designed digital signal processing (DSP) algorithms. Simulation results showed that the maximum errors of channel power monitoring and OSNR estimation were both less than 1 dB after 20-span WDM transmission. In addition, offline experiments were also carried out and further verified the feasibility of our OPM scheme. This confirms that the optical label based OPM has lower cost and higher efficiency and thereby is of great potential for mass deployment in practical WDM systems.

1. Introduction

With the exponential growth of data traffic due to emerging bandwidth-intensive services and internet applications such as HD video streaming, cloud computing, automatic driving, 5G and other emerging applications, the optical fiber communication capacity is gradually approaching the Shannon limit [1]. Optical transport endowed with higher bit rates and better network resource utilization is an inevitable step to comply with the demand of ever-increasing capacity. Accordingly, large-capacity and long-haul WDM systems equipped with reconfigurable optical add-drop multiplexers (ROADMs) based on wavelength selective switches (WSSs) have been widely deployed in metro and backbone optical networks. The application of ROADMs could improve the flexibility and efficiency of the WDM system significantly, but the optical network would become larger and larger in scale, more and more complex in topology and dynamic in connection at the same time [2]. Therefore, to ensure its working stability and operation efficiency, low-cost and highly reliable multi-channel OPM technology is indispensable, and therefore, it is attracting a lot of attention. Especially the optical power and OSNR of each WDM channel, as key channel performance indicators, are the most important and meaningful parameters that need to be accurately monitored/estimated [3,4]. In addition, wavelength connection monitoring enables network operators to quickly discover incorrect connections caused by manual and/or software configuration errors, avoiding manual searching and recognizing, which is often time-consuming and labored. In addition, if the OPM can monitor the node location (hereinafter called “node ID”) where the service signal is initially added and obtain specific surveillance information (such as symbol rate, modulation format, route configuration, etc., hereinafter called “wavelength ID”), it will be beneficial to the efficient management and optimization of WDM optical networks. However, the majority of critical monitoring modules of existing solutions, such as the conventional method using optical spectral analysis by spectrometer or optical filter, are generally too expensive, operationally inconvenient, have poor timeliness, and their functionally is limited to applied in performance monitoring of all channels over a WDM system with numerous nodes [5].
The existing mainstream monitoring schemes mainly take advantage of direct-or coherent detection of high-speed service signal and use DSP algorithms to monitor the performance of WDM channels. The monitoring technology based on direct detection without optical filters usually works at the receiver end, which divides a small part (less than 5%) of the service’s optical signal for direct detection, and it analyzes the characteristics of the received signal by DSP algorithms to obtain the channel performance in a low-cost way [6,7]. However, most of the existing monitoring schemes based on direct detection inherently lose more information about the channel characteristics, and the accuracy of the monitoring is greatly reduced while the correctness of the wavelength connection also cannot be realized. On the other hand, optical filter-based monitoring technology can coherently acquire spectral information in the channel or a wavelength range through a tunable filter or diffraction grating spectrometer. In addition, due to the natural wavelength selectivity of coherent detection, the analysis of spectral information, optical power, modulation format, OSNR and other monitoring information has high recognition resolution and monitoring dynamic range [8]. However, it requires expensive narrow linewidth tunable lasers, and thereby it is difficult to apply in WDM networks due to its high cost, complex structure and one-by-one channel monitoring restrictions. Moreover, most of the existing monitoring solutions based on machine learning (ML) need to preprocess the high-speed sampling sequence with the help of DSP at the receiving end and then perform data analysis, processing and feature extraction [9,10]. The ML methods are not only difficult to effectively monitor the correctness of wavelength connections but also have higher implementation complexity than conventional DSP methods and require a large amount of data set training, parameter tuning and model generalization in advance [11]. Consequently, for a WDM network with large scale, complex structure and continuous network topology expansion, the OPM technology still presents a prominent contradiction between monitoring capability and implementation cost.
To solve these problems, OPM schemes based on optical labels have been proposed and investigated [12,13,14,15,16,17,18,19,20]. The typical monitoring technology based on optical label mainly adopts a pilot tone modulation to generate a low-speed label signal corresponding to the target channel, where the pilot-tone-carried label signal is loaded on the service optical signal as optical labels. At monitoring nodes, a low bandwidth direct-detection photodetector (PD) followed by the analog-to-digital converter (ADC) acquires the label signal of all wavelength channels simultaneously. The bandwidth of PD is usually at hundred-MHz order while the sampling rate of ADC is about hundred-MSa/s that is enough to demodulate the labels with relatively low cost. Theoretically, the optical labels are tied up to their corresponding optical channels anywhere in the network, and the node ID as well as wavelength ID can be flexibly loaded as optical labels; it can not only monitor the wavelength channel performance but also can reliably deliver any interested surveillance information of each channel to further sense the working state and optimize resource utilization of WDM networks.
However, when oriented to practical applications, there are still many problems in the existing solutions. On the one hand, the OPM techniques based on only pure pilot tones in [14,15,16] have a trade-off problem of two negative effects of stimulated Raman scattering (SRS) and chromatic dispersion. When the low frequency pilot tone is used, it will have severe SRS effects that need to be combated by dividing the whole wavelength channels into several sub-channels with the assistance of expensive optical filter. In contrast, when high-frequency pilot tones are used, the large CD caused by long-distance fiber transmission will cause severe power fading of the pilot tones, thereby significantly degrading the monitoring performance. On the other hand, the optical labelling scheme based on subcarrier index modulation (SIM) reported in [17,18,19,20] has the advantage of efficient demodulation of optical labelling signals. Nevertheless, since it adopts the SIM scheme for optical labels, not only the modulation and demodulation require large-size (16,384 points in [18]) inverse fast Fourier transform (IFFT) and fast Fourier transform (FFT), respectively, which results in very high circuit realization complexity, but also it is difficult to monitor channel optical power due to the SRS effect, and likewise, it is hard to flexibly adjust the transmission rate of label signals. In our previous work, we used pilot tones of a few MHz and demonstrated a scheme that could suppress the SRS effect on optical power monitoring based on our proposed SRS mitigation algorithm [21]. However, a scheme using such low frequency (several MHz) pilot tone has a serious SRS effect, and the monitoring performance is still difficult to guarantee even using the SRS mitigation algorithms [22,23].
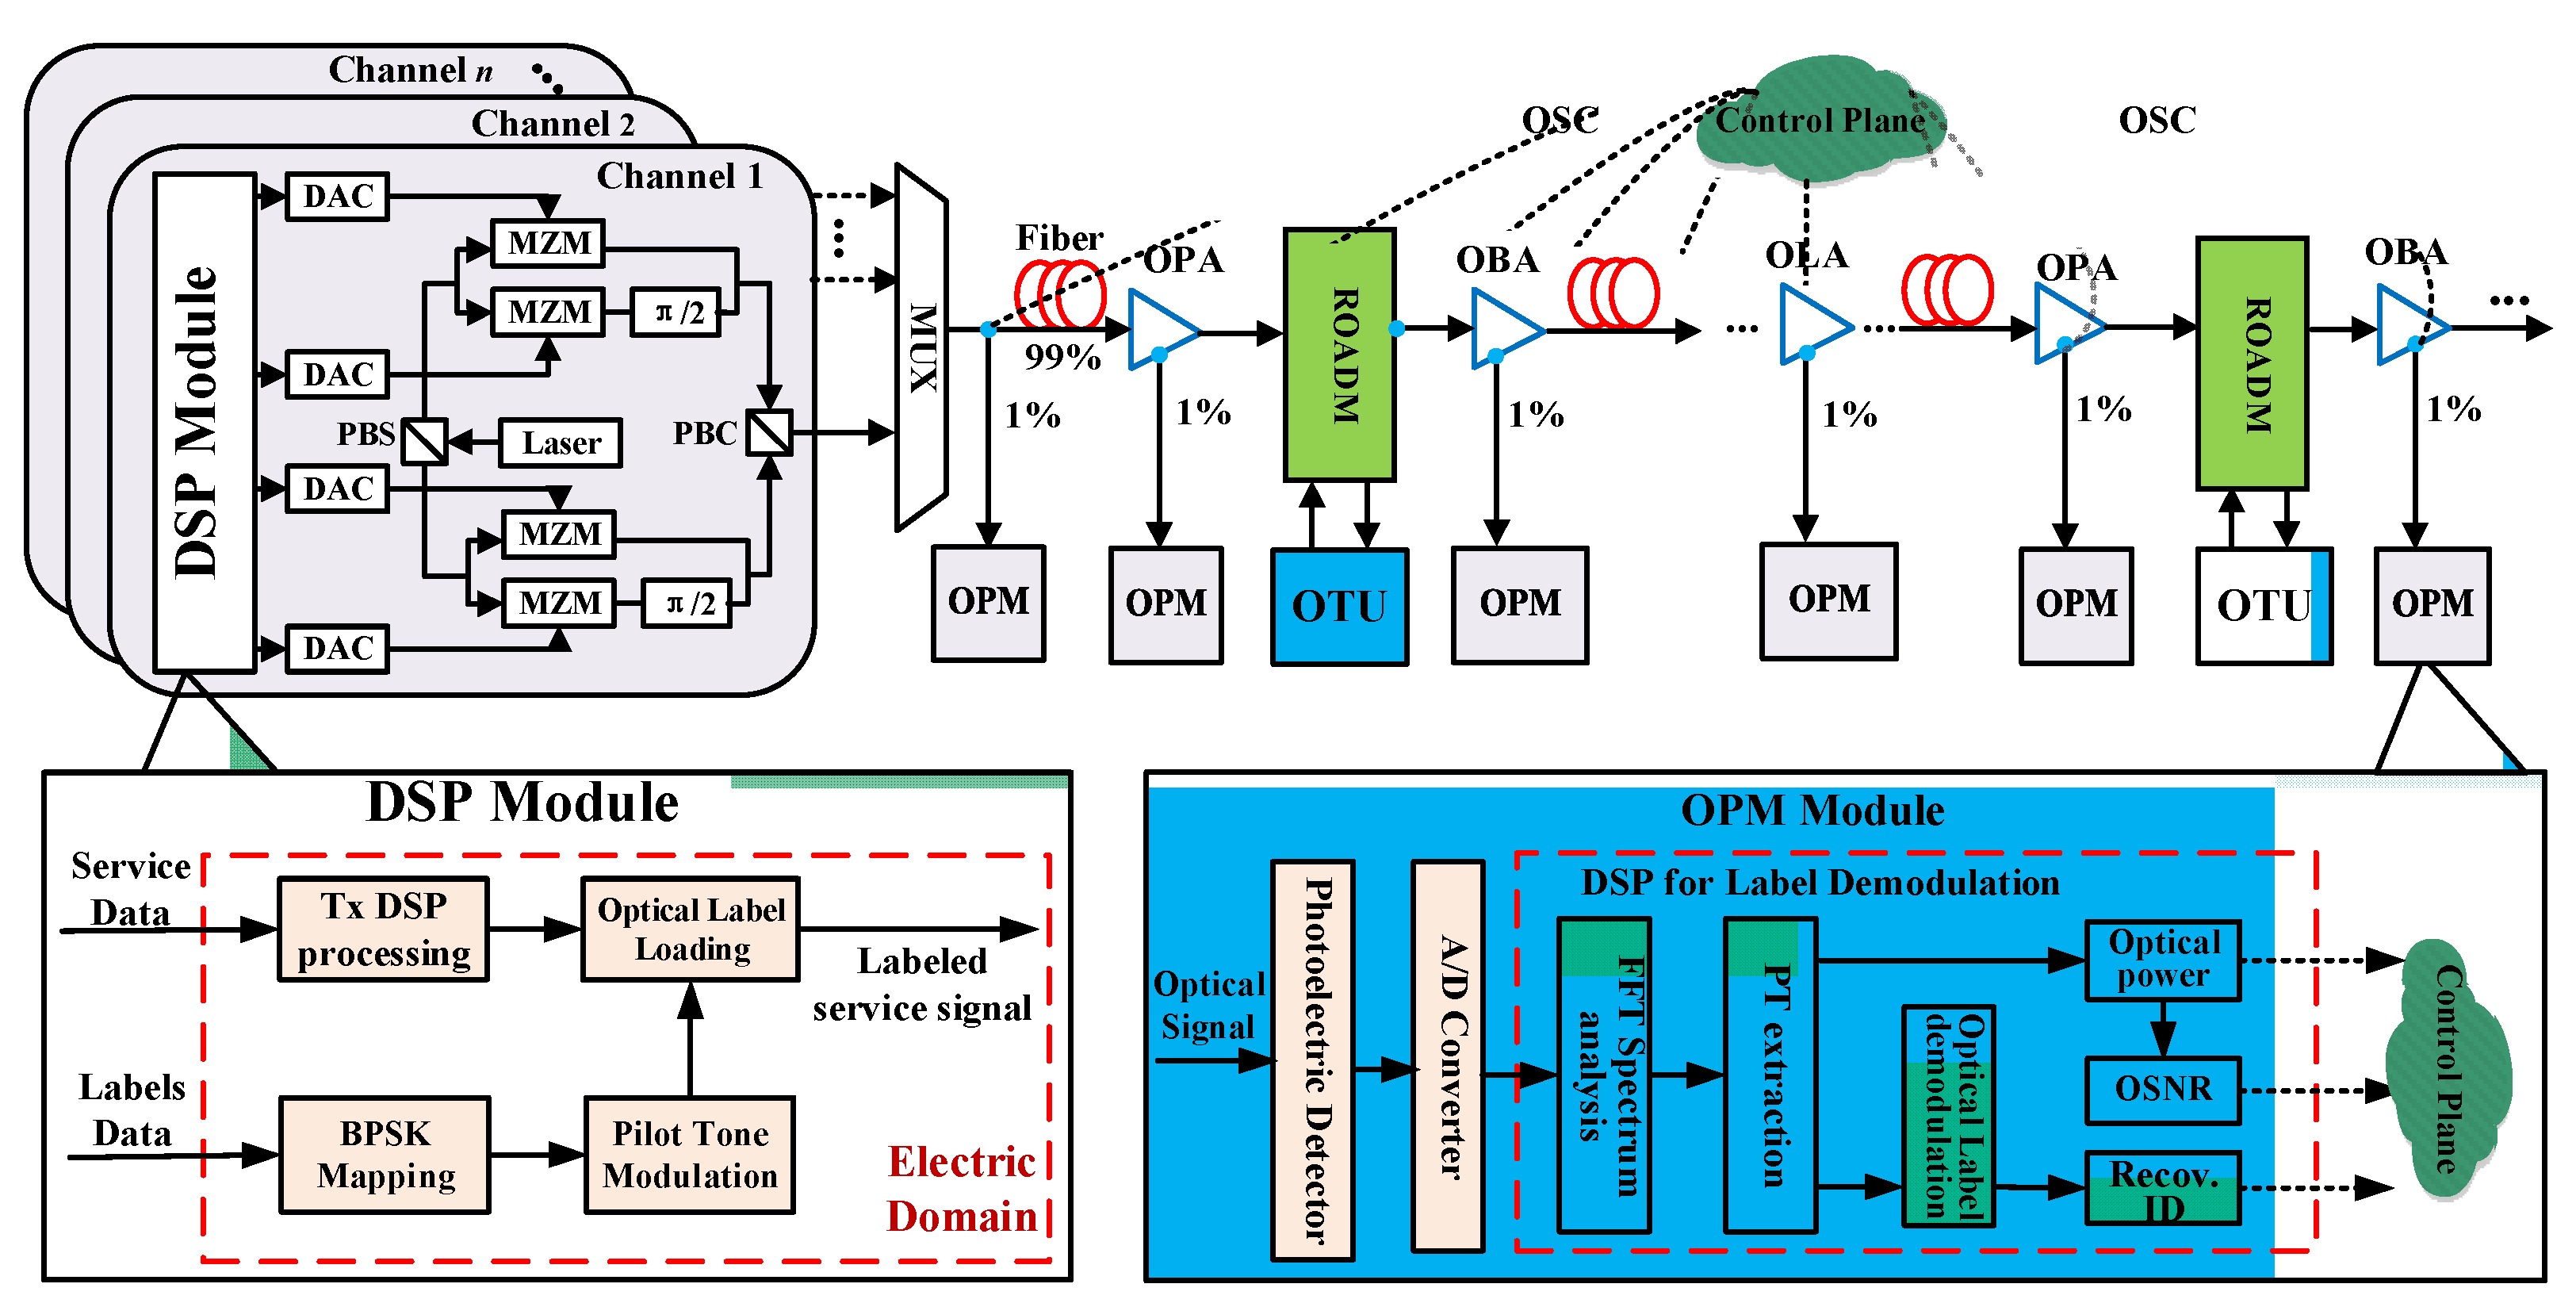
In this paper, we present our recent research activities and progress on optical-label enabled OPM, and a low cost and high efficiency multi-channel optical power monitoring and OSNR estimation scheme based on differential phase shift keying (DPSK) digital optical labels is proposed and demonstrated. The proposed scheme innovatively adopts the service transmitter to flexibly load the time-domain digital label signal modulated on unique pilot tone that arranged for the corresponding wavelength channel, without additional digital to analog converter (DAC) or customized optical modulator, and without complex IFFT operation. The pilot tones have a frequency of tens of MHz that is modulated by low-speed (~K Baud) digital label information, i.e., the node ID, wavelength ID and so no. The channel optical power is monitored using the method of spectral integration, and the OSNR is estimated by calculating the amplified spontaneous emission (ASE) noise accumulation that contributed by all amplifiers. To verify the proposed scheme, we have performed simulations on WDM systems within 20 spans of fiber transmission, and the results show that the maximum error of power monitoring is less than 0.9 dB while the error of OSNR estimation is also less than 1 dB. Therefore, compared with the conventional optical filter-based OPM technology, the implementation of the proposed scheme is of lower cost and higher efficiency, which has great potential for large-scale deployment in practical WDM networks.

2. Principle of the Optical-Label Enabled OPM Scheme

The optical label is known as a top modulation or a small amount of amplitude modulation, also called low-frequency perturbation or pilot tones in some studies. The schematic diagram of the scheme is shown in Figure 1. After the digital surveillance information of node ID and wavelength ID of each wavelength channel is mapped by DPSK coding, it is modulated (~K Baud rate) to the pilot tone with a specific frequency to be the final optical label. It is noteworthy that the pilot tone frequency is larger than 40 MHz to avoid the impact of SRS crosstalk [24]. Thus, the power monitoring error caused by the SRS, resulting in the non-correspondence between the label power and the channel power, can be reasonably ignored.

2.1. Optical Labels Loading and Detection

At the transmitter side in Figure 1, wavelength channel 1 is taken as an example to introduce the process of label generation and modulation. In the transmitter-side DSP module, the label data are first mapped into BPSK symbols and then modulated onto pilot tones with a specific frequency to generate label signals. The label signals are subsequently loaded into the high-speed service signal in the electrical domain and thus generate a labeled service signal. It is then converted to analog signal by the DAC and drives the optical I/Q modulator to generate a labeled optical signal. Here, the DAC is the one used by the high-speed service itself, not an additional one. When arriving at optical pre-amplifier (OPA) or optical boost amplifier (OBA) in a service node, or optical line amplifier (OLA) in relay node, the received signal is divided into two parts. Thus, 99% power of the signal is used for the coherent detection of service optical signal, and 1% power of signal is used for performance monitoring and optical label demodulation. The 1% power of signal is sent into a PD to achieve optical-to-electrical conversion. The electrical signal is then converted to a digital signal by an analog-digital converter (ADC). Then, after monitoring the optical power and OSNR estimation, the node ID and wavelength ID are recovered. Finally, the monitoring results of channel optical power, OSNR and node/wavelength ID are transmitted to the control plane through optical supervising channel (OSC), and the control plane thus could not only check the route, symbol rate, modulation format and so on of each wavelength channel, but also analyze the performance of the whole WDM optical network comprehensively.
In a typical WDM system, one fiber carries the high-speed service signals of 80 wavelength channels, so different frequency PT with digital labels are modulated on corresponding wavelength channels where the same label signals are modulated on two polarizations to improve the received signal-to-noise ratio (SNR) of optical labels. For instance, the labels with PT frequency of f1 are assigned to the service optical signal on wavelength channel 1 of λ1, and the rest can be done in the same manner so that the digital band-pass filter in the OPM module could extract corresponding digital labels on the PT with different frequencies. The optical field of the dual polarization optical signals with amplitude-modulated optical labels can be expressed as follows:
E i n , x , i = A x , i ( t ) · exp { j ( 2 π f o , i t + θ x , i ( t ) ) } · [ 1 + m · cos ( 2 π f i t ) · D i ( t ) ]
E i n , y , i = A y , i ( t ) · exp { j ( 2 π f o , i t + θ y , i ( t ) ) } · [ 1 + m · cos ( 2 π f i t ) · D i ( t ) ]
where E i n , x y , i represents the electric field of x/y polarization on the i-th channel, x and y represent two polarizations, n represents the serial number of the wavelength channel where it is located. A x , i ( t ) · exp { j ( 2 π f o , i t + θ x , i ( t ) ) } represents the service date signal, where A x , i ( t ) is the amplitude, f o , i is the center wavelength of i-th channel, θ x , i ( t ) is the phase of service signals.   cos ( 2 π f i t ) · D i ( t ) is the optical label, where m represents the modulation depth of optical labels and f i is the frequency of the corresponding pilot tone. It is noteworthy that the square root form of the optical label modulation on the service signal is used to facilitate analysis of label reception during square-law detection using the PD module. When it comes to the detection of optical labels in an OPM module, 1% of the optical power component is isolated and inputted into the OPM module. Direct-detection low bandwidth PD and low sample-rate ADC are used to realize the photoelectric conversion and digital sampling of the optical labels of all wavelength channels simultaneously. The PD detection can be expressed with the following equations.
I = i = 1 n [ | E i n , x , i | 2 + | E i n , y , i | 2 ] = i = 1 n { [ A x , i 2 ( t ) + A y , i 2 ( t ) ] · [ 1 + m · cos ( 2 π f i t ) · D i ( t ) ] }
where I represents the signal after PD square-law detection. The signal contains all the optical labels of each channel. n represents the number of PT. Here, the spectrum of optical labels is obtained and analyzed by the FFT algorithm, which is an important step for optical labels-based power monitoring. Afterward, since the digital labels are loaded by different frequency PT on different wavelength channels, digital band-pass digital filters are used here to separate the labels on different channels. Finally, differential demodulation methods are used to realize demodulation of the DPSK-based optical labels and recover the ID information. The filtered optical labels (digital labels on PT) of the i-th channel can be expressed as
I i = [ A x , i 2 ( t ) + A y , i 2 ( t ) ] · m cos ( 2 π f i t ) · D i ( t ) = A i ( t ) · m cos ( 2 π f i t ) · D i ( t )
where A i ( t ) equals [ A x , i 2 ( t ) + A y , i 2 ( t ) ] , representing the optical label amplitude of the i-th channel after PD reception.

2.2. Channel Optical Power Monitoring

It is obvious that there is a linear proportional relationship between the channel’s optical power of the service signal and the detected power of the optical labels. In addition, the integral value of the received spectrum of optical labels for a wavelength channel could represent the detected power of optical labels on the channel based on pre-tested conversion coefficients. These relationships can be expressed using Equation (5).
  P c h , i =   P L a b e l , i   m · α · f ( V P D )
where   P c h , i   and   P L a b e l , i   represent the actual optical power of the i-th channel and the corresponding monitored optical label power respectively. m represents the modulation depth of the optical label.   f ( V P D )   represents the calibration coefficient of the PD module, and it depends on the photoelectric conversion characteristics of the PD itself and the feature of the optical labels. α represents the splitting ratio of the optical coupler (OC). Typically, a 1:99 (α = 1%) OC is used in our scheme to divide the labeled optical signal into OPM module.
After photoelectric conversion and digital sampling by a PD and ADC, a DSP unit is used to calculate the channel optical power. Firstly, FFT is used to obtain the spectrum of optical label, and the reception spectrum of an 80-channel WDM using 0.1 MSa/s digital labels is shown in Figure 2. It is shown that the PT frequency range of 40–55.8 MHz with 0.2 MHz grid between neighbor channels is adopted. Then, spectrum integration of each optical label spectrum from the beginning PT frequency to the ending PT frequency is carried out, respectively. For example, the channel-1 power is equal to the spectrum integration value from [39.9–40.1] MHz range. Next, a proportional coefficient of photoelectric conversion of PD is used to calculate the final channel optical power of the service signal. Finally, the monitoring results of all network monitoring nodes are transmitted to the control plane through optical supervising channel (OSC), and the control plane analyzes the performance of the whole optical network and optimizes resource utilization comprehensively.

2.3. OSNR Estimation

The scheme diagram of OSNR estimation is also shown in OPM Module in Figure 1. In a multi-span WDM transmission system, OSNR will gradually deteriorate due to the accumulation of ASE noise generated by the EDFA. Therefore, the OSNR could be estimated by calculating the ASE noise accumulation. In a practical, optical transmission system, the actual gain of the amplifier may be different from the configured gain, so we can calculate the actual current working gain of each optical amplifier with the help of the optical power monitored by the optical labels. At the same time, because the noise figure of optical amplifier changes with different wavelengths, here we can obtain the value of the noise figure (NF) pattern by measuring it in advance. Finally, according to the EDFA amplification of each wavelength channel, the overall amplification case of each wavelength can be obtained. Thus, based on the EDFA amplification and ASE noise accumulation of each wavelength channel, the OSNR can be estimated by the 58-Formula.
The detailed principle of OSNR estimation is as follows. For each optical amplifier in the network, its ASE noise could be expressed as [25]:
ASE ( dBm ) = 10 · log [ ( h ν ) ( B o ) ] + N F ( dB ) + G ( dB ) = 58 ( dBm ) + N F ( dB ) + G ( dB )  
where h ν represents the energy of a single photon,   B o represents the reference bandwidth of OSNR which is 12.5 GHz. The NF represents the noise figure of optical amplifier. G represents the actual gain of optical amplifier which is calculated using the results of optical power monitoring. When the service signal is transmitted through a series of amplifiers, the ASE noise will be added linearly. At this time, on the service transmission link, the ASE noise accumulation by the i-th amplifier in j-th channel can be expressed as:
ASE s u m _ n , j ( dBm ) = 10 · log i = 1 n 10 58 ( dBm ) + N F n , i ( dB ) + P o u t n , i ( dBm ) P i n n , i ( dBm ) 10  
where the P o u t n , i a and   P i n n , i represent the output-power and input-power of n-th amplifier in i-th channel, respectively. Finally, the OSNR of each channel can be estimated by Equation (8).
O S N R n , i ( dB ) = P o u t n , i ( dBm ) A SE s u m _ n , i ( dBm )

2.4. CAPEX Analysis

Capital expenditure (CAPEX) is an important issue in optical network monitoring. How to monitor optical network with low cost and high efficiency has become the goal pursued by mainstream manufacturers and operators. We conduct a detailed cost analysis of the proposed scheme and two typical existing schemes. We compare the CAPEX of OPM schemes based on optical filter (OF) (hereinafter referred to as scheme A) [15], SIM labels (scheme B) [19] and the proposed method (scheme C). We learn the market price from a number of related device/module manufacturers and customers, and the comparison of CAPEX is mainly based on the market price of all devices/modules used in different OPM schemes. It should be noted that because the labeling rate is low, the loading process is simple, and the hardware resources required by the DSP unit are relatively small, so their cost can be reasonably ignored. Here, the cost of OPM over an 80-channels WDM system is taken as an example to compare the CAPEX. The reference cost units of different devices used in the three schemes are shown in Table 1.
Obviously, the proposed OPM scheme adopts only the service transmitter to flexibly load the time-domain digital label signals and uses a PD to detect the optical labels of all channels simultaneously. It is shown in Figure 3 that, compared with scheme A, the proposed scheme greatly reduces the CAPEX by 96% because the variable optical attenuator (VOA) and OF are completely removed. Compared with scheme B, the complex IFFT operation and VOAs are both removed in the proposed scheme, and thereby, the CAPEX is further reduced by 75%. Therefore, it could be concluded that the proposed scheme has the advantages of very low cost and high efficiency, and therefore, it has great potential in WDM network monitoring.

3. Simulation and Discussion

With the help of VPI TransmissionMaker 9.0 created by VPIphotonics (Berlin, Germany) and MATLAB R2020a created by MathWorks (Natick, MA, USA), we have constructed a simulation platform of WDM transmission with OPM module based on DPSK-modulated digital optical labels to investigate the performance of the proposed scheme for channel power monitoring and OSNR estimation. Here we simulate 8, 32 and 64 channels within 20 spans WDM transmission systems. The 2 Mbps rate digital labels modulated by different PTs with 4 MHz grid are arranged to 16 G Baud polarization multiplexing (PM) QPSK and PM-16QAM transmission systems. The center wavelength of service signal is form 193.1–196.25 THz with 50 GHz interval. A photodetector with 300 MHz −3 dB bandwidth and ADC with 600 MSa/s sample rate and 10-bit resolution are used to detect the optical labels in a WDM system. Table 2 shows important simulation parameters. Here we firstly investigate the performance when using different label modulate depth of 0.05, 0.10 and 0.15. The result of optical label demodulation, such as signal noise ratio (SNR) and label power (result of spectrum integral) in QPSK and 16QAM systems, is shown in Table 3.
According to Table 3, we find that the optical label performance in QPSK system is better than that in 16QAM system, and the optical label power basically exhibits a linear relationship as the modulation depth increases. Optical label power and modulation depth m are basically linear, and the label information could be recovered accurately. In addition, the SNR of optical label under different m is sufficient for error-free demodulation.

3.1. Performence of Channel Optical Power Monitoring

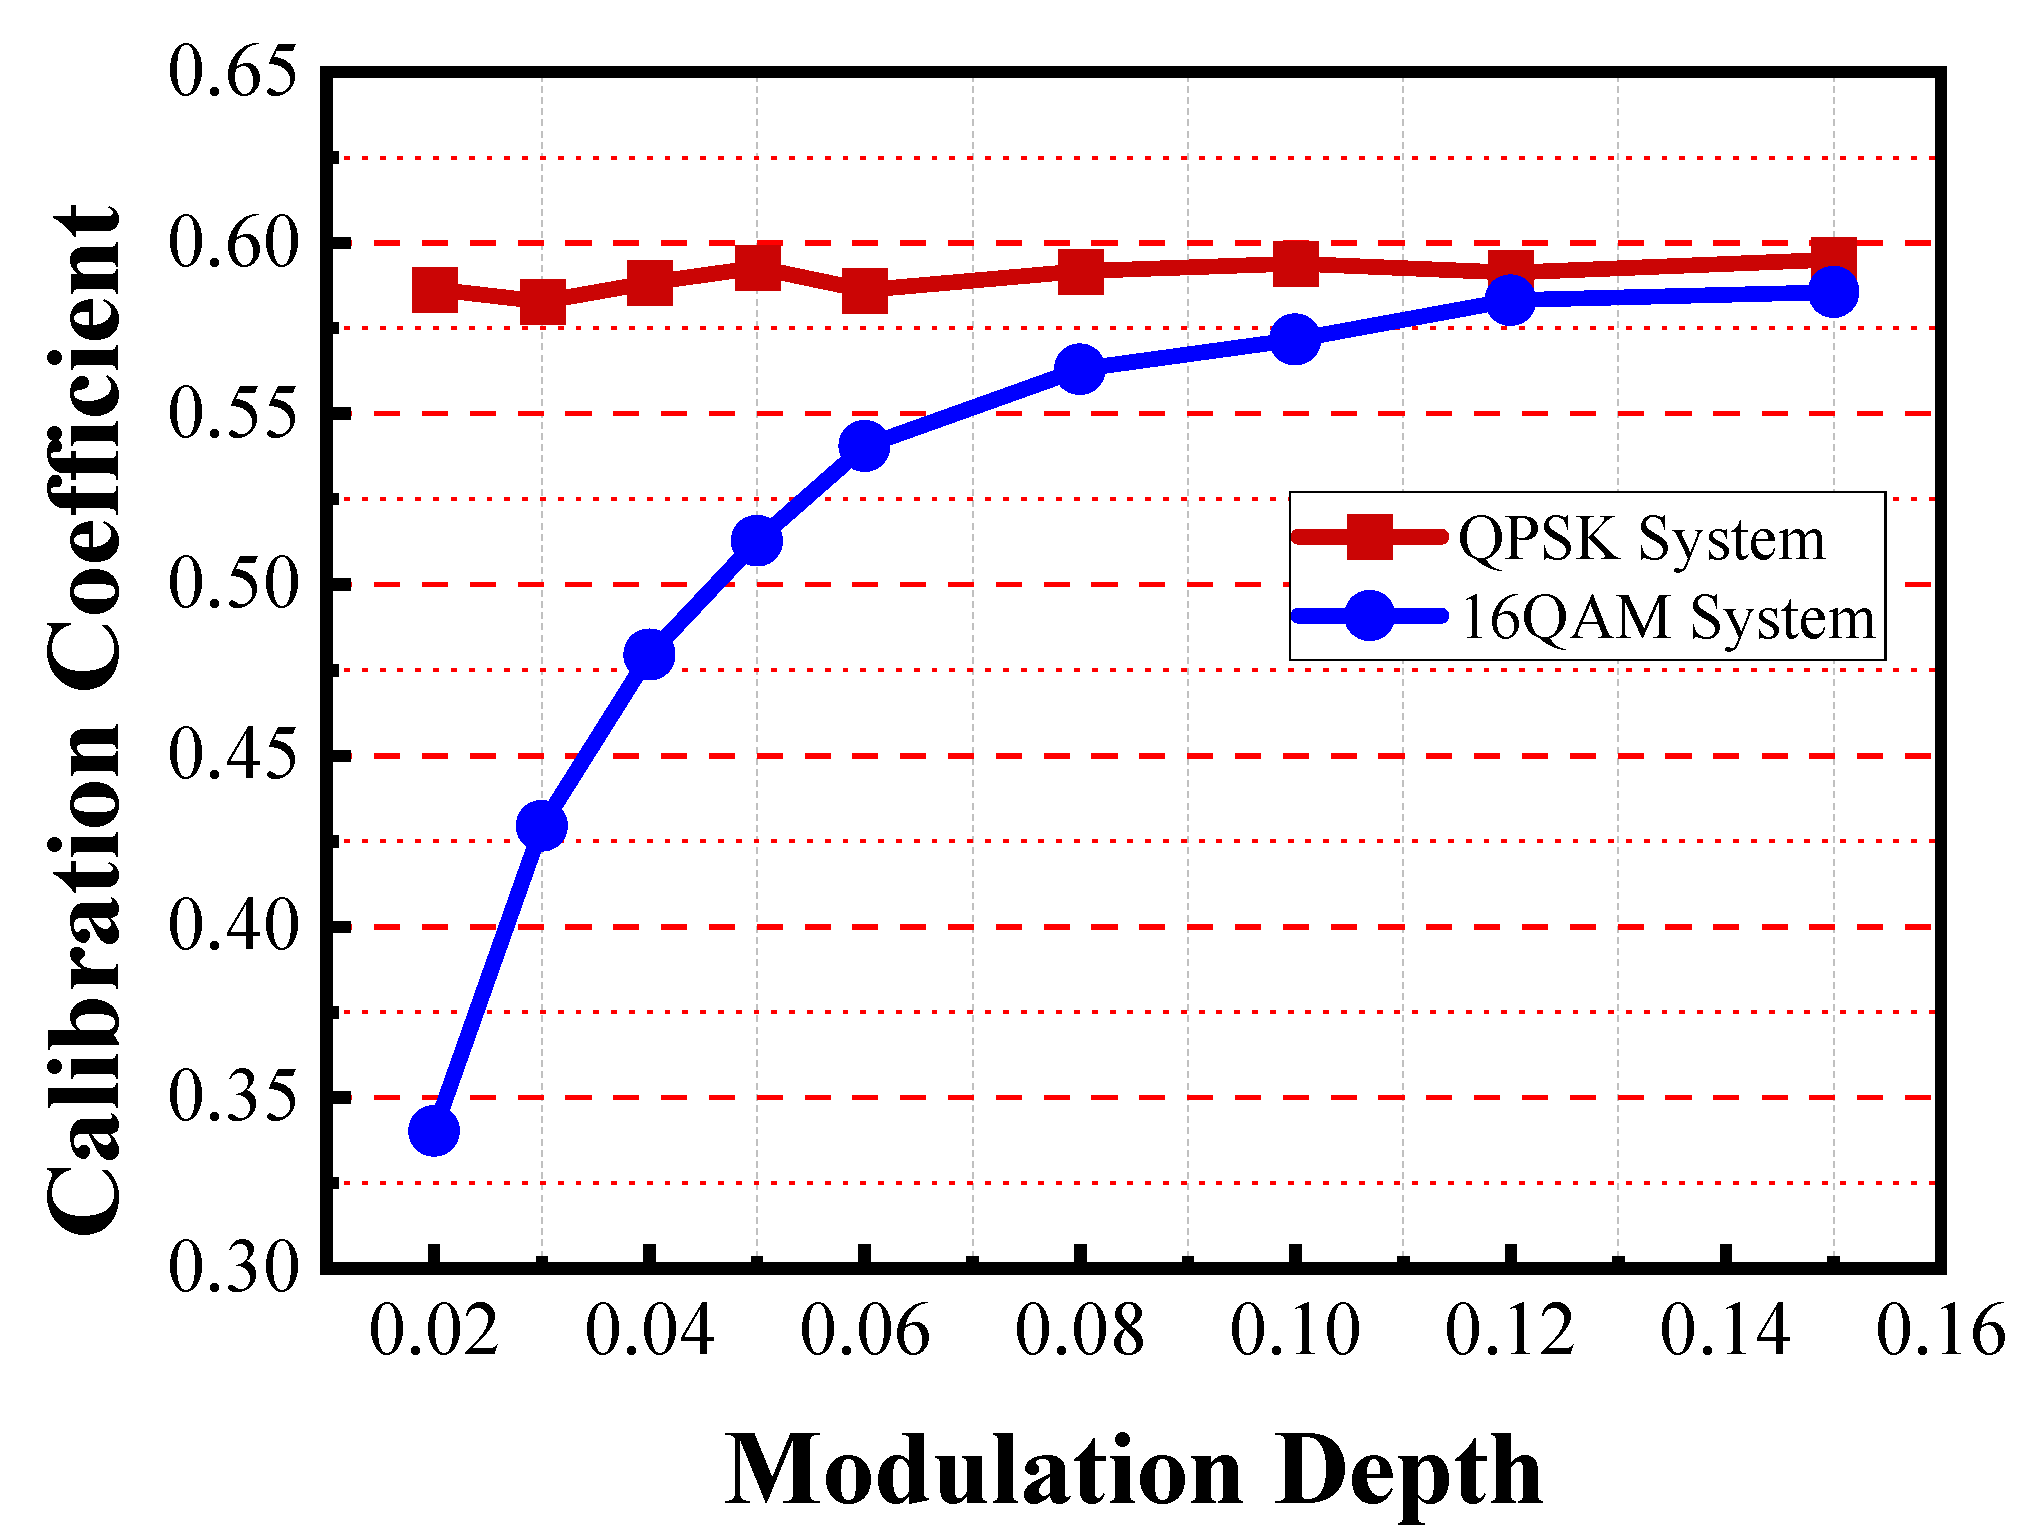
In order to alleviate the influence of the photoelectric conversion characteristics of different PDs and different modulation depths on the accuracy of channel optical power monitoring, we first simulated the curve relationship of the calibration coefficient with the modulation depth in the QPSK/16QAM system. The modulation depth of the QPSK/16QAM system is increased from 2% to 15%. Then, the relationship between the calibration coefficient and the modulation depth is shown in Figure 4.
Figure 3 shows that as the modulation depth increases, the calibration coefficient of the QPSK system is relatively constant with little fluctuation, but it increases first and then gradually becomes constant as the modulation depth increases in the 16QAM system. The main reasons are as follows: For the constant-module QPSK signals, the beat noise generated by PD detection is relatively small, which means that even at a low modulation depth, the noise only accounts for a small part of the entire optical label power and causes little effect on the optical label power. As the modulation depth increases, the optical label power also increases almost linearly. Therefore, the change of modulation depth hardly brings about the change of calibration coefficient.
However, for the 16QAM system with non-constant modulus, larger beat noise will be generated after PD detection. This noise accounts for a ratio of the entire optical label power at low modulation depths, even exceeding that of the digital label signal modulated by the pilot tone. This results in the optical label power being greater than the expected power at the corresponding modulation depth. In the case of monitoring the optical power of the same channel, the calibration factor is small compared with QPSK systems. The PD beat noise is almost constant or slightly increases with increasing modulation depth, but the power value of the pilot-modulated useful digital label increases linearly, resulting in a reduced effect of PD beat noise accompanied by an increase in calibration coefficients. This process gradually flattens out as the power of the digital label signal increases. When the modulation depth is increased to 15%, the effect of the beat noise is small, reaching a situation similar to that of the QPSK system, so the calibration coefficients of the two systems are almost the same at this time.
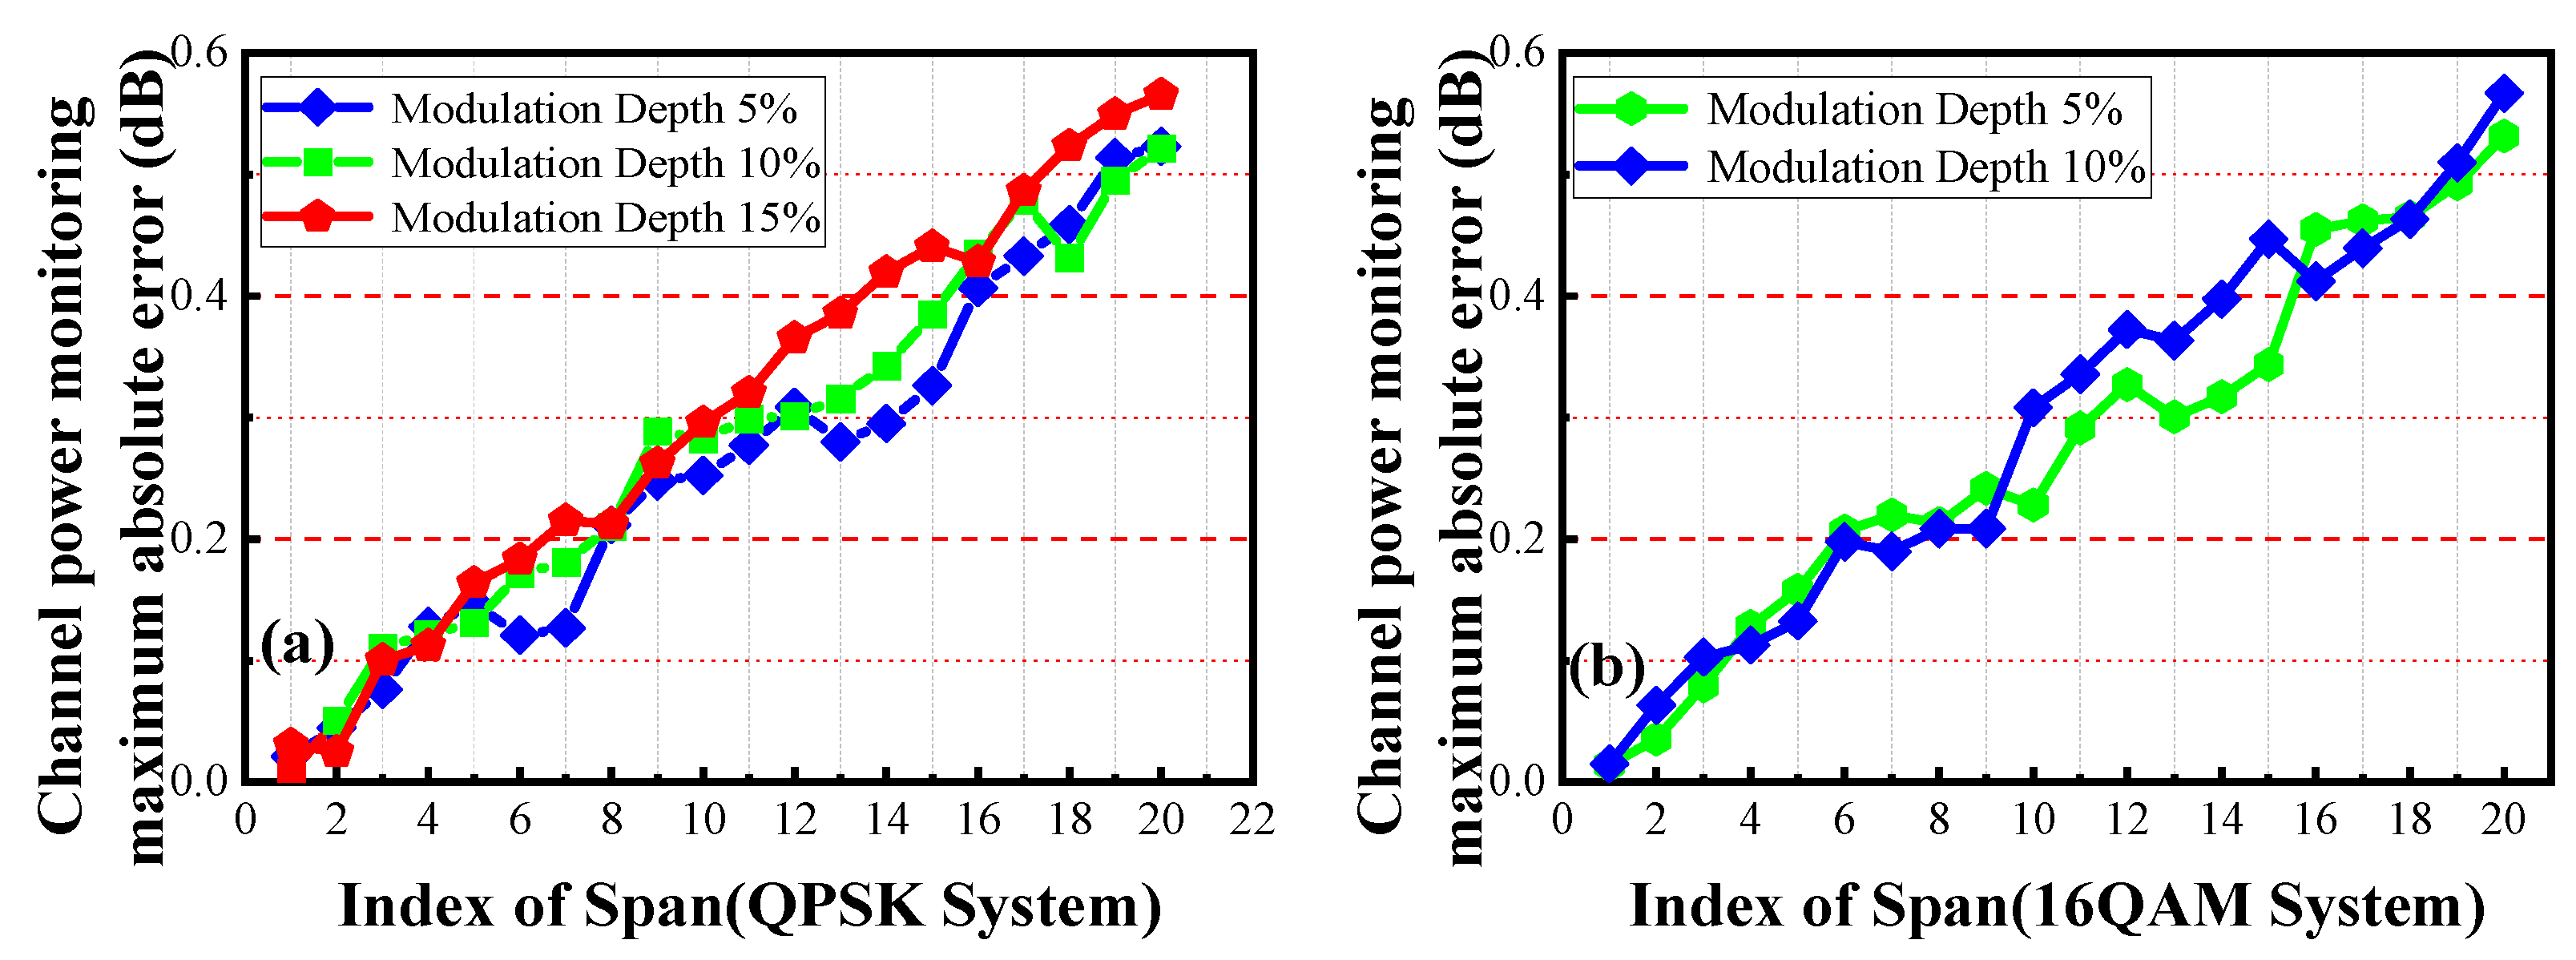
The maximum absolute errors of optical power monitoring at different modulation depths on 16QAM and QPSK systems after 20 spans fiber transmission are shown in Figure 5. It shows that the scheme of optical power monitoring using spectrum integration is feasible, and the maximum channel power monitoring error is less than 0.6 dB. The QPSK and the 16QAM systems exhibit same performance, and the maximum monitoring error is similar at different label modulation depths. Therefore, the monitoring accuracy of two systems can be considered to be roughly the same.
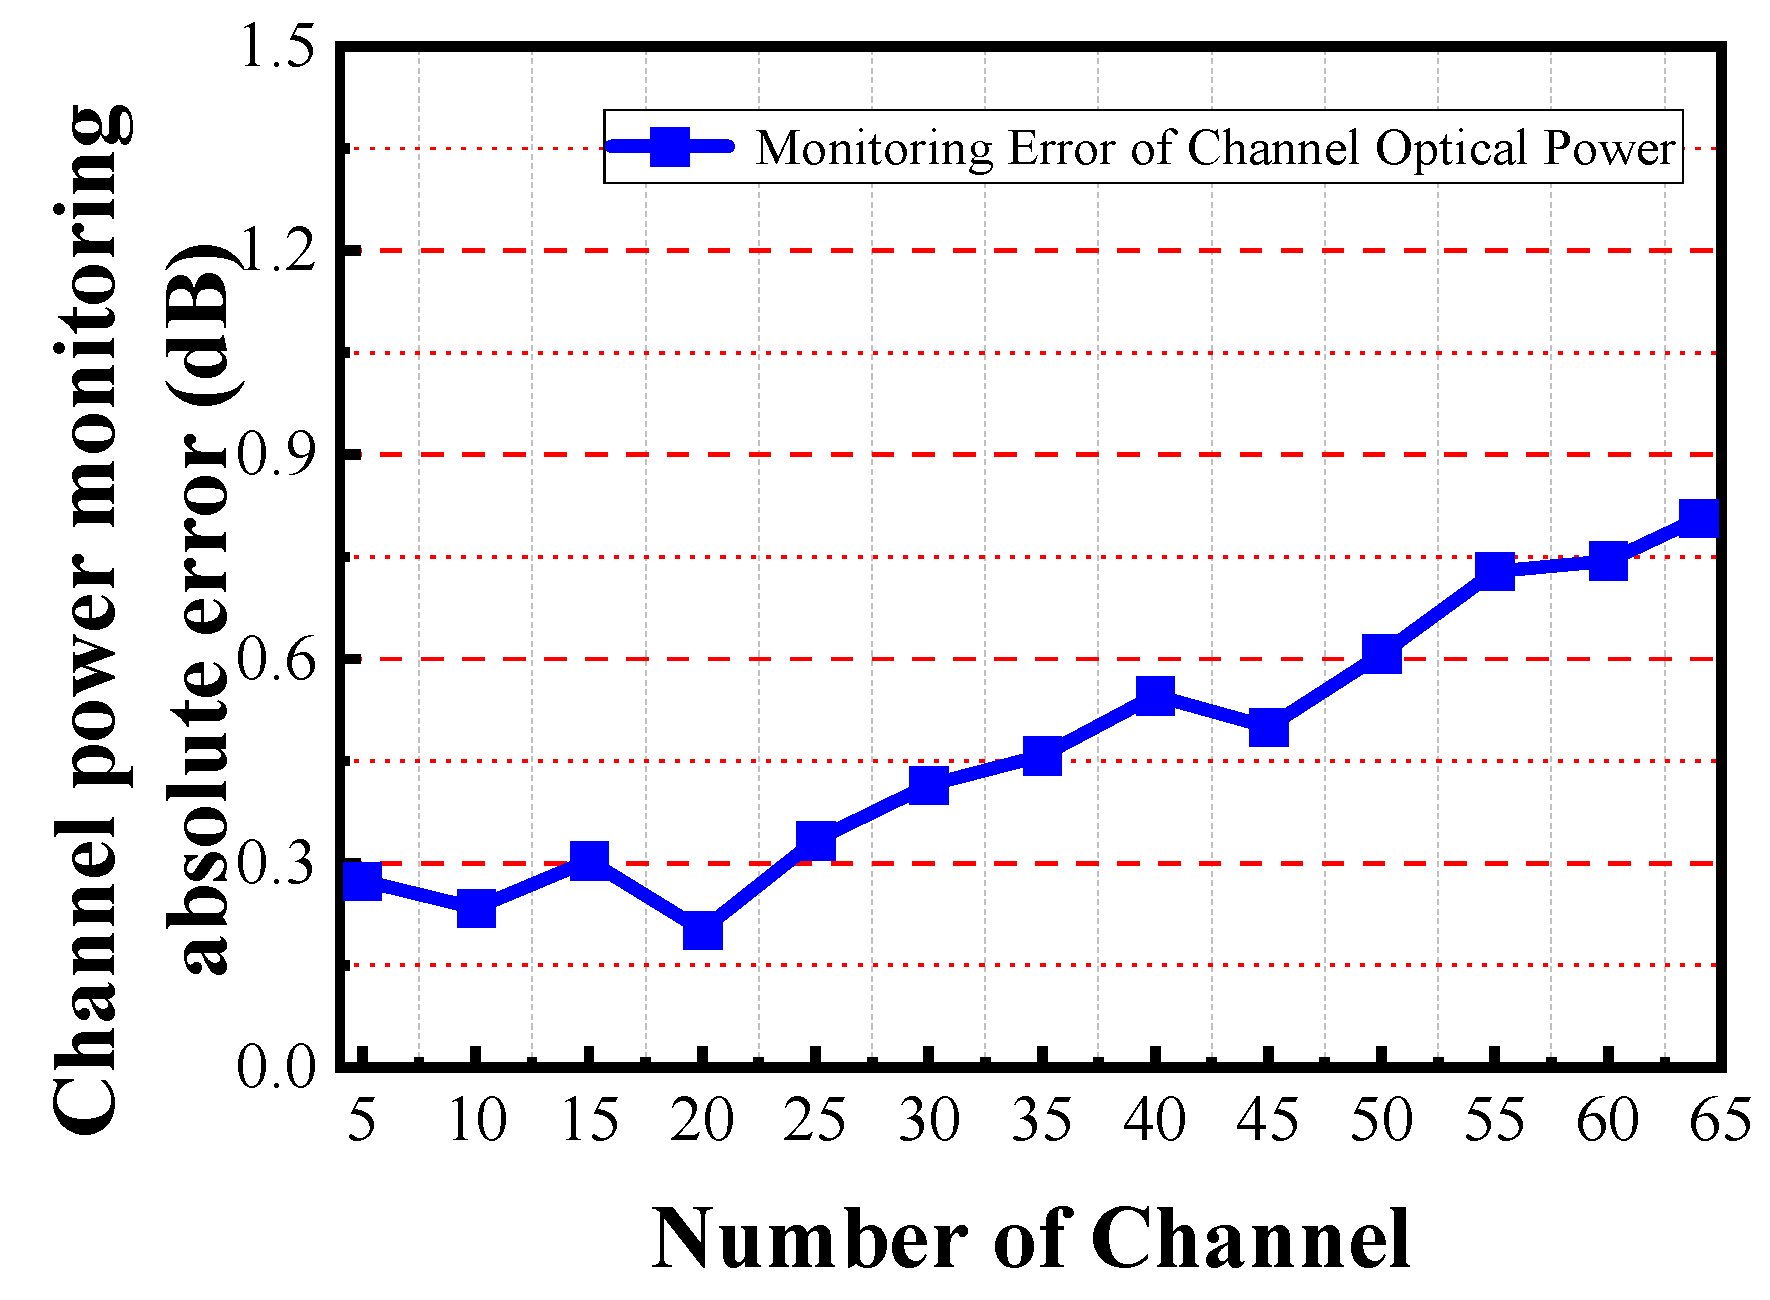
In addition, taking a QPSK system as an example, the impact of channel number on the accuracy of channel power monitoring is also investigated. Here, the optical label modulation depth is fixed to 0.10, while the number of monitoring channels is set from 5 to 64. The monitoring error of channel optical power of different wavelength channel numbers after 20-span transmission is shown in Figure 6.
It can be seen form Figure 6 that when the number of channels is increased from 5 to 64, the monitoring error also increases gradually. The main reason is that as the number of wavelength channels increases, the launch power increases accordingly, and the fiber Kerr nonlinear effect increases, which deteriorates the signal quality of the optical label. In addition, as the number of wavelength channels increases, the spectrum range increases; thus, the inter-channel crosstalk caused by the SRS effect is more serious, and consequently, it will also lead to deterioration of accuracy of optical power monitoring. Moreover, we can see that the monitoring errors fluctuate in a relatively small range. This is because in each simulation with different channel numbers, the optical label sequence is randomly generated, and the random change of the label sequence characteristics causes the monitoring results to fluctuate slightly. In general, although there is a rising trend in the error of channel power monitoring, the maximum monitoring error after 20-span transmission does not exceed 0.9 dB, so it is believed that our proposed scheme is applicable to WDM optical networks.

3.2. Performence of OSNR Estimation

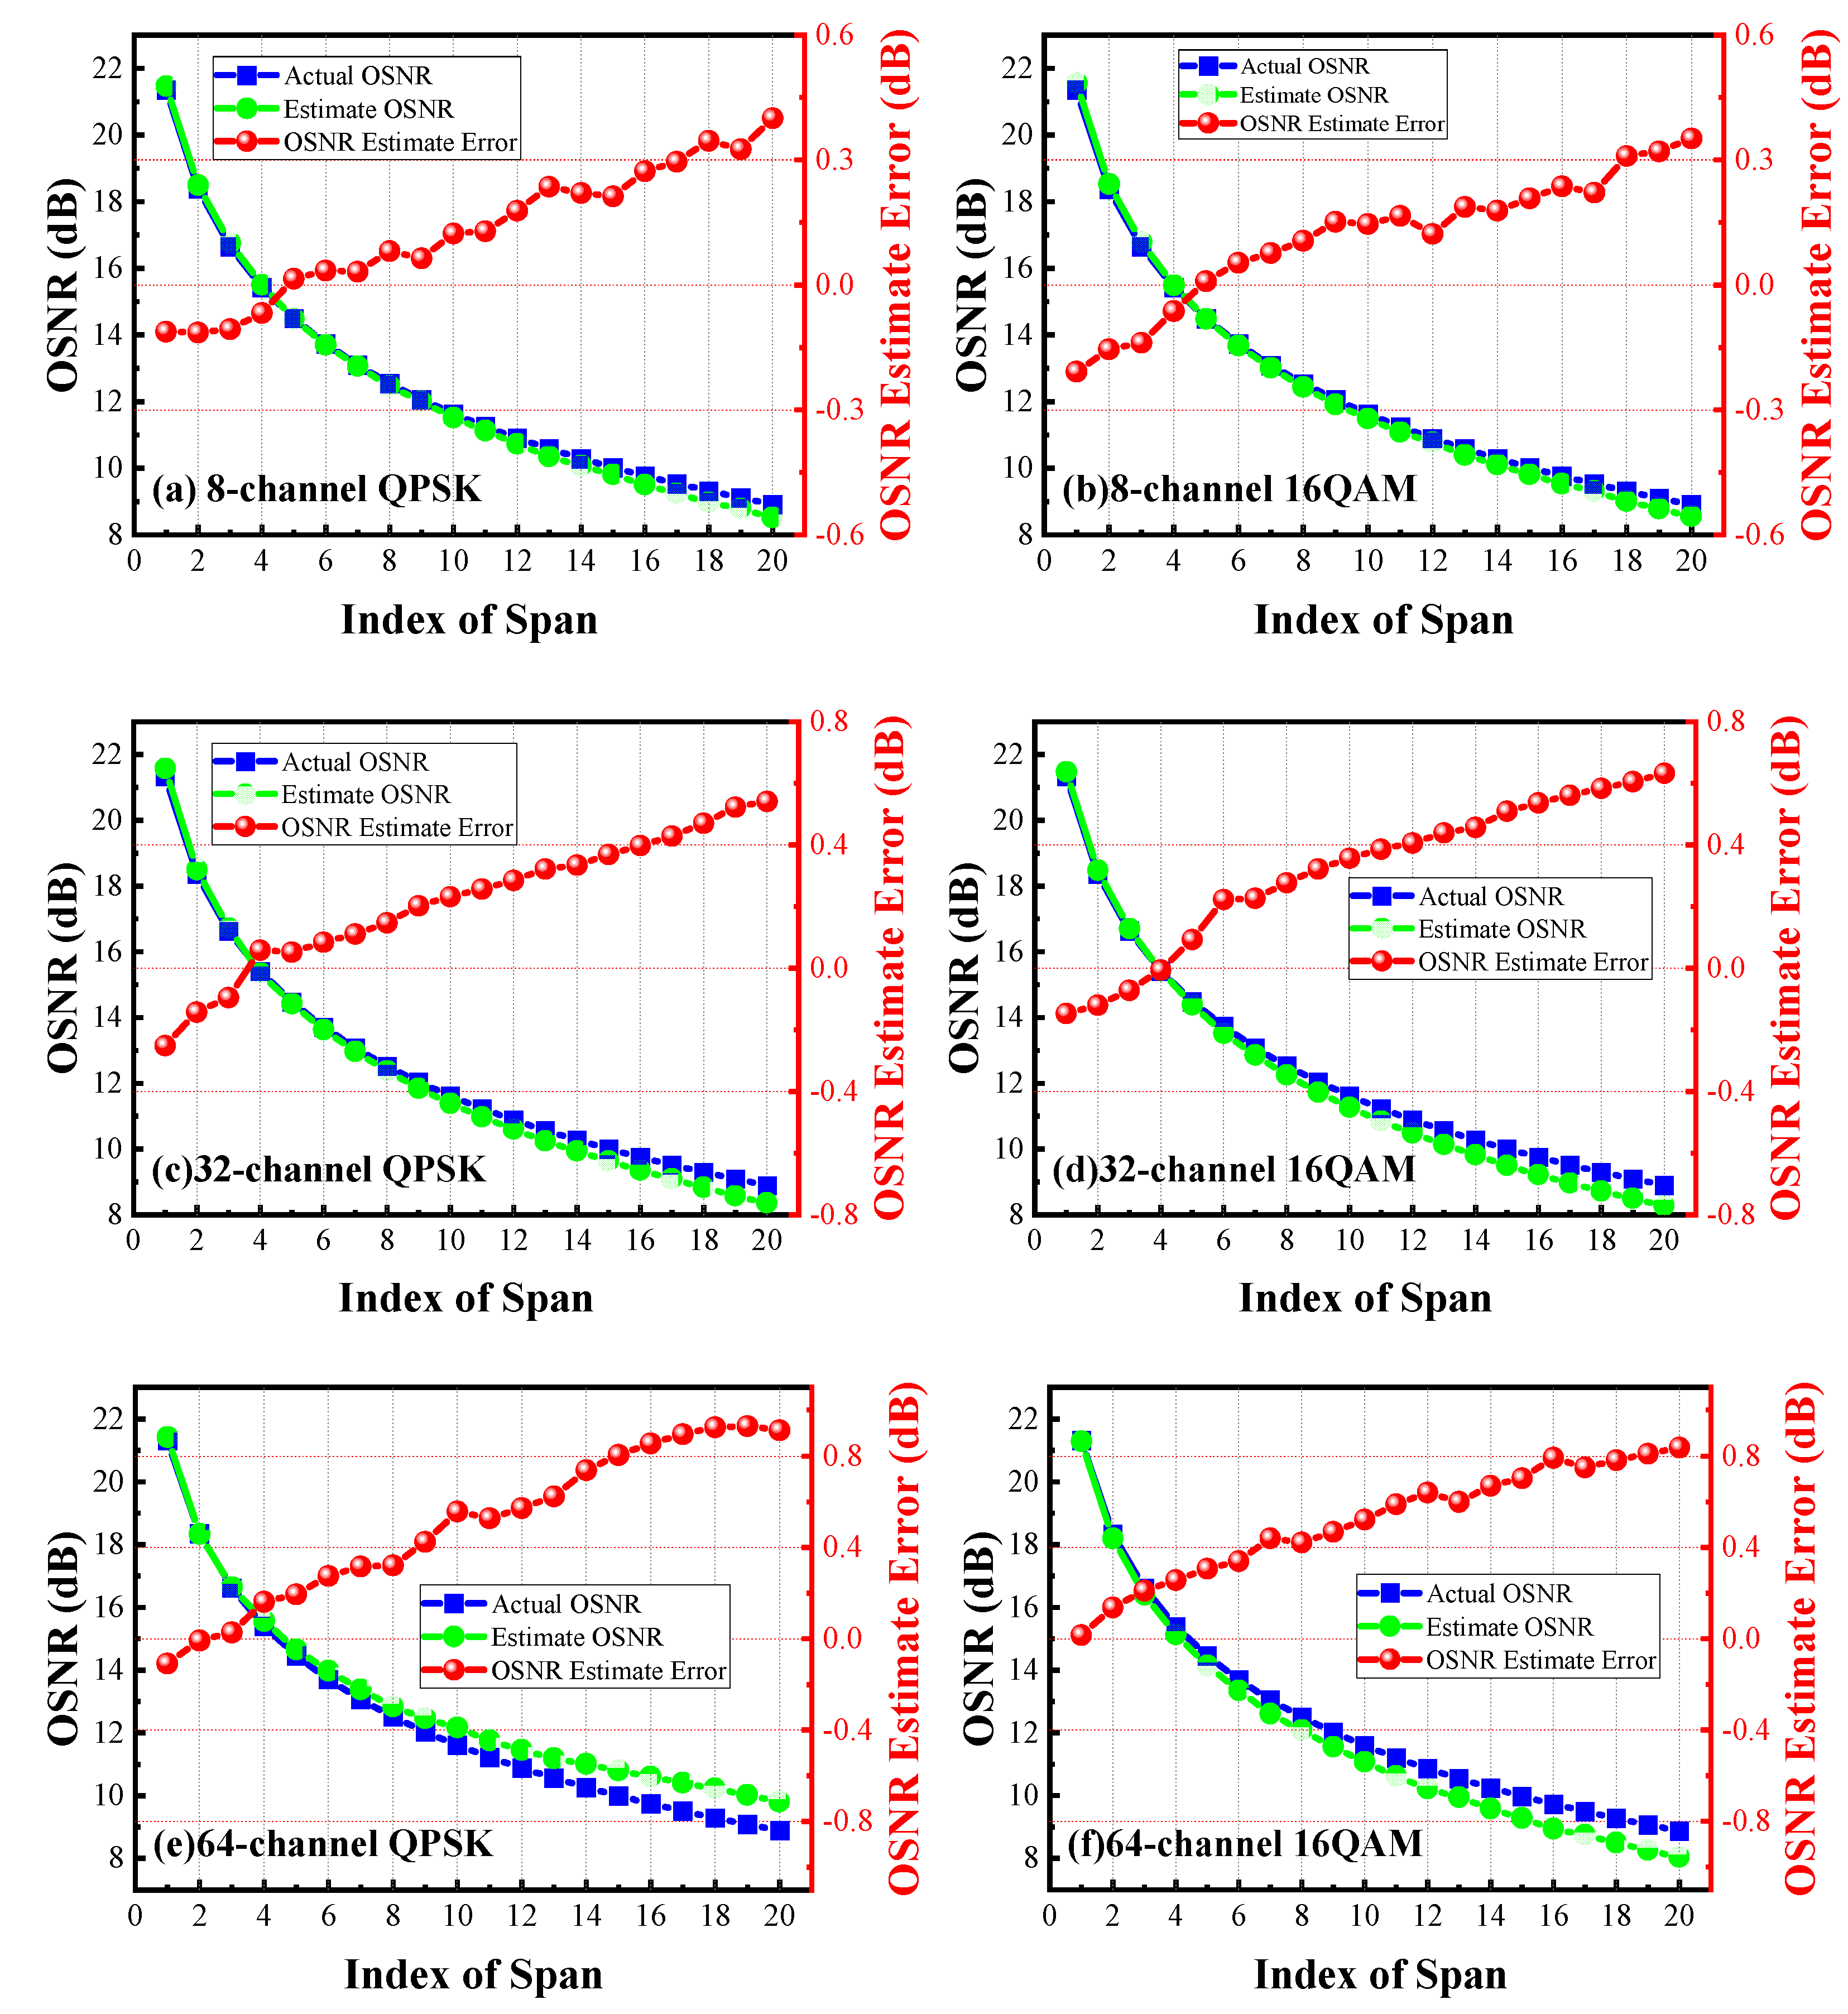
In order to validate the performance of OSNR estimation practically, the NF value of EDFA in each optical channel is set to 5 dB, typically. Meanwhile, the length of each span is identically set to 100 km in 20-span transmission. The input power and output power of EDFAs are monitored based on optical labels, and the OSNR in each channel is calculated by using the proposed method. Then, 16 G Baud PM-16QAM and PM-QPSK 8, 32 and 64 channels WDM transmission simulations are carried out. The result of OSNR estimation as well as the estimate error after 20-span transmission are shown in Figure 7.
Figure 7 shows that the scheme of OSNR estimation is feasible because that OSNR could be estimated accurately in each span both in 8/32/64-channels QPSK and 16QAM systems. It shows that the OSNR monitoring error after 20 span transmissions is less than 0.45 dB in both 8-channel PM-QPSK/16QAM systems, while it is about 0.7 dB in 32-channel PM-QPSK/16QAM systems. When the number of transmission channels increases to 64, the OSNR monitoring error after 20 span transmissions is less than 1 dB both in 64-channel PM-QPSK/16QAM systems. The main monitoring error occurs because of the error that occurred during the previous channel power monitoring. With the increase of transmission spans, the ASE noise induced by EDFA continues to accumulate due to multiple cascade amplification in the transmission link, resulting in an increase of channel power monitoring and thereby causing larger OSNR estimation error. In addition, the nonlinear effects and inter-channel cross talk also become more serious as the number of channels increases, which leads to a larger error in OSNR monitoring. Furthermore, other factors such as chromatic dispersion, polarization dependent impairments and so on will also affect the accuracy of power monitoring, which leads to a situation where the longer the transmission distance is, the greater the monitoring error is.
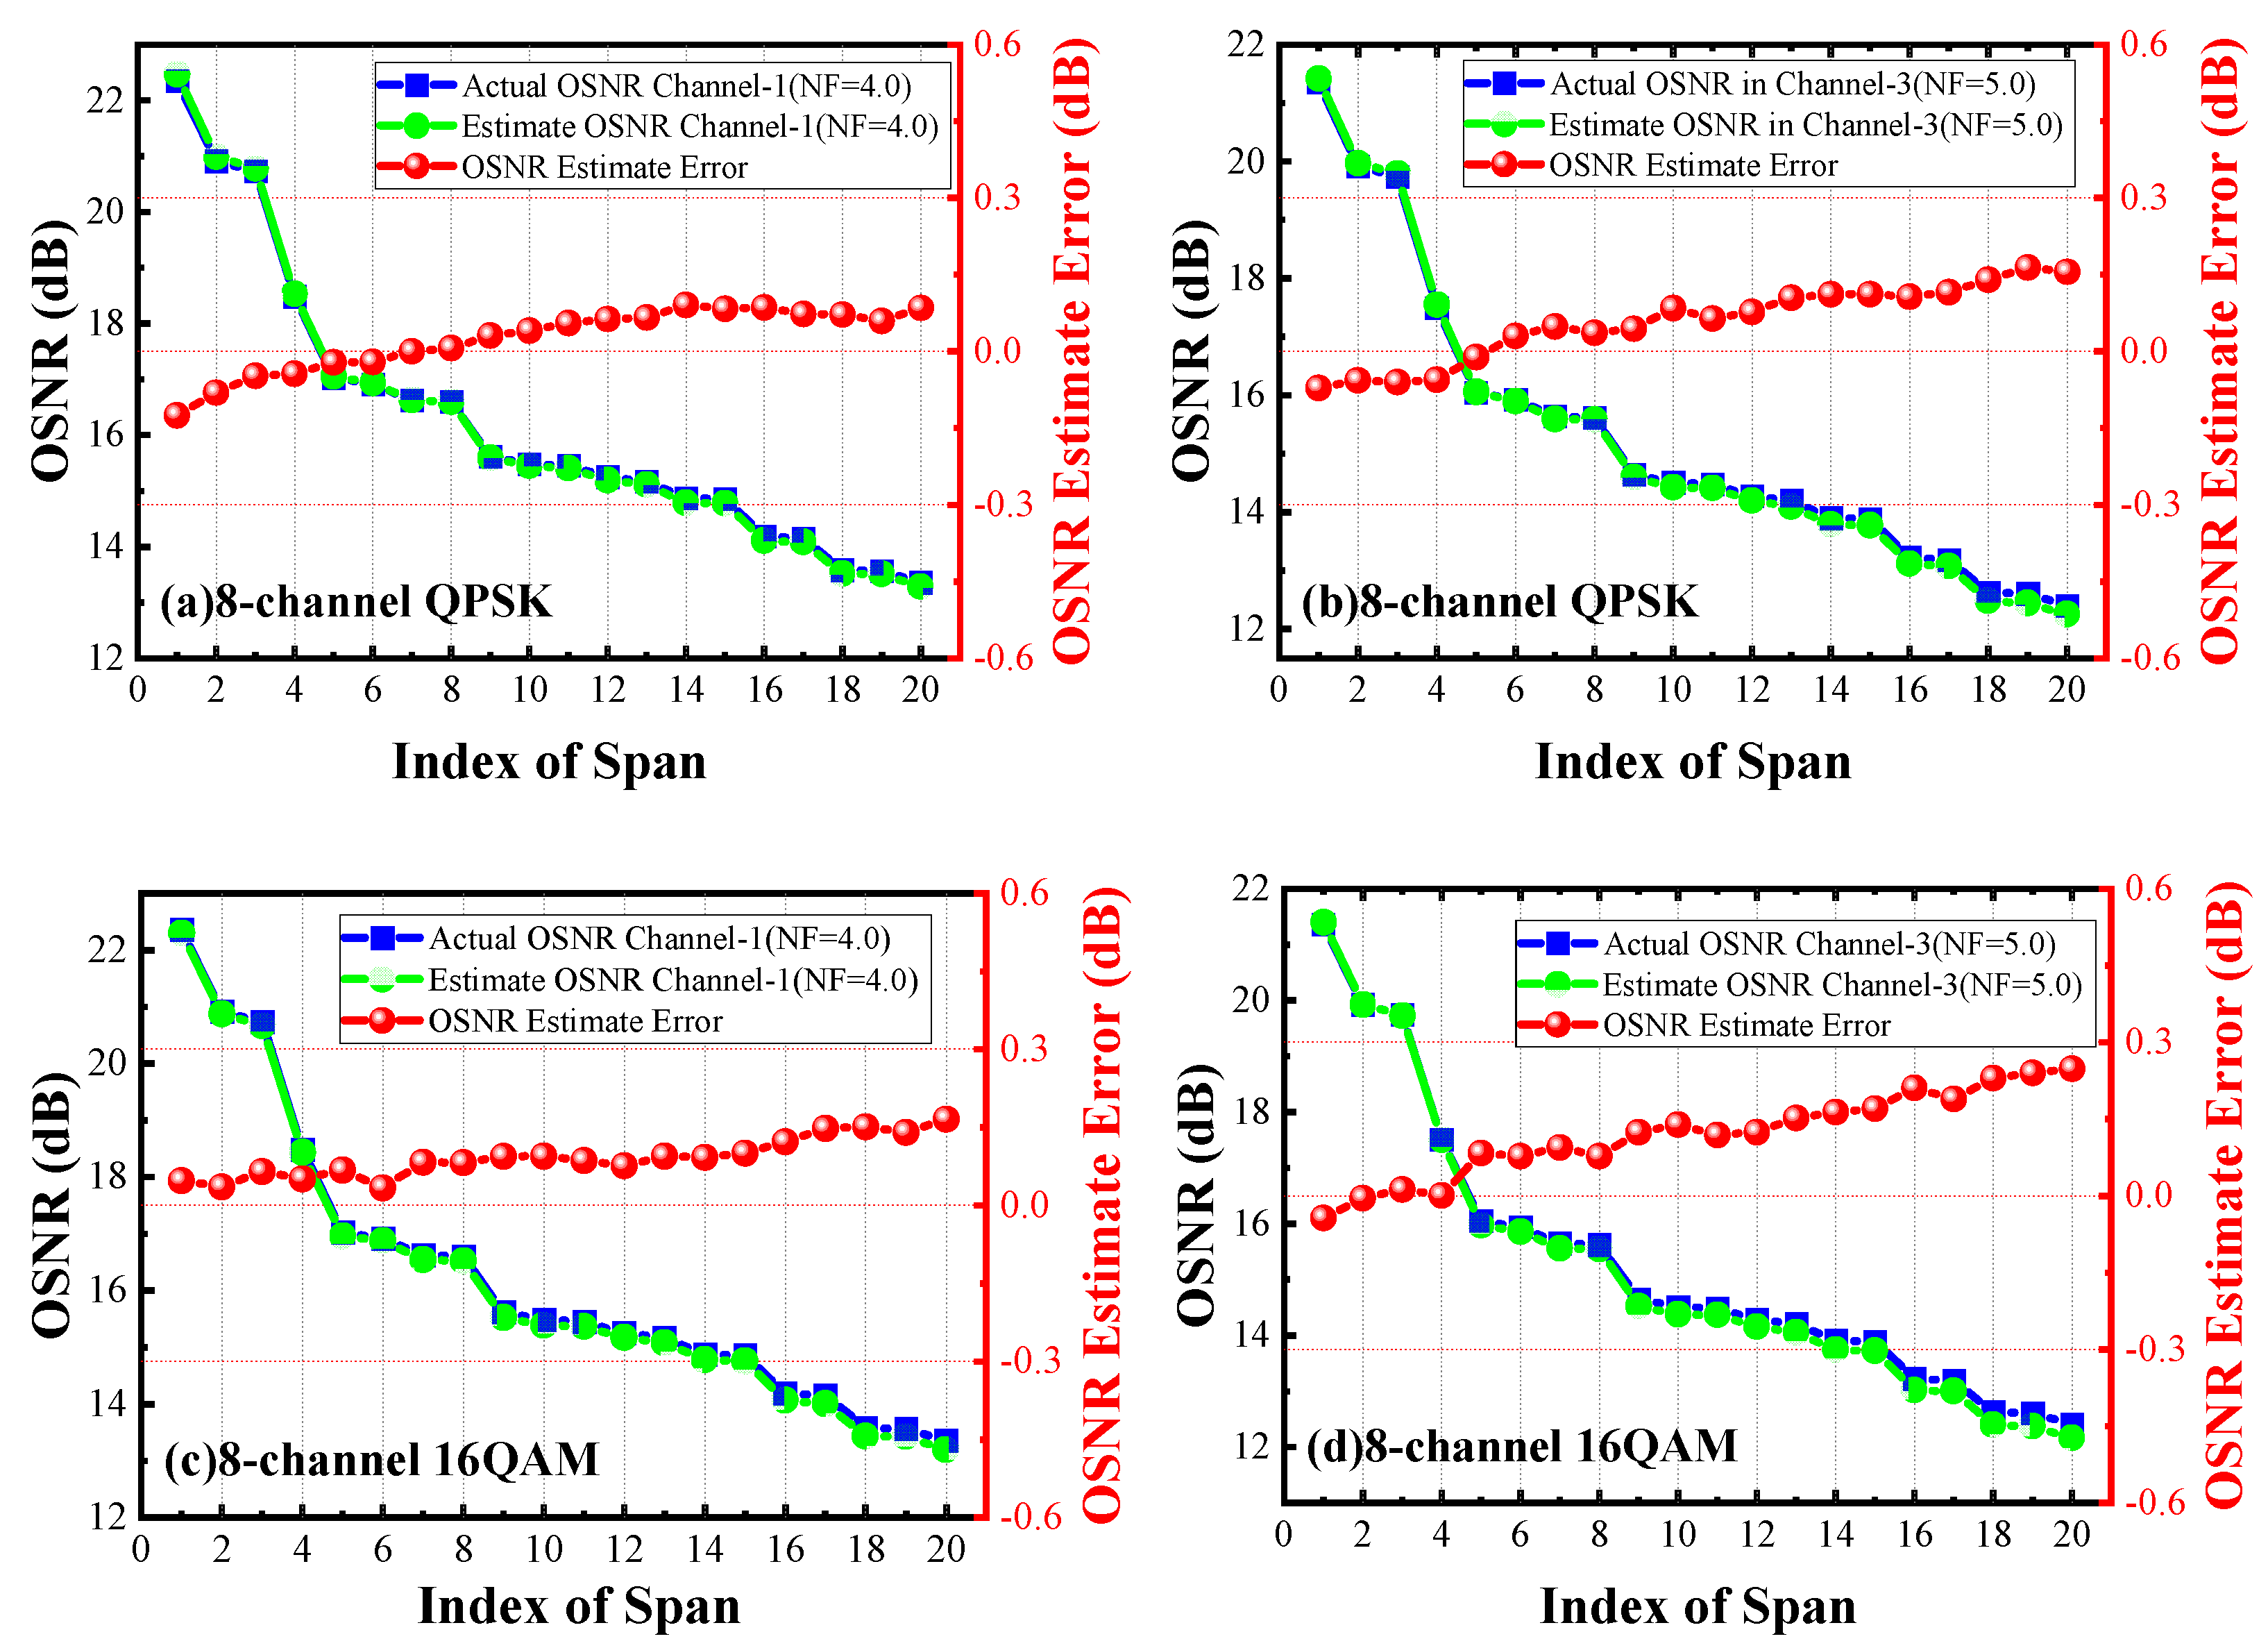
Meanwhile, to make the simulation more realistic and reliable, the span lengths of the 20-spans transmissions in the 8-channel system are set to 100, 60, 80, 40, 100, 50, 70, 20, 100, 60, 30, 70, 50, 80, 20, 100, 40, 100, 30 and 80 km, respectively. Thus, it is convincing to evaluate practically the OSNR estimation and corresponding errors of the target channel 1 (NF = 4) and channel 3 (NF = 5). Figure 8 shows that the maximum OSNR monitoring error is about 0.3 dB after 20-span transmission in both PM-QPSK/16QAM WDM systems. The scheme still works in the case of different span lengths, and the OSNR estimation error also tends to increase for the same reason. However, due to that the total transmission length here is reduced, resulting in a reduction of channel power monitoring, and it further makes the OSNR estimation error smaller than the results in Figure 7a,b.

4. Experimental Setup and Performance Analysis

To further verify the actual performance of the proposed scheme, the transmission experiment is carried out. 
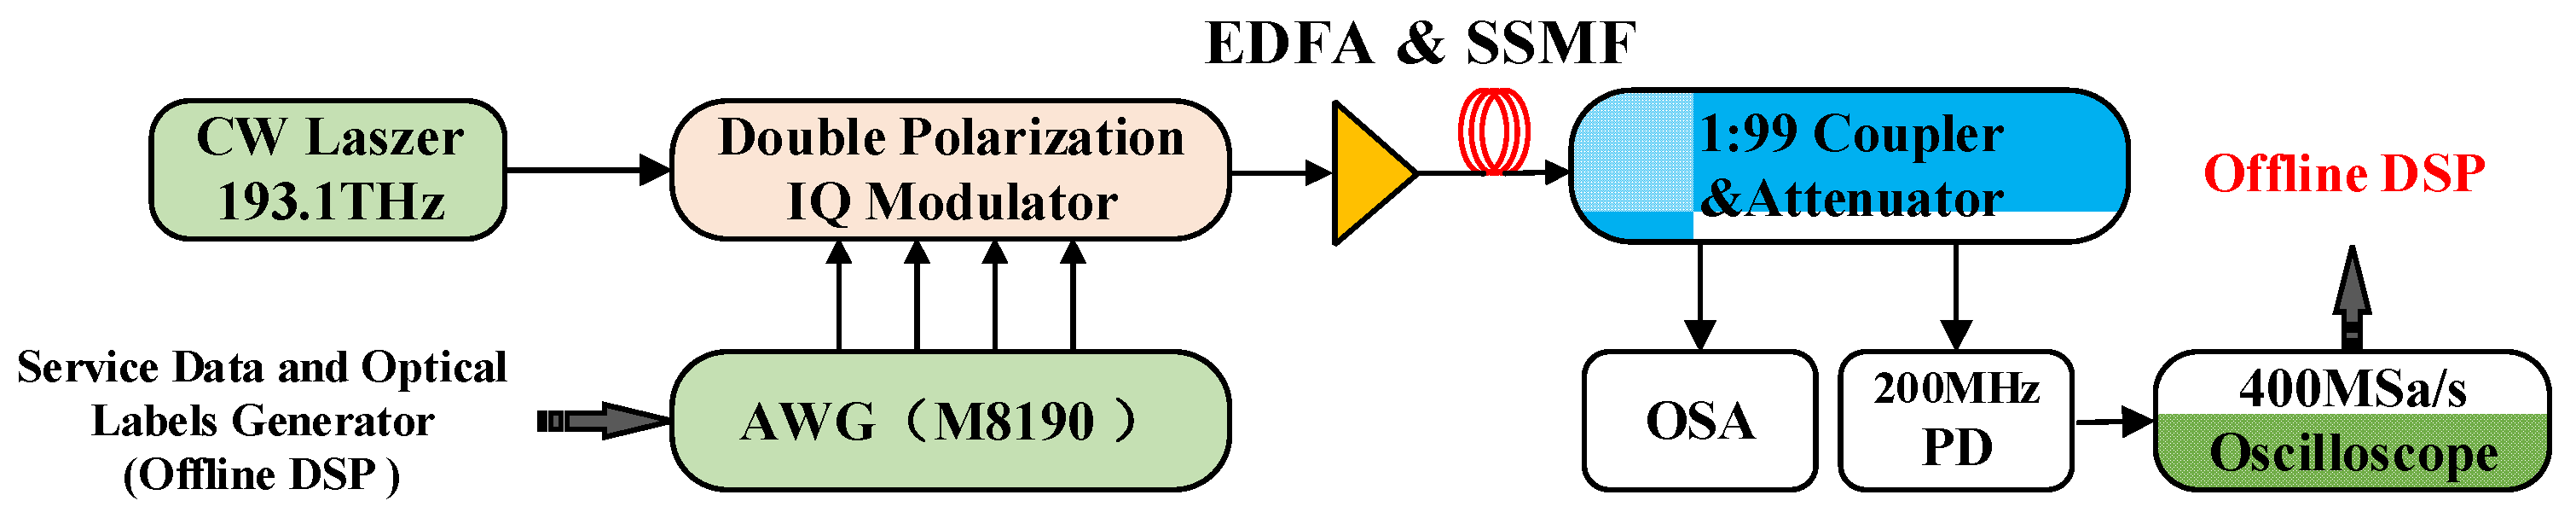
Figure 9 shows the experimental setup of optical-label based OPM over PM-QPSK and PM-16QAM systems. Since there is only one set of laser source, optical IQ modulator, and arbitrary waveform generator (AWG) available, only single-channel optical fiber transmission and monitoring verification is carried out in this experiment. In addition, limited by the storage depth and sampling rate of the 8190A instrument (up to 12 GSa/s), the service signal rate in the offline experiment is set to 4 G Baud, and the modulation depth of the optical tag to the service signal is set to 0.10. Firstly, random bit sequences of service signal are generated and mapped into PM-QPSK/16QAM symbols. Then, we modulate the 2 Mbit/s ID information [1, 1, 1, 0, 0, 0, 1, 1, 1, 0, 0, 0, 1, 1, 1] onto a 40 MHz pilot tone and load the pilot-tone-carried labels onto the service signals by offline DSP. Next, the discrete signals after the matched filter are sent into AWG (M8190A) working at 400 MSa/s. After 80 km standard single-mode fiber (SSMF) transmission and EDFA amplification, an adjustable optical attenuator is used to change the optical power of the channel within the PD’s acceptable working range of [−20–0 dBm]. A spectrometer (AQ6370) is used to observe the optical signal spectrum, while a 200 MHz-bandwidth PD is used to detect the optical labels. Then the detected 16QAM and QPSK signals are sampled by a real-time oscilloscope with 400 MSa/s for offline processing.
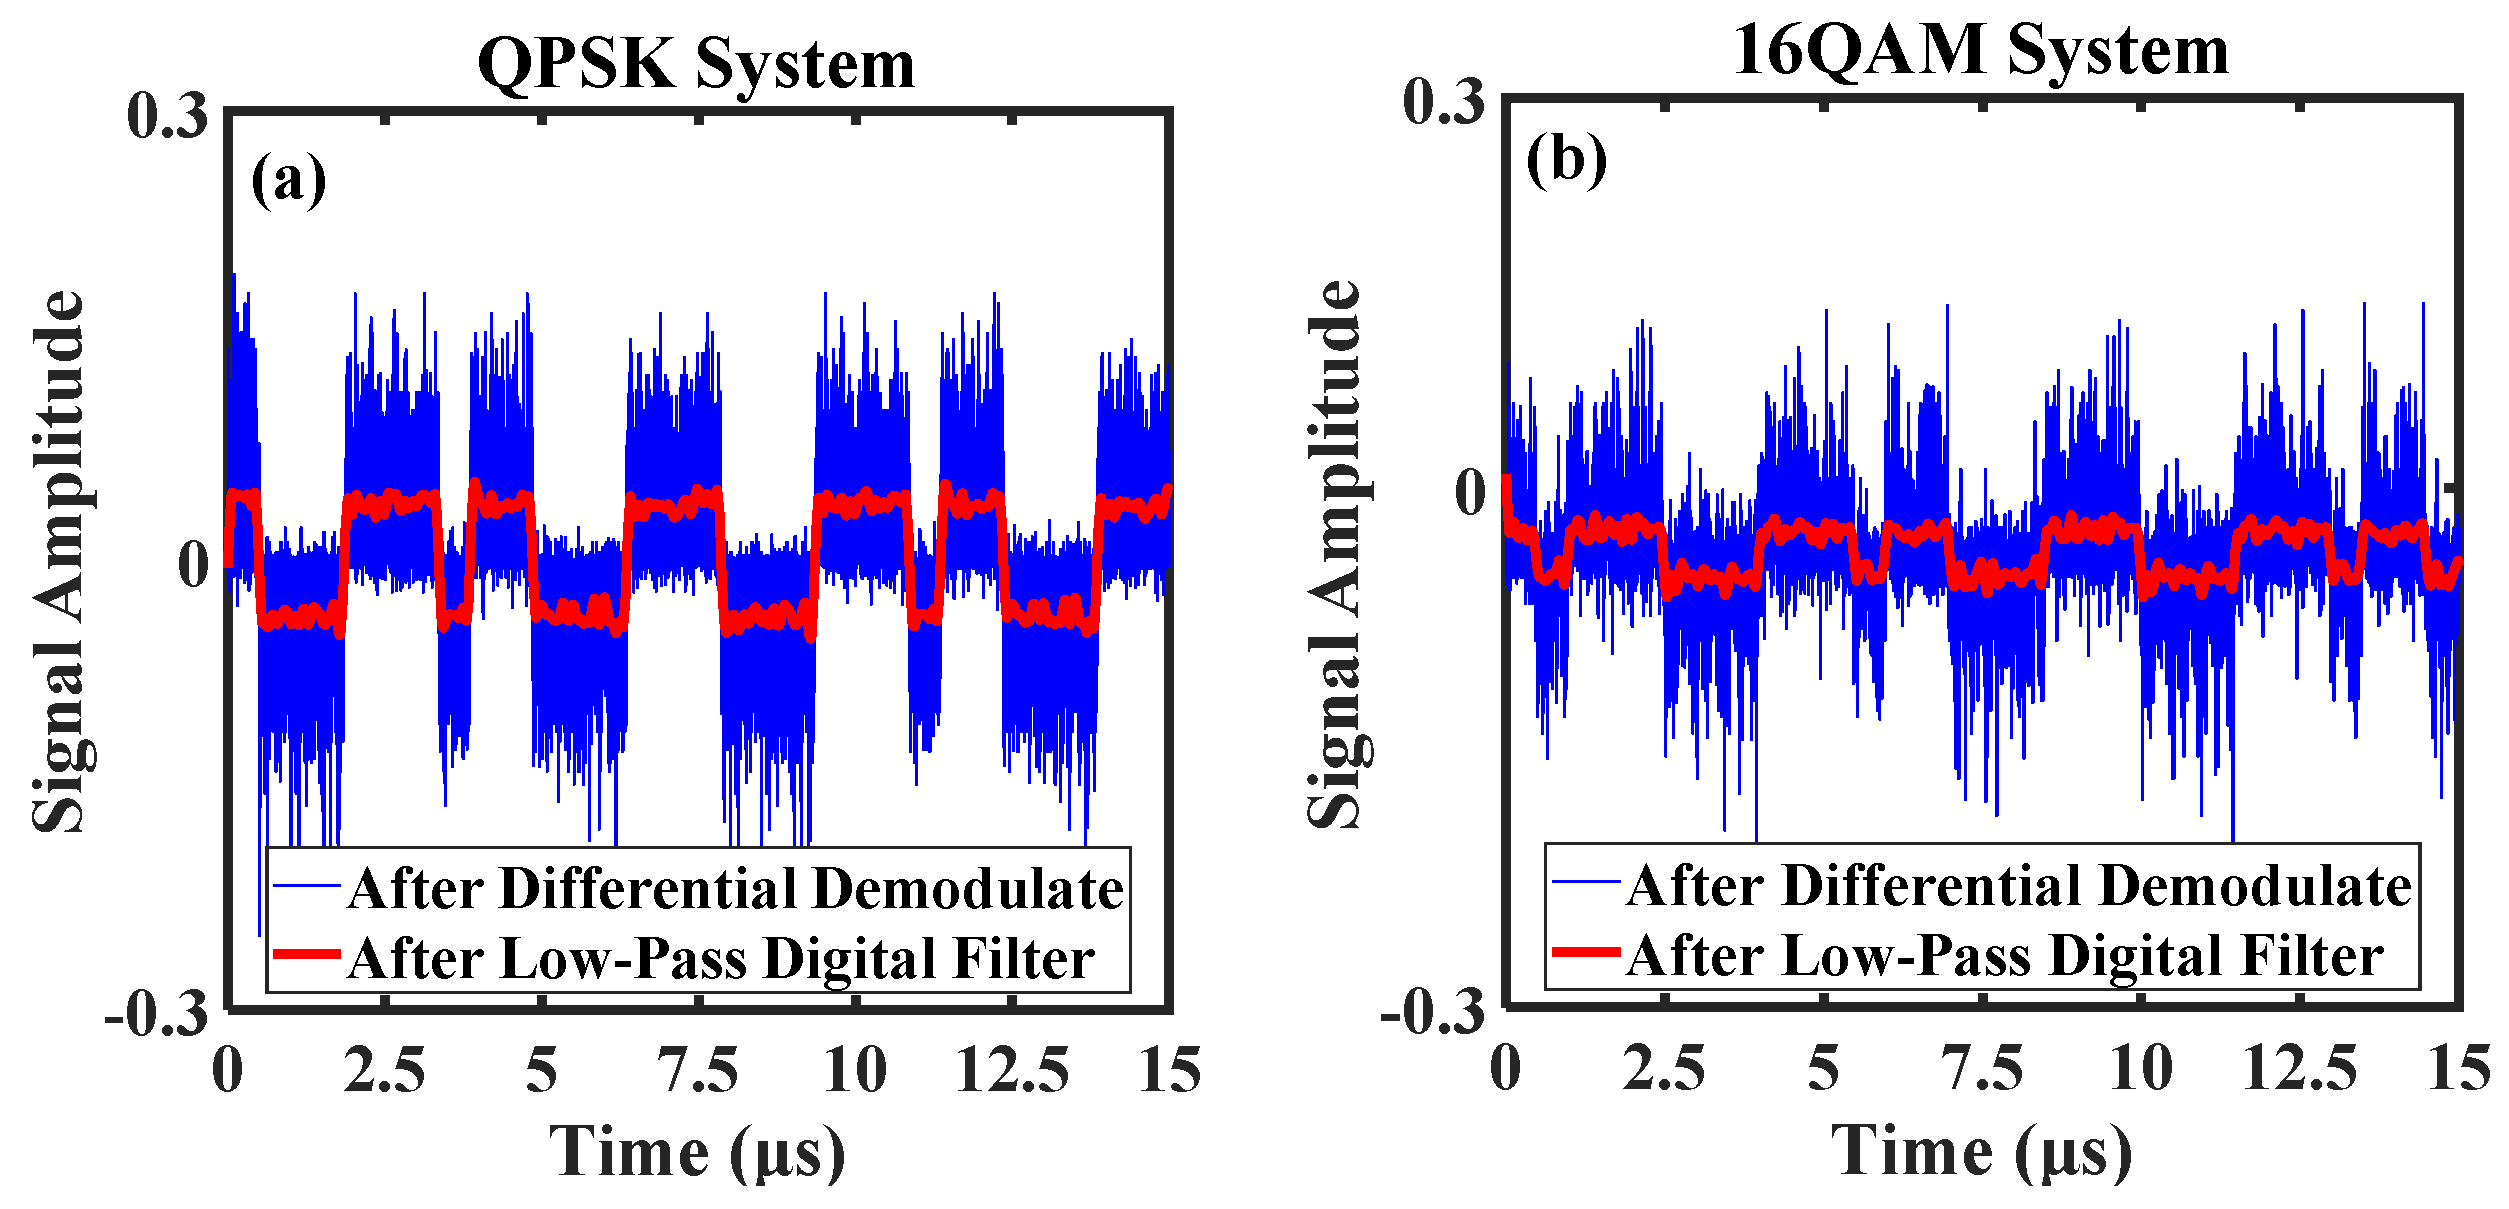
The waveform of the optical label after differential demodulation in offline DSP is shown in Figure 10. It shows that the transmitted DPSK digital optical labels, i.e., ID information of a wavelength channel, could be accurately recovered without error by using a low-bandwidth PD and low-sample-rate ADC with the help of DSP processing. Furthermore, we can see that the signal quality of labels in QPSK system is better than that of 16QAM. This is due to the fact that after PD reception, the amount of beat noise of QPSK constant-module signals is smaller than that of 16QAM, thereby making the QPSK system a better optical label signal-to-noise ratio when demodulating the labels.
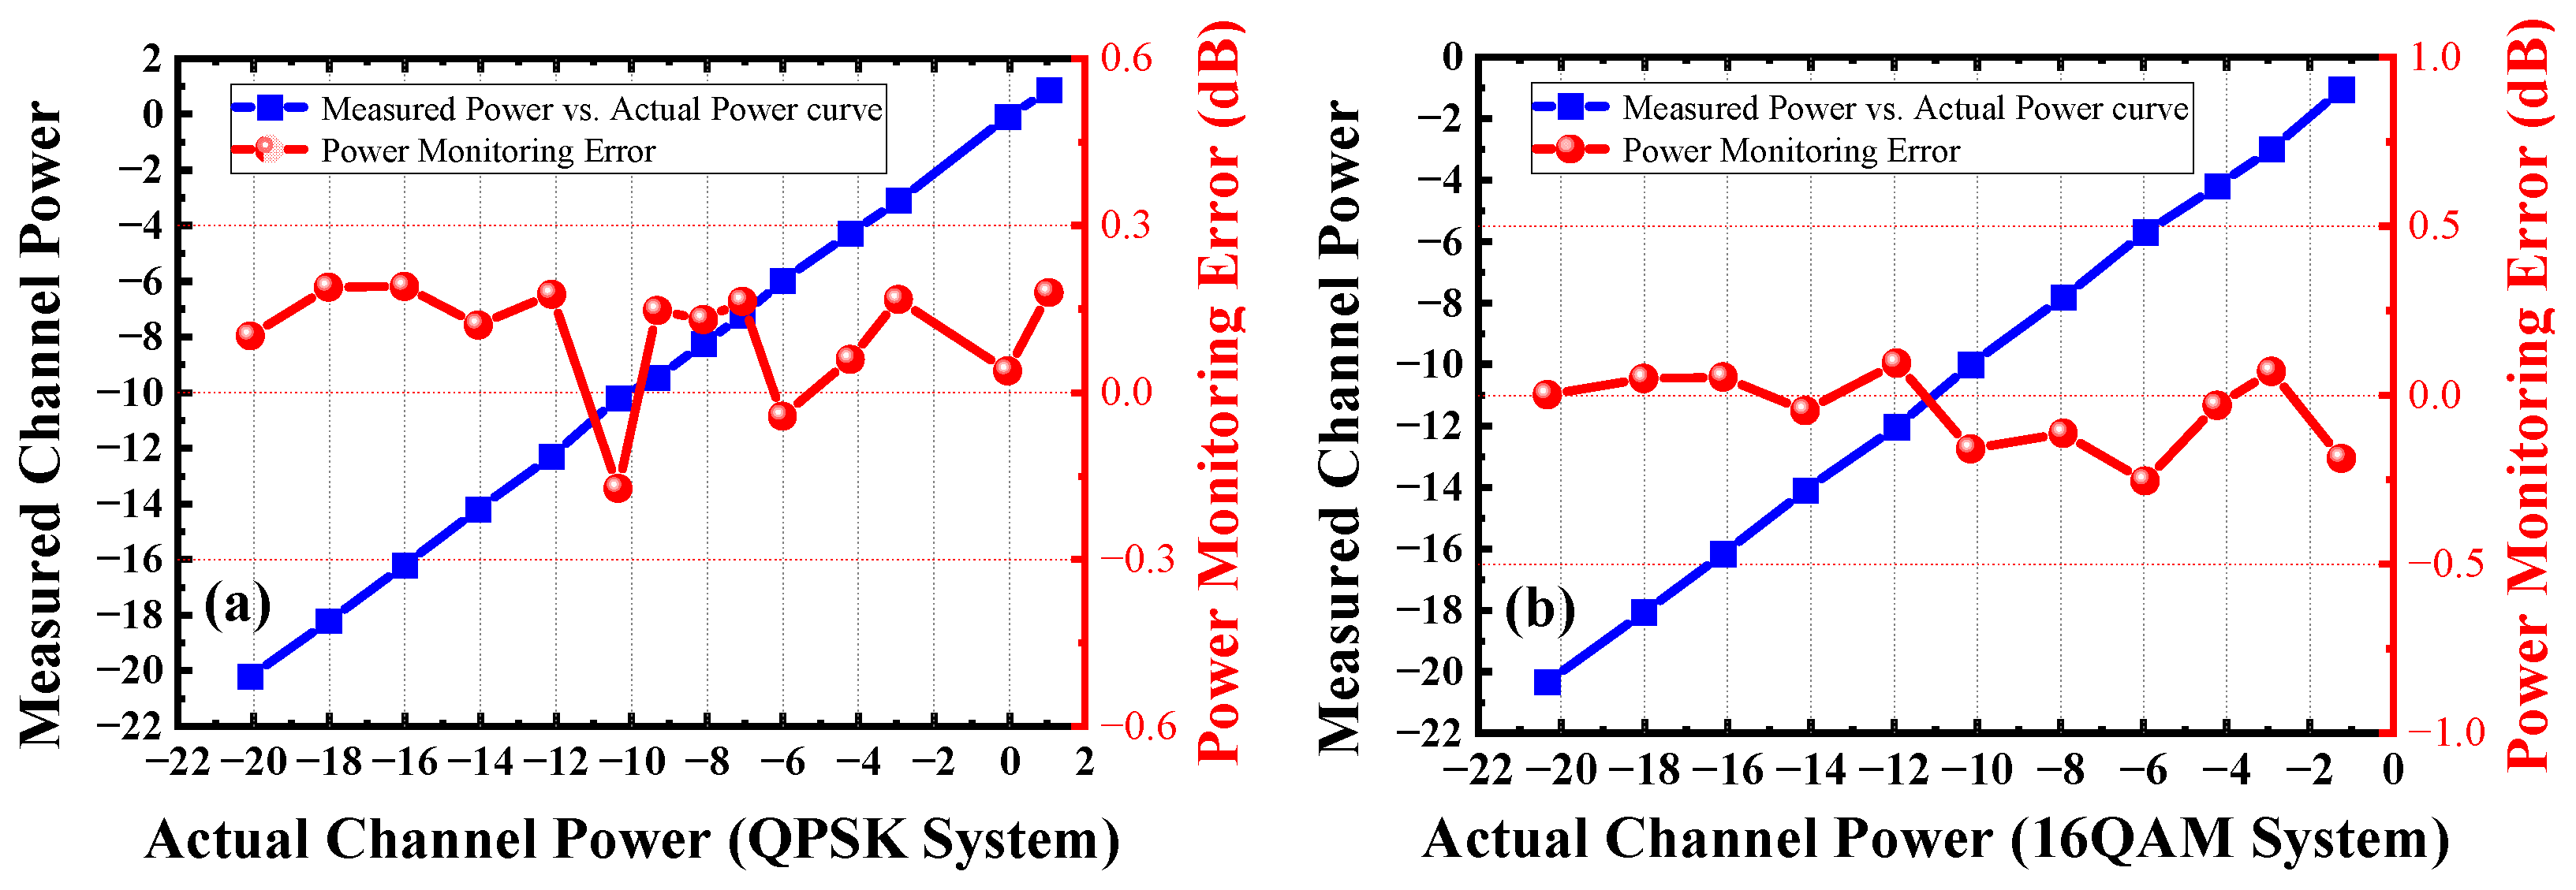
The result of power monitoring in experiments is shown in Figure 11. The result shows that the optical label power can be calculated more accurately, and then, the accurate channel optical power monitoring result can be obtained. The power monitoring error of the QPSK system is similar to that of the 16QAM system, which are both less than 0.3 dB under 80 km fiber transmission. It is important to point out that the multi-span transmission cannot be fully experimented with, resulting in better channel power monitoring performance than that of our simulation. Moreover, although the error of power monitoring fluctuates irregularly within a range, the accurate channel optical power monitoring performance is sufficient to make it a practical OPM solution.

5. Conclusions

In this paper, a low-cost and highly efficient optical labels enabled channel power monitoring and OSNR estimation of WDM system has been proposed and demonstrated. DPSK digital optical labels modulated on pilot tones with frequency of tens of MHz were applied as identity indicators and performance predictors tied up to each wavelength channel. The system can not only monitor the performance of all wavelength channels simultaneously using low-cost PD detection, but it is also able to reliably deliver any specific surveillance information to further sense the working state of WDM channels. In addition, in our proposed DSP processing in OPM modules, the channel optical power is monitored using the method of spectral integration, and the OSNR is further estimated by calculating the ASE noise accumulation form all amplifiers. The simulation results of 8, 32 and 64 channels WDM systems under 20 spans transmission show that the maximum monitoring error of channel optical power and the estimation error of OSNR are both less than 1 dB in 16 G Baud PM-QPSK and PM-16QAM systems, respectively. Furthermore, an offline experiment platform was constructed by using a PD with 300 MHz bandwidth and an ADC with 600 MSa/s sample rate, and the results show that the DPSK digital labels could be accurately recovered with the help of the proposed DSP processing, while the monitoring error of channel optical power is less than 0.3 dB. Therefore, the advantages of low cost and high efficiency make our scheme more pragmatic and more robust and therefore easier to implement and more practical for WDM system applications.

Author Contributions

Conceptualization, T.Y. and X.C.; formal analysis, T.Y., K.L. and Z.L.; investigation, T.Y. and S.S.; data curation, T.Y. and X.C.; writing—original draft preparation, T.Y., K.L. and X.W.; writing—review and editing, T.Y., L.W. and X.C.; visualization, T.Y. and K.L.; supervision, T.Y., K.L., Z.L., X.W., S.S., L.W. and X.C.; project administration, T.Y. and X.C. All authors have read and agreed to the published version of the manuscript.

Funding

This work is partly supported by National Natural Science Foundation of China (62001045), Beijing Municipal Natural Science Foundation (4214059), Fund of State Key Laboratory of IPOC (BUPT) (IPOC2021ZT17), and Fundamental Research Funds for the Central Universities (2022RC09).

Institutional Review Board Statement

Not applicable.

Informed Consent Statement

Not applicable.

Data Availability Statement

The data presented in this study are available on request from the corresponding author. The data are not publicly available due to the data also forms part of an ongoing study.

Acknowledgments

The authors express their appreciation to reviewers for their valuable suggestions.

Conflicts of Interest

The authors declare no conflict of interest.

References

  1. Miladić-Tešić, S.; Marković, G.; Peraković, D.; Cvitić, I. A review of optical networking technologies supporting 5G communication infrastructure. Wirel. Net. 2022, 28, 459–467. [Google Scholar] [CrossRef]
  2. Ji, Y.; Zhang, J.; Xiao, Y.; Liu, Z. 5G flexible optical transport networks with large-capacity, low-latency and high-efficiency. China Commun. 2019, 16, 19–32. [Google Scholar] [CrossRef]
  3. Pan, Z.; Yu, C.; Willner, A.E. Optical performance monitoring for the next generation optical communication networks. Opt. Fiber Technol. 2010, 16, 20–45. [Google Scholar] [CrossRef]
  4. Dong, Z.; Khan, F.N.; Sui, Q.; Zhong, K.; Lu, C.; Lau, A. Optical performance monitoring: A review of current and future technologies. J. Lightwave Technol. 2016, 34, 525–543. [Google Scholar] [CrossRef]
  5. Dong, Y.; Jiang, T.; Teng, L.; Zhang, H.; Chen, L.; Bao, X.; Lu, Z. Sub-MHz ultrahigh-resolution optical spectrometry based on Brillouin dynamic gratings. Opt. Lett. 2014, 39, 2967–2970. [Google Scholar] [CrossRef] [PubMed]
  6. Calvin, C.C.K. Optical Performance Monitoring: Advanced Techniques for Next-Generation Photonic Networks, 1st ed.; Academic Press: Cambridge, MA, USA; Elsevier: New York, NY, USA, 2010; ISBN 978-0-12-374950-5. [Google Scholar]
  7. Cui, S.; Jin, S.; Xia, W.; Ke, C.; Liu, D. Improved symbol rate identification method for on–off keying and advanced modulation format signals based on asynchronous delayed sampling. Opt. Commun. 2015, 354, 218–224. [Google Scholar] [CrossRef]
  8. Amrani, A.; Junyent, G.; Prat, J.; Comellas, J.; Ramdani, I.; Sales, V.; Roldan, J.; Rafel, A. Performance monitor for all-optical networks based on homodyne spectroscopy. IEEE Photonics Technol. Lett. 2000, 12, 1564–1566. [Google Scholar] [CrossRef]
  9. Khan, F.N.; Zhong, K.; Al-Arashi, W.H.; Yu, C.; Chao, L.; Lau, A. Modulation format identification in coherent receivers using deep machine learning. IEEE Photonics Technol. Lett. 2016, 28, 1886–1889. [Google Scholar] [CrossRef]
  10. Du, J.; Yang, T.; Chen, X.; Chai, J.; Shi, S. A CNN-based cost-effective modulation format identification scheme by low-bandwidth direct detecting and low rate sampling for elastic optical networks. Opt. Commun. 2020, 471, 126007. [Google Scholar] [CrossRef]
  11. Mata, J.; de Miguel, I.; Durán, R.J.; Merayo, N.; Singh, S.K.; Jukan, A.; Chamania, M. Artificial intelligence (AI) methods in optical networks: A comprehensive survey. Opt. Switch Netw. 2018, 28, 43–57. [Google Scholar] [CrossRef]
  12. Park, K.J.; Shin, S.K.; Chung, Y.C. Simple monitoring technique for WDM networks. Electron. Lett. 1999, 35, 415–417. [Google Scholar] [CrossRef]
  13. Jun, S.B.; Kim, H.; Park, P.K.J.; Lee, H.; Chung, Y.C. Pilot-tone-based WDM monitoring technique for DPSK systems. IEEE Photonics Technol. Lett. 2006, 18, 2171–2173. [Google Scholar] [CrossRef]
  14. Jiang, Z.; Tang, X. Low-cost signal spectrum monitoring enabled by multiband pilot tone techniques. In Proceedings of the 2018 European Conference on Optical Communication (ECOC), Roma, Italy, 23–27 September 2018; pp. 1–3. [Google Scholar]
  15. Ji, H.C.; Park, K.J.; Lee, J.H.; Chung, H.S.; Son, E.S.; Han, K.H.; Jun, S.B.; Chung, Y. Optical performance monitoring techniques based on pilot tones for WDM network applications. J. Opt. Netw. 2004, 3, 510–533. [Google Scholar] [CrossRef]
  16. Liu, Z.; Yang, T.; Shi, S.; Du, J.; Wang, J. A Highly Reliable Timing Error Tolerated Optical Label Demodulation Algorithm for WDM Optical Network Monitoring. In Proceedings of the Asia Communications and Photonics Conference 2021, Shanghai, China, 24–27 October 2021; pp. 1–3. [Google Scholar]
  17. Yang, C.; Li, X.; Luo, M.; He, Z.; Li, H.; Li, C.; Yu, S. Optical Labelling and Performance Monitoring in Coherent Optical Wavelength Division Multiplexing Networks. In Proceedings of the 2020 Optical Fiber Communications Conference and Exhibition (OFC), San Diego, CA, USA, 8–12 March 2020; pp. 1–3. [Google Scholar]
  18. Yang, C.; Luo, M.; Zhang, X.; Meng, L.; Luan, Y.; Mei, L.; He, Z. Demonstration of Real-time Optical Labelling System for Coherent Optical Wavelength Division Multiplexing Networks. In Proceedings of the Asia Communications and Photonics Conference (ACP) and International Conference on Information Photonics and Optical Communications (IPOC) 2020, Beijing, China, 24–27 October 2020; pp. 1–3. [Google Scholar]
  19. Yang, C.; Luo, M.; He, Z.; Xiao, X. Flexible and Transparent Optical Labelling in Coherent Optical Wavelength Division Multiplexing Networks. In Proceedings of the 2022 Optical Fiber Communication Conference (OFC), San Diego, CA, USA, 6–10 March 2022; pp. 1–3. [Google Scholar]
  20. Zhang, X.; Yang, C.; Luo, M.; Meng, L.; Jiang, F.; He, Z. Real Time Optical Label System for Coherent Optical Wavelength Division Multiplexing Networks. In Proceedings of the 26th Optoelectronics and Communications Conference (OECC), Hong Kong, China, 3–7 July 2021; pp. 1–3. [Google Scholar]
  21. Du, J.; Yang, T.; Shi, S.; Chen, X.; Wang, J. Optical Label-enabled Low-cost DWDM Optical Network Performance Monitoring Using Novel DSP Processing. In Proceedings of the Asia Communications and Photonics Conference 2020, Beijing, China, 24–27 October 2020; pp. 1–3. [Google Scholar]
  22. Park, P.K.J.; Kim, C.H.; Chung, Y.C. Performance analysis of low-frequency pilot-tone-based monitoring techniques in amplified wavelength-division-multiplexed networks. Opt. Eng. 2008, 47, 025009. [Google Scholar] [CrossRef]
  23. Chung, H.S.; Shin, S.K.; Park, K.J.; Woo, H.G.; Chung, Y.C. Effects of stimulated Raman scattering on pilot-tone-based WDM supervisory technique. IEEE Photonics Technol. Lett. 2000, 12, 731–733. [Google Scholar] [CrossRef]
  24. Jiang, Z.; Tang, X.; Wang, S.; Gao, G.; Jin, D.; Wang, J.; Si, M. Progresses of Pilot Tone Based Optical Performance Monitoring in Coherent Systems. J. Lightwave Technol. 2022, 40, 3128–3136. [Google Scholar] [CrossRef]
  25. Keiser, G. Optical Fiber Communications, 4th ed.; Publishing House of Electronics Industry: Beijing, China, 2012; ISBN 978-7-121-16171-1. [Google Scholar]
Figure 1. Schematic diagram of the optical-label enabled OPM scheme. (OTU: optical transponder unit, OPA: optical pre-amplifier, OBA: optical boost amplifier, OLA: optical line amplifier, MZM: Mach-Zehnder modulator, PBC: polarization beam combiner, PT: pilot tone, OSC: optical supervising channel).
Photonics 09 00647 g001
Figure 2. Spectrum of the detected optical label of 80-channel WDM systems.
Photonics 09 00647 g002
Figure 3. CAPEX comparison of three schemes.
Photonics 09 00647 g003
Figure 4. The calibration coefficient versus modulation depth.
Photonics 09 00647 g004
Figure 5. The optical power monitoring results of (a) 8-channel QPSK, (b) 8-channel 16QAM system.
Photonics 09 00647 g005
Figure 6. The power monitoring error with different channel numbers.
Photonics 09 00647 g006
Figure 7. Result of OSNR estimation and corresponding error under 100 km equal-length span in (a) 8-channel QPSK, (b) 8-channel 16QAM, (c) 32-channel QPSK, (d) 32-channel 16QAM systems, (e) 64-channel QPSK systems, and (f) 64-channel 16QAM system.
Photonics 09 00647 g007
Figure 8. Result of OSNR estimation and corresponding error under [20–100 km] unequal-length span in (a,b) QPSK and (c,d) 16QAM systems.
Photonics 09 00647 g008
Figure 9. Diagram of experimental platform.
Photonics 09 00647 g009
Figure 10. The demodulated waveform of optical labels in (a) QPSK and (b) 16QAM systems.
Photonics 09 00647 g010
Figure 11. Results of channel power monitoring and monitoring error (a) in QPSK system, and (b) in 16QAM system.
Photonics 09 00647 g011
Table 1. The cost of different modules used in the three OPM schemes.
Scheme AScheme BProposed C
ModulesCost UnitsModulesCost UnitsModulesCost Units
VOA400 (×80)VOA400 (×80)//
OF9000////
PD1100PD1100PD1100
ADC500ADC500ADC500
Total 42,600Total 33,600Total 1600
Table 2. Simulation parameters.
Service Modulation FormatPM-QPSK/16QAMModulation Depth5%/10%/15%
Service Baud Rate16 G BaudEDFA Noise Figure5 dB
Launch Power0 dBmLength of Each Span100 km
Digital Label FormatDPSKPMD Coefficient0.1 ps/(km)1/2
Digital Label Rate2 MbpsPD Bandwidth300 MHz
Bit Number of Digital Labels32 bitADC Sample Rate600 MSa/s
Carrier Wavelength193.1–196.25 THzADC Resolution10 bit
Channel Spacing50 GHzFiber Attenuation0.2 dB/km
Table 3. SNR and power of optical labels in with different modulate depth.
Service Signal FormatModulation DepthSNR of Optical Label (dB)Label Power (mW)
QPSK5%10.590.96
10%13.711.99
15%15.102.98
16QAM5%6.950.91
10%10.291.88
Publisher’s Note: MDPI stays neutral with regard to jurisdictional claims in published maps and institutional affiliations.

