Article

Camouflage Target Recognition Based on Dimension Reduction Analysis of Hyperspectral Image Regions

1
Department of Electronic and Optical Engineering, Army Engineering University of PLA, Shijiazhuang 050000, China
2
Department of Missile Engineering, Army Engineering University of PLA, Shijiazhuang 050000, China
*
Author to whom correspondence should be addressed.
Photonics 2022, 9(9), 640; https://doi.org/10.3390/photonics9090640
Submission received: 1 August 2022 / Revised: 26 August 2022 / Accepted: 29 August 2022 / Published: 6 September 2022

Abstract

:
Hyperspectral reconnaissance technology can realize three-dimensional reconnaissance by using target space and spectral information, which effectively improves the efficiency of battlefield reconnaissance. However, in order to obscure what is true and what is false to confuse the enemy, camouflage technology is also developing. Hiding the target in the background environment and setting false targets have become common camouflage procedures on the battlefield. The camouflaged target has very similar spatial and spectral characteristics to the real target, so the method of identifying the camouflaged target according to the similarity threshold of the original spectral data is no longer reliable. In order to solve the problem of high spectral similarity and low discrimination between a camouflaged target and a real target in a hyperspectral image, a joint processing method of spatial spectrum information is adopted in this paper. Firstly, the hyperspectral image is preprocessed, and then the target area to be measured is determined. Finally, the dimensions of the determined sensitive small area are reduced. Experiments show that this processing method can effectively reduce the spectral similarity of true and false targets, increase the spectral difference of true and false targets and improve the ability to identify true and false targets based on hyperspectral images.

1. Introduction

Imaging spectrum technology is a new detection technology that comprehensively uses spatial geometric information and spectral information. The hyperspectral image obtained by using an imaging spectrometer can not only reflect the distribution of ground objects in space but can also obtain the fine spectral characteristics of targets in the field of view at the same time. The advantage of a hyperspectral image is that it breaks the limitation of two-dimensional space, can obtain continuous narrow-band diagnostic spectral values of substances in each pixel and effectively improves the accuracy and reliability of object classification and recognition [1]. Hyperspectral images have the characteristics of a three-dimensional data structure of a spatial spectral information combination, that is, “Atlas integration”, and are widely used in mineral analysis, agriculture, military and other fields [2,3,4].
In terms of military target reconnaissance, recognition and camouflage, hyperspectral imaging technology can find military equipment according to the different spectral characteristics of real targets and camouflaged targets and reverse the components of targets through spectral characteristic curves to reveal false targets and their camouflage methods. However, with the rapid development of various high-tech camouflage technologies, modern camouflage technology has the characteristics of strong concealment, high fidelity and is convenient to carry. The spectral curve of existing camouflage material is very similar to that of a real target. When the detection band of the imaging instrument and the spectral resolution are limited, it is difficult to distinguish the true and false targets with high spectral similarity. In recent years, camouflage target detection algorithms based on hyperspectral imaging technology have developed rapidly. Generally speaking, there are two main developmental directions to solve the problem of identifying camouflaged targets. One is to fully study the spectral characteristics of camouflaged targets, broaden the spectral detection band and improve the spectral resolution level. Yan Y et al. carried out experiments using visible light and near-infrared imaging spectrometers to study the spectral characteristics of camouflaged targets in different bands and proposed to comprehensively consider various factors to complete the camouflaged target detection task [5]. The second is to make comprehensive use of spatial and spectral information and use spectral dimension reduction or other preprocessing methods to increase the spectral difference, so that the characteristics of camouflaged targets are exposed, which effectively improves the detection efficiency of camouflaged targets. Shen Y et al. proposed a camouflage target detection algorithm that combines the constrained energy minimization (CEM) algorithm and the improved maximum inter-class variance (OTSU) algorithm (t-OTSU). They proposed to obtain the initial target detection results and adaptively segment the target area. Furthermore, a target region extraction (ORE) algorithm is proposed to obtain the complete target contour and improve the target detection ability of a multispectral image (MSI) [6]. However, limited by imaging conditions and other factors, most of the traditional target detection algorithms are aimed at hyperspectral images under remote sensing imaging conditions. With the development of land-based combat platforms and UAV imaging equipment, the spatial resolution of the acquired images has been greatly improved, which provides an opportunity to quickly determine the target area. Therefore, this paper proposes a hyperspectral image dimension reduction analysis method based on a prior region to improve the spectral difference between a camouflaged target and a real target. First, the basic theory used in this method is introduced, especially in the part of prior target area acquisition, and the target detection technology based on deep learning is combined; however, this is not the only way to obtain the target area to be measured. In addition, this paper uses the imaging spectrometer and related equipment to carry out the actual field experiment, and the experiment also confirms the effectiveness of this method.

2. Materials and Methods

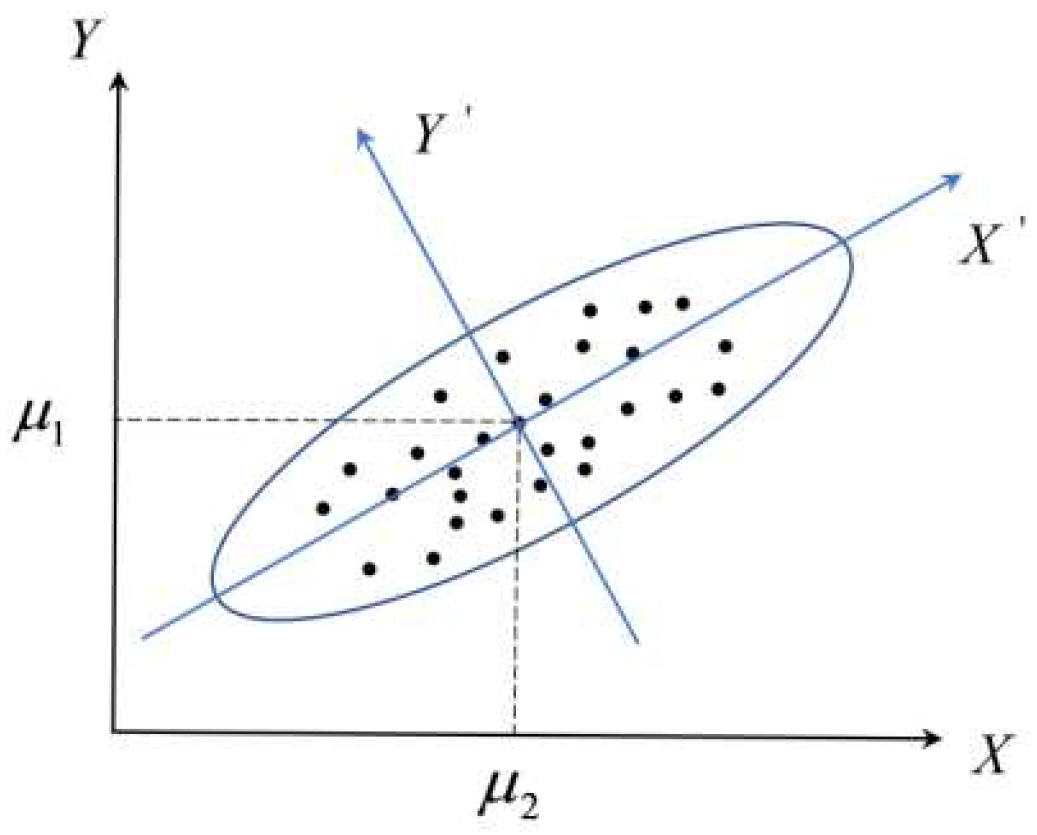
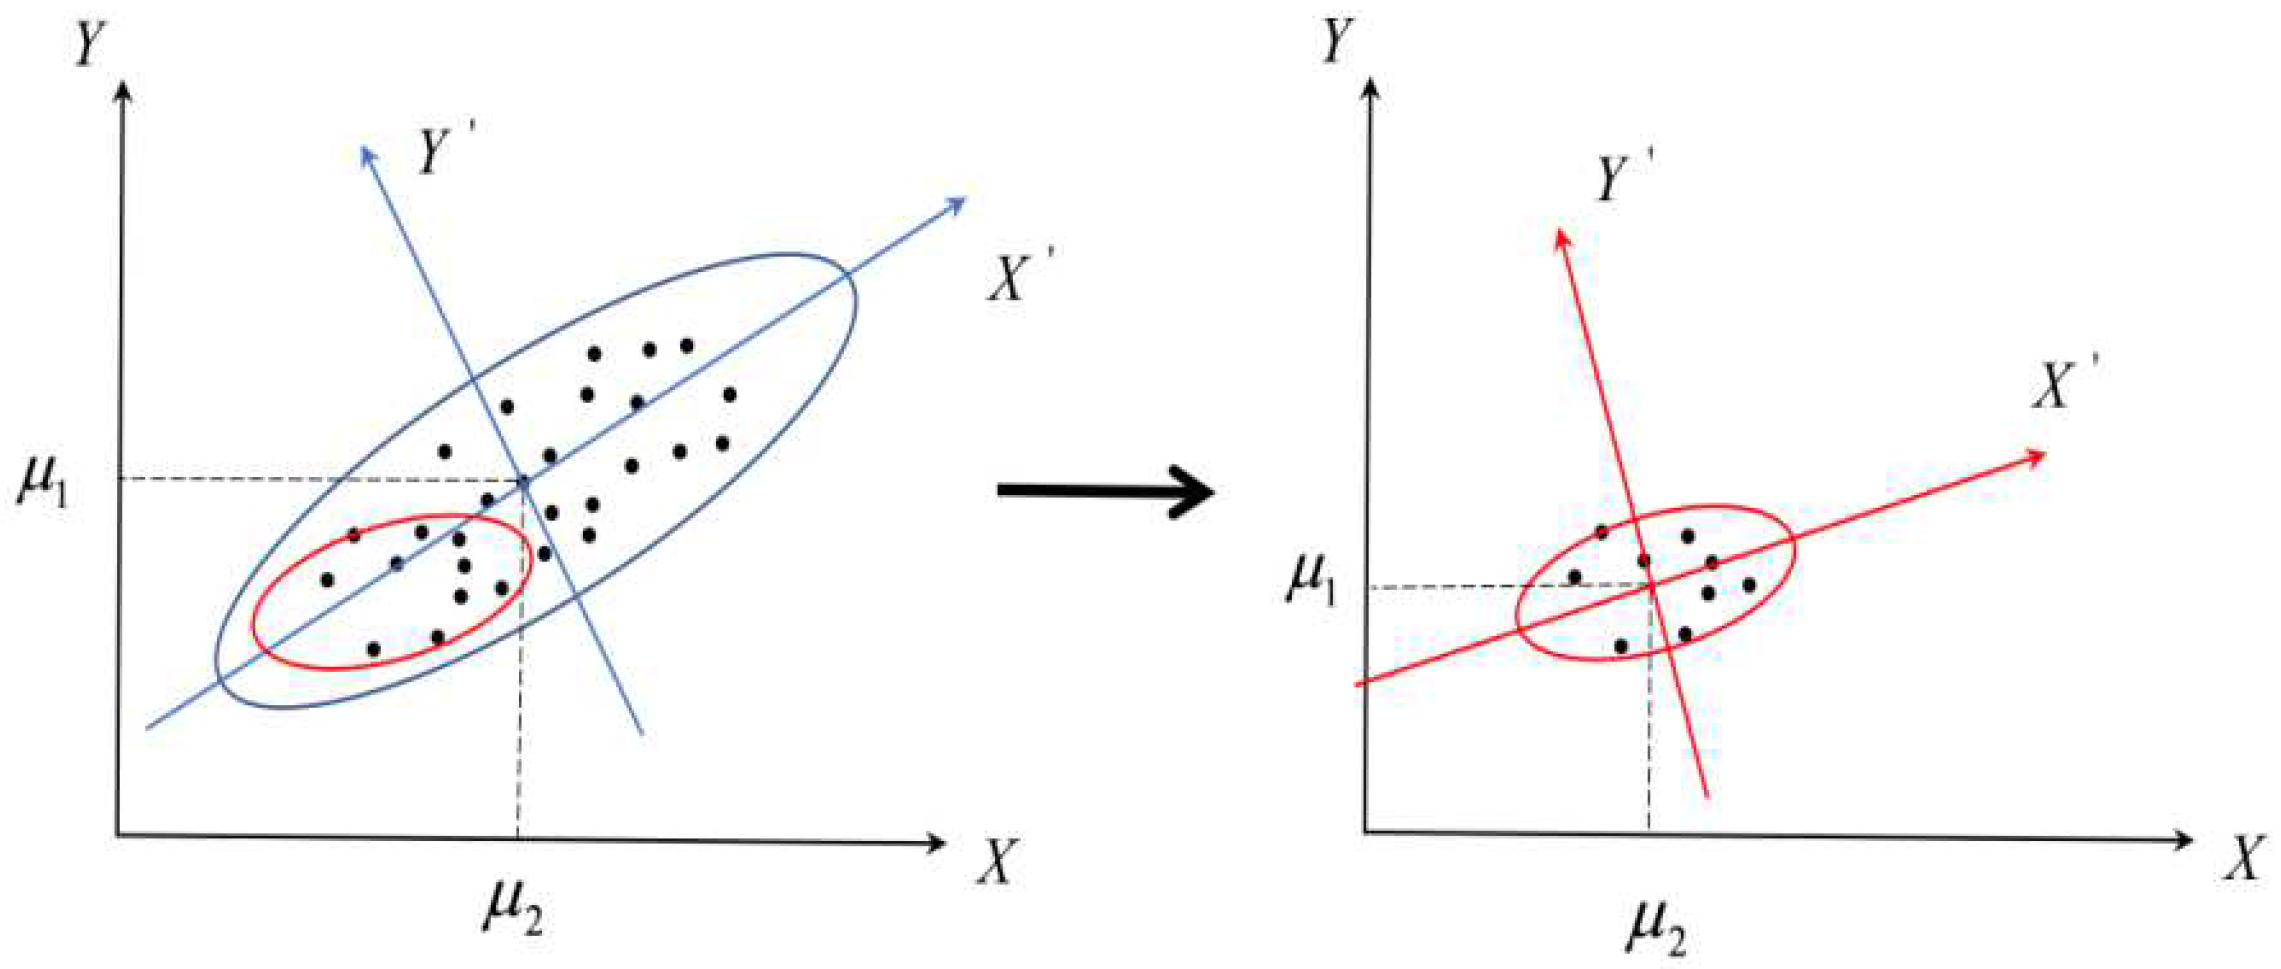
2.1. Data Dimensionality Reduction and Principal Component Analysis

There are many bands in hyperspectral images, and there must be a certain correlation between adjacent bands, resulting in obvious data redundancy. In order to solve the problems of large amounts of data and the high correlation of image bands, dimension reduction processing is usually needed before target detection and classification. Data dimensionality reduction refers to using fewer spectral data variables to replace the original variables. The dimensionality reduced data can still reflect the information of the original data and is more conducive to understanding and processing [7]. Hyperspectral data dimensionality reduction can be divided into two: spectral feature selection and spectral feature extraction. Spectral feature selection refers to using a subset of the original spectral band information as the feature space after dimensionality reduction. This subset can strengthen those spectral bands with strong separability and remove the bands with strong correlation. Compared with spectral feature selection, spectral feature extraction can extract a low-dimensional subspace (not a combination of simple feature selection) from the original high-dimensional space by transformation, so that the distribution of data in this space can describe the original data in an optimal sense. On the whole, the method of spectral feature extraction for spectral data dimensionality reduction is simple and easy, and the automation level is high in practical applications, so it is more widely used.
Principal component analysis (PCA) is the most basic and commonly used spectral data dimensionality reduction method. This method uses eigenvalues to determine meaningful principal component images and selects principal components corresponding to larger eigenvalues to achieve data dimensionality reduction. See reference [8] for the definition and solution process of principal component analysis. From a mathematical point of view, PCA is a method of linear transformation and reorganization; from a geometric point of view, PCA is a processing method that rotates the multi-dimensional coordinate system to maximize the sample variance. Taking two-dimensional space as an example, as shown in Figure 1, it is the schematic diagram of the PCA method.
However, with the continuous development of imaging technology, the spatial size of hyperspectral images is increasing, and the spatial resolution is also improving significantly. Although the dimensionality reduction of the whole hyperspectral image can preserve the original information to the greatest extent, there will still be the problem of indistinguishable pixels with high spectral similarity. If a region to be analyzed can be preset or a smaller region can be determined by target detection, dimension reduction can be carried out in this region. Nevertheless, taking the two-dimensional space as an example, as shown in Figure 2, in terms of increasing the spectral difference in a specific region, the method of spectral dimension reduction based on the region to be measured must be better than the method of dimension reduction for the whole hyperspectral image.

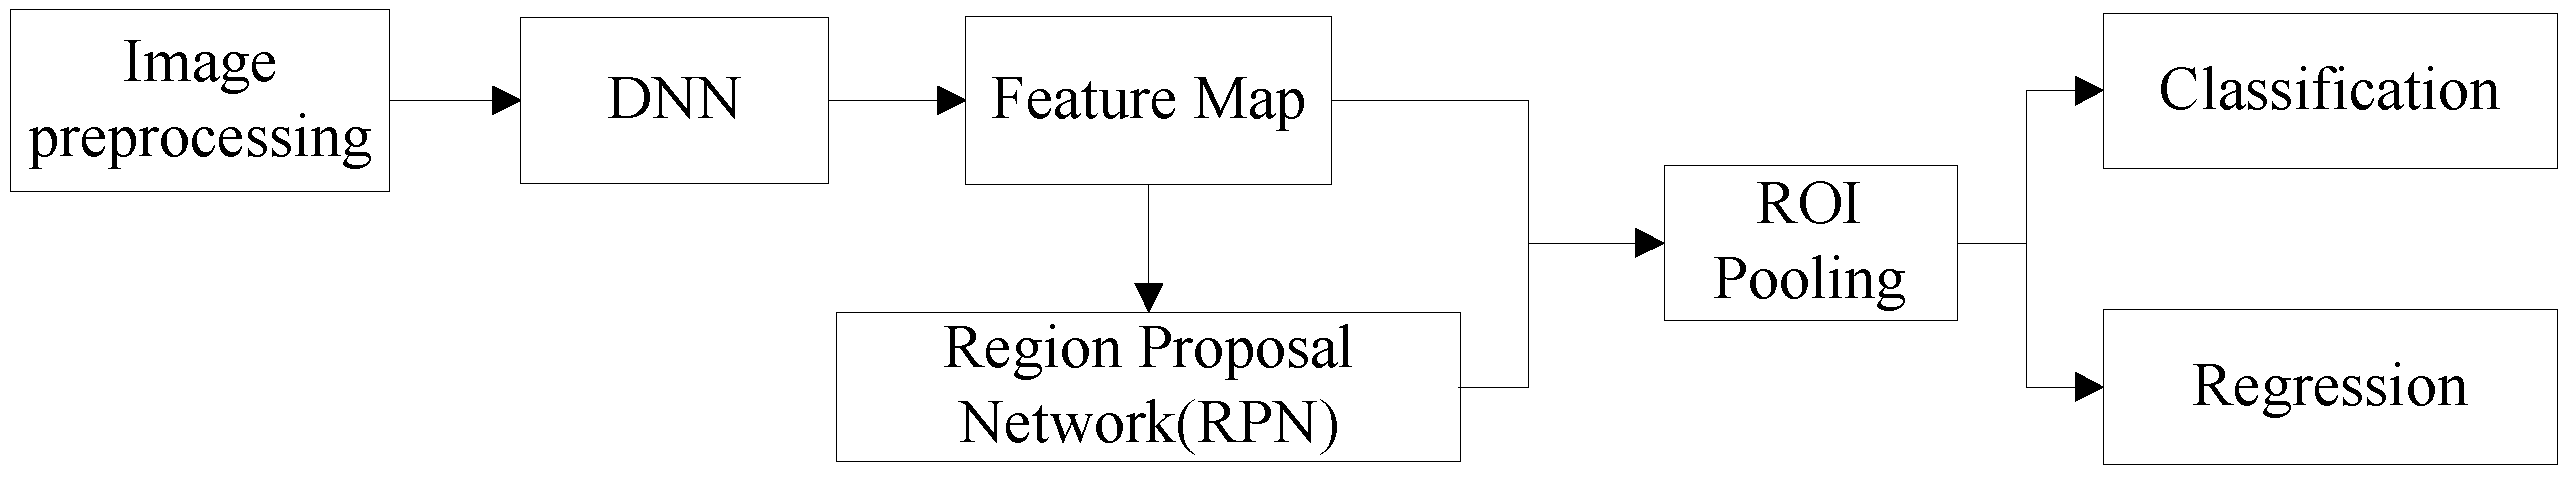
2.2. Target Detection Technology
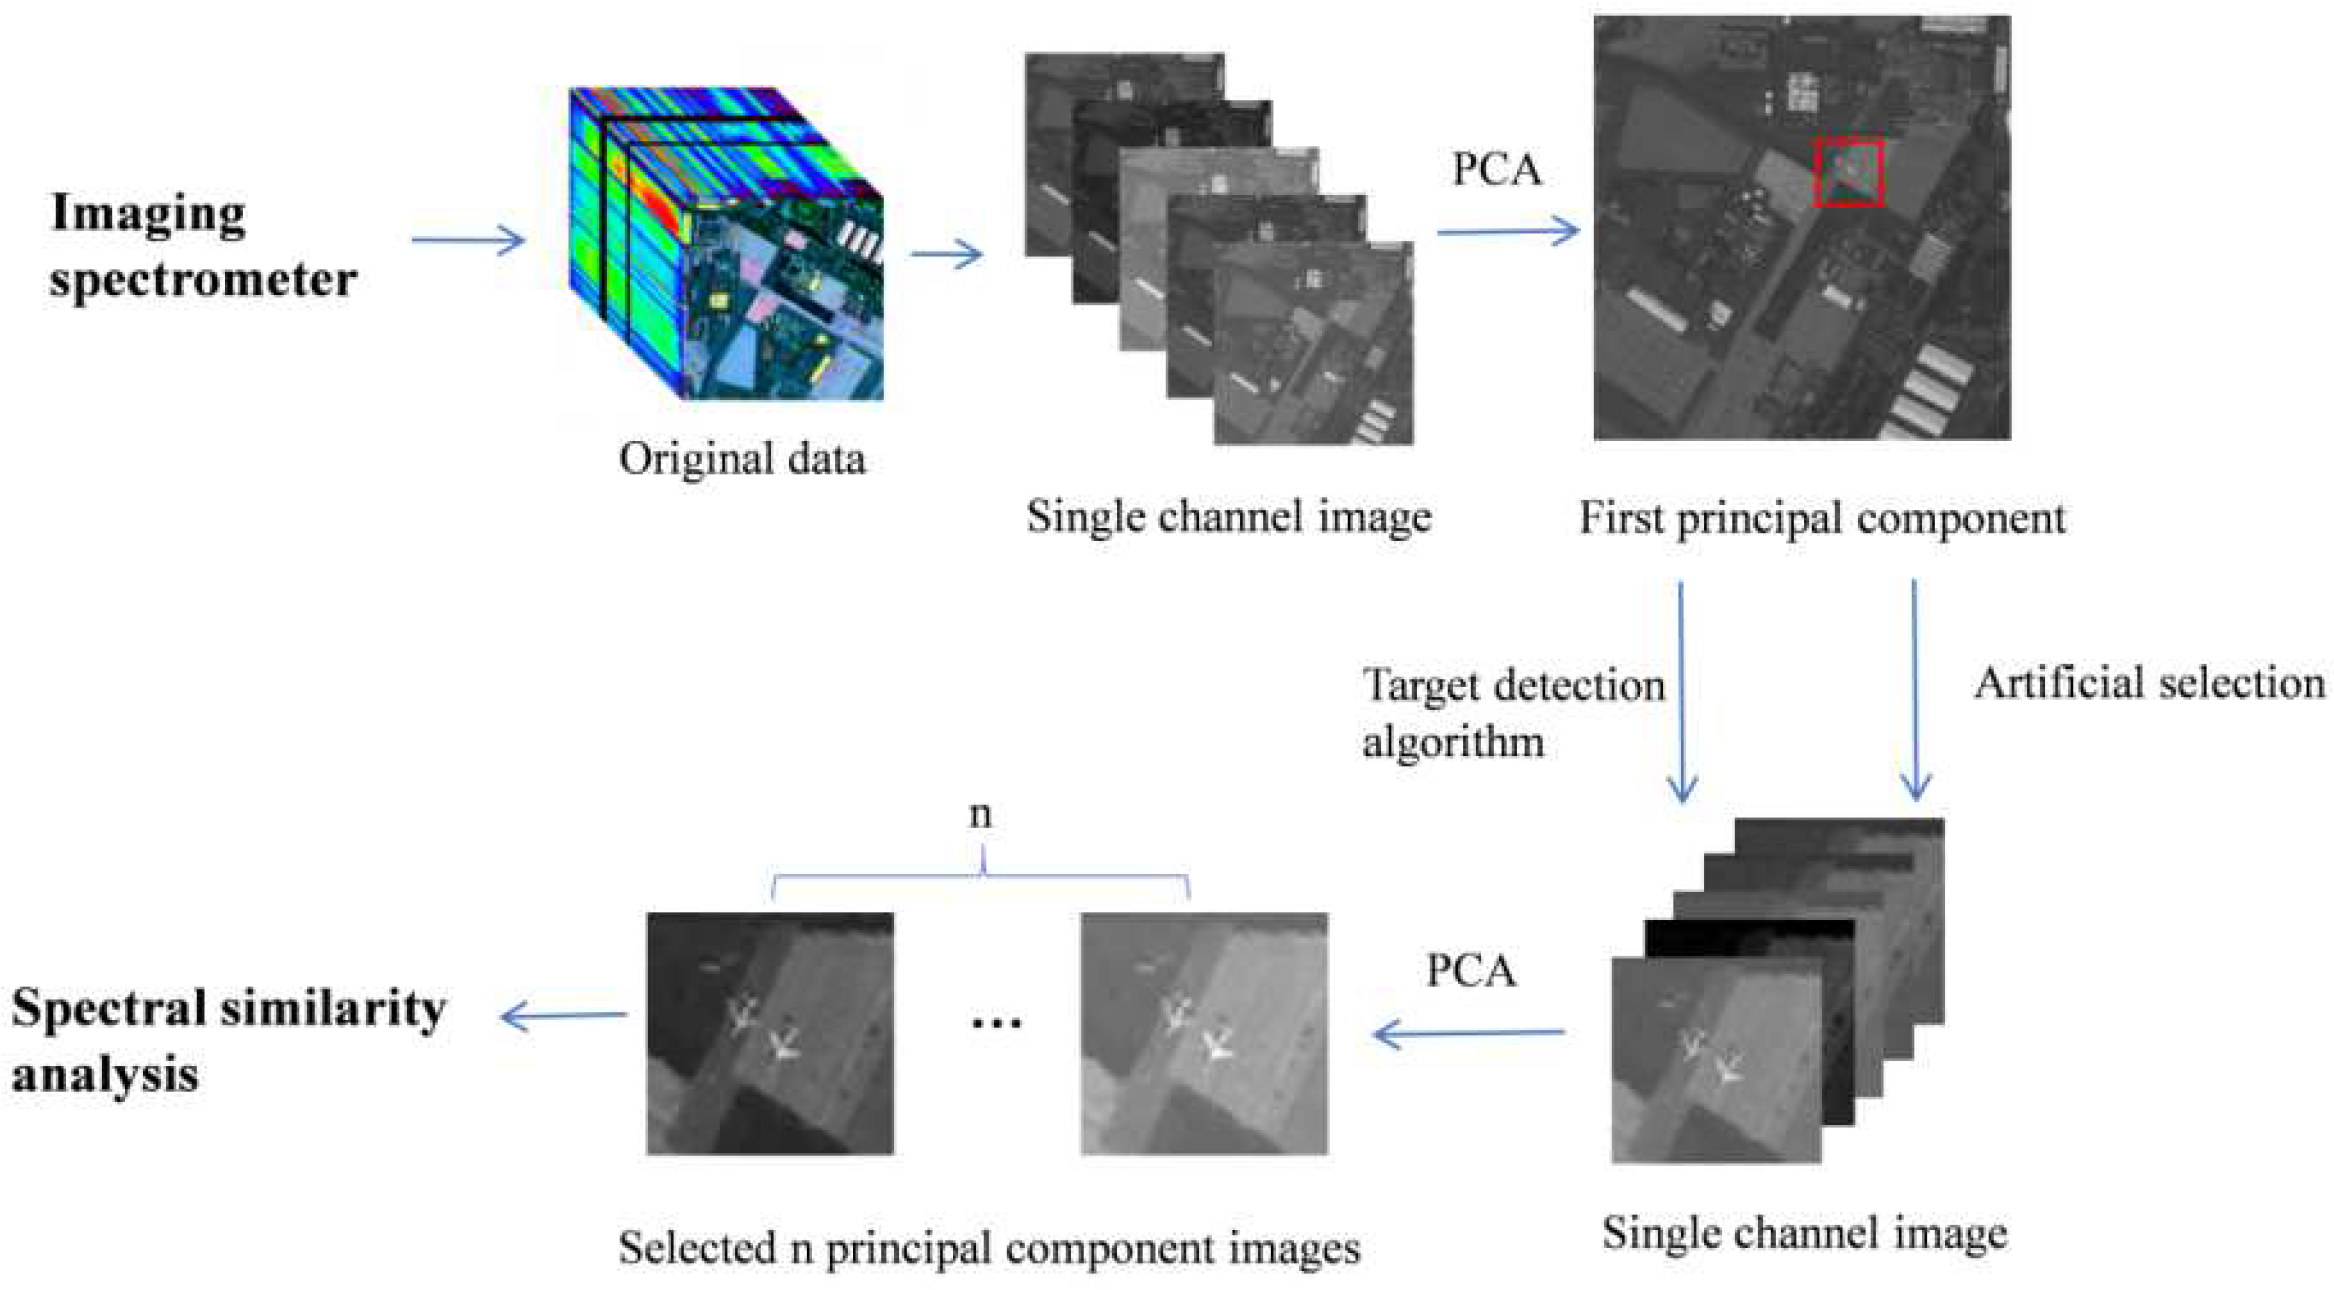
Target detection refers to the accurate positioning and classification of targets. It is important content in the field of computer vision and has important research value in video tracking, unmanned driving and so on [9,10]. The traditional target detection process is shown in Figure 3. This kind of algorithm mainly completes the model establishment by manually extracting features. Common features include a histogram of oriented gradient (HOG) and scale invariant feature transform (SIFT). After the feature extraction model is established, the classification task of support vector machine is carried out. However, due to the limitations of the feature model, the efficiency and accuracy of the whole detection process are low. With the establishment of large-scale data sets and the development of deep convolution neural network models in the field of image processing, target detection based on deep learning continues to develop, which is mainly divided into a two-stage target detection algorithm and a single-stage target detection algorithm. The two-stage target detection algorithm first extracts a candidate frame from an image, and then classifies and regresses the candidate region to obtain the detection results. The detection accuracy is high, but the detection speed is slow. The single-stage target detection algorithm uses the depth neural network to directly calculate the image and generate the detection results. The detection speed is fast, but the detection accuracy is low. Compared with the traditional target detection algorithm, the target detection algorithm based on deep learning relies on the deep learning of many data samples to train the network structure parameters. With the support of large data samples, it has better applicability to the changes in the target and background.
The Faster R-CNN algorithm is a typical two-stage target detection algorithm. The algorithm flow is shown in Figure 4. The Faster R-CNN algorithm adds a region proposal network (RPN) based on Faster R-CNN. The candidate window network extracts the candidate box by setting anchors of different scales, replaces the traditional candidate box generation methods such as selective search, realizes the end-to-end training of the network and improves the network computing speed [11]. Faster R-CNN has the advantages of a simple principle and method and high detection accuracy. It is widely used in various fields.
Although the target detection technology based on two-dimensional imaging has made rapid developments in feature extraction and detection speed, it is difficult to break through the limitation of two-dimensional space. Regarding the recognition of true and false targets, these target detection algorithms still have the thinking formula of “similarity is the same thing”, which cannot recognize the true and false targets. For example, when detecting military targets, it is difficult to distinguish between inflatable armored vehicles and real armored vehicles. Therefore, the corresponding tasks can be completed by combining spectral information with space target detection. In the experiment in this paper, the target detection algorithm based on Faster R-CNN only provides a way to determine the target area to be measured. It is worth mentioning that when determining the target area to be measured, the target with an obvious shape can be determined by using the target detection algorithm, but this is not unique. It can also be determined by using the spectral matching method and other prior information.

2.3. Method

In order to solve the problem that it is difficult to distinguish between a camouflaged target and a real target due to the high similarity between shapes and spectra, a method of comprehensive utilization of spatial shape information and spectrum information is proposed in this paper. Firstly, the original hyperspectral data were obtained by using an imaging spectrometer; secondly, the first principal component of the image was extracted by global principal component analysis; finally, the spatial distribution of ground objects in the image was analyzed. In the first principal component image, the target area to be tested was found by a manual selection or a target detection algorithm, the principal component analysis was performed again in the small area to reduce the dimension and the target type was distinguished by the similarity of the target to be tested in the selected n principal component images in the small area. The specific process is shown in Figure 5.

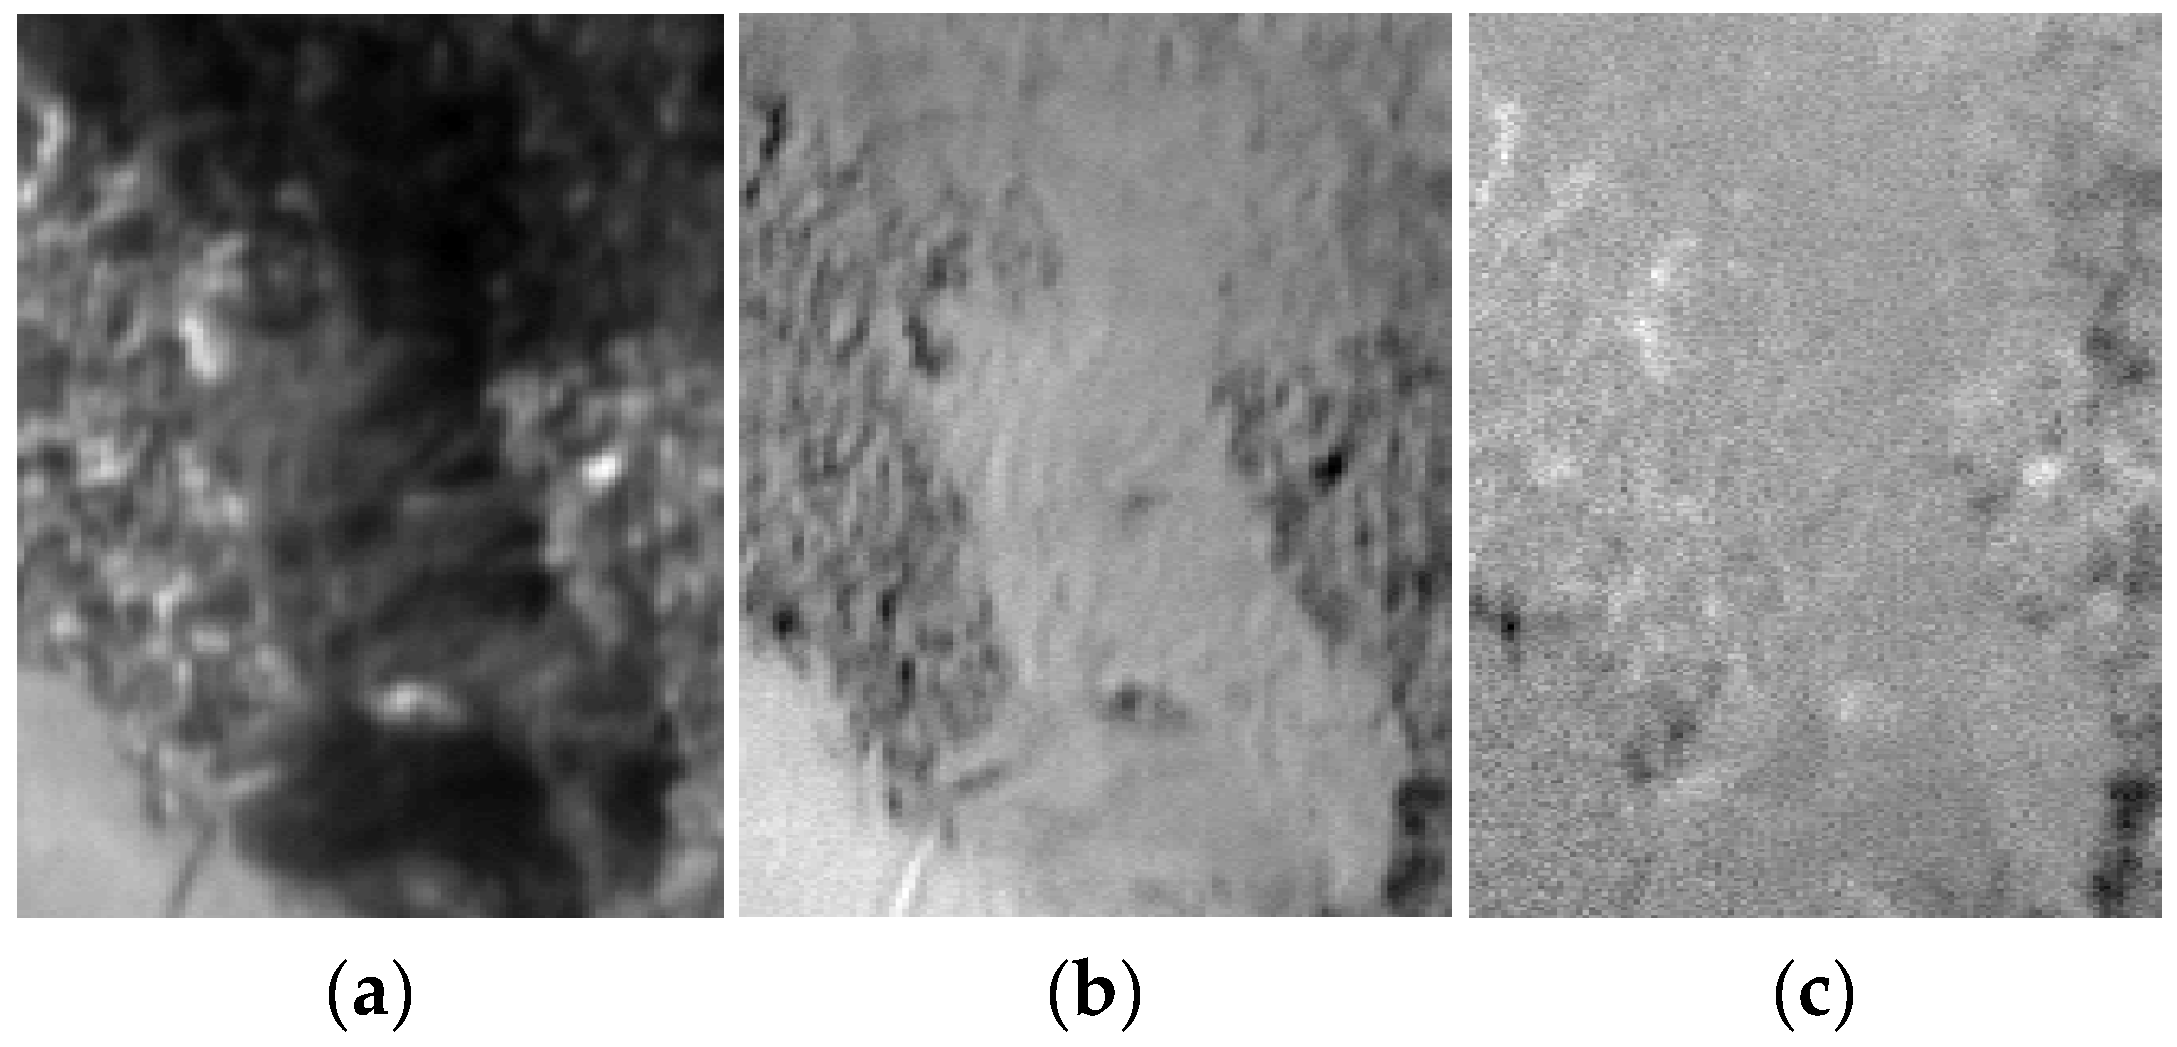
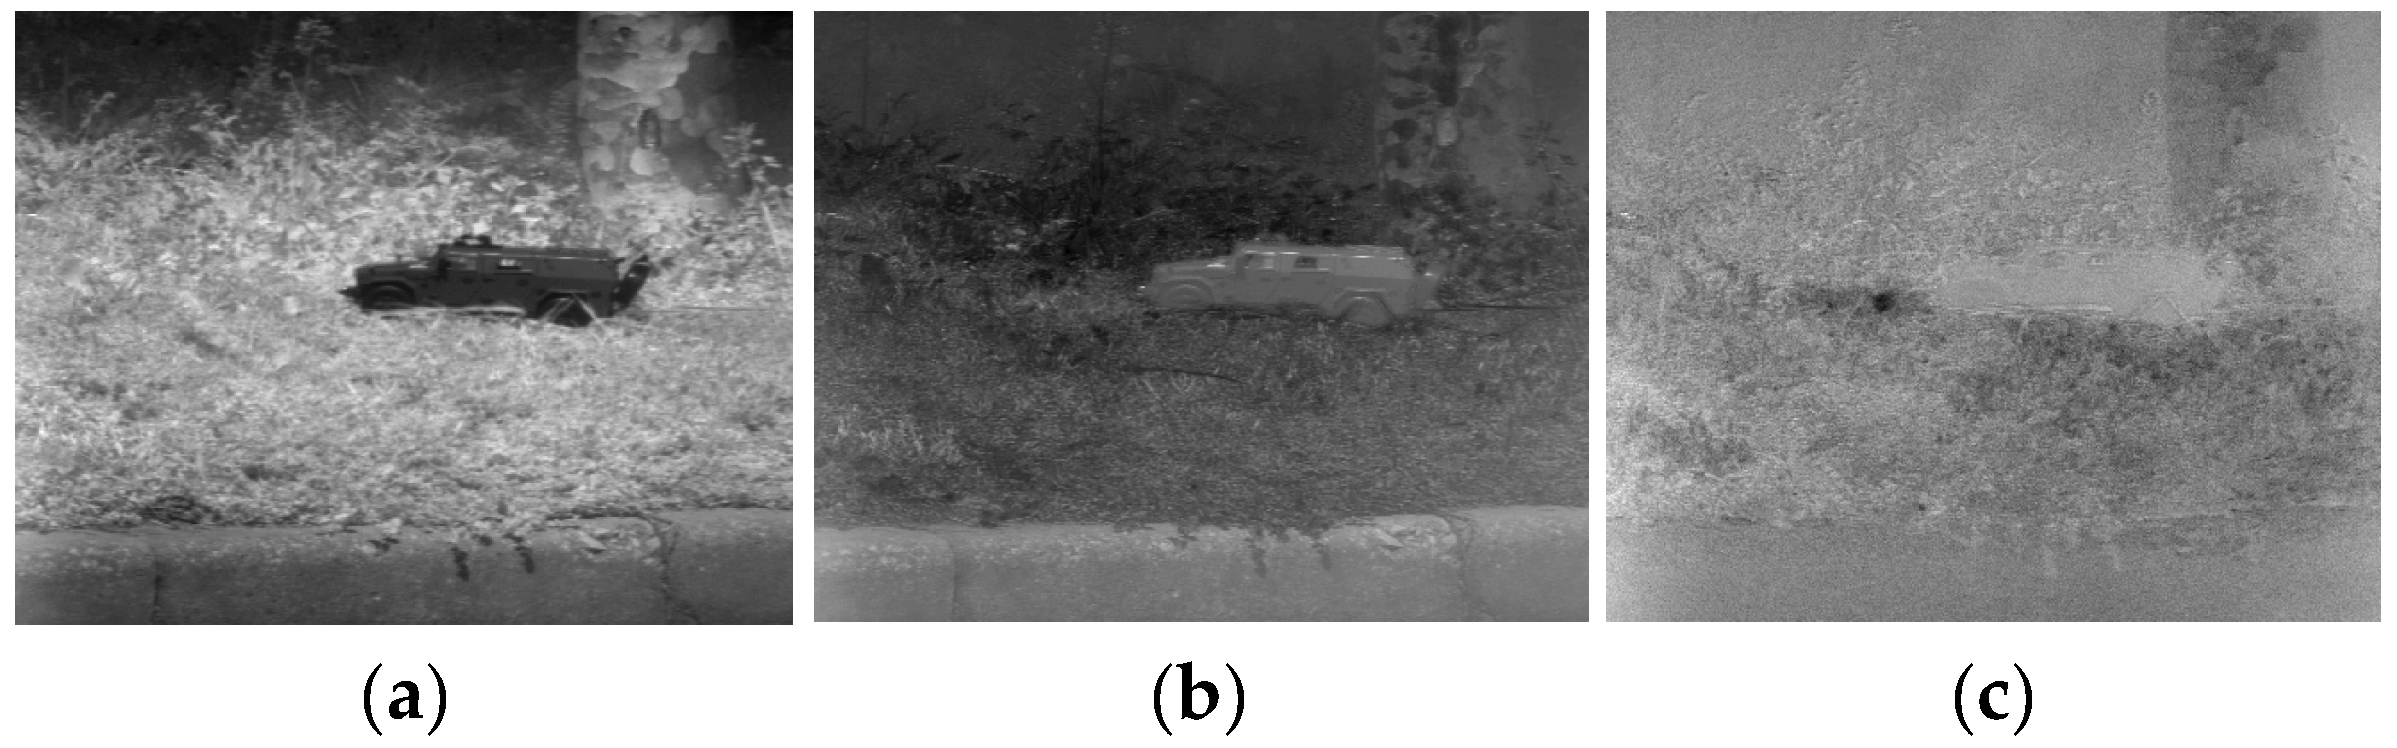
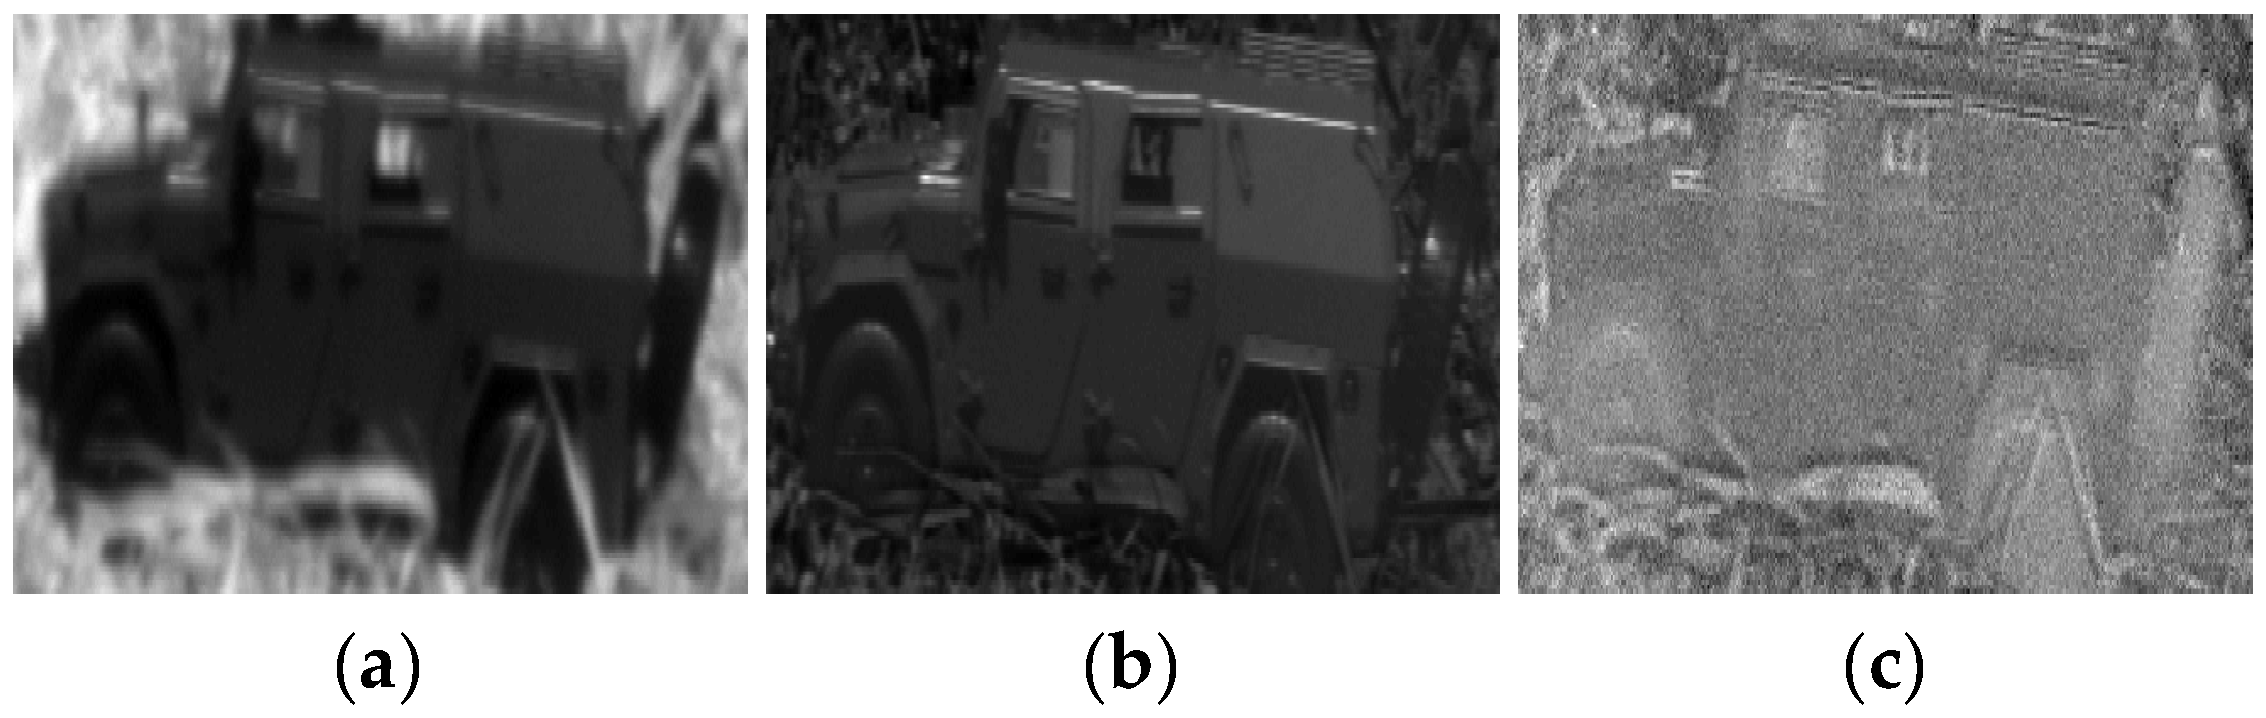
3. Experimental Results and Analysis

In order to make the experiment more convincing, it is necessary to use typical military targets and corresponding false targets for experiments. However, the detailed spectral information for military materials is secret. Therefore, this paper completes the training of a network structure by using the pictures of a model Mengshi off-road vehicle to prove that the true and false targets in hyperspectral images can frame the area to be measured by using the shape information. When verifying the method proposed in this paper, two groups of experiments are carried out to verify the proposed method. Two methods are adopted to determine the area to be measured. One is to determine the area to be measured by manual framing and select grass and camouflage clothing as the true and false targets. The other method uses Faster R-CNN to determine the area to be tested and selects jungle and camouflage warrior models as the true and false targets. Since the focus of this paper is to verify the effectiveness of the region dimension reduction method in camouflaged target recognition, and there are many ways to obtain the prior region, it is possible to design and carry out experiments in this way without involving secrets. Through this series of experiments, it is proved that the small area dimension reduction method based on a hyperspectral image can more effectively identify true and false targets.

3.1. Data Preparation

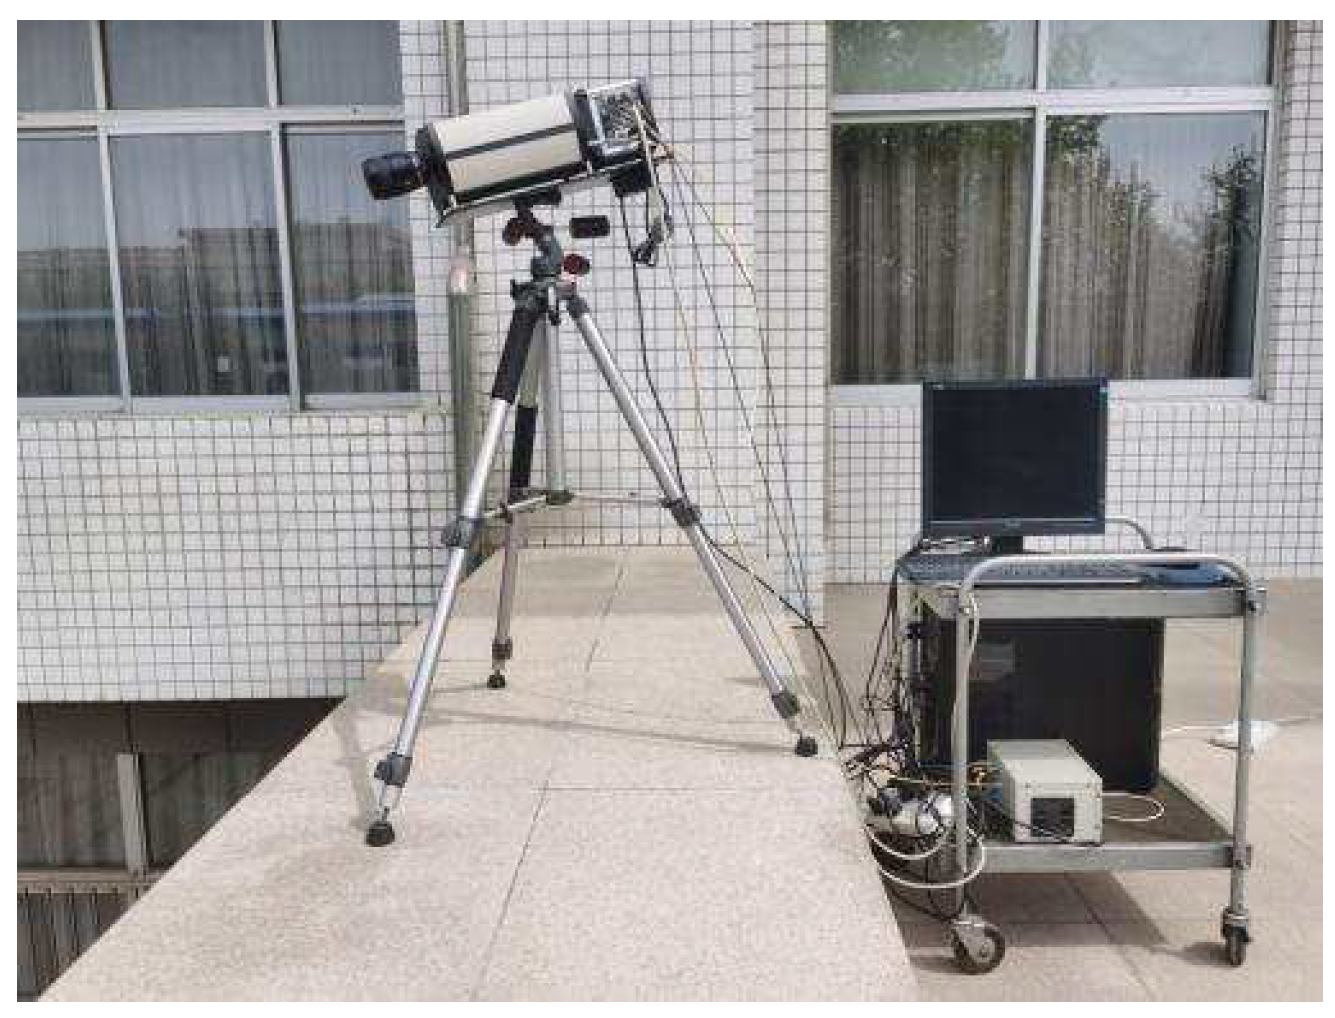
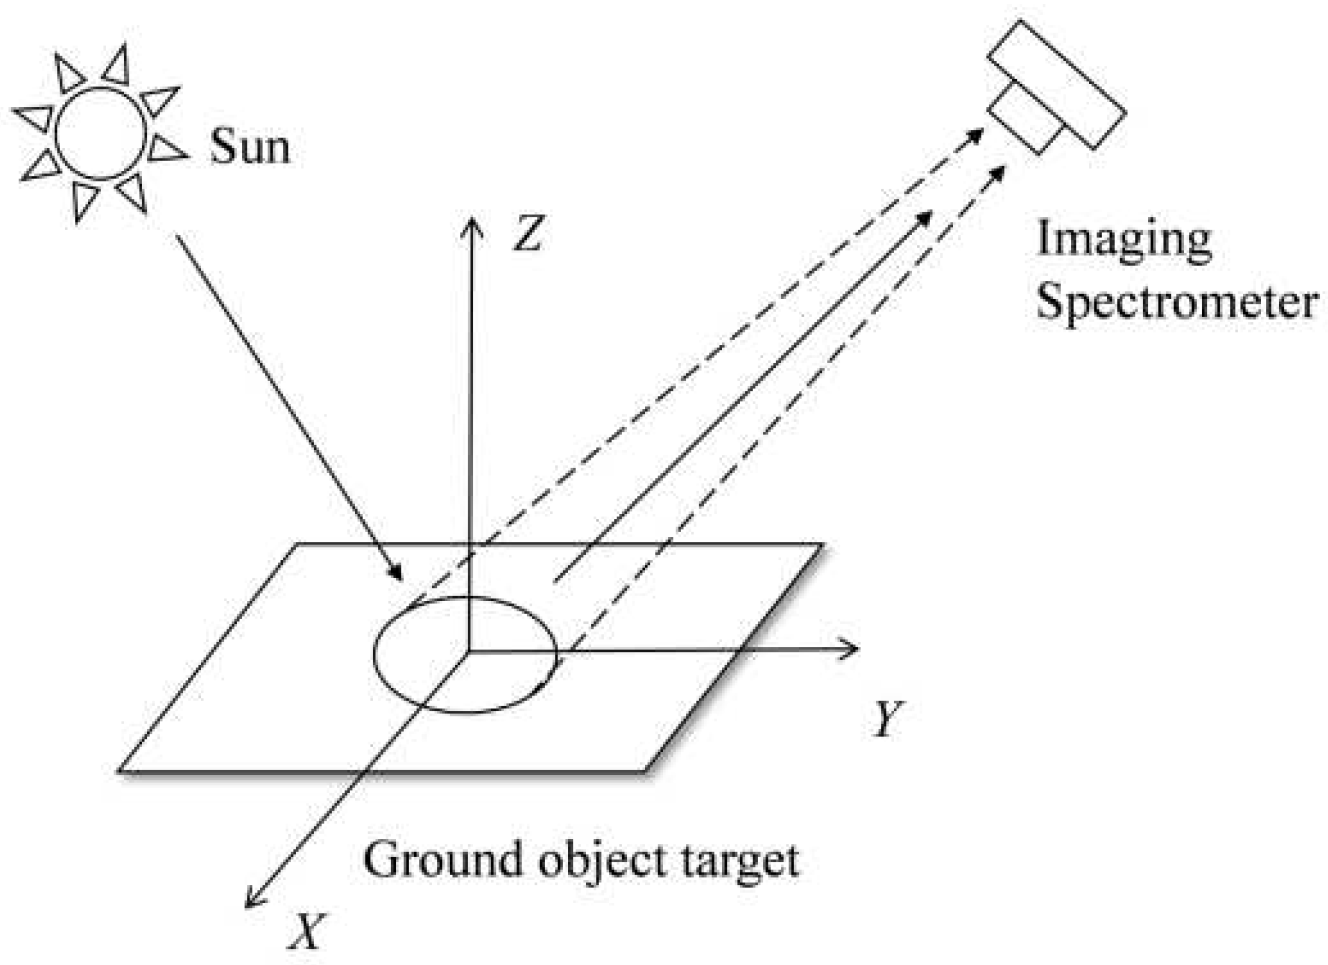
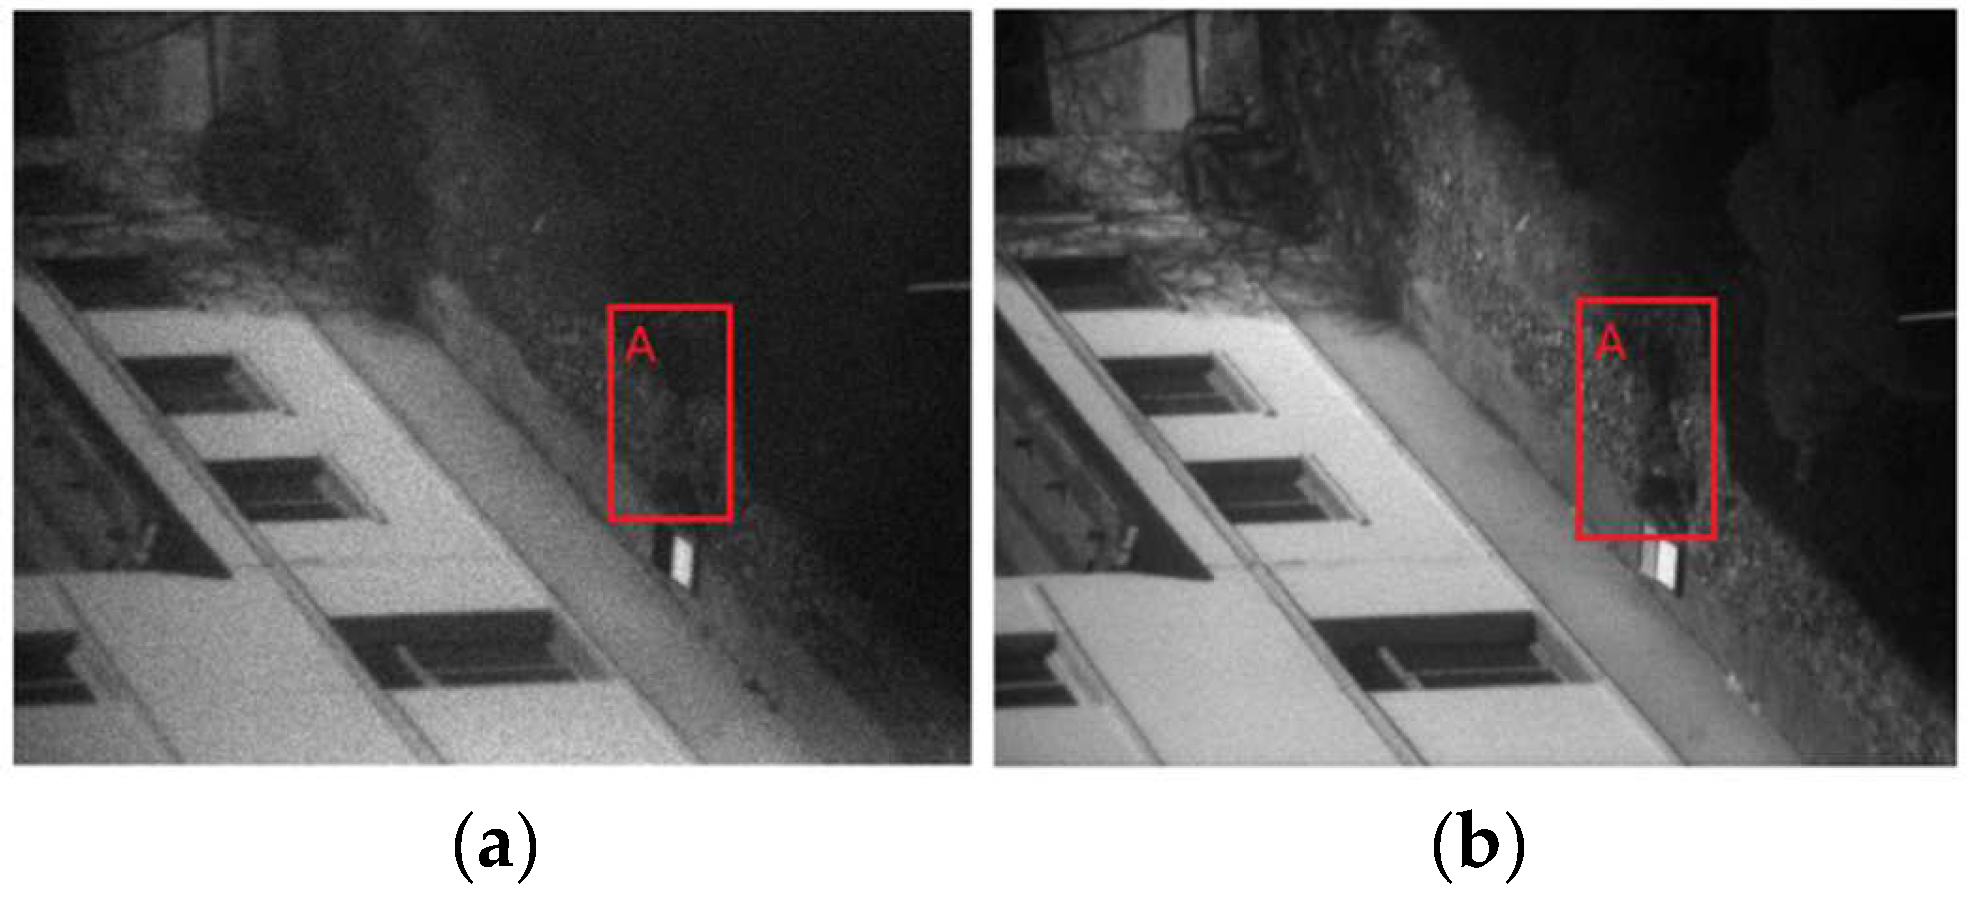
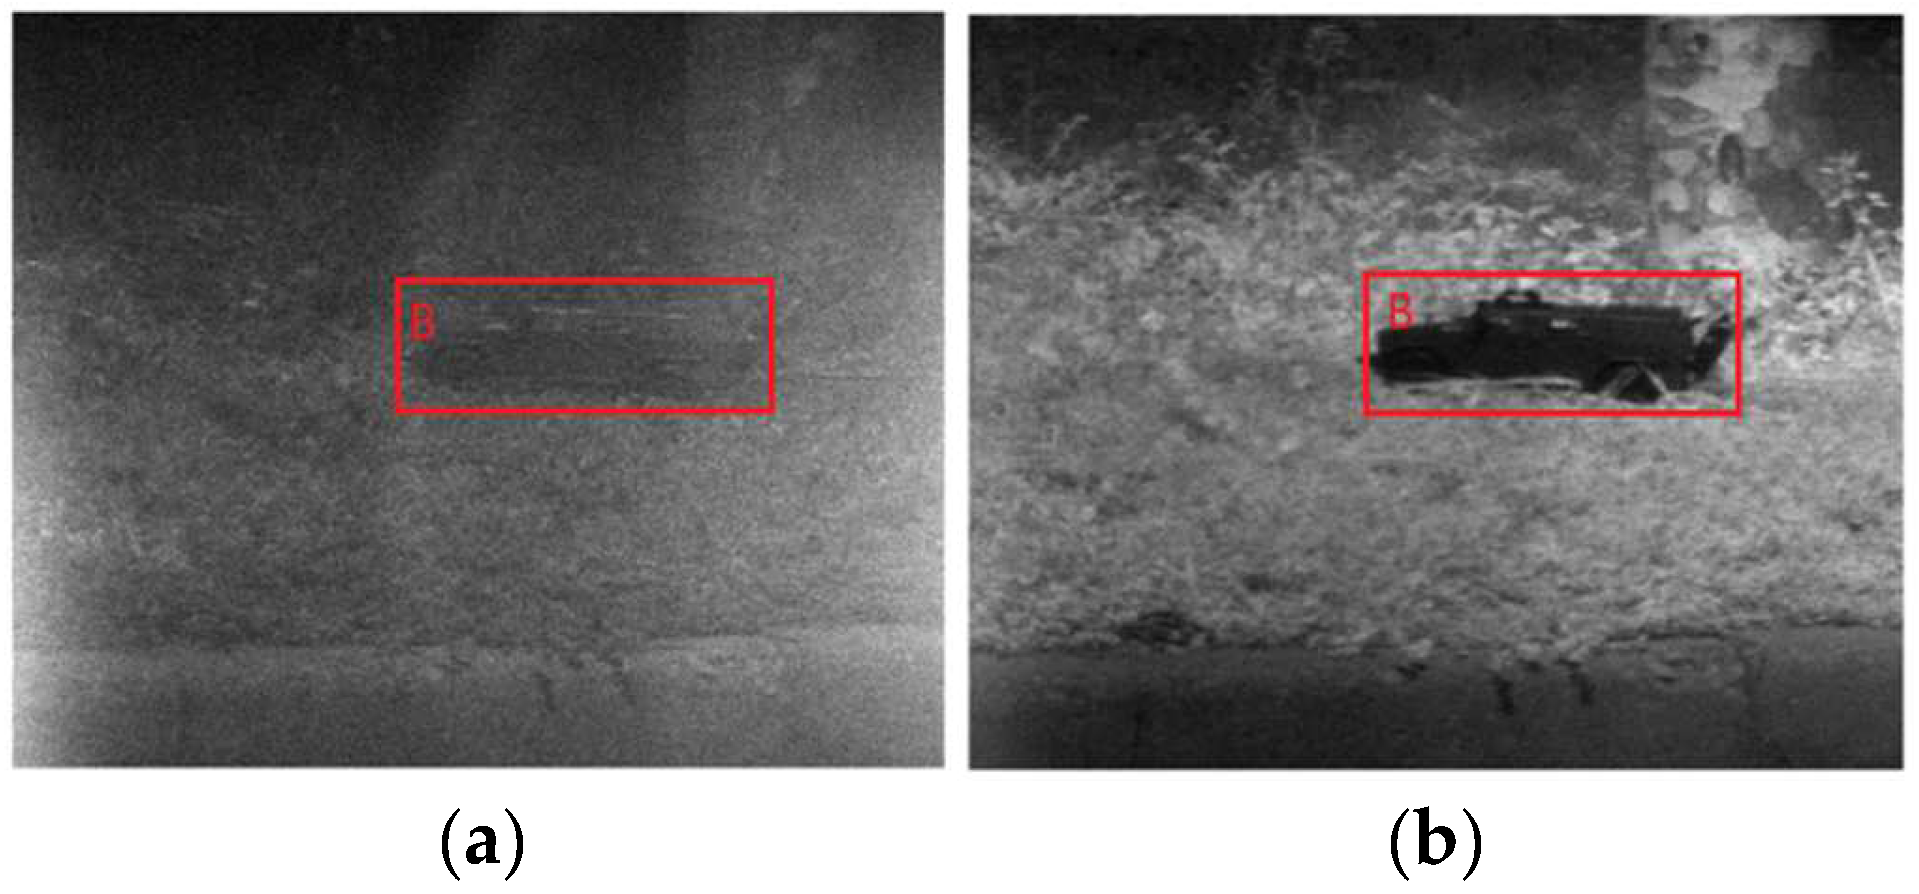
3.1.1. Acquisition of Hyperspectral Images

In this experiment, a His-300 imaging spectrometer based on an acousto-optical tunable filter (ATOF) is used. A series of equipment are shown in Figure 6. The imaging range is 440 nm–810 nm of the visible band, and the band interval is 4 nm. Before shooting, adjust the aperture and gain to enable the best imaging state for the spectrometer and use an image size of 1002 × 1002 pixels. The schematic diagram of the shooting scene is shown in Figure 7. The purpose is to obtain the hyperspectral image containing the spectral information of the ground object.

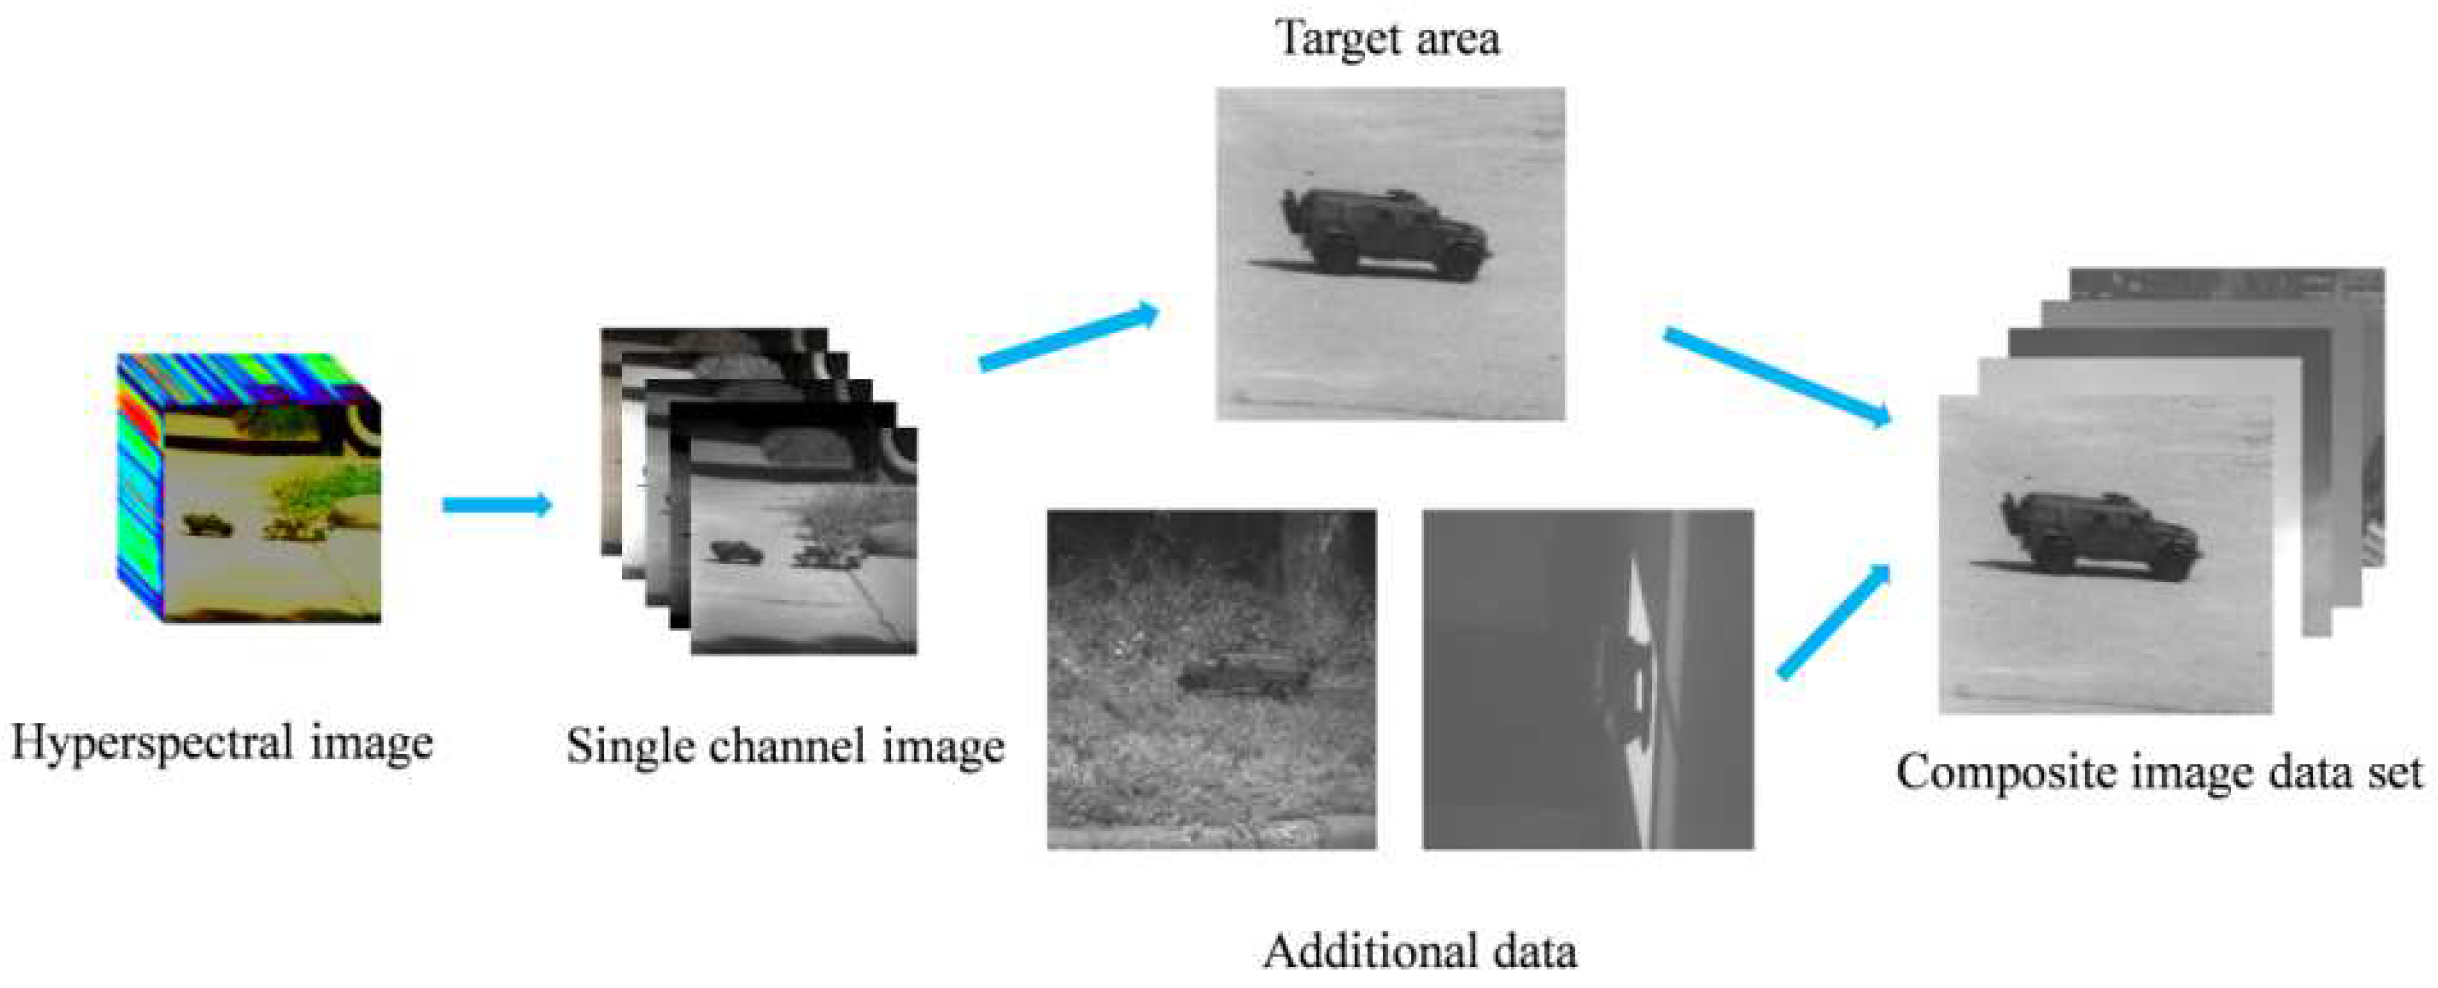
3.1.2. Data Expansion and Model Training

Target detection technology based on deep learning needs a lot of a prior training data. However, the number of hyperspectral images obtained by using an imaging spectrometer is very limited, so it is necessary to expand the data of hyperspectral images. There are many ways to expand the image data. See reference [12] for details. The expanded data set in this paper mainly includes the following parts: (i) the captured hyperspectral image; (ii) grayscale image containing target; (iii) the image obtained after clipping, rotation and noise processing. The composition of the data set is shown in Figure 8.
The expanded image data is trained by using the Faster R-CNN network model. A total of 600 images are trained. The first principal component image is used for testing, and the test results are shown in Figure 9. Limited by the number and type of training data, the detection effect is not very good, but it is enough to prove that hyperspectral images can be used for military target location and recognition and can frame a small area containing targets according to their shape information.

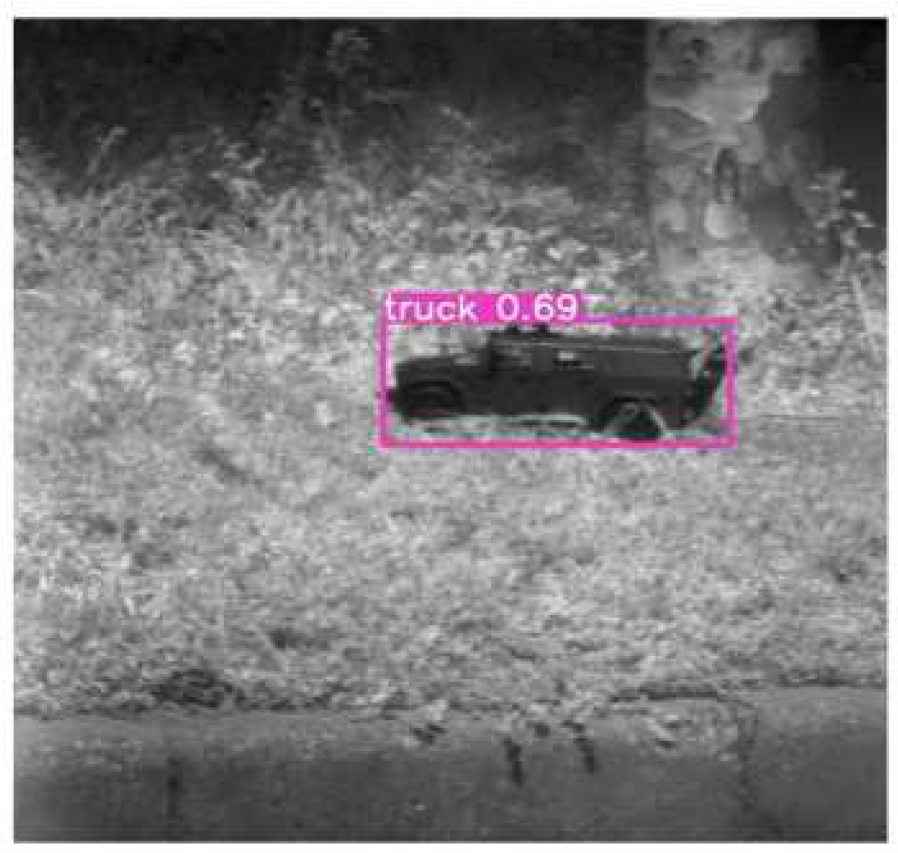
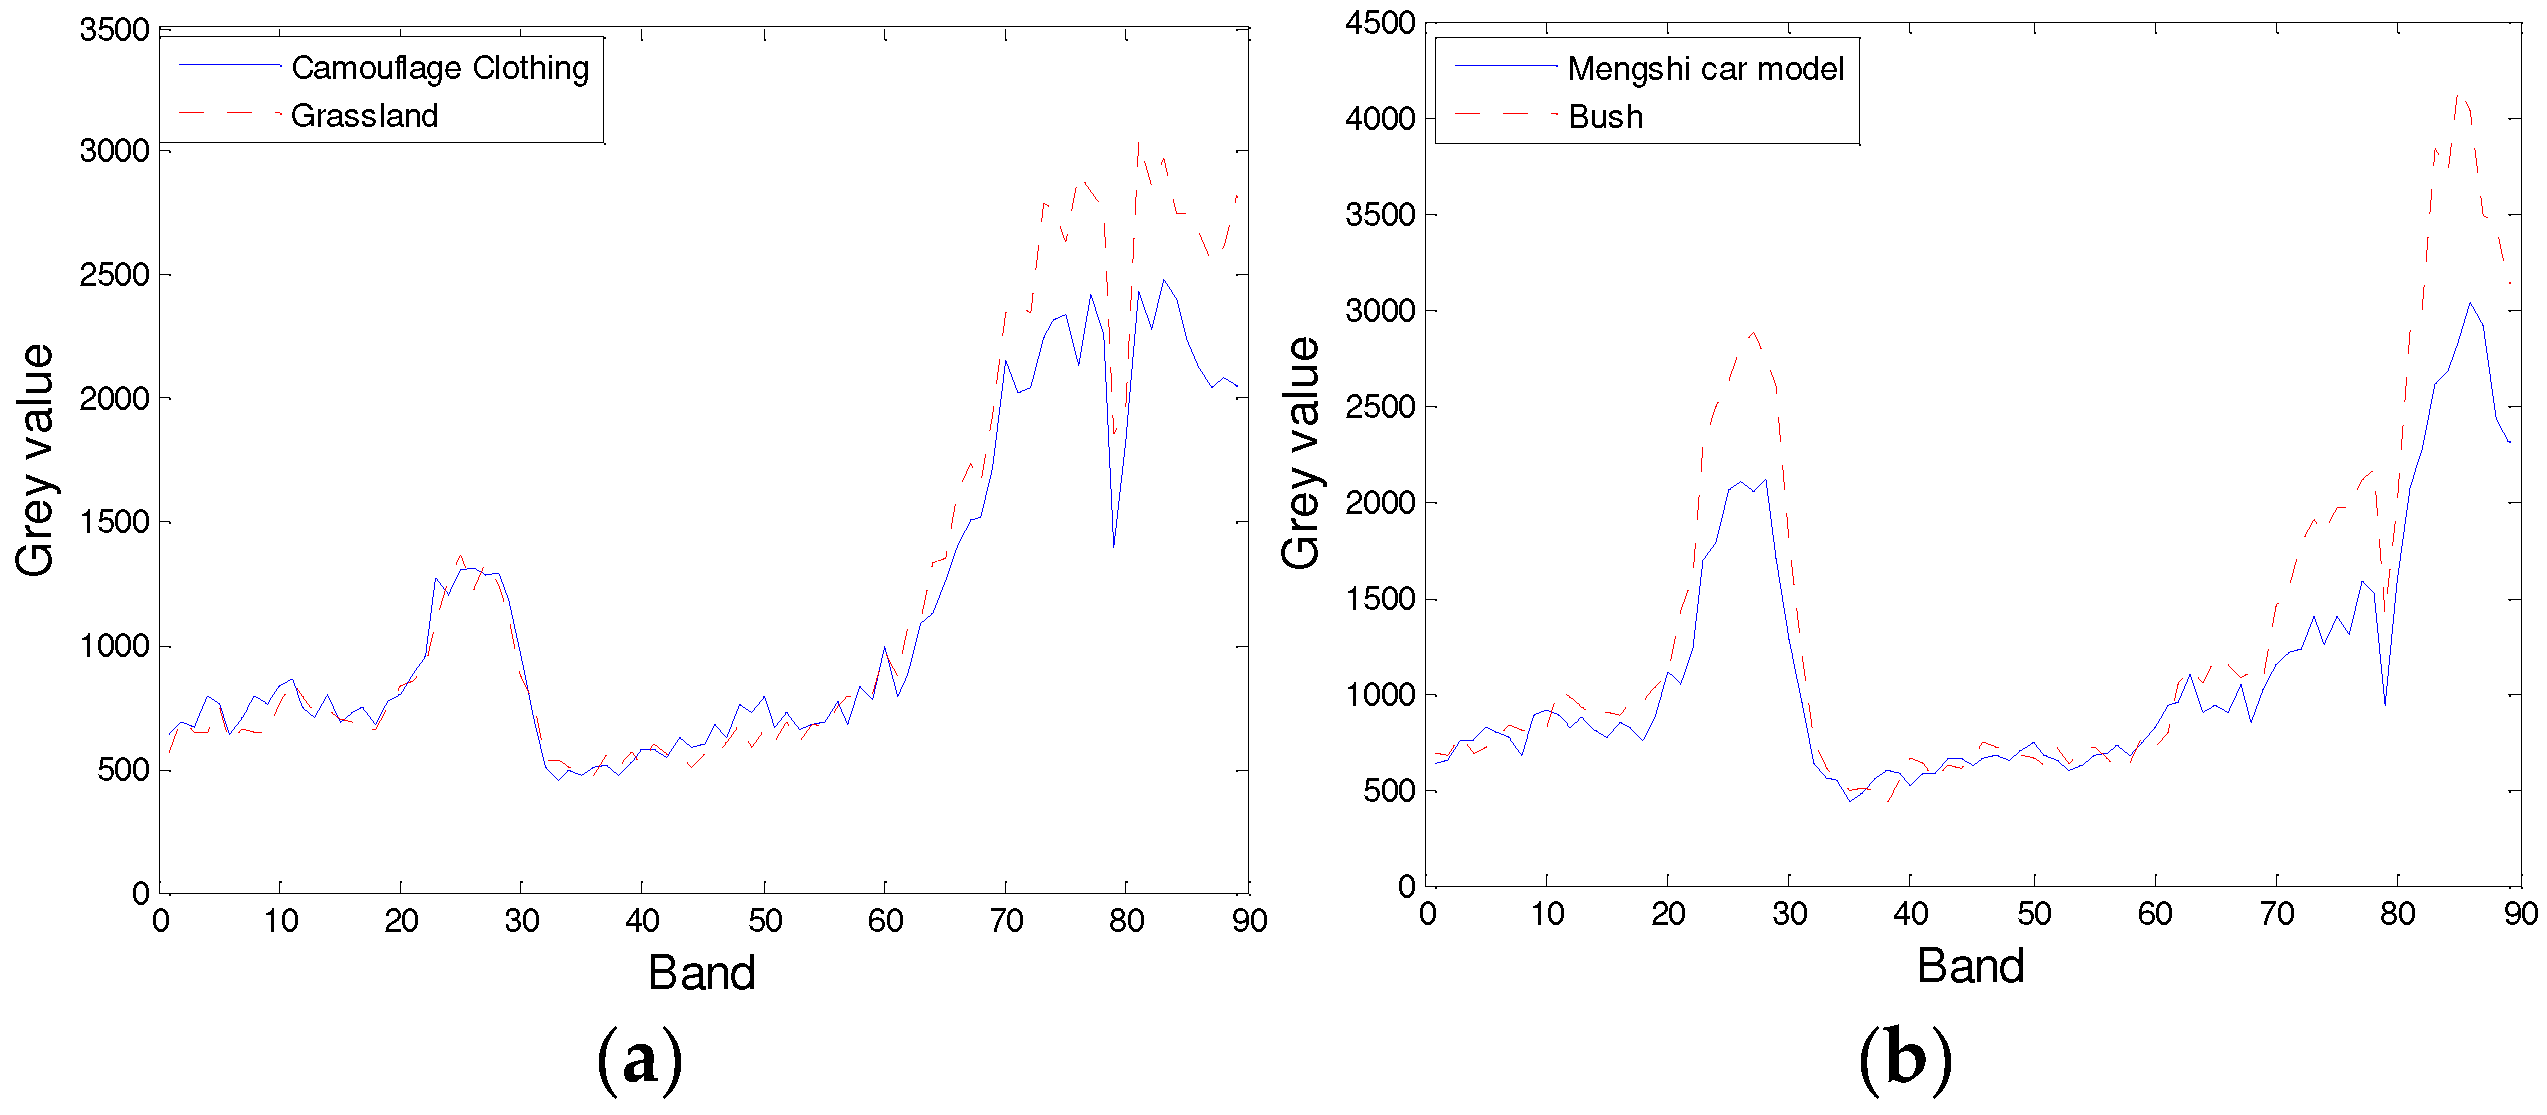
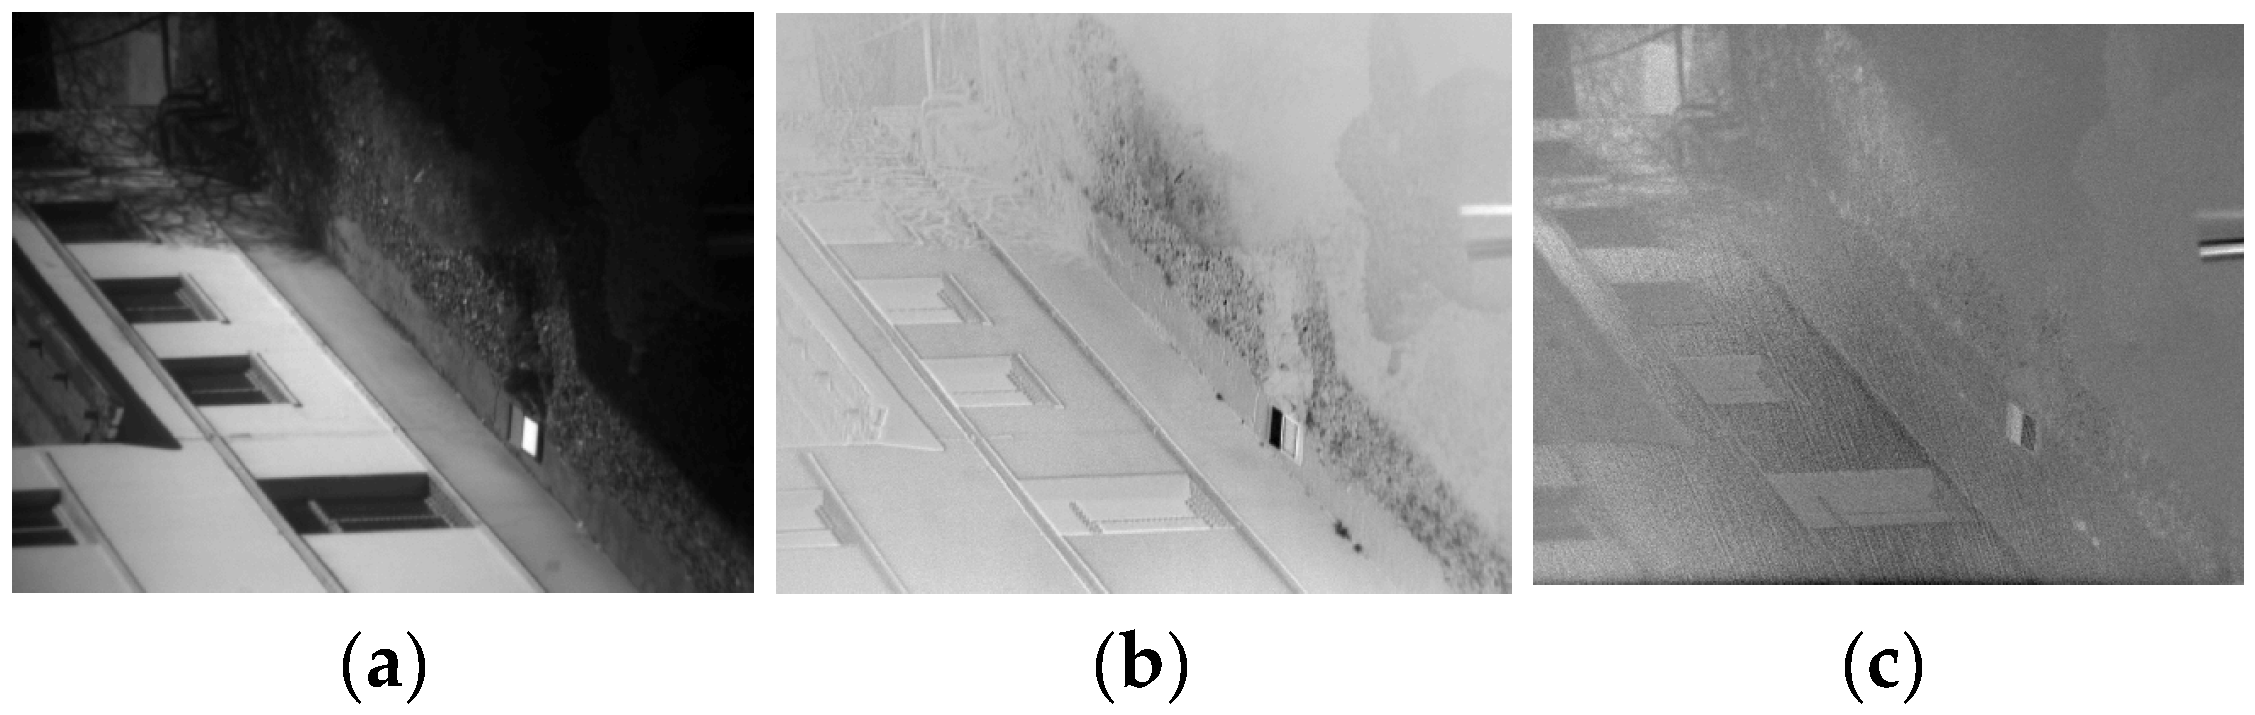
3.2. Further Experiment

The key to this method is to verify that the dimensionality reduction method in a small area can increase the discrimination of different types of targets. The first group of experiments used camouflage clothing and grass to simulate two types of targets. The gray scale of the experimental scene is shown in Figure 10. The scene is relatively complex. In the second group of experiments, jungle and camouflage warrior models are taken as two types of targets to be tested. The gray scale of the experimental scene is shown in Figure 11.
In the first group of experiments, there was a person wearing camouflage in the target area, and this area was marked as A. In the second group of experiments, there was a military vehicle in the target area, and this area was marked as B. It is obvious that the degree of target visibility is different in different wavelength bands, especially around 555 nm. Camouflage clothing and dry grass cannot be distinguished. Select the pixel area containing camouflage clothing and grass in area A, and select the pixel area containing jungle and vehicle in area B to obtain the curve containing spectral information, as shown in Figure 12.
For the first group of experiments, the target area is artificially calibrated. Firstly, a PCA is performed on the whole image to obtain the first three principal component images, as shown in Figure 13. Secondly, a PCA is performed for area A to be tested. The first three principal components of area A are shown in Figure 14.
The area to be measured in the second group of experiments is obtained according to the coordinate information in the target detection results. The first three principal component images obtained by the PCA method are shown in Figure 15. Subsequently, a PCA is performed on area B to be measured, and the first three principal components of area B are shown in Figure 16.
The commonly used curve similarity evaluation index parameters are used to measure the spectral similarity of two objects at the same pixel position after processing. The spectral angle metric (SAM) method [13] is a typical similarity measurement method based on projection. Its value corresponds to the cosine angle between the two curves, reflecting the shape difference between spectral curves. Root mean square error (RMSE) [14] is a typical distance-based similarity measurement method, which reflects the difference of spectral vector size between the two places. The two methods are used to evaluate the similarity of the original image data, the data after the PCA of the whole image and the data after the PCA of the area to be tested. The results of the first group of experiments are shown in Table 1. The results of the second group of experiments are shown in Table 2.
On the one hand, compared with the model vehicle in the forest, the similarity between the camouflage clothing and the grassland is higher, and the camouflage effect is better. On the other hand, the smaller the value of SAM and RMSE, the higher the similarity of the curve. Experiments show that the PCA of the whole image and the PCA of the area to be measured can reduce the similarity between different ground object types. The PCA processing of the area to be measured can more effectively reduce the spectral similarity of true and false targets and improve the spectral difference between ground objects.

4. Conclusions

The advantage of hyperspectral imaging technology is that it can classify and detect targets according to the diagnostic spectral information of ground objects. However, the development of camouflage materials reduces the difference between the shape and spectrum of true and false targets. In order to solve the problem of high spectral similarity between camouflaged objects and real objects, this paper proposes a method of spectral dimensionality reduction based on the area to be measured. There are many ways to determine the area to be measured. For the true and false targets with obvious shape features, the target detection technology can be used. For those whose shape features are not obvious enough, the specific area can be selected manually, or the target area can be determined using other ways. From the experimental results, the camouflaged target recognition method based on hyperspectral image regional dimension reduction analysis proposed in this paper can effectively reduce the spectral similarity of true and false targets. This method provides a new idea for true and false target recognition in the future.

Author Contributions

Methodology, J.Z. and B.Z.; software, J.Z.; investigation, G.W., J.L. and J.Y.; data curation, J.Z. and J.Y.; writing—original draft preparation, J.Z. and B.Z.; writing—review and editing, G.W., J.L. and J.Y. All authors contributed extensively to this manuscript. All authors have read and agreed to the published version of the manuscript.

Funding

This research received no external funding.

Institutional Review Board Statement

Not applicable.

Informed Consent Statement

Not applicable.

Data Availability Statement

The data set was obtained by the author and related personnel through the joint experiment with the field imaging spectrometer. The data belongs to the Department of Electronic and Optical Engineering of the Army University of Engineering and not a public dataset. The data are not made public due to copyright issues.

Conflicts of Interest

The authors declare no conflict of interest. The funders had no role in the design of the study; in the collection, analyses, or interpretation of data; in the writing of the manuscript, or in the decision to publish the results.

References

  1. Khan, M.J.; Khan, H.S.; Yousaf, A.; Khurshid, K.; Abbas, A. Modern trends in hyperspectral image analysis: A review. IEEE Access 2018, 6, 14118–14129. [Google Scholar] [CrossRef]
  2. Kruse, F.A.; Perry, S.L.; Caballero, A. District-level mineral survey using airborne hyperspectral data, los menucos, argentina. Ann. Geophys. 2006, 49, 83–92. [Google Scholar]
  3. Ang, L.M.; Seng, J.K.P. Big data and machine learning with hyperspectral information in agriculture. IEEE Access 2021, 9, 36699–36718. [Google Scholar] [CrossRef]
  4. Kumar, V.; Ghosh, J.K. Camouflage Detection Using MWIR Hyperspectral Images. J. Indian Soc. Remote Sens. 2017, 45, 139–145. [Google Scholar] [CrossRef]
  5. Yan, Y.; Hua, W.H.; Zhang, Y.; Cui, Z.H.; Wu, X.S.; Liu, X. Characteristic analysis of visible near infrared hyperspectral camouflage target. Infrared Technol. 2019, 41, 171–175. [Google Scholar]
  6. Shen, Y.; Li, J.; Lin, W.; Chen, L.; Huang, F.; Wang, S. Camouflaged Target Detection Based on Snapshot Multispectral Imaging. Remote Sens. 2021, 13, 3949. [Google Scholar] [CrossRef]
  7. Ettabaa, K.S.; Salem, M.B. Adaptive progressive band selection for dimensionality reduction in hyperspectral images. J. Indian Soc. Remote Sens. 2018, 46, 157–167. [Google Scholar] [CrossRef]
  8. Uddin, M.P.; Al Mamun, M.A.; Hossain, M.A. PCA-based feature reduction for hyperspectral remote sensing image classification. IETE Tech. Rev. 2020, 38, 377–396. [Google Scholar] [CrossRef]
  9. Li, Y.K.; Chu, L.; Zhang, Y.; Guo, C.; Fu, Z.; Gao, J.B. Intelligent transportation video tracking technology based on computer and image processing technology. J. Intell. Fuzzy Syst. 2019, 37, 3347–3356. [Google Scholar] [CrossRef]
  10. Karmakar, G.; Chowdhury, A.; Das, R.; Kamruzzaman, J.; Islam, S. Assessing trust level of a driverless car using deep learning. IEEE Trans. Intell. Transp. Syst. 2021, 22, 4457–4466. [Google Scholar] [CrossRef]
  11. Ren, S.Q.; He, K.M.; Girshick, R.; Sun, J. Faster r-cnn: Towards real-time object detection with region proposal networks. IEEE Trans. Pattern Anal. Mach. Intell. 2017, 39, 1137–1149. [Google Scholar] [CrossRef] [PubMed]
  12. Li, W.; Chen, C.; Zhang, M.M.; Li, H.C.; Du, Q. Data augmentation for hyperspectral image classification with deep cnn. IEEE Geosci. Remote Sens. Lett. 2019, 16, 593–597. [Google Scholar] [CrossRef]
  13. Chang, C.I.; Heinz, D.C. Constrained subpixel target detection for remotely sensed imagery. IEEE Trans. Geosci. Remote Sens. 2000, 38, 1144–1159. [Google Scholar] [CrossRef]
  14. Varmuza, K.; Karlovits, M.; Demuth, W. Spectral similarity versus structural similarity: Infrared spectroscopy. Anal. Chim. Acta. 2003, 490, 313–324. [Google Scholar] [CrossRef]
Figure 1. Schematic diagram of the PCA method.
Photonics 09 00640 g001
Figure 2. The PCA method based on the area to be tested.
Photonics 09 00640 g002
Figure 3. Traditional target detection algorithm.
Photonics 09 00640 g003
Figure 4. Faster R-CNN algorithm structure.
Photonics 09 00640 g004
Figure 5. Target recognition process based on dimension reduction analysis of the hyperspectral image region.
Photonics 09 00640 g005
Figure 6. Imaging spectrometer.
Photonics 09 00640 g006
Figure 7. Schematic diagram of shooting scene.
Photonics 09 00640 g007
Figure 8. Composition of hyperspectral image data set.
Photonics 09 00640 g008
Figure 9. Test results of a Mengshi vehicle.
Photonics 09 00640 g009
Figure 10. Grayscale images of experimental scenes under different wavelength channels in the first group of experiments. (a) Grayscale image of the experimental scene under a 609 nm channel. (b) Grayscale image of the experimental scene under a 769 nm channel.
Photonics 09 00640 g010
Figure 11. Grayscale images of experimental scenes under different wavelength channels in the second group of experiments. (a) Grayscale image of the experimental scene under a 609 nm channel. (b) Grayscale image of the experimental scene under a 769 nm channel.
Photonics 09 00640 g011
Figure 12. Spectral information curves of different objects. (a) Spectral information curves of Camouflage clothing and grassland. (b) Spectral information curves of Mengshi car model and bush.
Photonics 09 00640 g012
Figure 13. The first three principal component images after the PCA of the whole image in the first set of experiments. (a) The first principal component image, (b) The second principal component image, (c) The third principal component image.
Photonics 09 00640 g013
Figure 14. The first three principal component images of area A to be tested after PCA. (a) The first principal component image of area A, (b) The second principal component image of area A, (c) The third principal component image of area A.
Photonics 09 00640 g014
Figure 15. The first three principal component images after the PCA of the whole image in the second set of experiments. (a) The first principal component image, (b) The second principal component image, (c) The third principal component image.
Photonics 09 00640 g015
Figure 16. The first three principal component images of area B to be tested after PCA. (a) The first principal component image of area B, (b) The second principal component image of area B, (c) The third principal component image of area B.
Photonics 09 00640 g016
Table 1. Similarity comparison between camouflage clothing and grassland.
Based on Raw Image DataThe Whole Image after PCAThe Area to Be Measured after PCA
SAM0.11510.35010.8393
RMSE247.170890.1712169.599
Table 2. Similarity comparison between the Mengshi car model and bush.
Based on Raw Image DataThe Whole Image after PCAThe Area to Be Measured after PCA
SAM0.12550.42580.9107
RMSE268.503951.9872387.971
Publisher’s Note: MDPI stays neutral with regard to jurisdictional claims in published maps and institutional affiliations.

