Article

CO2 Gas Temperature Sensing near Room Temperature by a Quantum Cascade Laser in Inter Pulse Mode

1
Department of Physics, Technische Universität Dresden, 01062 Dresden, Germany
2
Physikalisch-Technische Bundesanstalt, 10587 Berlin, Germany
3
Department of Physics, Freie Universität Berlin, 14195 Berlin, Germany
*
Author to whom correspondence should be addressed.
Deceased author.
Photonics 2022, 9(7), 465; https://doi.org/10.3390/photonics9070465
Submission received: 25 May 2022 / Revised: 27 June 2022 / Accepted: 30 June 2022 / Published: 2 July 2022
(This article belongs to the Special Issue Mid-Infrared Quantum Cascade Lasers)

Abstract

:
A non-invasive CO2 gas temperature sensing technique at or close to the room temperature range based on quantum cascade laser absorption spectroscopy is presented. The method probes thermally populated ground state and hot-band rotational-vibrational transitions of CO2 in the frequency range from 2349 to 2351 cm−1 from which the gas temperature is obtained from Boltzmann statistics. Transmission spectra are recorded by injection-current driven frequency-scans, the so-called inter pulse mode, of a pulsed distributed feedback quantum cascade laser. The statistical uncertainty (1 σ ) in temperature for single frequency scans with time resolution of 10 ms is 4 K and can be further reduced down to ∼50 mK by long-time averaging of about 1 min. The technique is evaluated with particular emphasis on implementation, data acquisition, data analysis and potential improvements.

1. Introduction

Recent improvements in the development of quantum cascade (QC) lasers [1] as strong mid infrared (IR) sources have triggered the use of these lasers for sensing of IR active gases [2,3]. Among these sensing applications is the measurement of gas concentration and temperature, where the basic principle relies on absorption due to discrete fundamental vibrational-rotational transitions of the medium of interest. Two key advantages of quantum cascade laser absorption spectroscopy (QCLAS) are high sensitivity and short response-time. The latter follows from its non-invasive character and allows for real-time in situ measurements.
Ro-vibrational cross sections of gases are generally sensitive to temperature, which inherently makes the determination of gas concentrations from specific spectral absorption lines prone to errors in case the temperature of the medium is unknown. From an application point of view, this issue is particularly relevant if strongly temperature sensitive transitions are probed in a highly dynamic system with gas temperature variations that are too fast to be resolved by conventional temperature sensors like thermocouple elements or platinum resistance thermometers. The need for fast measurements of the gas temperature is thus twofold: first, as a fundamentally important gas parameter itself; and second, to disentangle the effect of temperature in the quantification of gas concentrations by laser absorption spectroscopy in order to improve accuracy for highly dynamic systems.
Temperature sensors based on tunable diode-laser absorption measurements have been widely applied in the investigation of plasma [4,5] and combustion processes (see, e.g., Refs. [6,7,8,9,10,11]), whereby the great majority of works focusses on gases at elevated temperatures. Farooq et al., for instance, applied a continuous-wavelength diode laser to measure time-histories of CO2 gas temperature at typical combustion temperatures (400–1100 K) [6]. This study reports an accuracy of about 1.8% over the temperature range studied. However, reports on fast measurements close to room temperature are scarce [5], although there is growing demand in, e.g., breath gas analysis [12,13] and biomedical diagnostics [14], the detection of explosives [15], online car exhaust monitoring [16], atmospheric research [17], process control in pharmaceutical industry, or food processing technology.
In the present paper, we report on a QC laser based absorption technique that determines the temperature of CO2 gas or CO2-containing mixtures. The main goal of this study was to investigate the feasibility of fast high precision measurements in the room temperature regime. The method probes strongly temperature-dependent fundamental and “hot band” CO2 absorption lines by injection-current driven frequency-sweeps of a distributed feedback QC laser in inter pulse mode operation [18,19,20] with a period time of about 10 ms. We demonstrate measurements in the temperature range from 22 to 45 °C and discuss the method with respect to potential improvements.

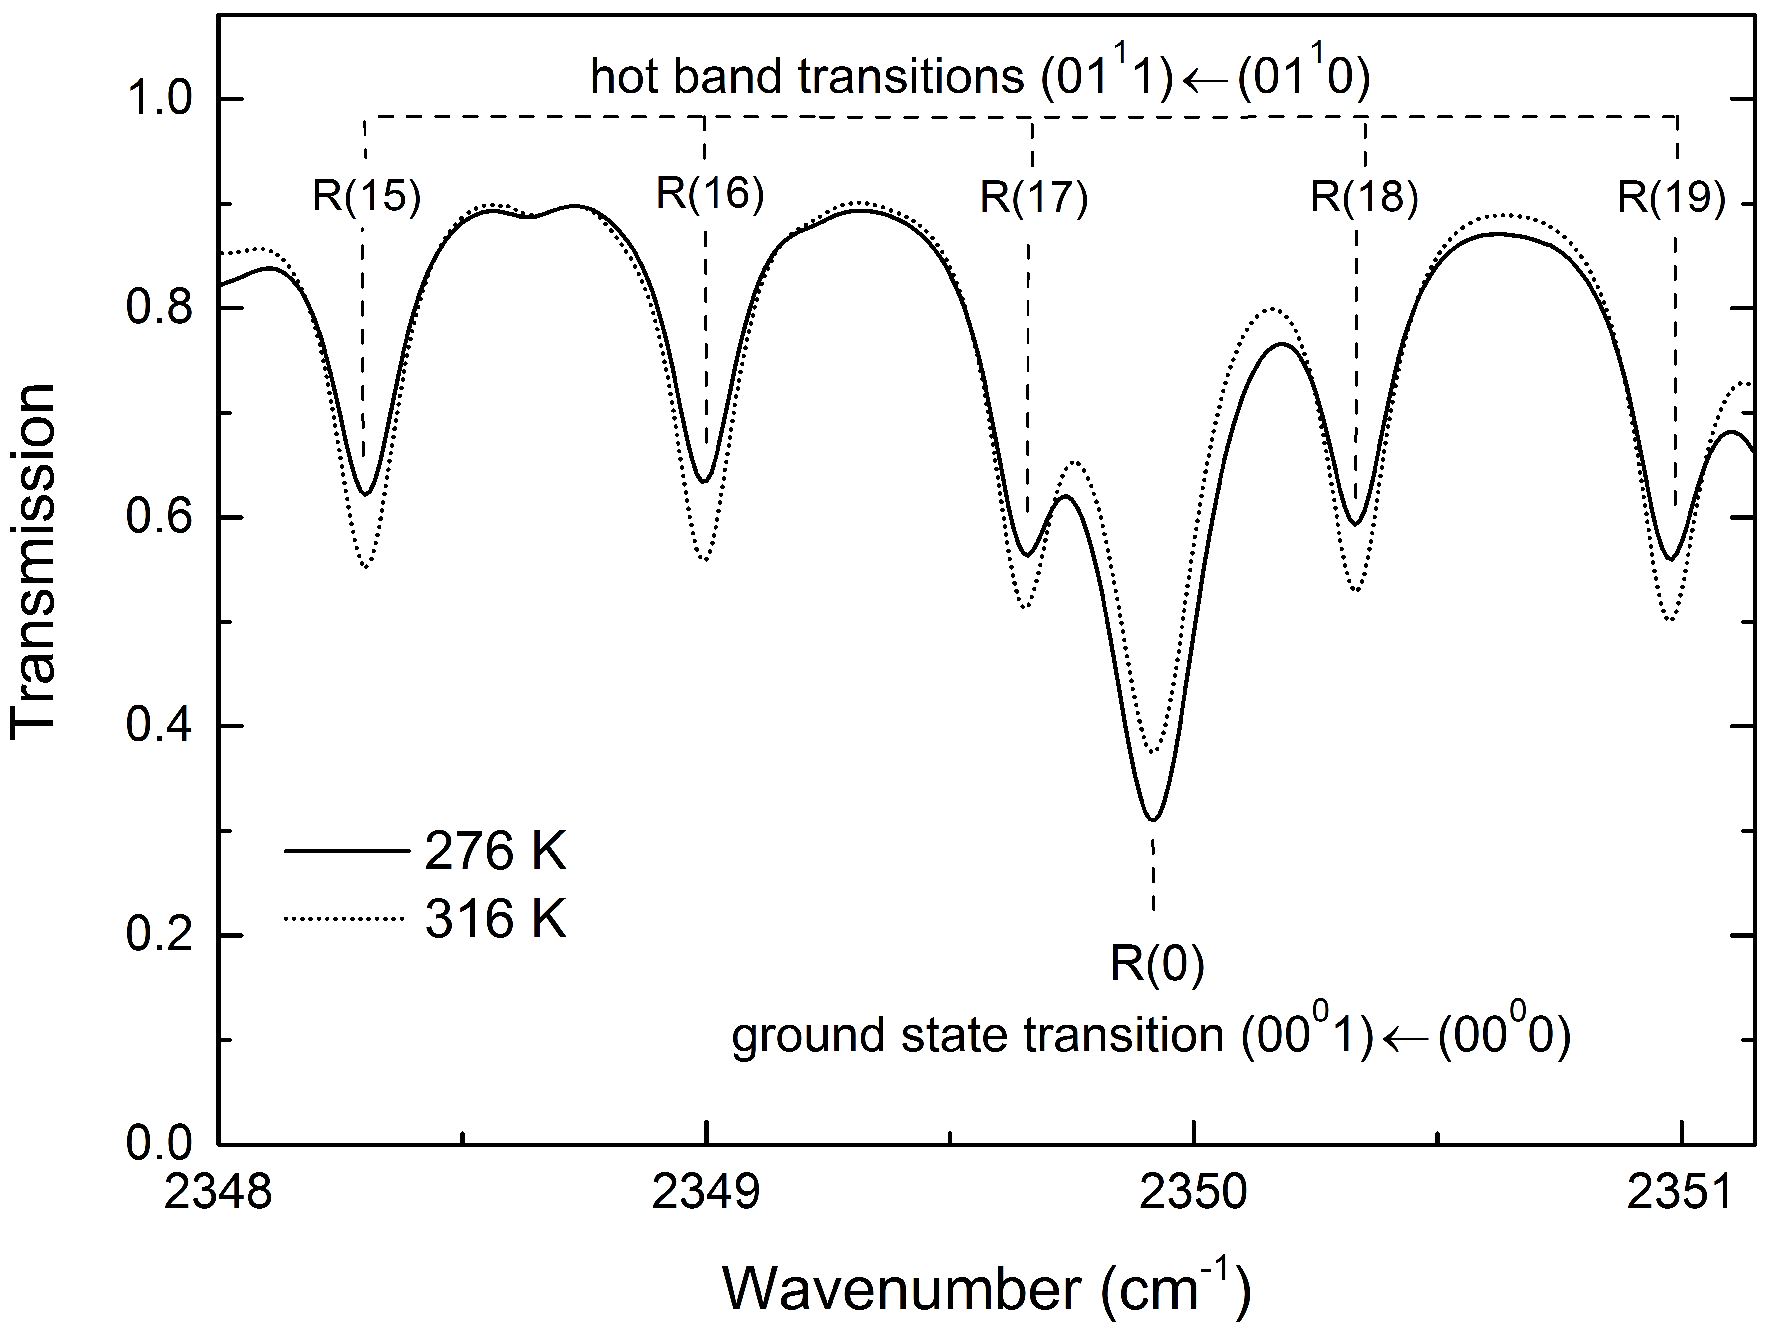
2. Selection of Lines

Direct laser absorption spectroscopy is based on Beer–Lamberts law, which relates the spectral intensity I ( υ ) , transmitted through a medium with path length l, and the incident intensity I 0 ( υ ) to the frequency-dependent absorption coefficient α ( υ ) by I ( υ ) = I 0 ( υ ) e α ( υ ) l . In the case of rotational-vibrational transitions originating from the same gas species, the temperature of the probed volume can be determined from Boltzmann statistics by the ratio R of the specific integrated absorption coefficients of two single absorption lines,
R ( T ) = α 1 α 2 = ( S 1 S 2 ) exp [ ( E 2 E 1 ) k ( 1 T 0 1 T ) ] ,
where k is the Boltzmann constant and S j and E j are the line strength at a given temperature T 0 and the lower-state energy of the quantum transition j, respectively. Here, terms from stimulated emission have been neglected, which, for our purposes, is well justified for temperatures below 400 K. For the most fundamental rotational-vibrational transitions of CO2, the parameters S j and E j are well-investigated and documented in the HITRAN 2020 database [21].
The selection of CO2 absorption lines used in the present study is based on the following criteria:
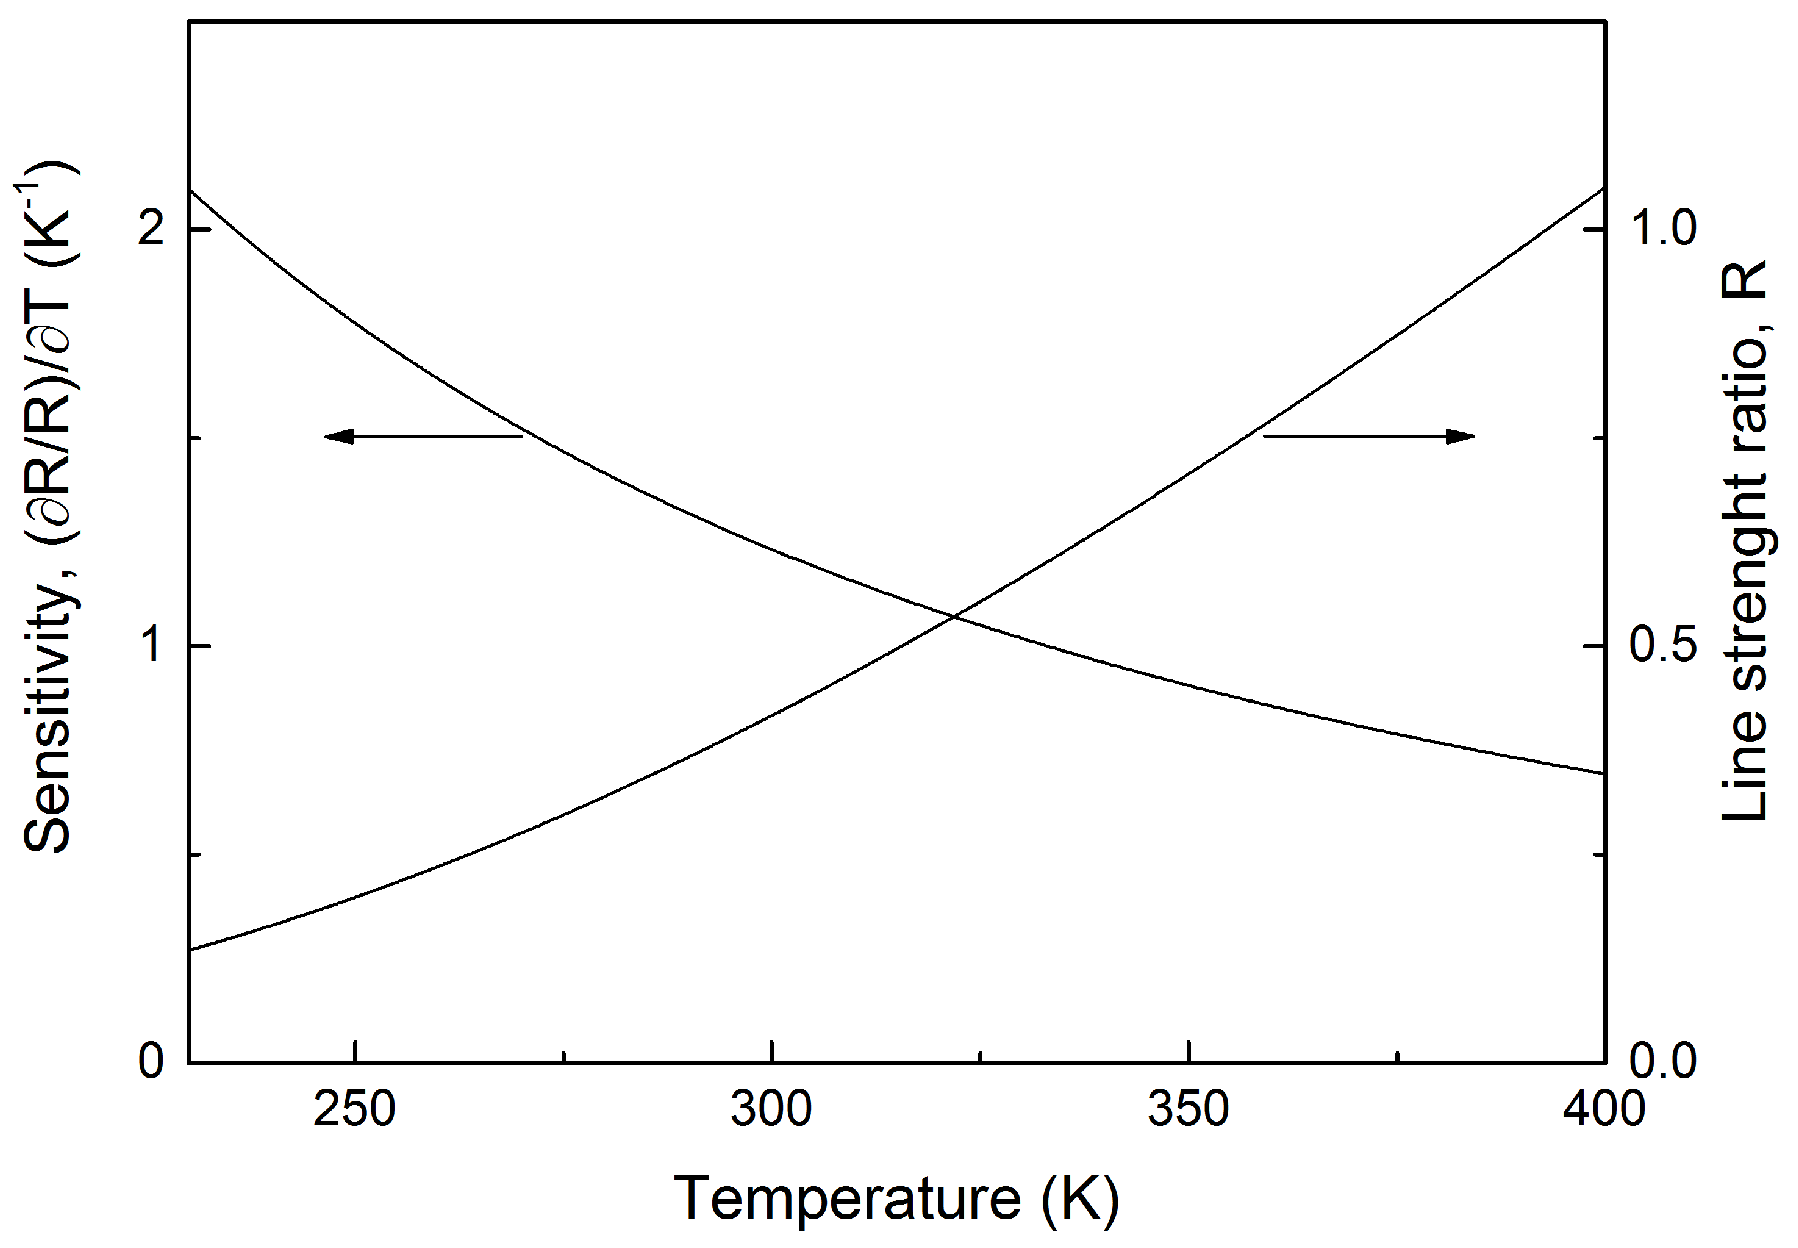
  • High temperature sensitivity in a range close to room temperature;
  • Sufficient line strength in order to allow for direct absorption spectroscopy and simple experimental setup/sensor design;
  • Low interferences with absorption from other gases, in particular IR active gas components which are abundant in earth atmosphere, combustion processes, breath gas, or agricultural applications, such as H2O, CO, NO, N2O, and hydrocarbons;
  • Transition frequencies lie within the tuning range of distributed feedback QC lasers (∼1–2 cm−1);
  • A wide dynamic range of CO2 concentrations can be covered.
In the present work, we selected CO2 absorption lines which cover a frequency range from 2349 to 2350.3 cm−1. Figure 1 shows a HITRAN-based simulation of the CO2 transmission in air at two different temperatures. Interferences from other components are due to H2O and N2O, but integrated absorption coefficients of these gases are at least five orders of magnitude lower in intensity than that of CO2 and, thus, have a negligible influence on the temperature values determined in this work. The dominant feature at 2349.92 cm−1 originates from the fundamental R(0) (0001) ← (0000) ground state transition, whereas the absorption lines with minor intensities are due to “hot band” R(15)−R(19) (0111) ← (0110) transitions with lower state energies in the range 761–816 cm−1. Figure 2 presents the temperature-dependent ratio R ( T ) and sensitivity, defined here as ( d R / R ) / d T , for the R(0) ground state and R(17) hot band transition at 2349.92 and 2349.65 cm−1. The sensitivity and line-strength ratio curves suggest that this pair of lines can be used for accurate temperature measurement in a range close to room temperature.

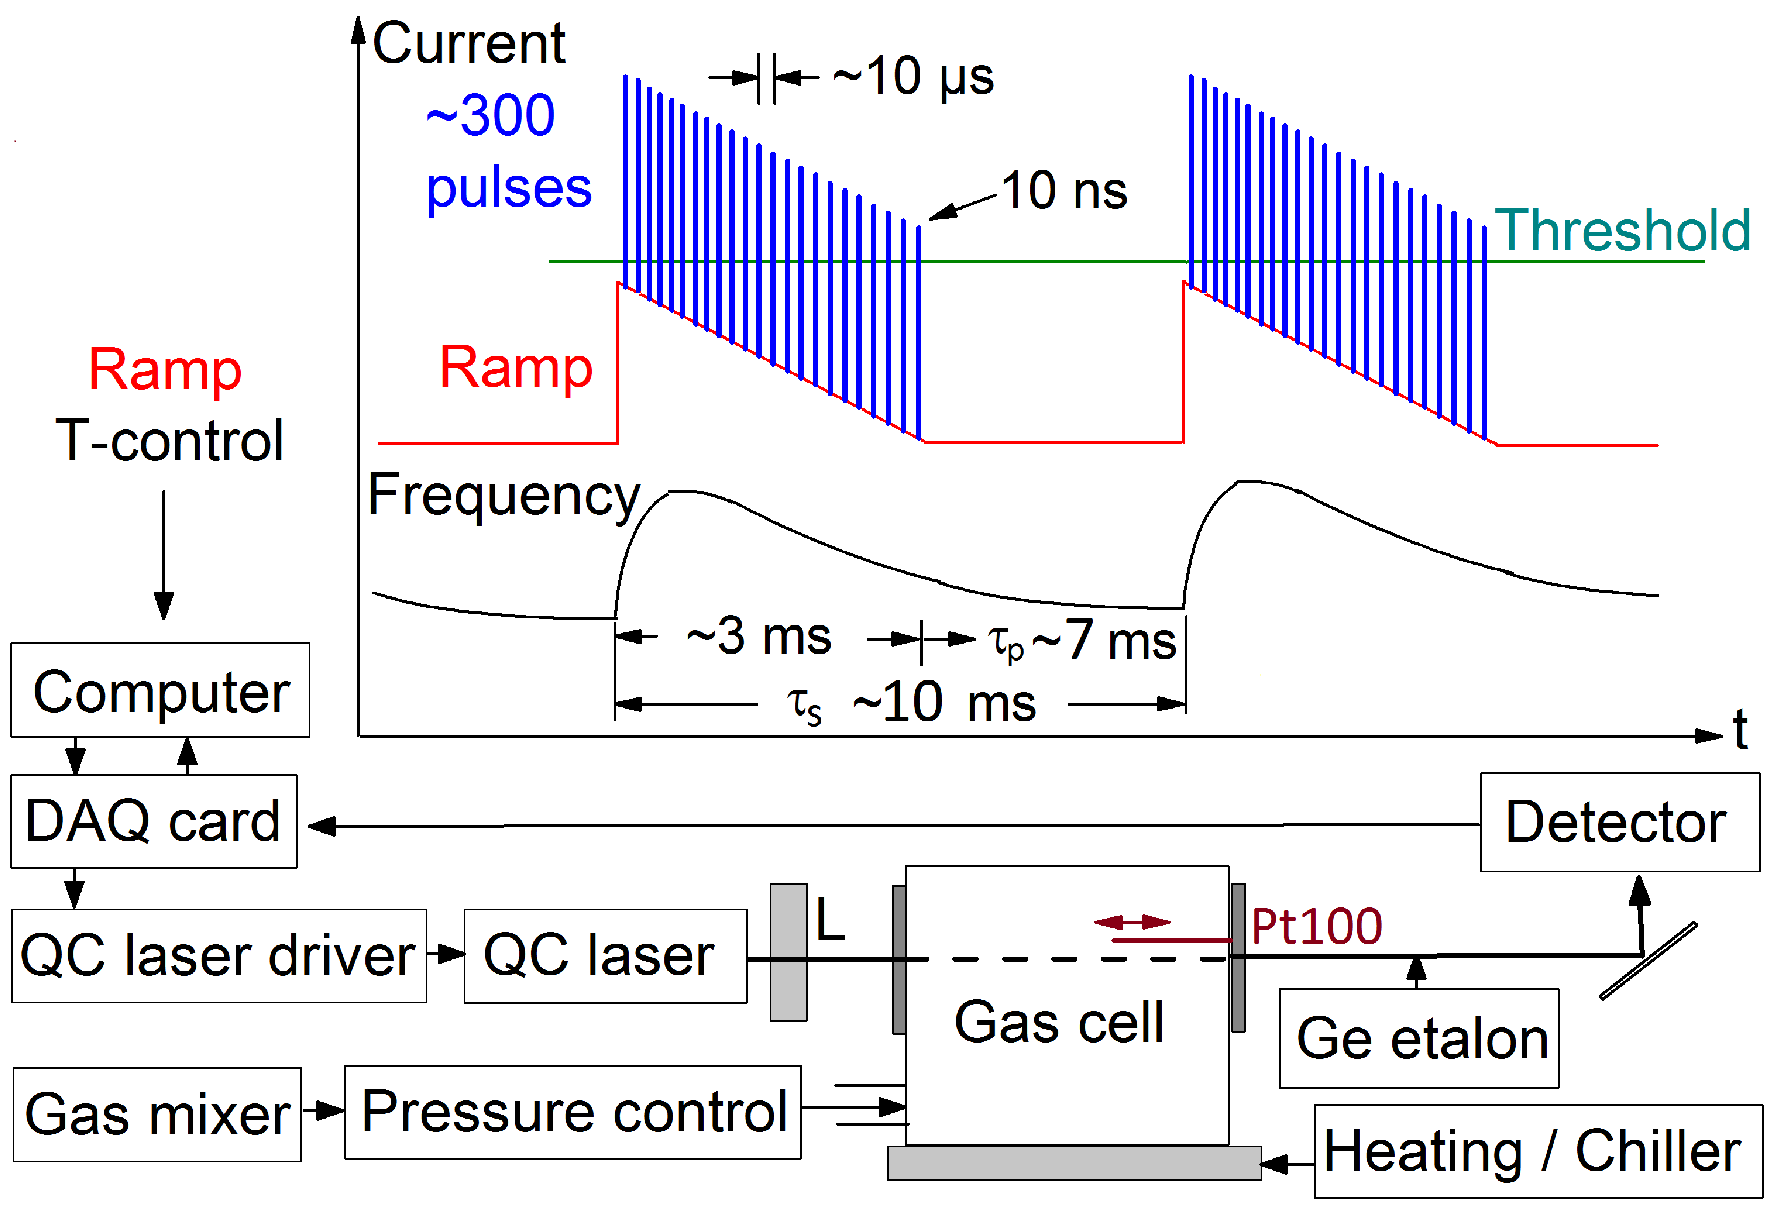
3. Experimental Details

Figure 3 shows a scheme of the experimental setup. A pulsed distributed feedback Peltier-cooled QC laser (Alpes lasers, #sb6804, TO3 package) with a nominal average power of ∼1 mW and a frequency tuning range of about 2347–2351 cm−1 is used to probe the CO2 vibrational-rotational transitions mentioned in Section 2. The laser is operated with the help of a QC laser driver (Q-MACS embedded), which is controlled by LabVIEW routines and a data acquisition (DAQ) card. In order to record spectra, the laser is injection-current driven in the inter pulse mode, allowing for a frequency-tuning within one current sweep of about 1–2 cm−1.
The fundamental principle of inter pulse mode operation of QC lasers is schematically shown in the upper part of Figure 3. The laser is driven by sequential short electrical pulses (blue color, hereafter labeled as “channels”), which excite the laser above threshold. In our study, we used a fixed pulse width of ∼10 ns and laser pulse repetition frequency in the range of 50–100 kHz (10–20 μs pulse repetition period). Spectral scans are obtained by simultaneously applying a sub-threshold current ramp (red) which modulates the laser properties (e.g., laser head temperature) and thus its spectral frequency. The spectral sweeps consist of triangular current ramps with a duration of several milliseconds that included typically 200–500 laser pulses/channels. For time-dependent investigations or averaging, the spectral scans are repeatedly circled, including a pause periods applied after each current ramp (see τ p in Figure 3) in order to let the laser relax to its pre-circle state. The repetition period of such spectral sweeps, τ s 10 ms, sets the fundamental time resolution of the temperature measurement presented.
The output beam of the laser is collimated by an anti-reflection-coated ZnSe lens and directed through a gas cell onto a MCT detector (Teledyne Judson Techn, J19TE3), whose signal is fed to a current-preamplifier (Femto DLPCA-200) and forwarded by the DAQ card to the computer for data acquisition. The gas cell comprises two 2 mm thick anti-reflection-coated sapphire windows and is equipped with a feedthrough to a gas mixing system, which gives the possibility to vary gas composition and pressure. Furthermore, the gas cell is attached to a water-conducting heating plate, which is stabilized by a Julabo CF31 thermostat. A Pt100 sensor (DIN EN 60751:209, class AA) with an accuracy of ± 0.18 K in the temperature range studied here is placed close to the laser beam and can be moved along the direction of the laser beam for reference temperature measurements. The procedure for obtaining an absorption spectrum of a sample gas includes the measurement of an intensity spectrum I s , where the gas cell is filled with the sample gas, and a reference spectrum I r , where the gas cell is purged with N2 gas. From these two spectra, the frequency-dependent absorption coefficient is obtained from α ( υ ) = l n ( I r / I s ) / d , where d = 8 cm is the length of the gas cell. Frequency calibration is achieved with the help of a solid germanium etalon transmission pattern, whose maxima and minima positions correspond to equidistantly spaced peaks in the frequency scale separated by the etalon’s free spectral range of 0.06 cm−1.

4. Results and Discussion

4.1. General Considerations
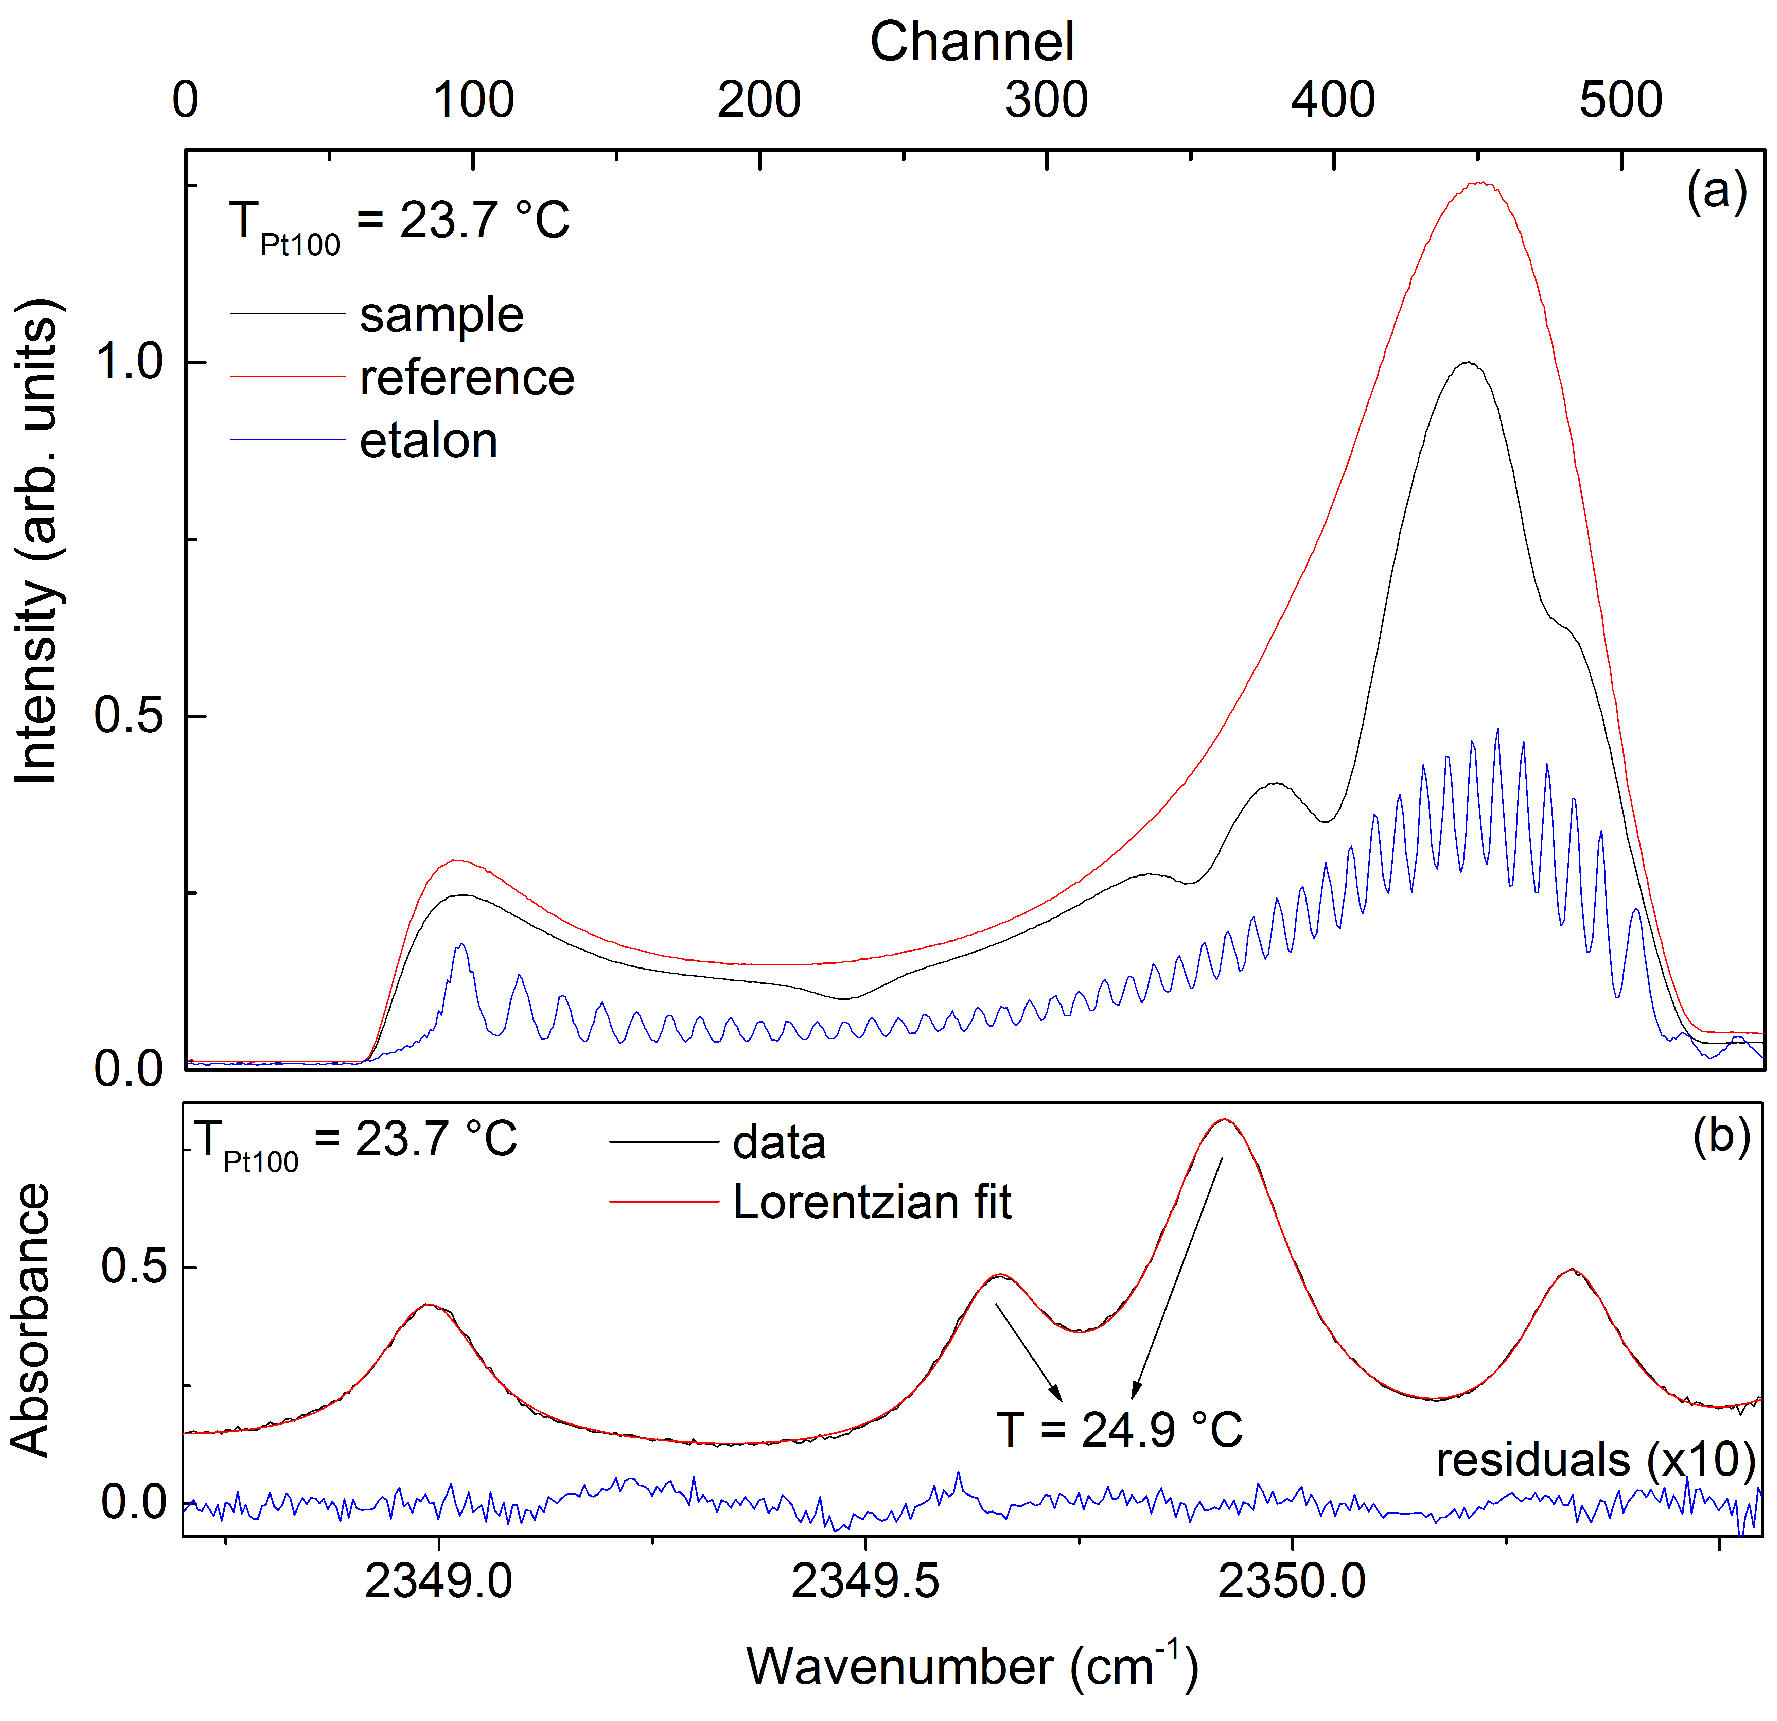
We will present and discuss results which have been obtained by averaging over several hundred ramp circles. The low statistical noise in these measurements allows us to validate our QCLAS technique with regard to systematic error contributions. Exemplary intensity spectra, obtained at room temperature by averaging over 1500 ramp circles, are shown in Figure 4a. Figure 4b shows the corresponding absorbance spectrum, derived by using Beer–Lambert law and frequency calibration from the etalon transmission pattern.
The figure also presents results of a profile fitting procedure in which each absorption line is separately fitted by a Lorentzian function and non-Lorentzian contributions resulting for instance from Doppler broadening or an inherent laser line width are neglected. From the intensity ratio of the dominant absorption lines at 2349.91 and 2349.65 cm−1, a temperature of ( 24.9 ± 0.3 ) °C is obtained, deviating from the Pt100 sensor value, T = ( 23.7 ± 0.2 ) °C, by about 1.2 K. The root mean square noise level of the QCL temperature data, obtained from a long-term measurement of 1 h with a sampling period of 25 s, however, was only about 0.3 K. From here, we conclude that the deviation from the Pt100 sensor values results from a systematic source of error. We suggest that Lorentzian profile fitting of our absorption spectra is not suitable for obtaining high accuracy temperature values.
In the following section, we will present an algorithm which accounts for several corrections to the Lorentzian profile fitting procedure and significantly reduces systematic error. Hereby, we concentrate on the particular measurements from Figure 4; however, we also successfully applied our procedure to a large set of other measurements which have been obtained for different experimental parameters, e.g., laser repetition rate, ramp circle parameters, number of pulse channels per ramp circle, laser head temperature, or QC laser voltage UQCL. We will show that the most significant uncertainty contributions originate from two of the common main problems of pulsed QC laser operation for high precision measurements [19]—“ramp-to-ramp” variations due to thermal drift effects and spectral broadening due to inherent laser linewidth. From our data, we do not have evidence that other potential error sources, like for instance interference fringes due to internal reflections of the laser beam at optical components or nonlinearity of the detector response, have significant influence on our data. In Section 4.3, we will validate our method for T-dependent measurements.

4.2. Evaluation

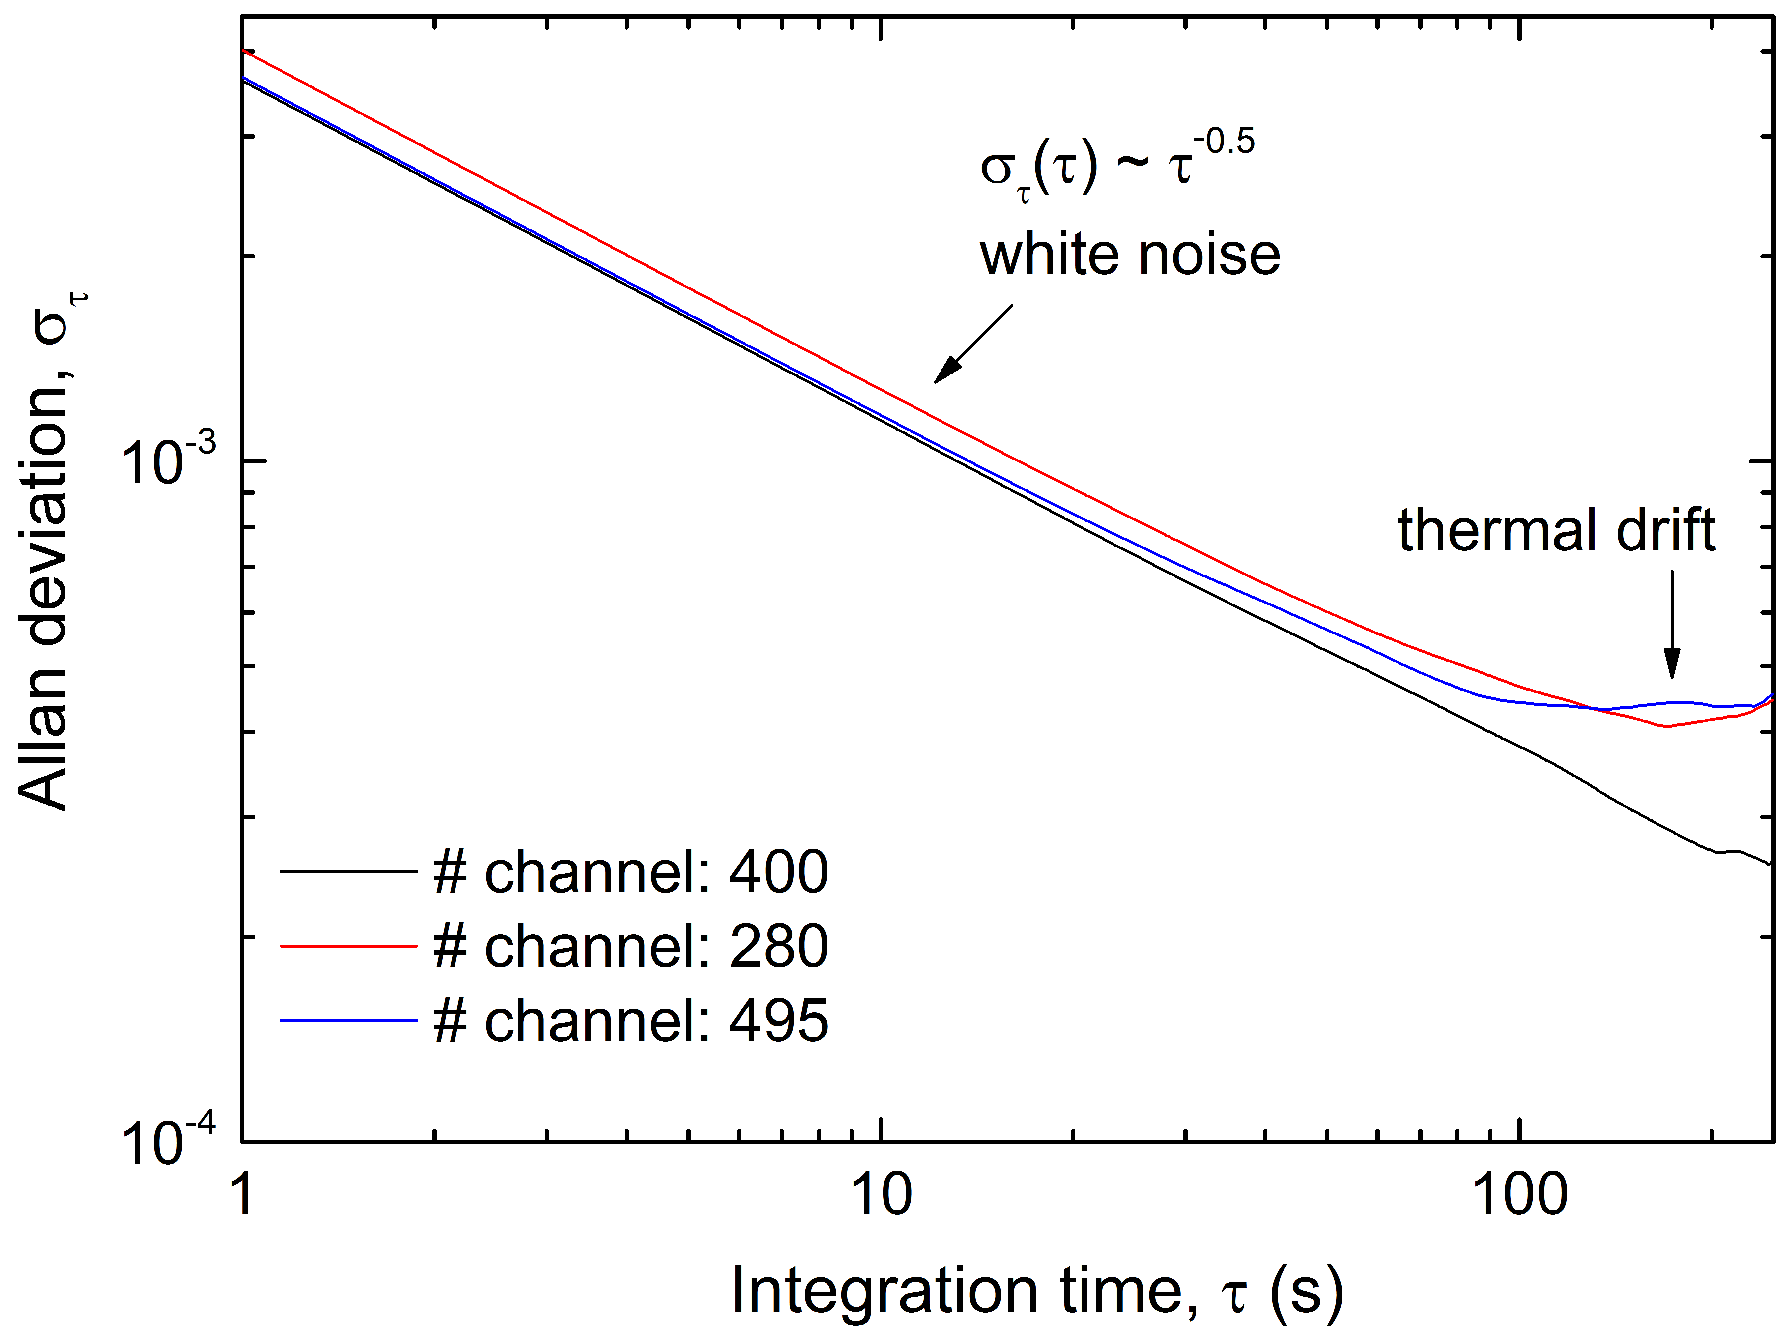
4.2.1. Thermal Drift

First, we discuss the “ramp-to-ramp” instability in the recorded spectra. Variations due to thermal or electronic drifts will lead to distortions and, thus, cause systematic errors in the T-determination. In order to systematically investigate drift effects, we employed Allan-variance-analysis [22]. Thermal and electronic drift can generally lead to both instabilities in intensity and shifts in the frequency scale of the absorption spectra. While both have been investigated, we only show the results of the former case here. Figure 5 shows Allan-deviation plots σ τ ( τ ) of the detected intensity signal for three different channels of the sample gas measurement from Figure 4. As follows, the spectra are dominated by white noise for integration times τ < 70 s. Interestingly, for longer integration times, the characteristic of the Allan variance analysis differs substantially for different channel positions of the spectra. It can be concluded from the figure that thermal drift effects become evident for the channels 280 and 493, whereas white noise dominates for channel 400 even for the longest integration time. We found that thermal drift generally affects the intensity of pulse channels at the beginning or end of the current ramp more strongly than in its center. Furthermore, we observed that, for our setup, drift effects are particularly sensitive to experimental parameters which influence the thermal input into the QC lasers, e.g., laser head temperature, cooling power, laser repetition rate, and QC laser voltage. In our opinion, this is an inherent property of our QC laser system, which is optimized for intra pulse mode instead of inter pulse mode operation in the spectral range of interest. The thermal input into QC lasers is generally higher in the latter case than in the former one, in particular due to additional ohmic heating when the current ramp is applied. The duration of the pause periods required to let the laser relax to its pre-circle state and avoid instabilities (see τ p in Figure 3) is very sensitive to the experimental parameters. Generally, higher laser powers required longer pause periods, thus limiting time-resolution/scanning rate of the temperature measurement. For high-precision temperature measurements, data analysis have to be applied to measurements and spectral sections where drift effects are negligible. For the particular case of our exemplarily spectra from Figure 4, we select the spectral range 2349.38 (pulse channel 305) to 2350.17 cm−1 (pulse channel 450).

4.2.2. Broadening

As written in Section 4.1, one of the potential systematic error contributions in the T-determination from absorption spectra is an inherent laser linewidth that is not taken properly into account in the fitting routine. It is well known that the spectral broadening of common QC lasers within one channel of the inter pulse mode is greater than the molecular (Doppler) absorption linewidth [19]. The most significant broadening mechanism originates from a frequency sweeps within single laser pulses due to self-heating, even if the laser is operated close to threshold and short pulses of ∼10 ns are used.
In order to investigate the intrinsic linewidth of our QC laser system, we measured transmission spectra of the Germanium etalon, which can be used as a reference sample due to its sharp transmission features. For the case of normal incidence, the transmission function T ( ν ) of a parallel-plane etalon with thickness l is given by the Airy-function,
T ( ν ) = 1 1 4 ( R R s ) ( 1 ( R R s ) ) 2 sin 2 ( δ 2 ) , with δ = 2 π ν n l and R = ( n 1 n + 1 ) 2
where R and n are reflectivity and the index of refraction, respectively, and ν is the wave number. Here, R s accounts for deviations from the maximum reflectivity R due to, e.g., reflection losses at imperfectly polished interfaces, misalignment of the etalon, etc. Our etalon consists of impurity-lean, polished optical grade Germanium. Thus, we expect R s to be negligible small compared to R. We also performed intra pulse measurements (not shown here) whose spectra inherently possess lower spectral broadening and gave us evidence that this assumption is justified for our purpose here.
Figure 6 presents a section of the Ge etalon transmission spectrum (black line), as recorded in Figure 4. For our analysis, we assumed that the laser light of each single pulse is spectrally broadened around its center frequency by a Gaussian function, where broadening σ c (full width at half maximum) is dependent on the pulse channel within the current ramp. From here, we fitted this model (see red curve) to small “windows” of the experimental data and sequentially extracted σ c for all channels of the current ramp (see inset of Figure 6). The best-fit data are presented by the red line, whereas the Airy-function of the Ge etalon without the influence of spectral broadening is shown by the blue curve. While the assumption of Gaussian broadened laser light pulses is weak since the exact frequency chirp for the laser pulses is unknown, the agreement of our fitting procedure with the experimental data are satisfactorily good. In Section 4.2.3, we will use σ c in our fitting routine in order to account for the spectral broadening effects.
Figure 7 shows the broadening parameter σ c and the intensity of the laser dependent on the QC laser voltage. As can be seen from the figure, higher UQCL values lead to an increase in laser power and laser line width. The former generally improves signal-to-noise ratio of the measurements and thus reduces statistical errors, whereas the latter increases uncertainty due to enhanced overlap of the absorption lines. The measurements in Figure 4 have been obtained for UQCL = 9.42 V.

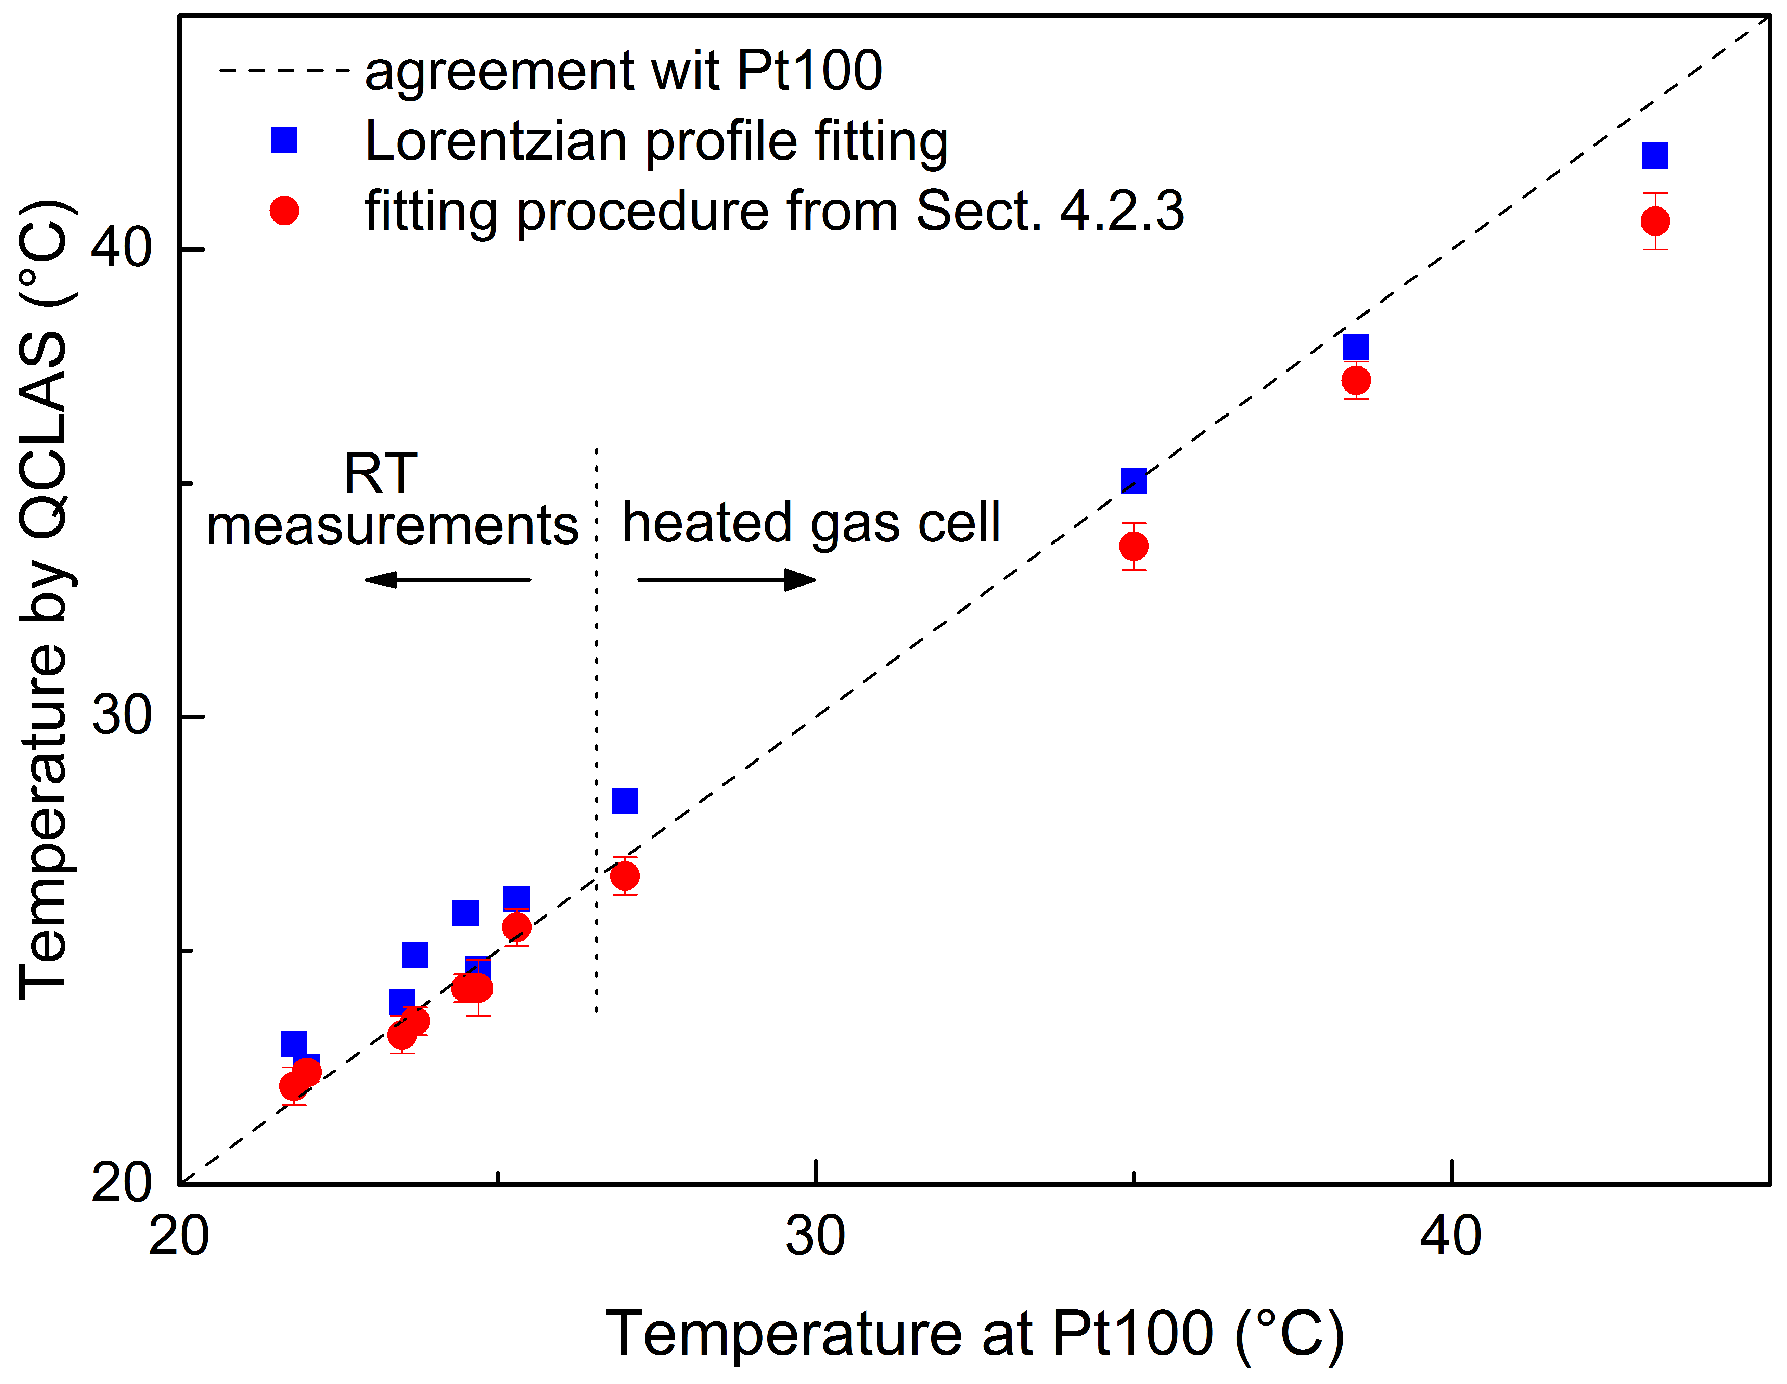
4.2.3. Fitting Routines

Generally, two different fitting methods can be applied in order to achieve gas temperatures from absorption spectra: (1)—profile fitting in which each absorption line is fitted separately by line profile modeling, e.g., Lorentzian, Gaussian, Voigt, or Rautian functions; and (2)—fitting of simulated spectra based on spectral databases, e.g., HITRAN 2012, to the experimental data. Both methods have been applied and will be compared in Section 4.4. Here, we only discuss an algorithm based on method (2), since it results in more precise temperature values for the particular experimental conditions of the present study. The fitting algorithm is performed as follows:
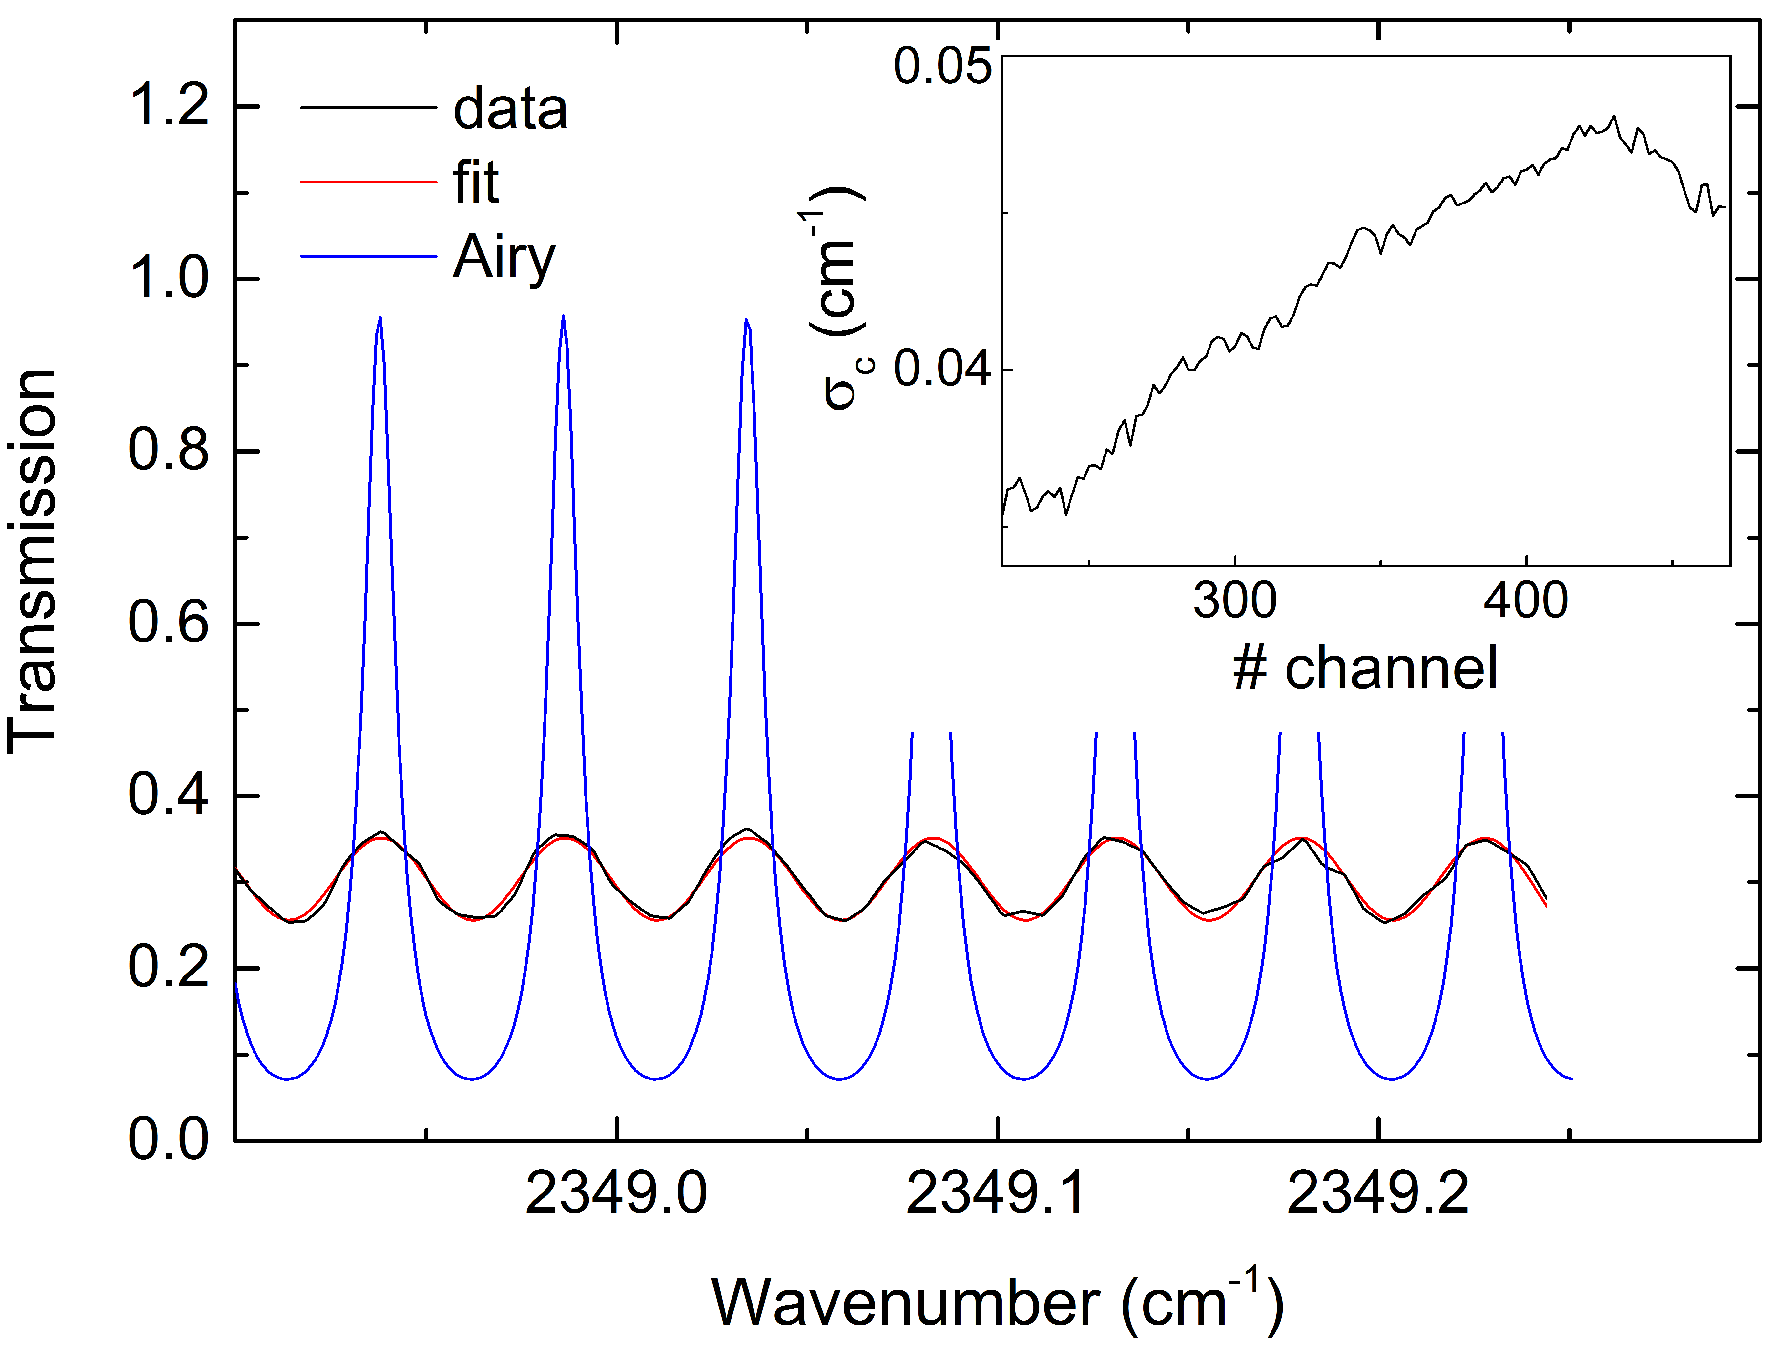
  • Relative frequency calibration of the experimental data by applying a fourth-order polynomial interpolation to the interference fringes of the Ge etalon transmission spectrum. Absolute frequency calibration is included as a parameter in the fitting routine, where the initial guess value can be obtained from comparison of the absorption lines’ positions to the HITRAN database.
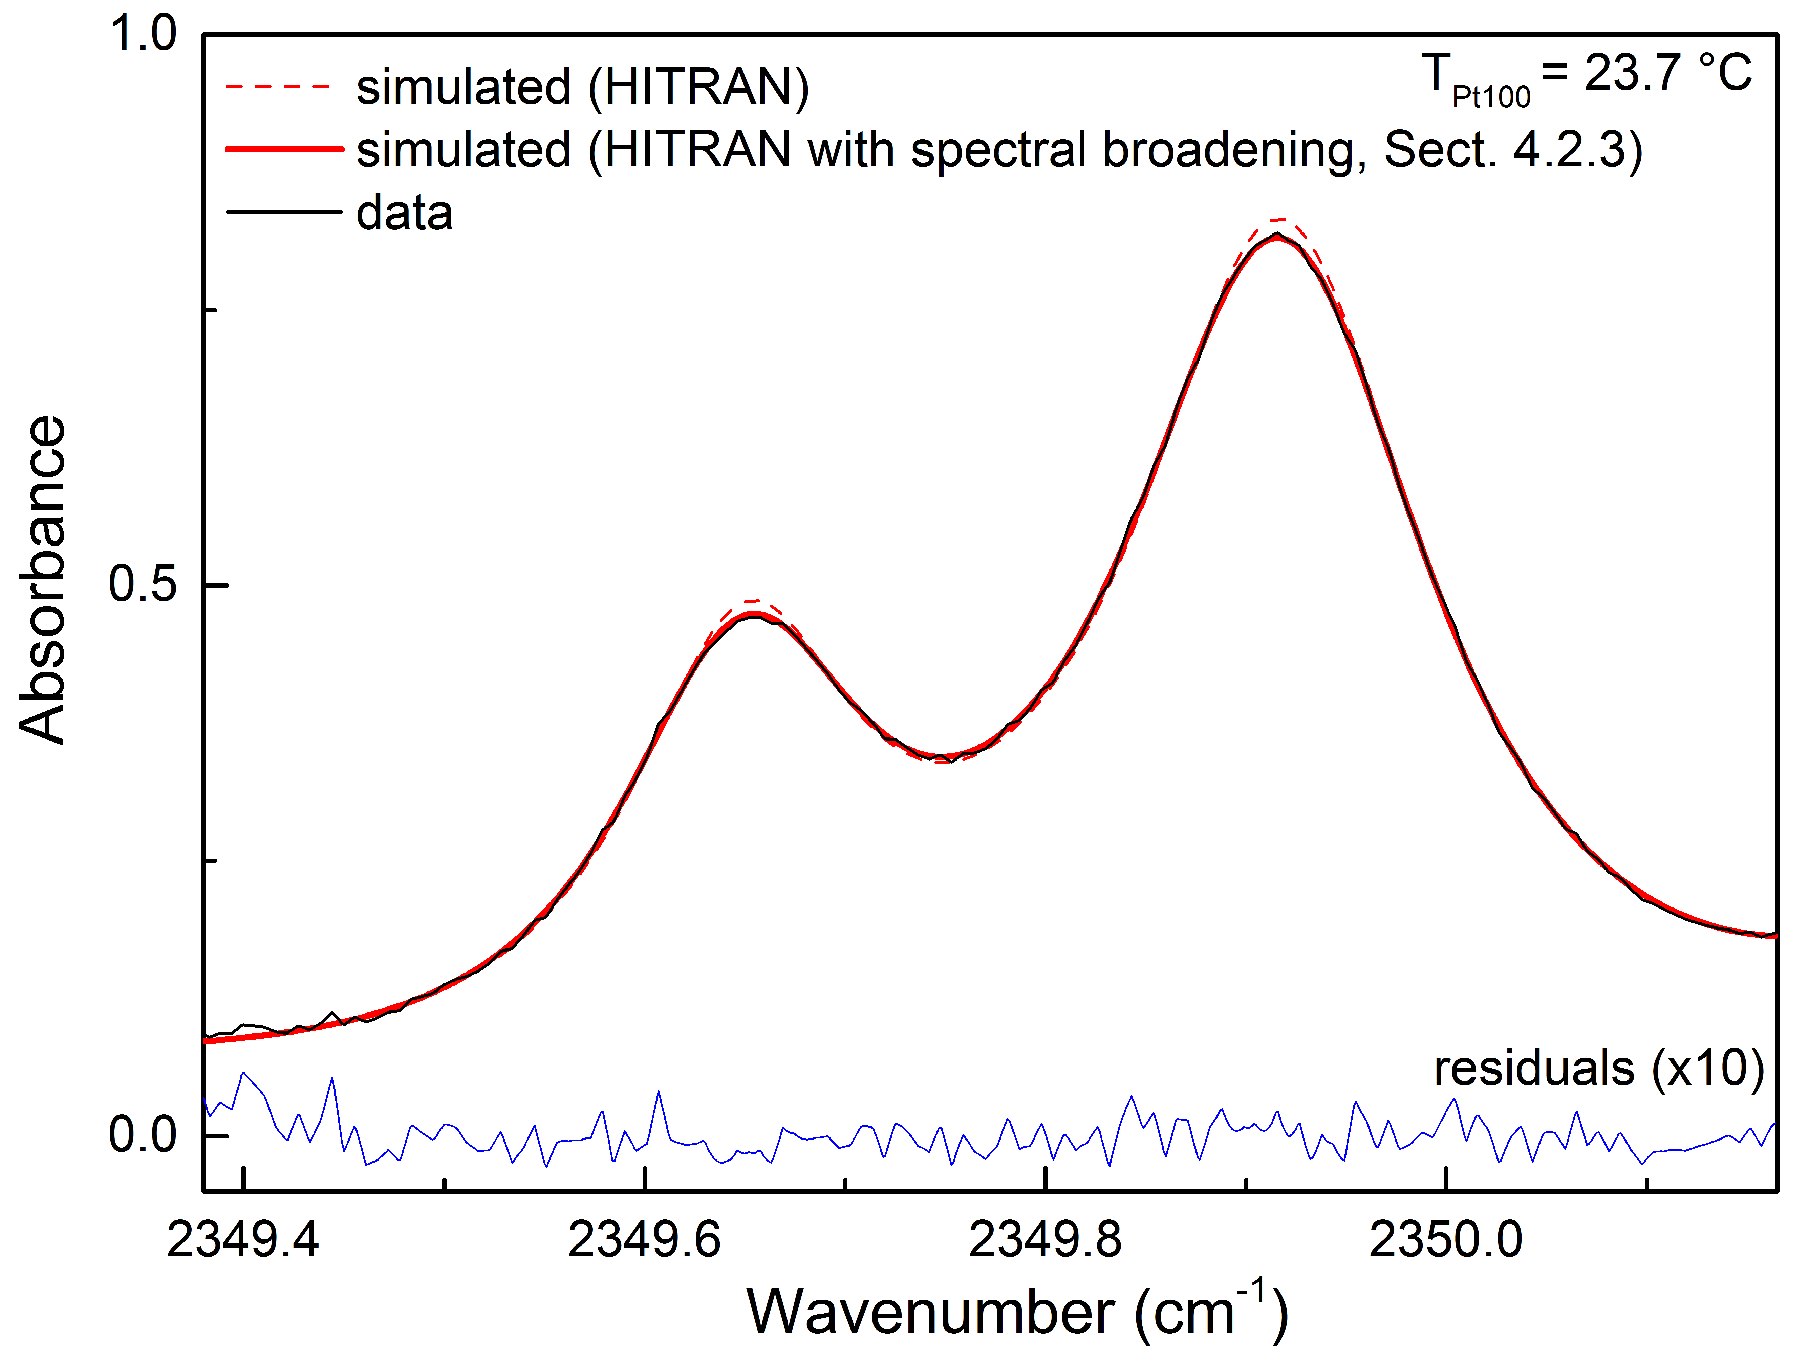
  • Simulation of absorption spectra based on the HITRAN database with fitting parameters T (temperature), p (pressure), and c (CO2 concentration);
  • Gaussian convolution of the simulated spectra with the broadening parameter σ c from Section 4.2.2 in order to account for non-Lorentzian spectral broadening resulting from the inherent QC laser line width;
  • Include a constant offset in the absorption spectrum in order to account for baseline variations in the experimental data.
Figure 8 presents the result of the fitting algorithm applied to the data from Figure 4. As can be seen, the Gaussian convolution accounting for the QC laser line width (step 3 of the fitting routine) significantly improves the quality of the fit. The close agreement between the simulated curves and the experimental data provides strong support for the efficiency of our fitting model. The best-fit value of T = ( 23.5 ± 0.2 ) °C is obtained, for which within uncertainty matches the Pt100 sensor temperature.

4.3. Temperature-Dependent Measurements

Figure 9 compares the results of our QCLAS-technique with the Pt100 sensor data for a series of temperature-dependent measurements, obtained on different days and experimental conditions (e.g., UQCL, laser head temperature, averaging time). The viability of our method follows from the agreement to the Pt100 sensor values for measurements below 25.5 °C. Note that these results have been obtained without heating of the gas cell (natural variations in the room temperature). For measurements with heated gas cells, slight deviations from the Pt100 sensor value are obtained. For this type of measurements, the QCLAS temperature values are generally slightly underestimated, which leads us to the assumption that these deviations are dominantly caused by systematic errors due to an inhomogeneous T-profile of the gas cell.
Figure 10 exemplarily shows the temperature profile as obtained from measurements with the Pt100 sensor located at different medial positions in the gas cell along the laser beam direction (see also Figure 3). The profile relates to the data point with the highest temperature in Figure 9. As follows from the figure, the temperature close to the cell windows is significantly lower than in the inner part. Since our QCLAS method probes the integrated path along the optical laser beam in the cell, the evaluated T values are generally lower than the Pt100 sensor values given in Figure 9, which we measured at a position in the inner region of the gas cell.

4.4. Discussion

First, we discuss our simulation-based fitting algorithm from Section 4.2.3 and compare it to the method of line profile modeling with functions like Lorentzians, Gaussians, Voigts, etc. The latter procedure is generally more flexible with regard to the sample’s composition and properties as the functions’ parameters can be freely chosen to account for different absorption line broadening mechanisms, such as natural, pressure, and Doppler broadening, which generally vary with the experimental conditions. On the other hand, an increased number of fit parameters results in larger statistical uncertainty of the temperature values determined. The main advantage of our HITRAN simulation-based fitting algorithm is its precision when particular sample parameters (e.g., collisional broadening parameters) are known from the HITRAN database and, in turn, absorption spectra can be well simulated. In the present work, we measured air, pure CO2 gas, and CO2-air or CO2-N2 mixtures at normal conditions—for these cases, collisional broadening parameters are well investigated (see Ref. [23] and therein) and simulation-based fitting is clearly favorable compared to profile modeling. Our fitting algorithm can also be applied to samples with mostly unknown composition when p is treated as a general independent fitting parameter, which accounts for the entirety of Lorentzian-like line broadening mechanisms as long as line shifts due to collision broadening are negligible small. Gaussian-like contributions originating from Doppler broadening are generally much lower at normal conditions than spectral broadening due to the laser linewidth discussed in Section 4.2.2, and thus can be neglected in the simulation procedure.
In our fitting algorithm, we also treat the CO2 gas concentration c as an independent fitting parameter. For measurements on CO2:N2 gas mixtures with CO2 mole fractions of 1.5, 3 or 5% (specified relative uncertainty of 5%), we found that the best-fit value of c agrees within uncertainty with the nominal CO2 concentration of the sample gas. This result suggests that the method can also effectively be used as a temperature-insensitive probe of the CO2 concentration. In case the CO2 concentration is known from external measurements, for instance from other QCL measurements in a dual-beam setup, the fitting parameter c can be constrained in order to improve the precision of the temperature values.
In the previous sections, we discussed results which have been obtained by averaging over several hundred ramp circles. We also performed measurements with shorter integration times. For similar experimental conditions to the ones from Figure 4, we found a root mean square noise level in temperature of about 4 K for single-scan measurements. In this case, the uncertainty is dominantly caused by random noise (see Section 4.2.1). As drift effects or spectral laser broadening are less important, “short-term” measurements can be generally performed at higher laser power, laser repetition rates, and short pause periods τ p (that is, higher thermal input to the QC laser), thereby reducing statistical uncertainty and enhancing drift noise. The optimal experimental conditions are met when statistical and systematic uncertainties are on the same order of magnitude and can be chosen according to the experimental needs (required accuracy and/or time resolution).
The particular sensitivity in our measurements to drift noise is a specific feature of our experimental setup as the choice of our QC laser system is clearly not optimal for inter pulse mode operation at about 2349−2351 cm−1 (see Section 4.2.1). We thus expect that, for the better choice of the QC laser, precision and/or time resolution can be significantly improved compared to our setup. The main advantage in operating the QC laser in inter pulse mode is its simplicity with regard to technical prerequisites for the detection system. Intrapulse mode operation [24,25] or continuous-wavelength QC lasers could provide a significantly lower noise level but require sophisticated fast signal detection and data acquisiton equipment.
A further source of uncertainty in our temperature measurements is the acquisition of the N2 reference spectra I r (see Section 3) used to obtain the CO2 absorption spectra. Such spectra have been recorded before or after the respective sample gas measurements. The N2 baseline signal is thus inherently prone to drift effects of the laser and detection system. Substantial improvement is likely to be obtained when a dual-beam setup with permanent normalization of the sample measurements to a reference is used since drift noise can be widely avoided in this way.
An important potential source of systematic error contribution in the temperature measurement is heating of the gas by the QC laser. A rough estimate for air at standard conditions, based on the assumption that the laser heat (nominally 1 mW) is homogeneously distributed over the volume of the gas cell V = 2 × 10 4 m3, gives a gas temperature increase of about 0.4 K within 1 min of laser operation. The real effect of laser heating will also depend on various other factors which are more difficult to quantify, such as gas convection or heat sinks in the experimental setup. The entirety of our data on time-dependent measurements, which were started after a period with laser power switched off, do not show conclusive evidence for a strong impact of laser heating on the temperature determined. However, we do not rule out that such a situation may occur at certain experimental conditions.
The method discussed presents non-invasive line-of-sight measurements which inherently reflect an in situ gas temperature averaged over the optical path of the QC laser. On the contrary, conventional temperature sensors like platinum resistance thermometers or thermocouple elements require heat transfer to the medium of interest, providing slow-response values at very localized positions. The strength of the presented QCL method is therefore online sensing of highly dynamic systems with strong temperature variations on time scales of about 0.01–1 s that are too fast to be tracked by conventional sensor devices, facilitating potential applications in, e.g., breath-by-breath analysis of biomarkers for clinical purposes or vehicle exhaust emissions’ monitoring.
A particular application example is gas temperature sensing with respect to the refractometry used for a new density-based realization of the Pascal in case of the redefined SI units (see, e.g., Ref. [26]). Here, gas temperatures vary due to thermodynamic pV-work when the gas is introduced into the refractometer. Recent simulations revealed a design-dependent heating of the gas by more than 50 K followed by a decay with sub-second time constants [27]. The QCLAS technique presented could be used to experimentally validate these simulations due to its excellent time resolution and non-invasive character.

5. Conclusions

A pulsed quantum cascade laser absorption method has been demonstrated to determine the temperature of CO2-containing gases close to room-temperature. The technique employs ground-state and hot-band rotational-vibrational transitions of CO2 in the frequency range 2349 to 2351 cm−1, which are probed by inter pulse mode operation of the QC laser with scanning repetition periods down to 10 ms. For our setup, the precision of the temperature measurement within one scan is ∼4 K and can be further reduced down to ∼50 mK by long-time averaging of about 1 min. Our data suggest that significant improvements in statistical certainty can be achieved for instance by pulse-to-pulse normalization to reference measurements in a dual path setup, low-noise-detectors, or the choice of a better suited QC laser. The strength of the QCL method presented is online temperature sensing of highly dynamic systems with variations on time scales of about 0.01–1 s that are too fast to be resolved by conventional temperature sensors and/or lead to strongly inhomogeneous temperature fields.

Author Contributions

F.H. performed the principal investigations and prepared this manuscript. T.R. and T.v.H. were involved in designing the experiment. K.H. is the group leader and was involved in funding acquisition, project administration, and revising the manuscript. All authors have read and agreed to the published version of the manuscript.

Funding

This work was supported by the Central Innovation Program (ZIM, Grant No. KF2612803DF4) of the Federal Ministry for Economic Affairs and Energy, Germany. T.R. partially received support from the QuantumPascal project (18SIB04), funded from the EMPIR program co-financed by the Participating States and from the European Union’s Horizon 2020 research and innovation program. The publication of this article was funded by Freie Universität Berlin.

Institutional Review Board Statement

Not applicable.

Informed Consent Statement

Not applicable.

Data Availability Statement

The datasets generated during and/or analyzed during the current study are available from the corresponding author upon reasonable request.

Conflicts of Interest

The authors declare no conflict of interest.

References

  1. Faist, J.; Capasso, F.; Sivco, D.L.; Sirtori, C.; Hutchinson, A.L.; Cho, A.Y. Quantum Cascade Laser. Science 1994, 264, 553–556. [Google Scholar] [CrossRef] [PubMed]
  2. Curl, R.F.; Capasso, F.; Gmachl, C.; Kosterev, A.A.; McManus, B.; Lewicki, R.; Pusharsky, M.; Wysocki, G.; Tittel, F.K. Quantum cascade lasers in chemical physics. Chem. Phys. Lett. 2010, 487, 1–18. [Google Scholar] [CrossRef]
  3. Kosterev, A.; Wysocki, G.; Bakhirkin, Y.; Thus, S.; Lewicki, R.; Fraser, M.; Tittel, F.; Curl, R. Application of quantum cascade lasers to trace gas analysis. Appl. Phys. B Lasers Opt. 2008, 90, 165–176. [Google Scholar] [CrossRef]
  4. van Helden, J.H.; Horrocks, S.J.; Ritchie, G.A.D. Application of quantum cascade lasers in studies of low-pressure plasmas: Characterization of rapid passage effects on density and temperature measurements. Appl. Phys. Lett. 2008, 92, 081506. [Google Scholar] [CrossRef]
  5. Hübner, M.; Marinov, D.; Guaitella, O.; Rousseau, A.; Röpcke, J. On time resolved gas temperature measurements in a pulsed dc plasma using quantum cascade laser absorption spectroscopy. Meas. Sci. Technol. 2012, 23, 115602. [Google Scholar] [CrossRef]
  6. Farooq, A.; Jeffries, J.; Hanson, R. CO2 concentration and temperature sensor for combustion gases using diode-laser absorption near 2.7 μm. Appl. Phys. B 2008, 90, 619–628. [Google Scholar] [CrossRef]
  7. Spearrin, R.M.; Ren, W.; Jeffries, J.B.; Hanson, R.K. Multi-band infrared CO2 absorption sensor for sensitive temperature and species measurements in high-temperature gases. Appl. Phys. B 2014, 116, 855–865. [Google Scholar] [CrossRef]
  8. Spearrin, R.; Goldenstein, C.; Schultz, I.; Jeffries, J.; Hanson, R. Simultaneous sensing of temperature, CO, and CO2 in a scramjet combustor using quantum cascade laser absorption spectroscopy. Appl. Phys. B 2014, 117, 689–698. [Google Scholar] [CrossRef]
  9. Chrystie, R.S.M.; Nasir, E.F.; Farooq, A. Ultra-fast and calibration-free temperature sensing in the intrapulse mode. Opt. Lett. 2014, 39, 6620–6623. [Google Scholar] [CrossRef] [Green Version]
  10. Uddi, M.; Das, A.K.; Sung, C.J. Temperature measurements in a rapid compression machine using mid-infrared H2O absorption spectroscopy near 7.6 μm. Appl. Opt. 2012, 51, 5464–5476. [Google Scholar] [CrossRef]
  11. Vanderover, J.; Wang, W.; Oehlschlaeger, M. A carbon monoxide and thermometry sensor based on mid-IR quantum-cascade laser wavelength-modulation absorption spectroscopy. Appl. Phys. B 2011, 103, 959–966. [Google Scholar] [CrossRef]
  12. Wojtas, J.; Bielecki, Z.; Stacewicz, T.; Mikołajczyk, J.; Nowakowski, M. Ultrasensitive laser spectroscopy for breath analysis. Opto-Electron. Rev. 2012, 20, 26–39. [Google Scholar] [CrossRef]
  13. Tuzson, B.; Zeeman, M.; Zahniser, M.; Emmenegger, L. Quantum cascade laser based spectrometer for in situ stable carbon dioxide isotope measurements. Infrared Phys. Technol. 2008, 51, 198–206. [Google Scholar] [CrossRef]
  14. Schwaighofer, A.; Brandstetter, M.; Lendl, B. Quantum cascade lasers (QCLs) in biomedical spectroscopy. Chem. Soc. Rev. 2017, 46, 5903–5924. [Google Scholar] [CrossRef] [PubMed] [Green Version]
  15. Wojtas, J.; Stacewicz, T.; Bielecki, Z.; Rutecka, B.; Medrzycki, R.; Mikolajczyk, J. Towards optoelectronic detection of explosives. Opto-Electron. Rev. 2013, 21, 210–219. [Google Scholar] [CrossRef] [Green Version]
  16. Sumizawa, H.; Yamada, H.; Tonokura, K. Real-time monitoring of nitric oxide in diesel exhaust gas by mid-infrared cavity ring-down spectroscopy. Appl. Phys. B 2010, 100, 925–931. [Google Scholar] [CrossRef]
  17. Li, J.S.; Chen, W.; Fischer, H. Quantum Cascade Laser Spectrometry Techniques: A New Trend in Atmospheric Chemistry. Appl. Spectrosc. Rev. 2013, 48, 523–559. [Google Scholar] [CrossRef]
  18. Namjou, K.; Cai, S.; Whittaker, E.A.; Faist, J.; Gmachl, C.; Capasso, F.; Sivco, D.L.; Cho, A.Y. Sensitive absorption spectroscopy with a room-temperature distributed-feedback quantum-cascade laser. Opt. Lett. 1998, 23, 219–221. [Google Scholar] [CrossRef] [Green Version]
  19. Nelson, D.; Shorter, J.; McManus, J.; Zahniser, M. Sub-part-per-billion detection of nitric oxide in air using a thermoelectrically cooled mid-infrared quantum cascade laser spectrometer. Appl. Phys. B 2002, 75, 343–350. [Google Scholar] [CrossRef]
  20. Welzel, S.; Hempel, F.; Hübner, M.; Lang, N.; Davies, P.B.; Röpcke, J. Quantum Cascade Laser Absorption Spectroscopy as a Plasma Diagnostic Tool: An Overview. Sensors 2010, 10, 6861–6900. [Google Scholar] [CrossRef] [Green Version]
  21. Gordon, I.; Rothman, L.; Hargreaves, R.; Hashemi, R.; Karlovets, E.; Skinner, F.; Conway, E.; Hill, C.; Kochanov, R.; Tan, Y.; et al. The HITRAN2020 molecular spectroscopic database. J. Quant. Spectrosc. Radiat. Transf. 2022, 277, 107949. [Google Scholar] [CrossRef]
  22. Allan, D.W. Statistics of atomic frequency standards. Proc. IEEE 1966, 54, 221–230. [Google Scholar] [CrossRef] [Green Version]
  23. Gamache, R.R.; Lamouroux, J. Predicting accurate line shape parameters for CO2 transitions. J. Quant. Spectrosc. Radiat. Transf. 2013, 130, 158–171. [Google Scholar] [CrossRef]
  24. Normand, E.; McCulloch, M.; Duxbury, G.; Langford, N. Fast, real-time spectrometer based on a pulsed quantum-cascade laser. Opt. Lett. 2003, 28, 16–18. [Google Scholar] [CrossRef]
  25. Herklotz, F.; Rubin, T.; Sinnreich, M.; Helmke, A.; von Haimberger, T.; Heyne, K. Fast Simultaneous CO2 Gas Temperature and Concentration Measurements by Quantum Cascade Laser Absorption Spectroscopy. Appl. Sci. 2022, 12, 5057. [Google Scholar] [CrossRef]
  26. Jousten, K.; Hendricks, J.; Barker, D.; Douglas, K.; Eckel, S.; Egan, P.; Fedchak, J.; Flügge, J.; Gaiser, C.; Olson, D.; et al. Perspectives for a new realization of the pascal by optical methods. Metrologia 2017, 54, S146. [Google Scholar] [CrossRef]
  27. Rubin, T.; Silander, I.; Zakrisson, J.; Hao, M.; Forssén, C.; Asbahr, P.; Bernien, M.; Kussicke, A.; Liu, K.; Zelan, M.; et al. Thermodynamic effects in a gas modulated Invar-based dual Fabry–Pérot cavity refractometer. Metrologia 2022, 59, 035003. [Google Scholar] [CrossRef]
Figure 1. HITRAN-based simulated transmission spectra of CO2 gas in air for two different temperatures (optical path length: 1 m, CO2 concentration: 0.033%, p = 101325 Pa).
Photonics 09 00465 g001
Figure 2. Simulated temperature-dependent line strength ratio, R, and sensitivity, ( d R / R ) / d T , of the R(0) ground state (2349.92 cm−1) and R(17) hot band (2349.65 cm−1) transition.
Photonics 09 00465 g002
Figure 3. Scheme of inter pulse mode operation of QC lasers (upper part) and the experimental setup (lower part). L denotes an anti-reflection-coated aspheric lens.
Photonics 09 00465 g003
Figure 4. (a) Example intensity spectra obtained for CO2-enriched air (black), N2 as reference gas (red), and a solid germanium etalon (blue) with an averaging time of 25 s (1500 scans). The temperature as determined by the Pt100 sensor was 23.7 °C; (b) corresponding absorbance spectrum (black) derived from Beer–Lamberts law and frequency calibration by the etalon transmission pattern. The red and blue line represents best-fit data and residuals, respectively, applying a Lorentzian curve model (see text for further details). Laser repetition rate: 50 kHz, current ramp duration: 10 ms, τ s = 16.7 ms, p = 1010 mbar.
Photonics 09 00465 g004
Figure 5. Allan-deviation plots derived from three different channels of the sample gas measurement in Figure 4.
Photonics 09 00465 g005
Figure 6. Section of the experimental transmission spectra of the Ge etalon derived from the measurements of Figure 4. blue—ideal Ge transmission function according to Airy-formula (formula (2)), red—best-fit of the experimental data to the model which includes spectral broadening of the laser light pulses (see text for details). Inset: Broadening parameter σ c as derived from the fitting model as a function of the pulse channel within the current ramp.
Photonics 09 00465 g006
Figure 7. Broadening parameter σ c and detected laser intensity at pulse channel #400 of the current ramp as a function of the QC laser voltage UQCL. The broadening parameters have been determined from the Ge etalon transmission spectra as described in the text, whereas the intensity is obtained from the N2 gas reference spectra.
Photonics 09 00465 g007
Figure 8. Absorption spectrum from Figure 4b with the best-fit data derived from simulations based on HITRAN 2012 and the fitting procedure described in Section 4.2.3.
Photonics 09 00465 g008
Figure 9. Temperature determined from QCLAS compared to the temperature measured by the Pt100 sensor. The blue square data points represent the temperature as derived from simple Lorentzian profile fitting of the absorption lines (see Section 4.1), whereas the data points with red circles were obtained with the fitting algorithm described in Section 4.2.3. Laser repetition rate: 50 kHz, current ramp duration: 10 ms, τ s = 16.7 ms, averaging time: 1 min.
Photonics 09 00465 g009
Figure 10. Exemplary temperature profile along the center axis of the gas cell. The absolute positions 0 and 8 cm correspond to the inner faces of the two gas cell sapphire windows. The Pt100 sensor position, which has been used for the reference temperature measurement in Figure 9, is highlighted with a red color.
Photonics 09 00465 g010
Publisher’s Note: MDPI stays neutral with regard to jurisdictional claims in published maps and institutional affiliations.

