Review on All-Fiber Online Raman Sensor with Hollow Core Microstructured Optical Fiber

 , ,
, ,
Abstract
:1. Introduction
2. Principle of Raman Spectroscopy and Overview of Raman Sensor with Enhancement
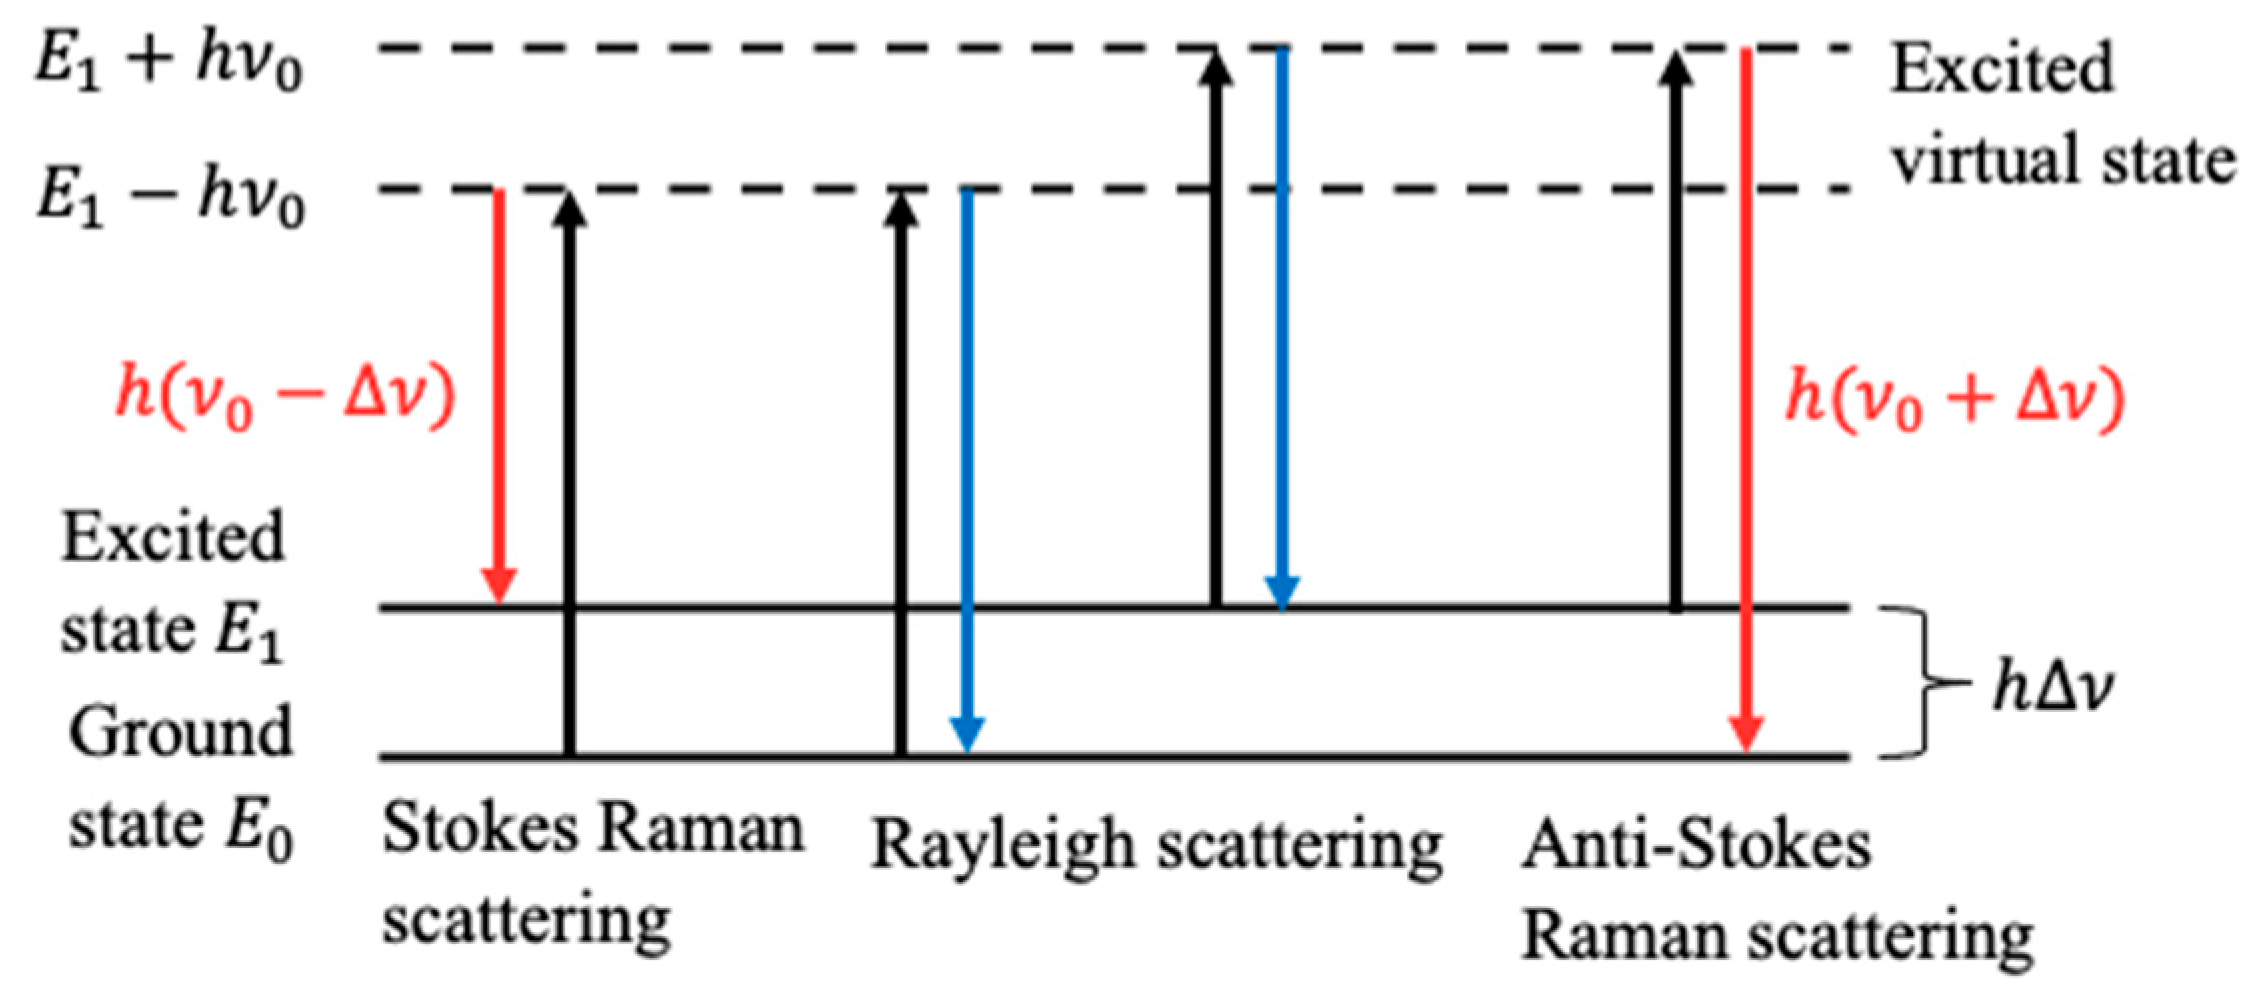
2.1. Principle of Raman Spectroscopy
2.2. Overview of Raman Sensor with Enhancement
3. Fiber-Enhanced Raman Spectroscopy (FERS)
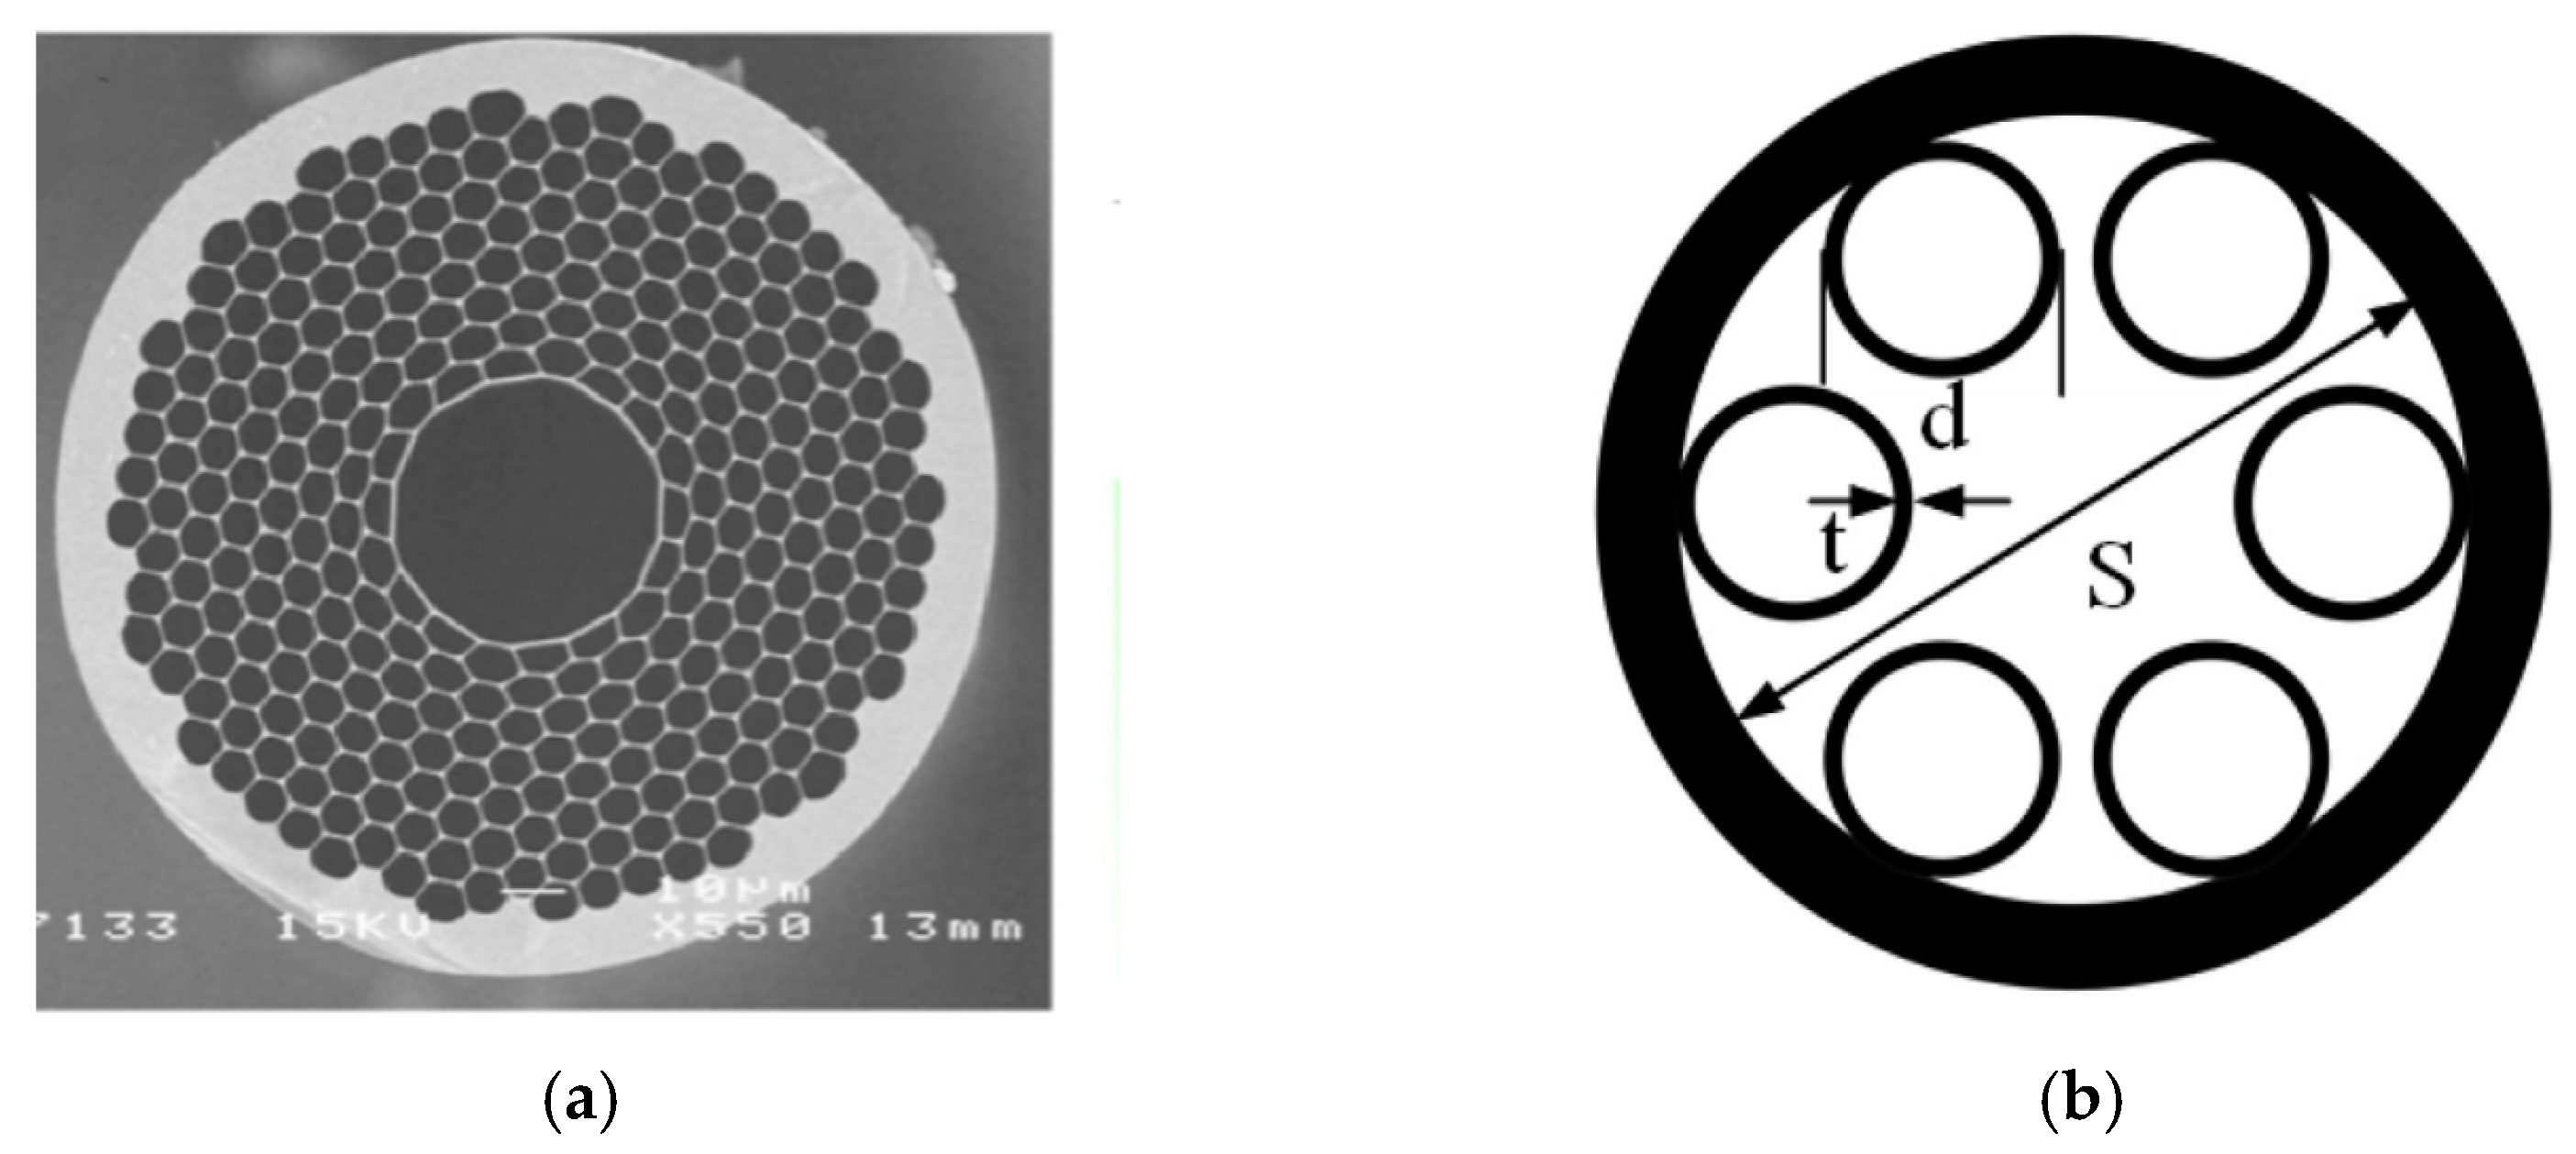
3.1. Hollow Core Photonic Crystal Fiber (HCPCF)
3.2. Capillary-Based Hollow Core Fiber (HCF)
4. Theoretical Analysis
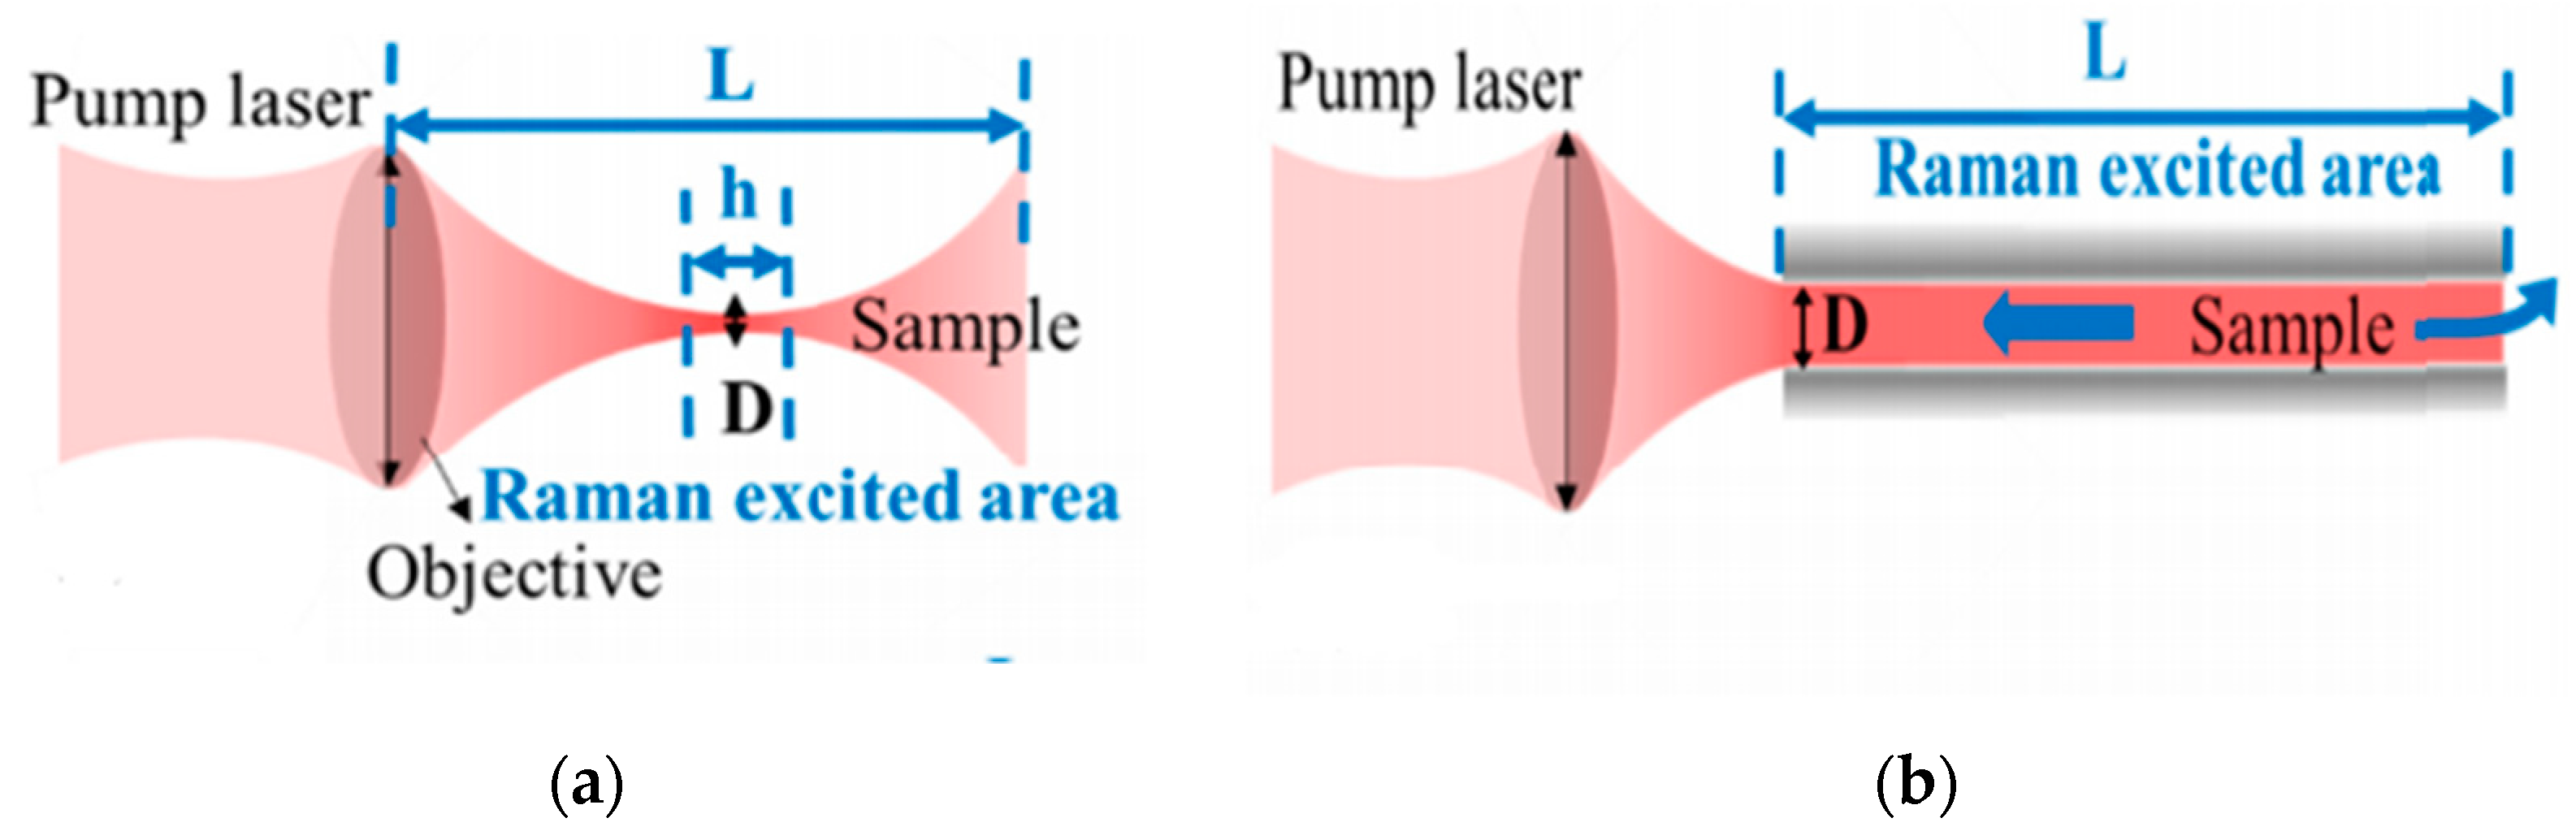
4.1. Theoretical Analysis of FERS
4.2. Theoretical Calculation of Raman Signal Enhancement
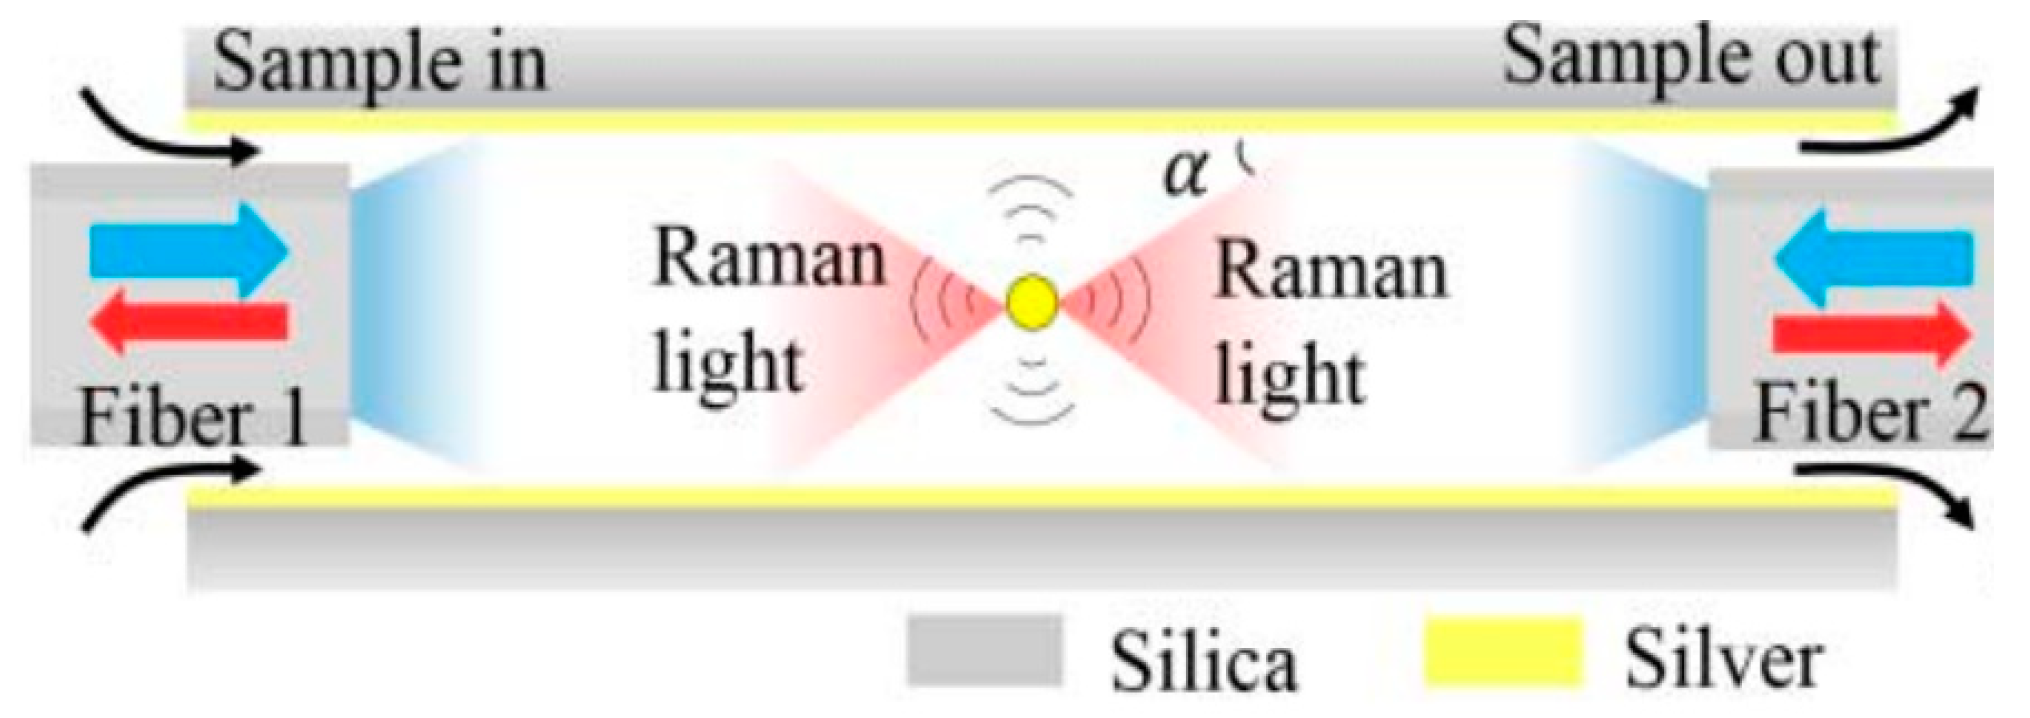
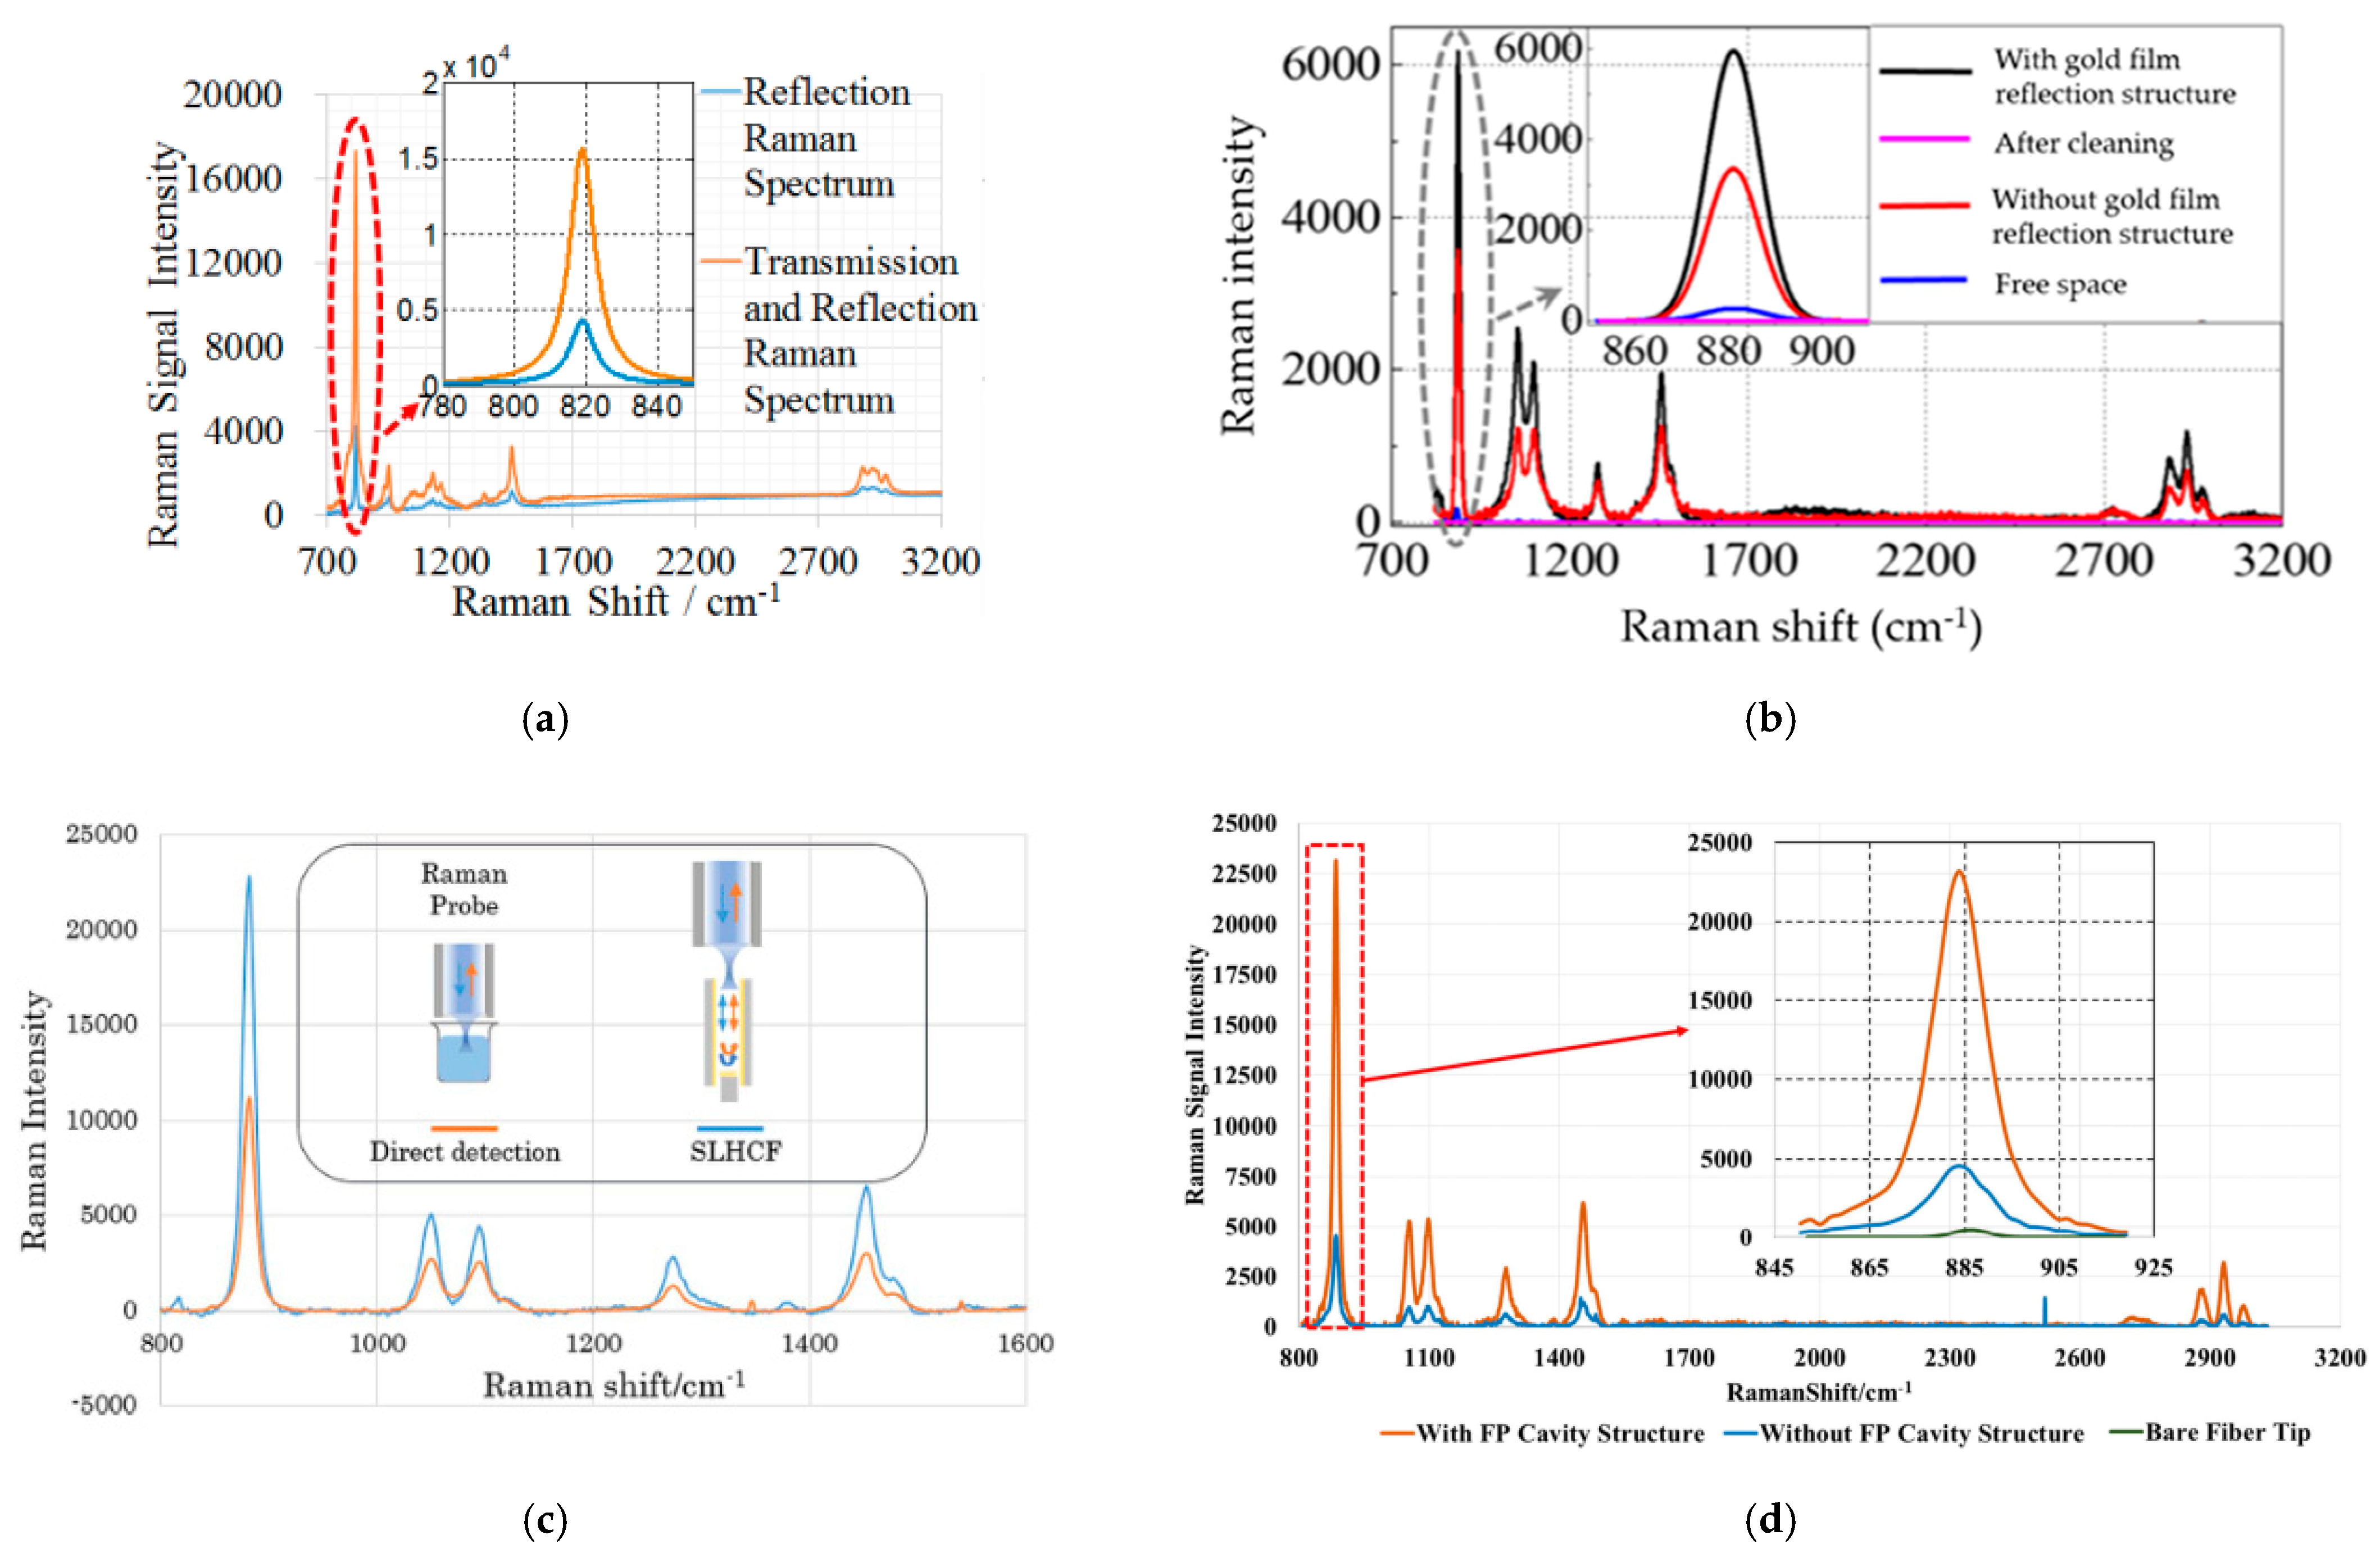
4.2.1. Sagnac Loop
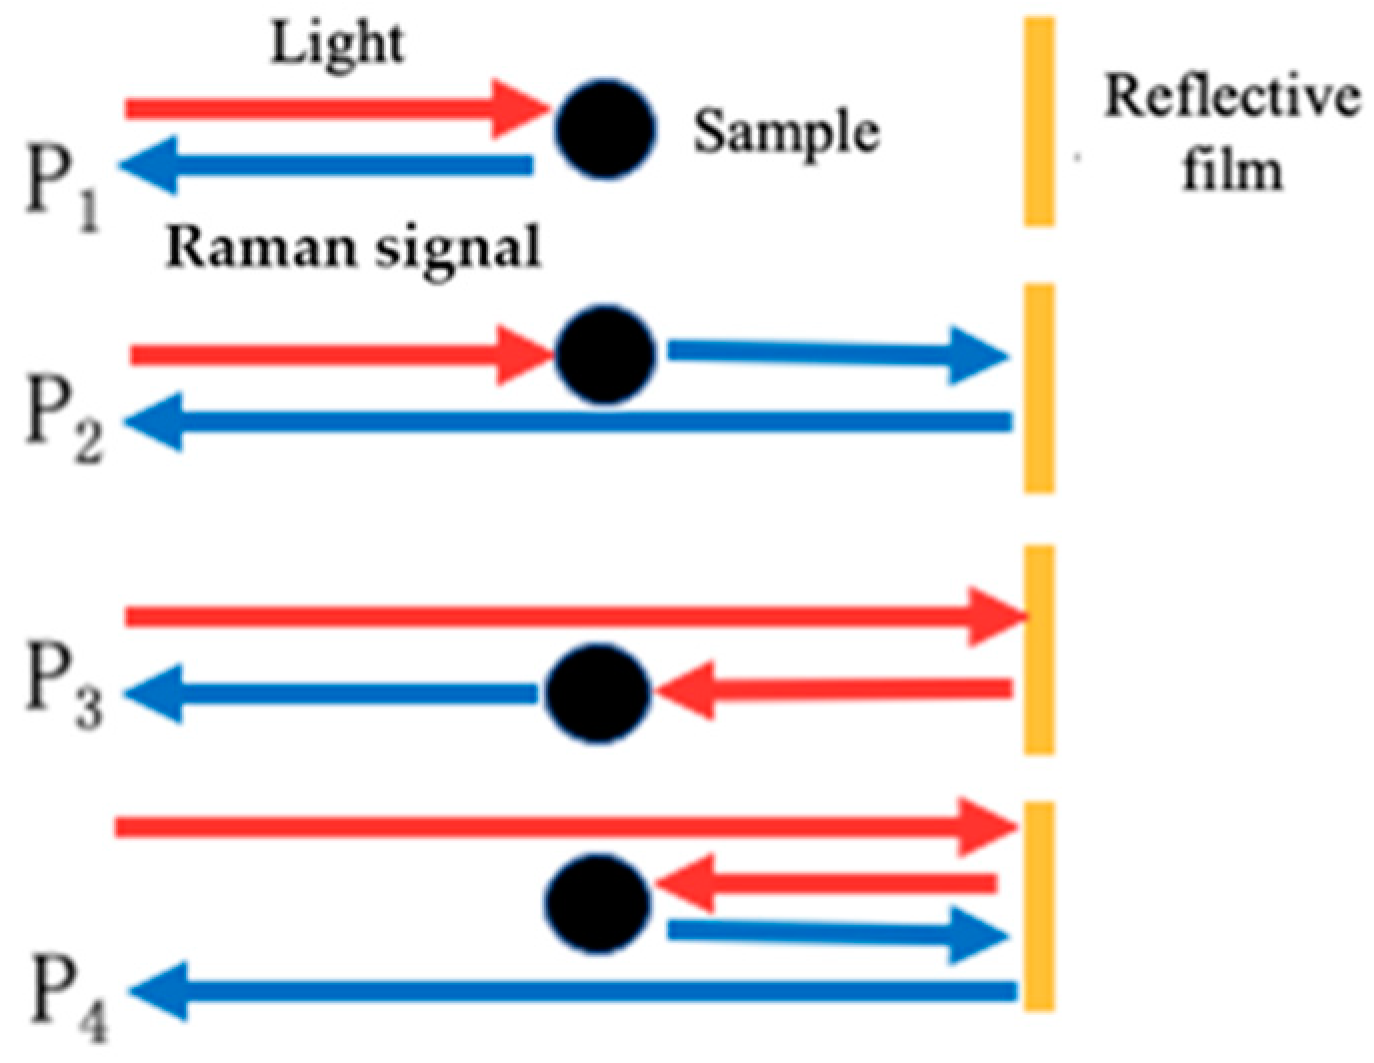
4.2.2. Capillary with an Inserted Reflector
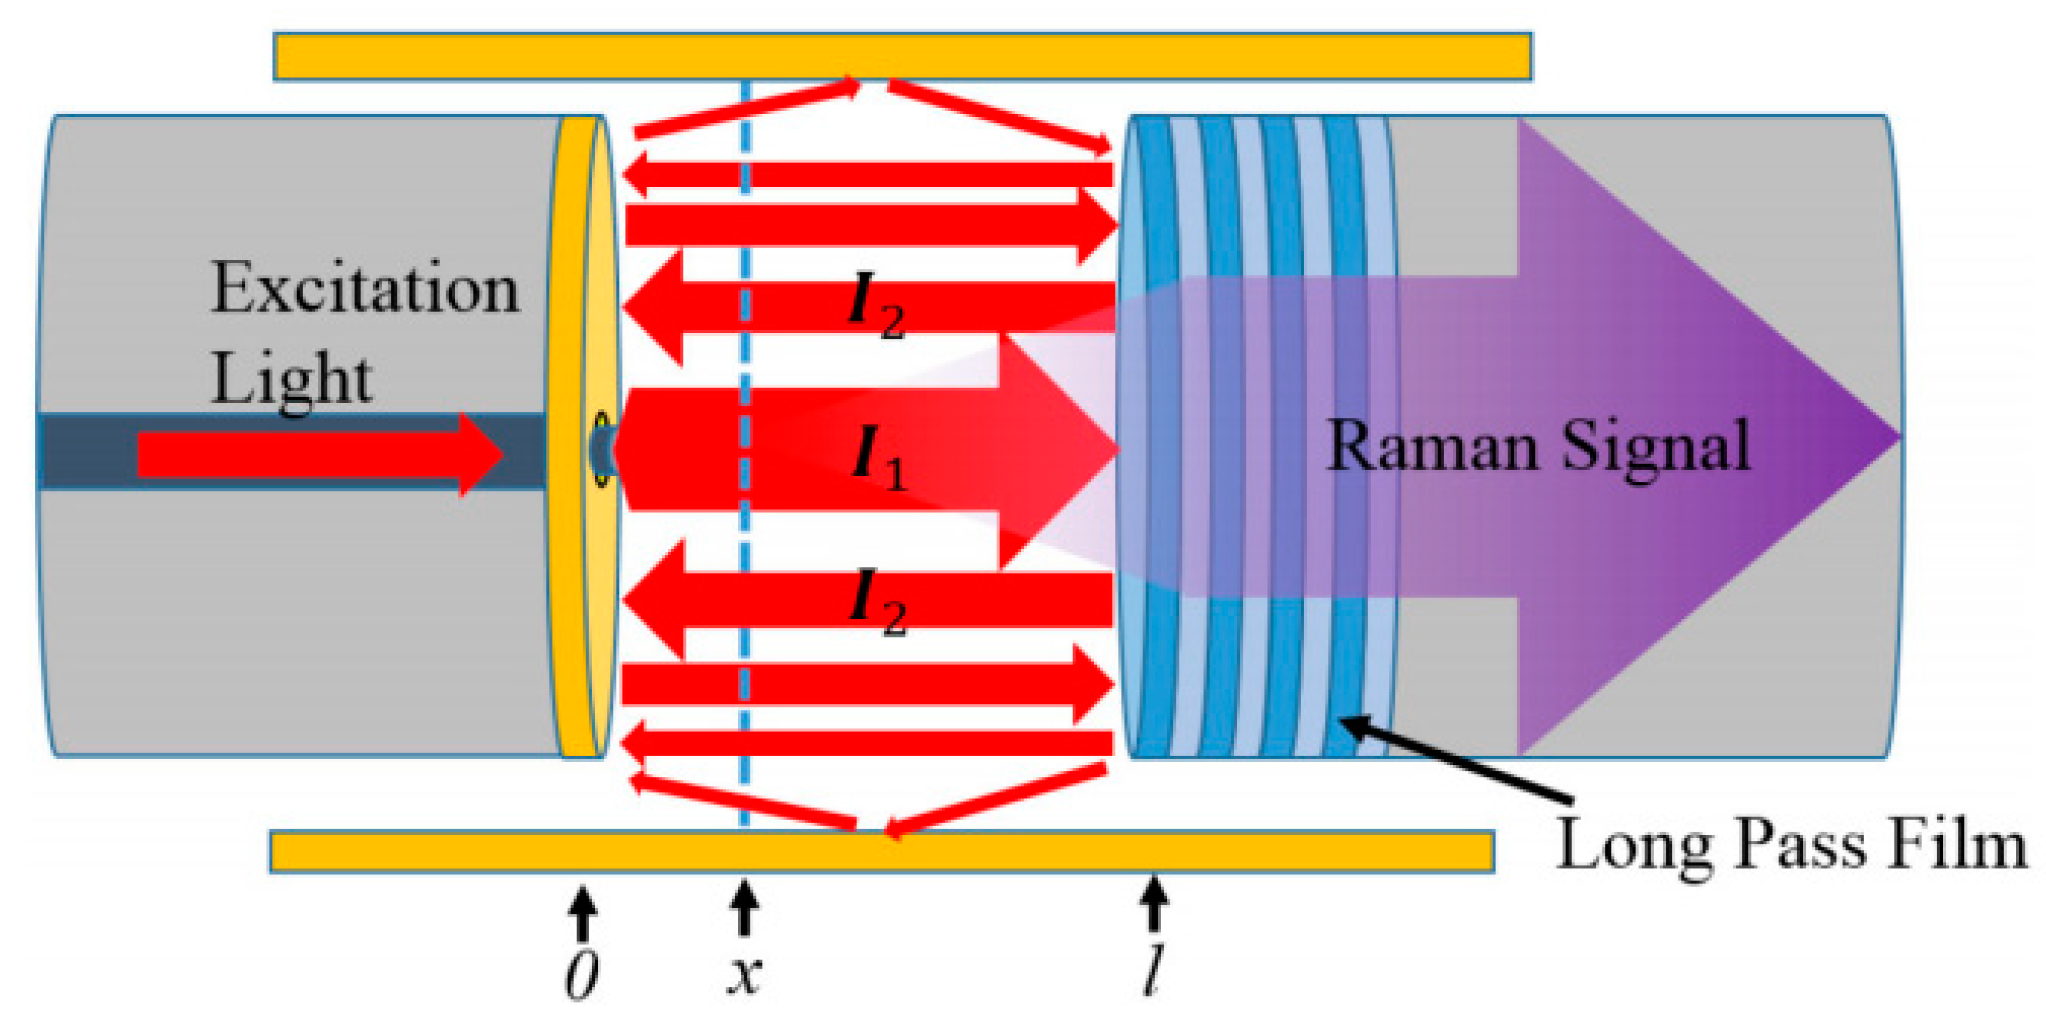
4.2.3. Capillary with an Inserted FP Cavity
5. Photonic Crystal Fiber for Raman Sensing
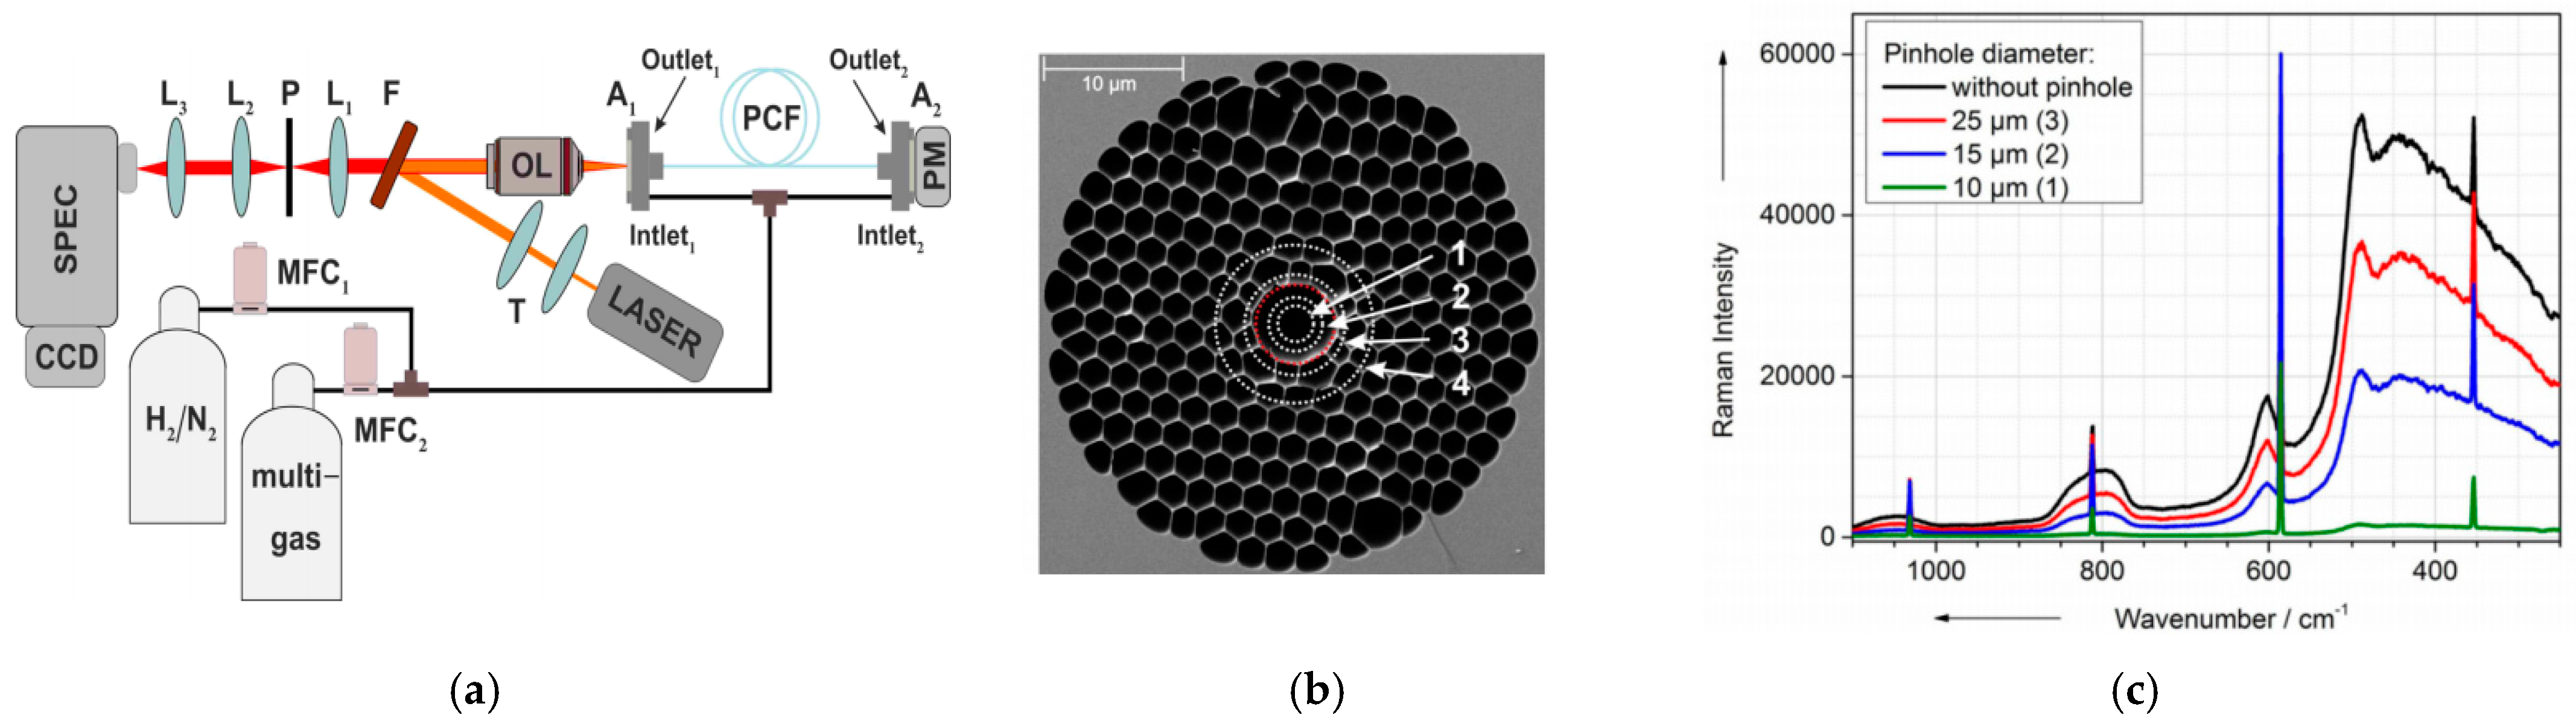
5.1. Hollow Core Photonic Band Gap Fibers (HCPBGFs)
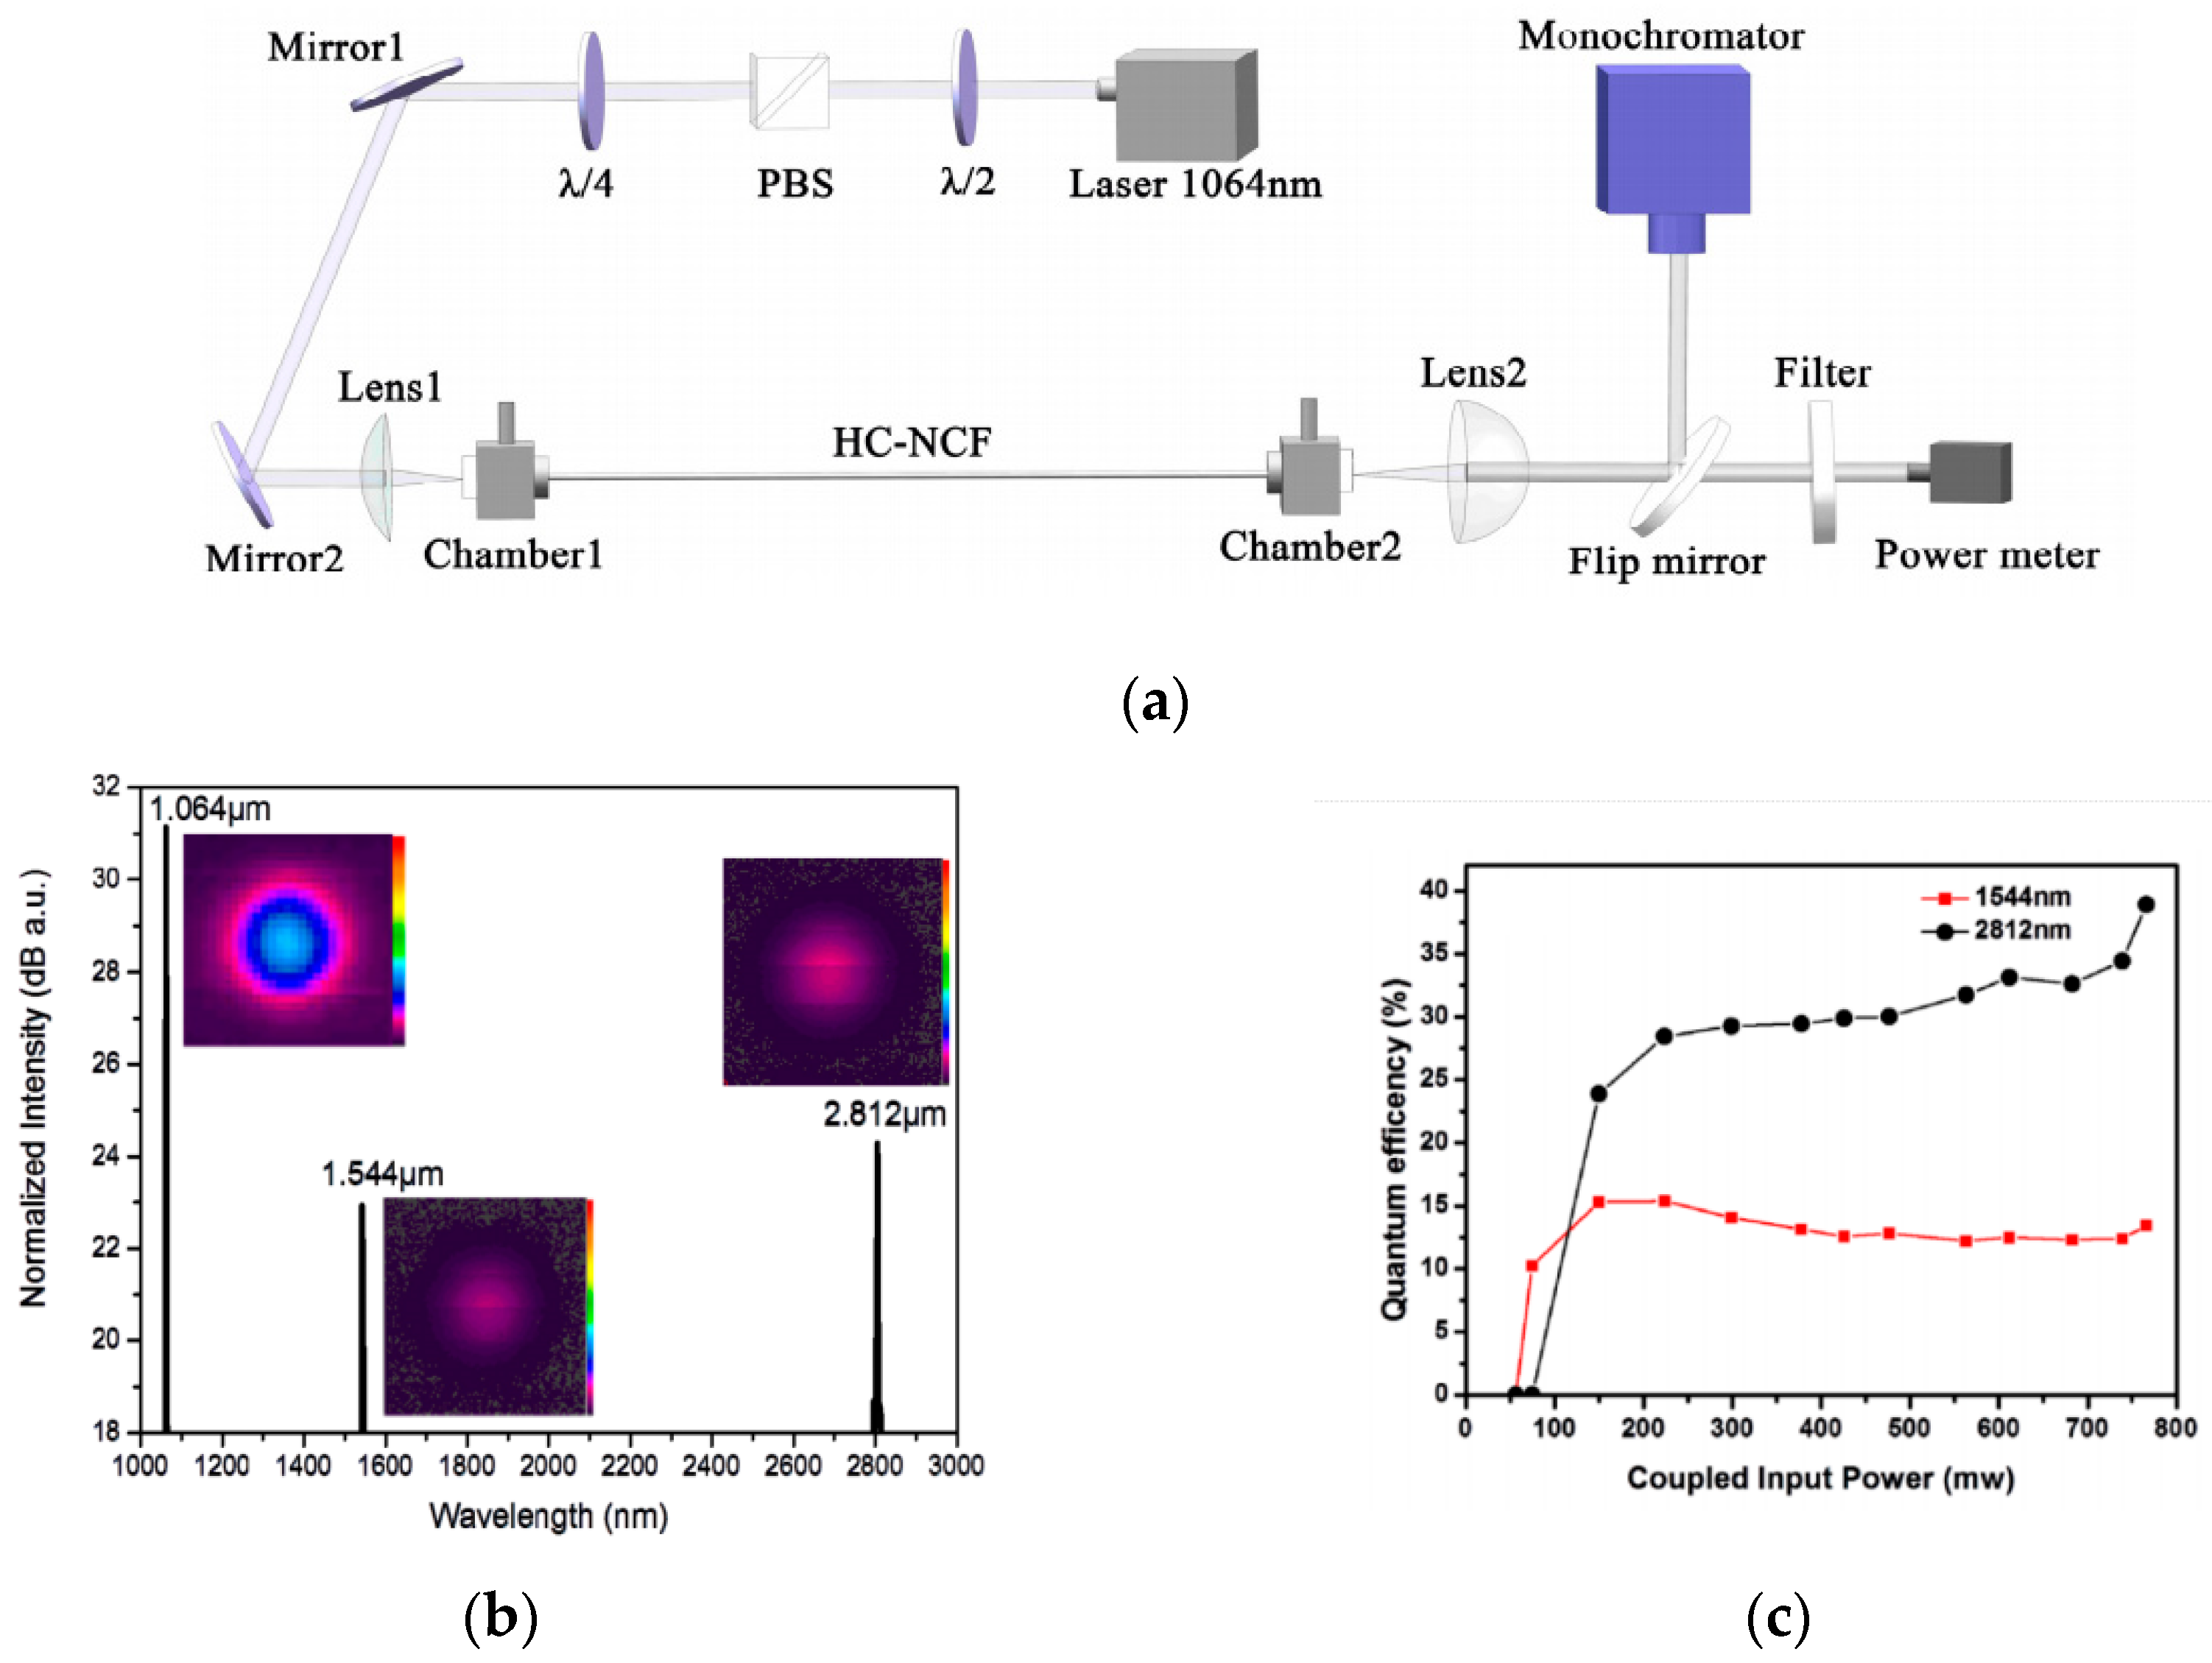
5.2. Hollow Core Anti-Resonant Fiber (HCARF)
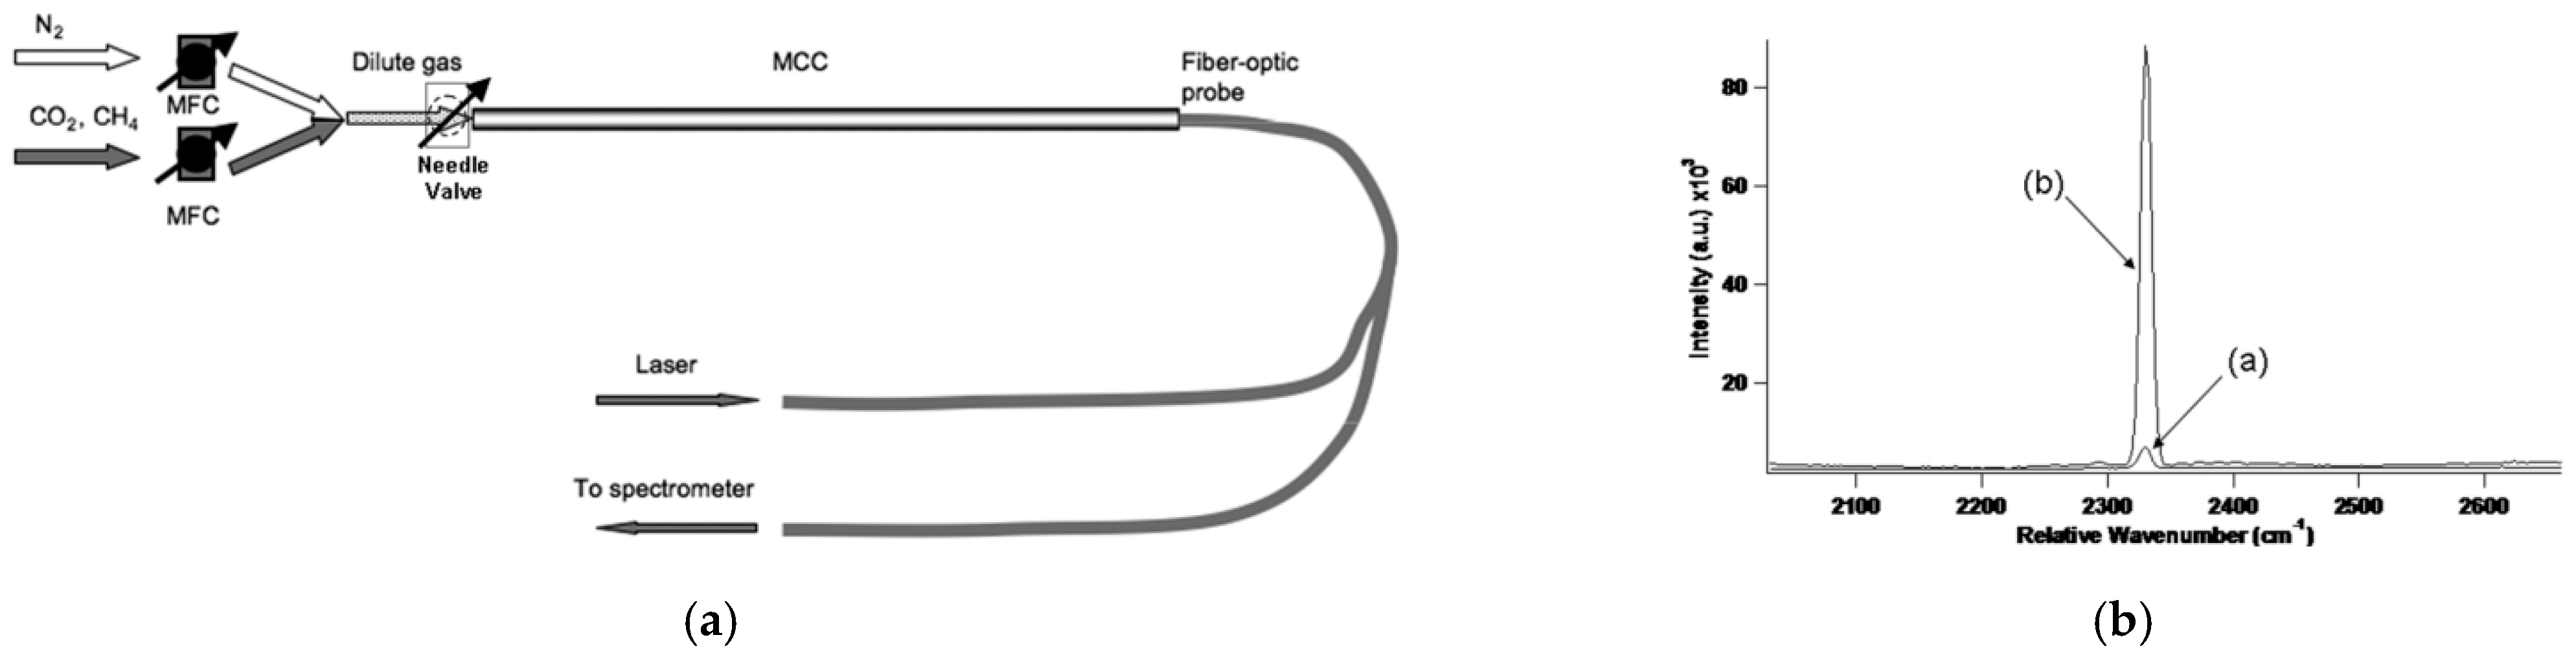
6. Capillary-Based Hollow Core Fiber for Raman Sensing
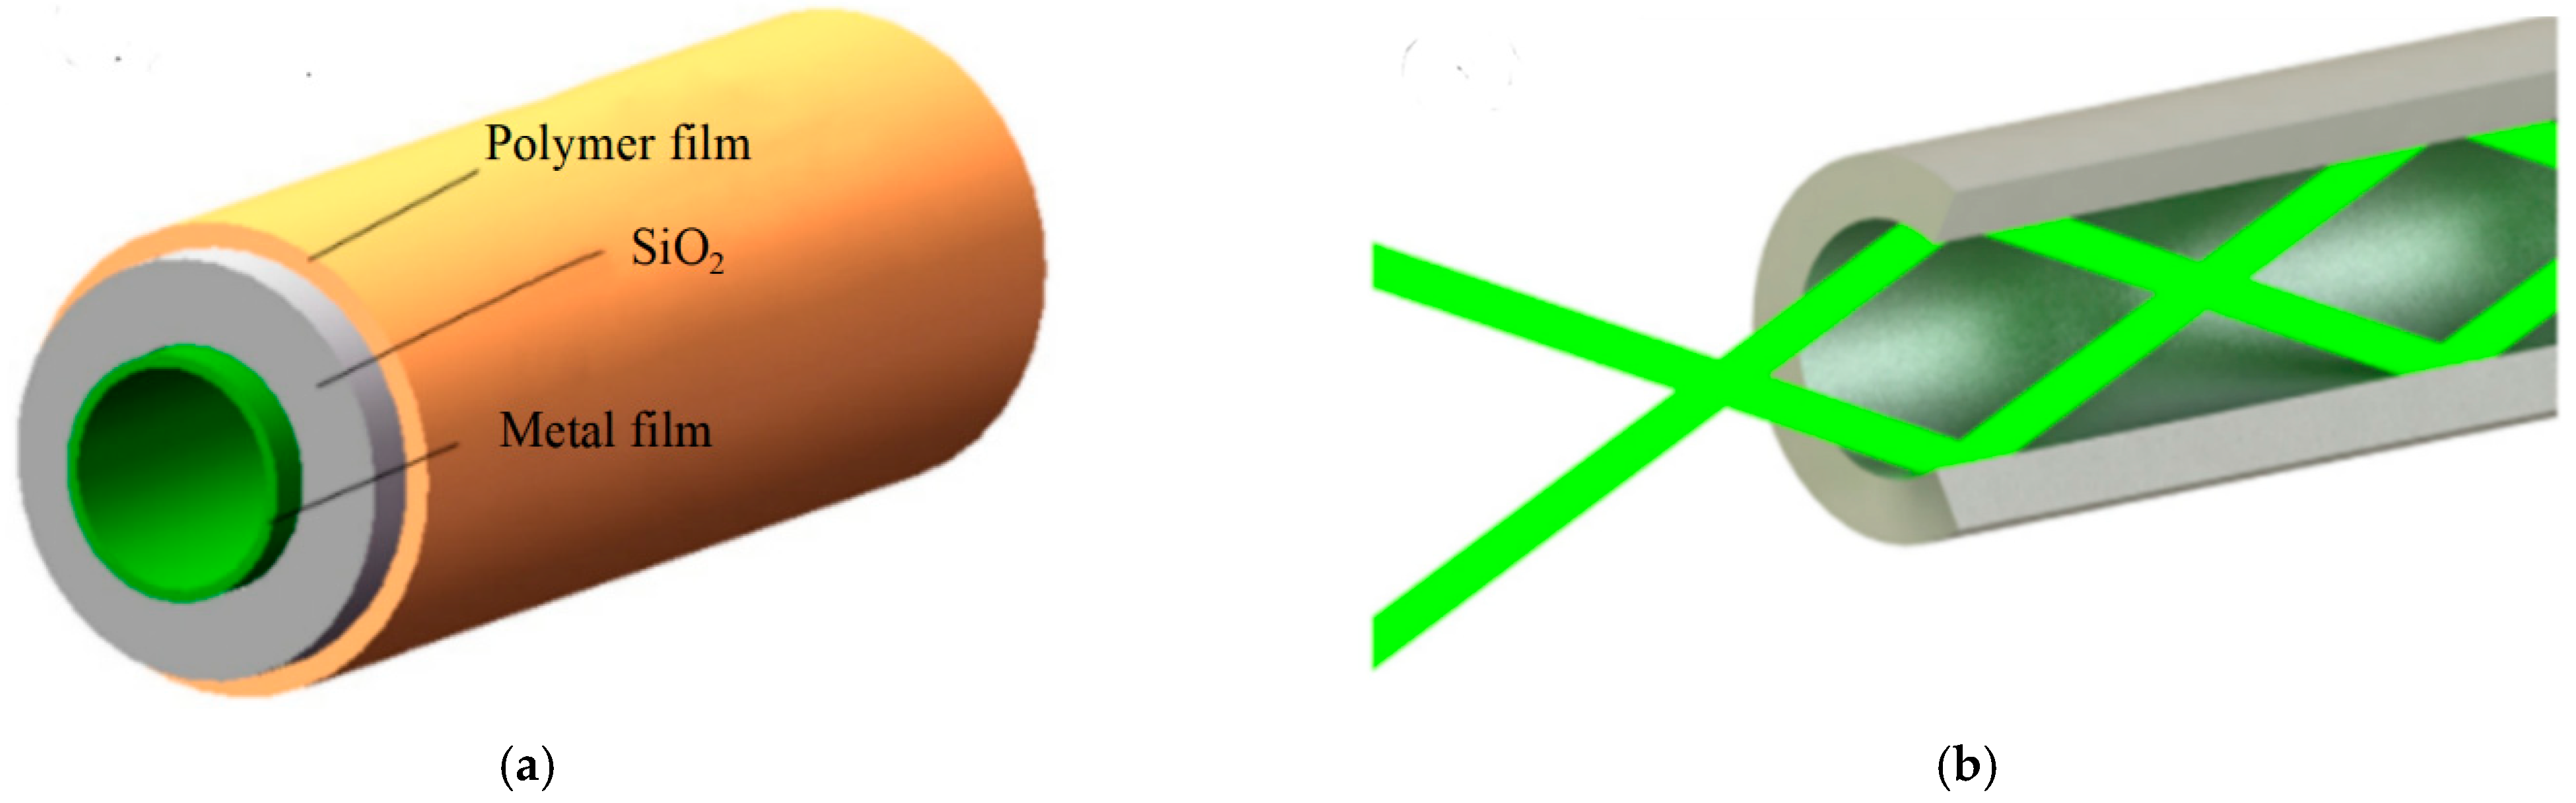
6.1. Metal-Lined Hollow Core Fiber (MLHCF)
6.1.1. Fabrication Method
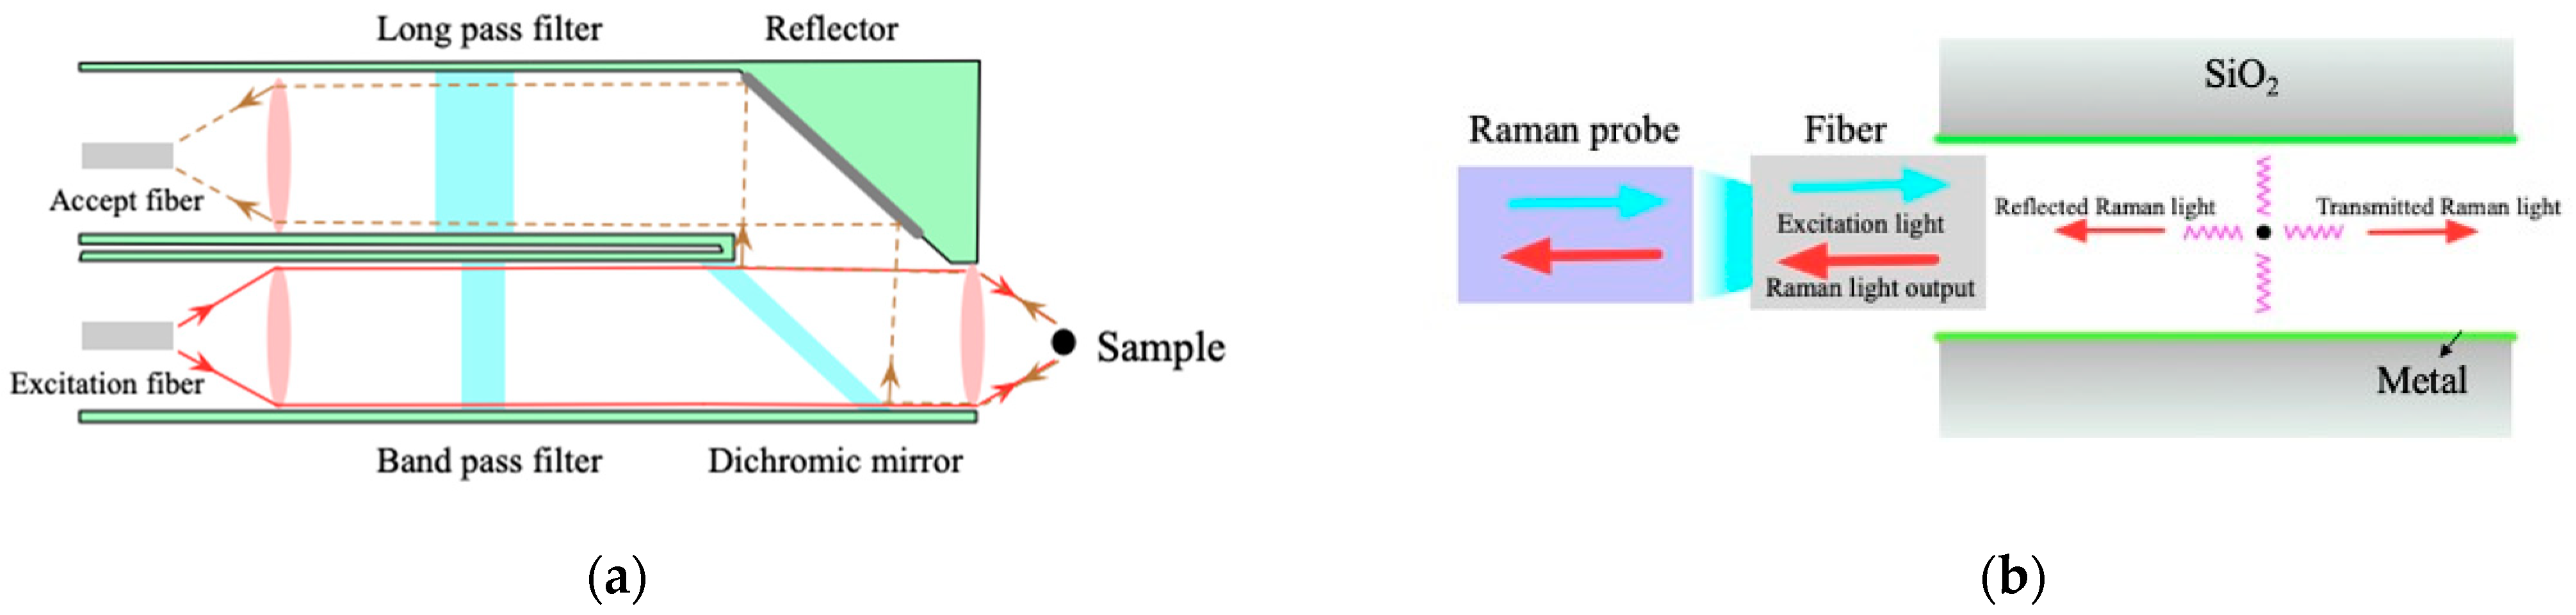
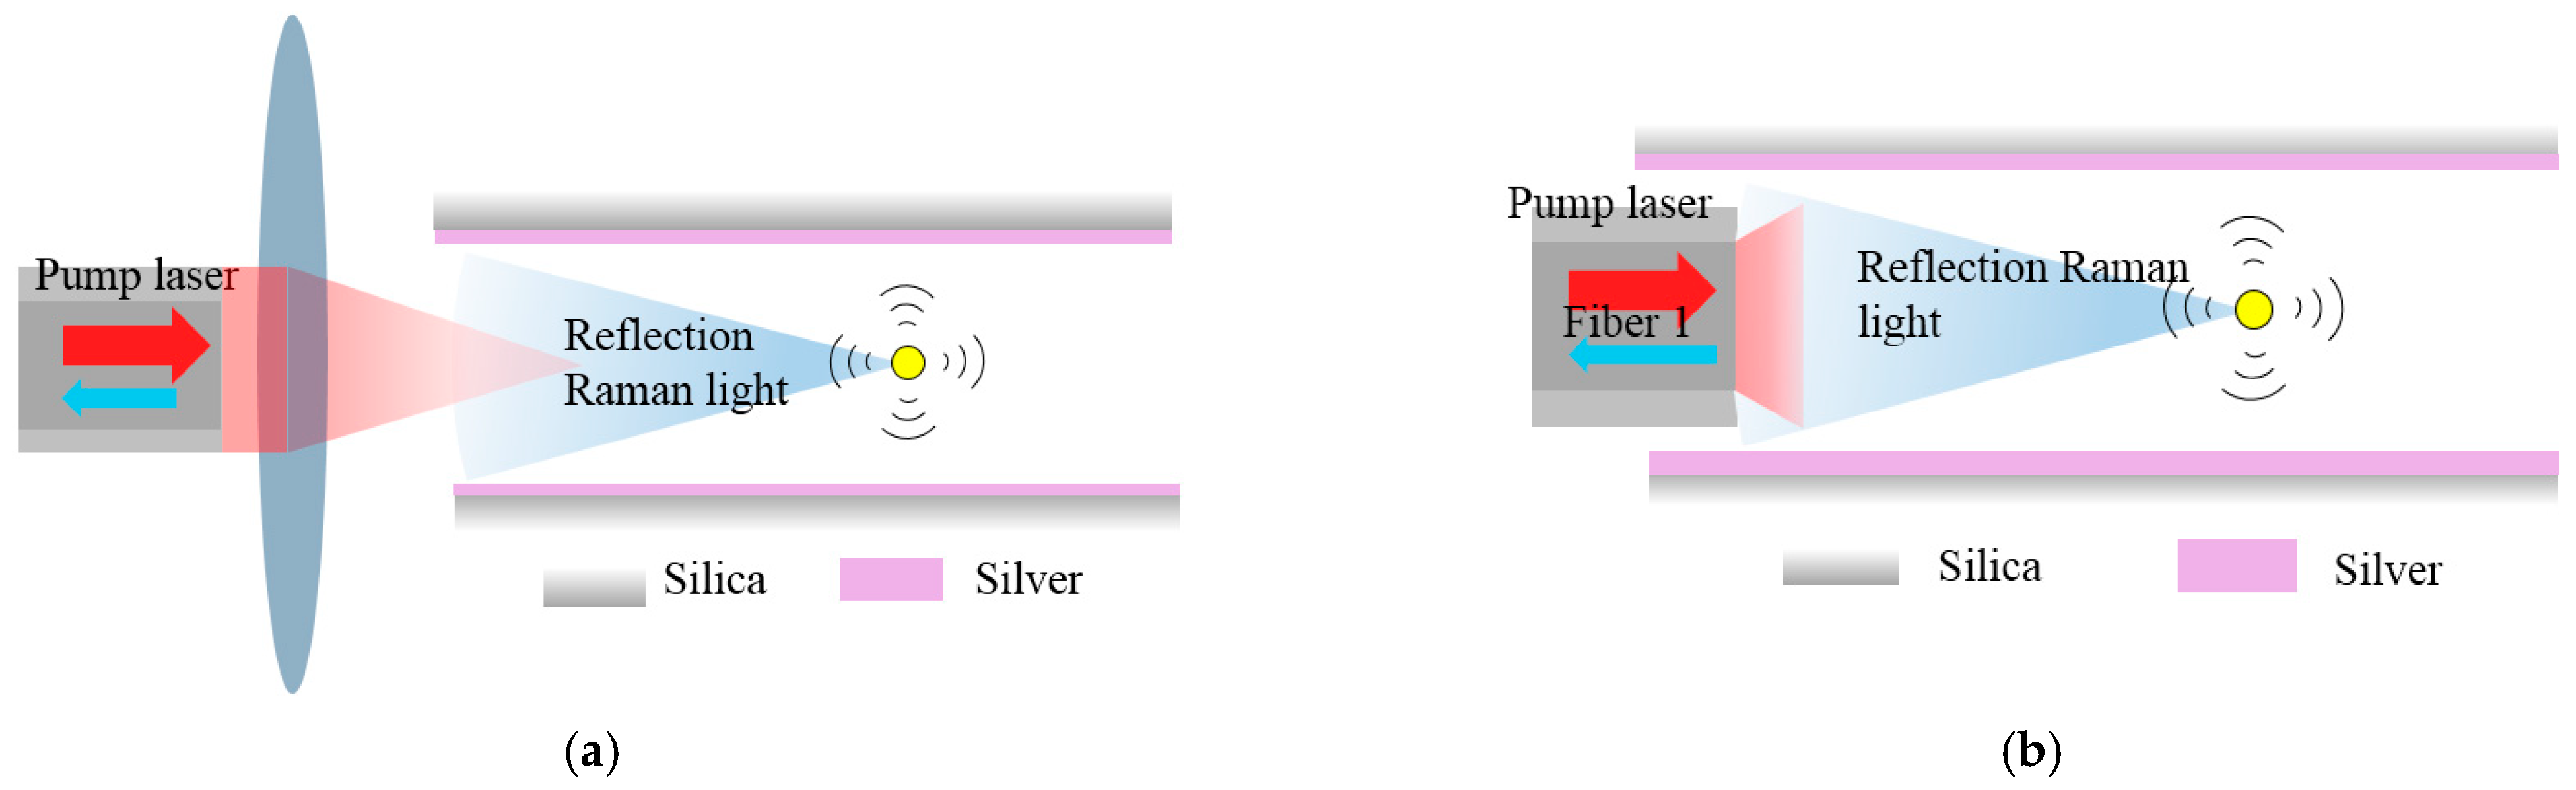
6.1.2. Enhancement by Optical Path Configurations
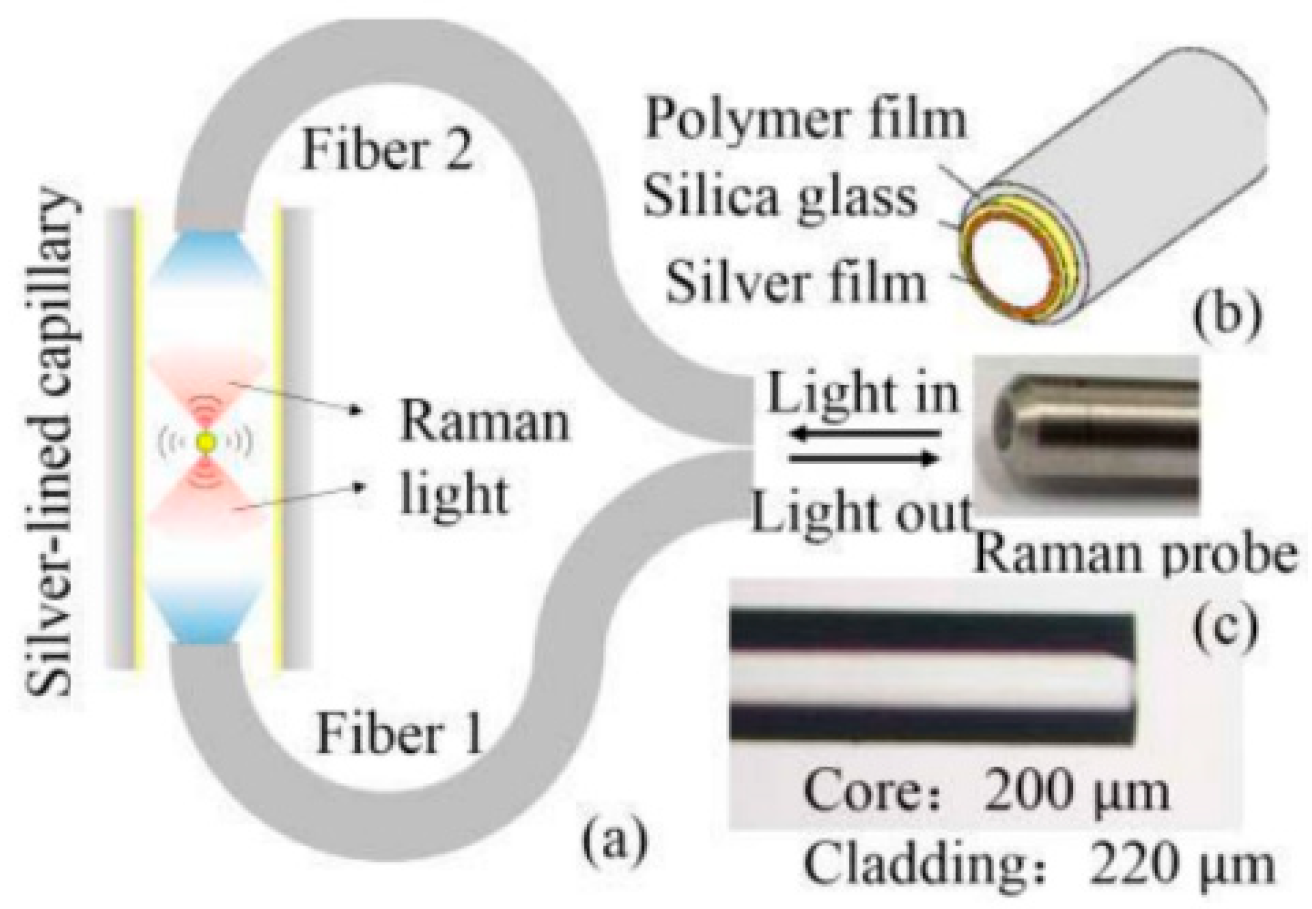
- Sagnac Loop
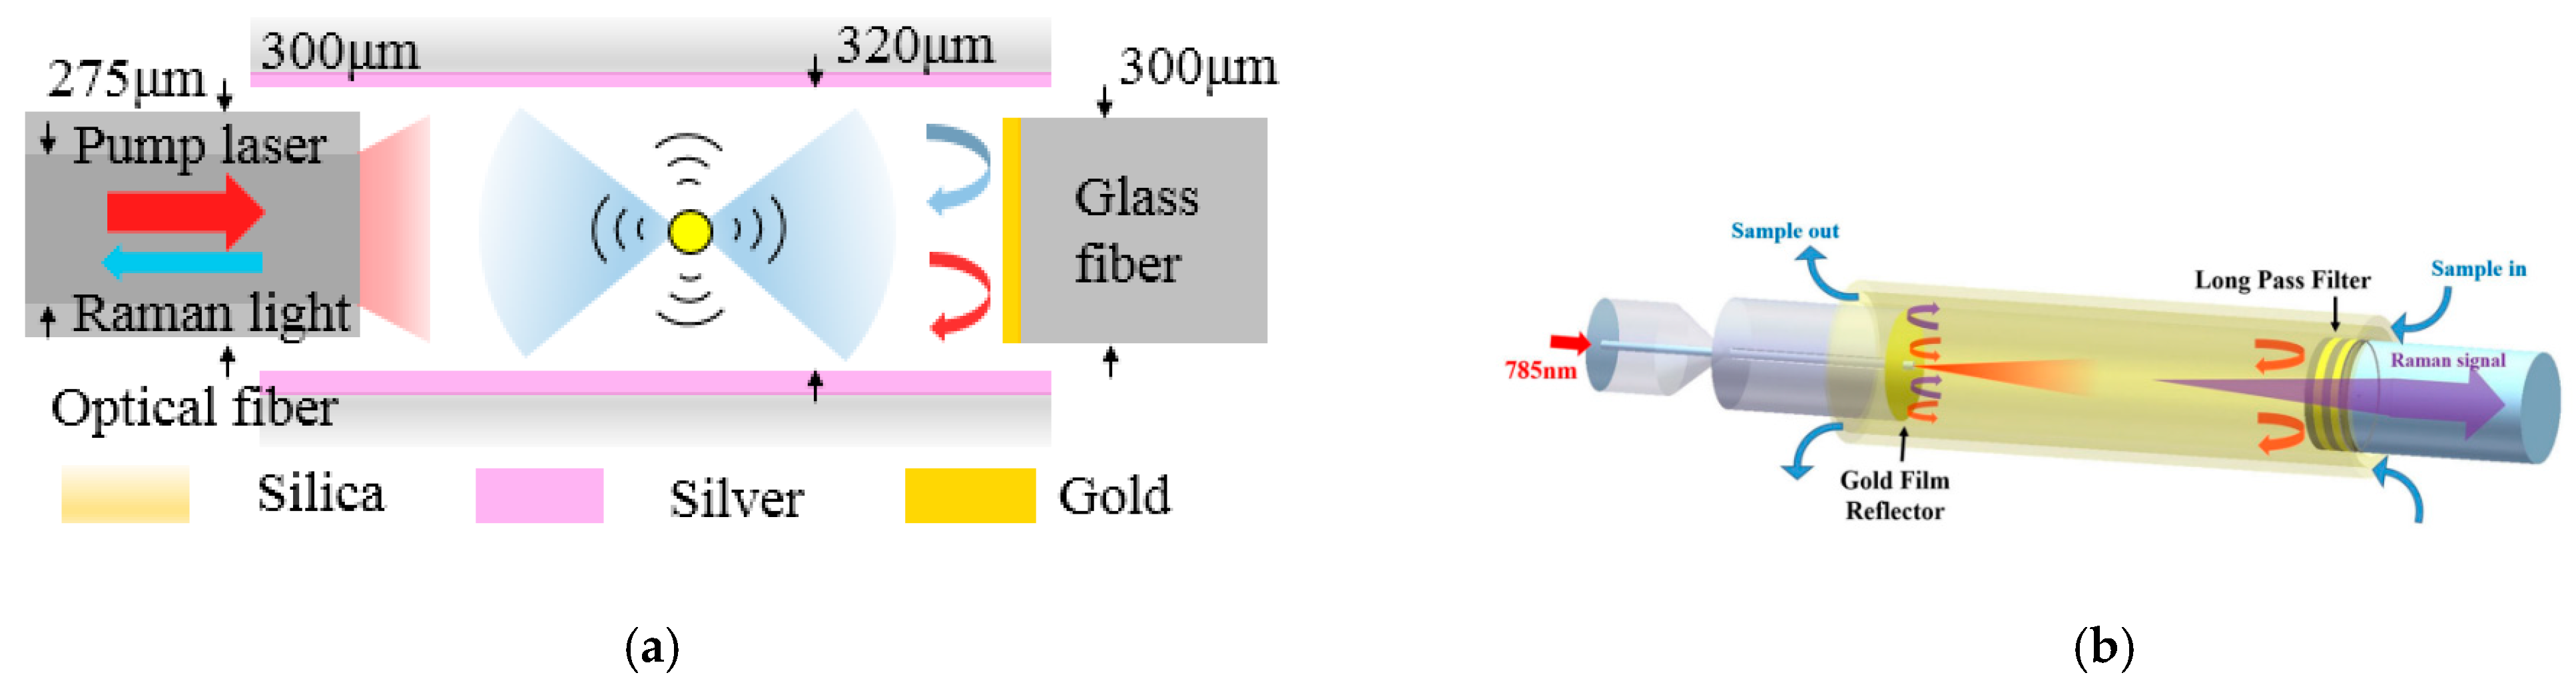
- Capillary with an inserted reflector
- Capillary with an inserted FP cavity
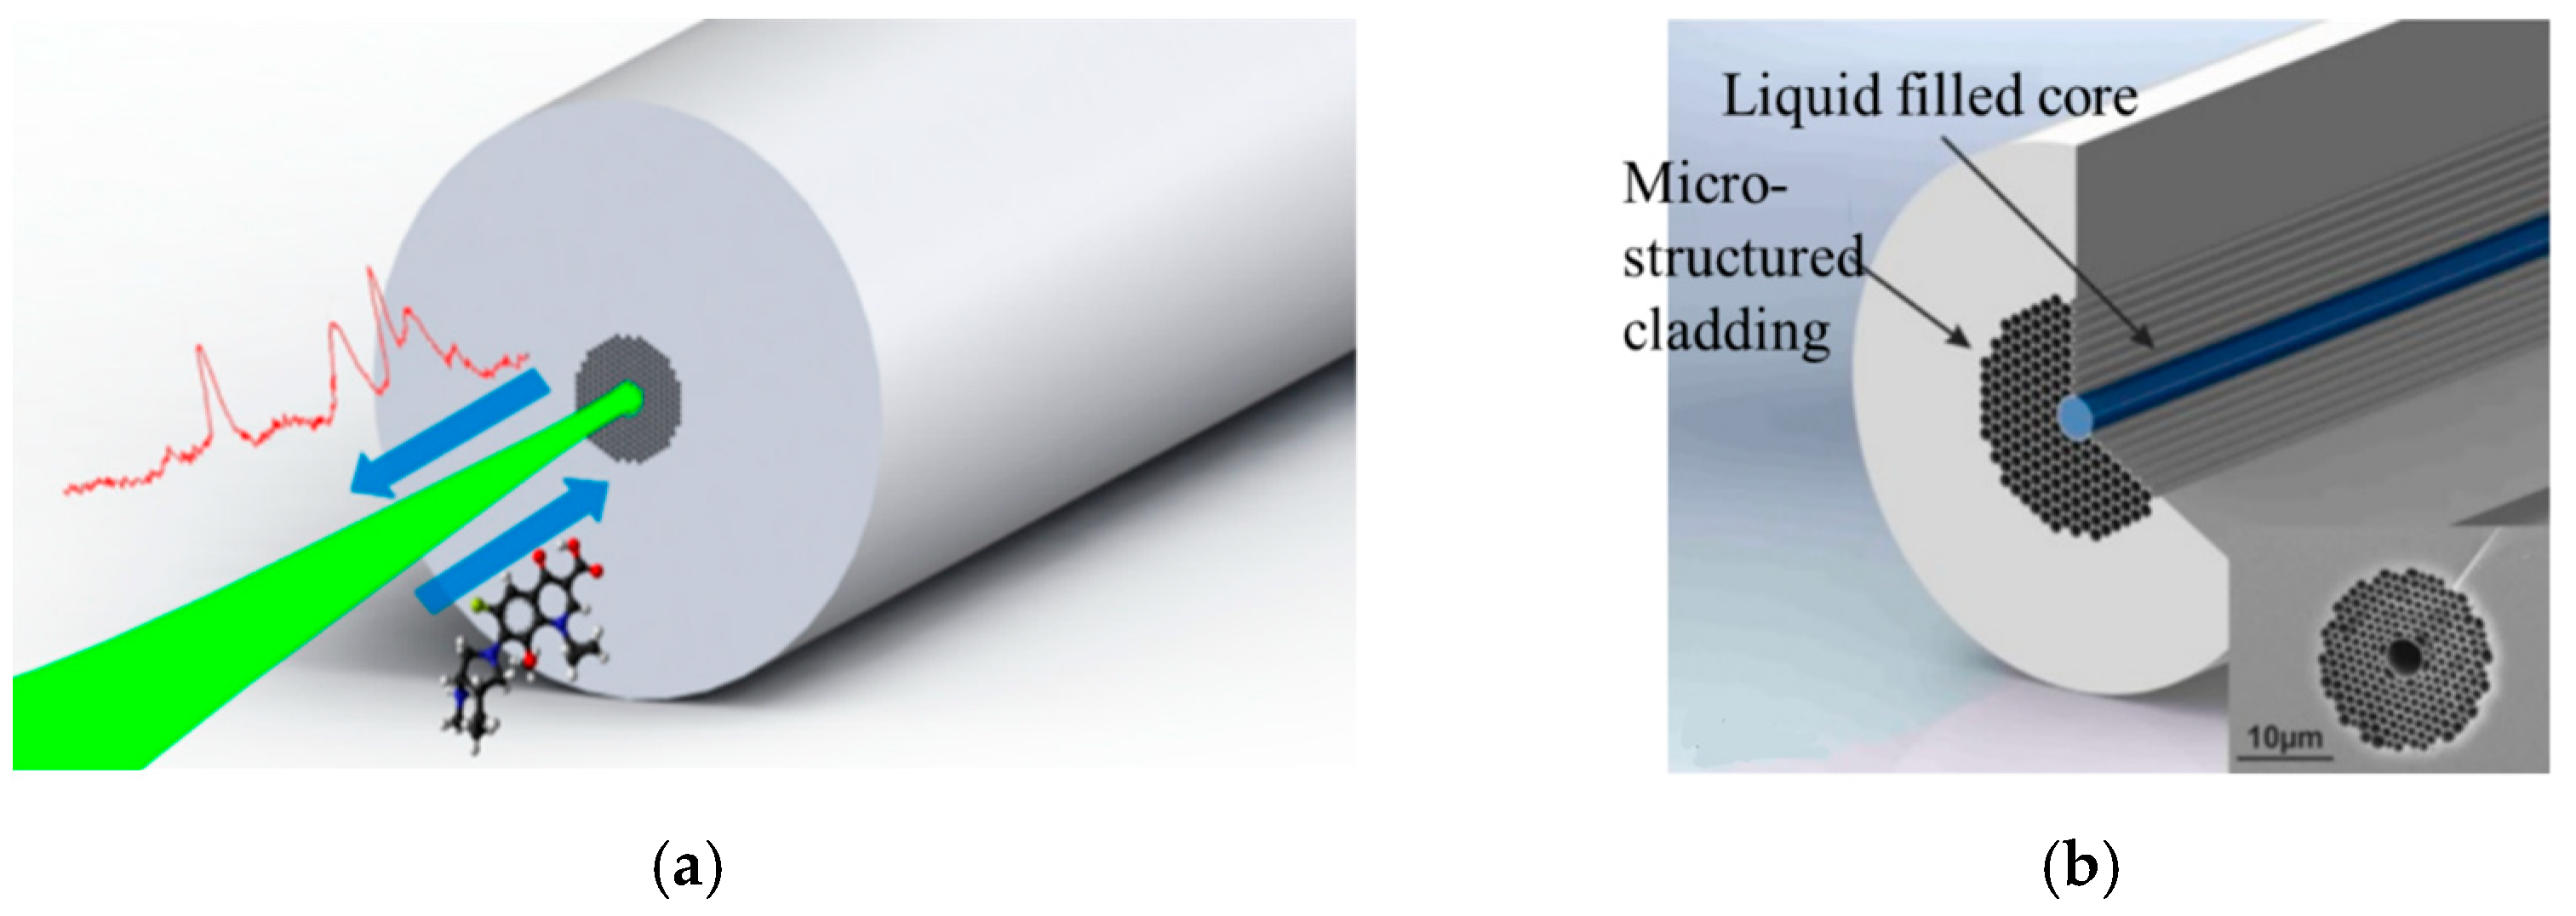
6.2. Liquid Core Optical Fiber (LOF)
7. HCF-based Raman Sensor Applications
7.1. Applications in Gas Detection
7.2. Applications in Liquid Detection
7.3. Application in Medicine
8. Prospect and Conclusions
Author Contributions
Funding
Institutional Review Board Statement
Informed Consent Statement
Data Availability Statement
Conflicts of Interest
References
- Lee, K.S.; Landry, Z.; Pereira, F.C.; Wagner, M.; Berry, D.; Huang, W.E.; Taylor, G.T.; Kneipp, J.; Popp, J.; Zhang, M.; et al. Raman microspectroscopy for microbiology. Nat. Rev. Methods Primers 2021, 1, 80. [Google Scholar] [CrossRef]
- Ho, C.-S.; Jean, N.; Hogan, C.A.; Blackmon, L.; Jeffrey, S.S.; Holodniy, M.; Banaei, N.; Saleh, A.A.E.; Ermon, S.; Dionne, J. Rapid identification of pathogenic bacteria using Raman spectroscopy and deep learning. Nat. Commun. 2019, 10, 4927. [Google Scholar] [CrossRef]
- Kassa-Baghdouche, L.; Cassan, E. Mid-infrared refractive index sensing using optimized slotted photonic crystal waveguides. Photon. Nanostruct. Fundam. Appl. 2018, 28, 32–36. [Google Scholar] [CrossRef]
- Kassa-Baghdouche, L.; Cassan, E. Sensitivity analysis of ring-shaped slotted photonic crystal waveguides for mid-infrared refractive index sensing. Opt. Quantum Electron. 2019, 51, 328. [Google Scholar] [CrossRef]
- Wu, L.; Ouyang, Z.H.; Cao, S.C. Research development and application of Raman scattering technology. Chin. J. Light Scatt. 2005, 17, 180–186. [Google Scholar]
- Schwab, S.D.; Mccreery, R.L. Remote, long-pathlength cell for high-sensitivity Raman spectroscopy. Appl. Spectrosc. 1987, 41, 126–130. [Google Scholar] [CrossRef]
- Raman, C.V.; Krishnan, K.S. The optical analogue of the compton effect. Nature 1928, 121, 711. [Google Scholar] [CrossRef]
- Kudelski, A. Analytical applications of Raman spectroscopy. Talanta 2008, 76, 1–8. [Google Scholar] [CrossRef]
- Rostron, P.; Gerber, D. Raman spectroscopy, a review. Int. J. Eng. Tech. Res. 2016, 6, 50–64. [Google Scholar]
- Chu, Q. Enhanced Raman Detection Based on the Metal-lined Hollow-Core Fiber. Master’s Thesis, Nanjing University, Nanjing, China, 2019. [Google Scholar]
- Harvey, B.; Coherent, A. Anti-stokes Raman spectroscopy. Anal. Chem. 1978, 50, 905A–912A. [Google Scholar] [CrossRef]
- Hercher, M.; Mueller, W.; Klainer, S.; Adamowicz, R.F.; Schwartz, S.E. An efficient intracavity laser Raman spectrometer. Appl. Spectrosc. 1978, 32, 298–302. [Google Scholar] [CrossRef]
- Fleischmann, M.P.; Hendra, P.J.; Mcquillan, A.J. Raman spectra of pyridine adsorbed at a silver electrode. Chem. Phys. Lett. 1974, 26, 163–166. [Google Scholar] [CrossRef]
- Johannessen, C.; White, P.C.; Abdali, S. Resonance Raman optical activity and surface enhanced resonance Raman optical activity analysis of cytochrome C. J. Phys. Chem. A 2007, 111, 7771–7776. [Google Scholar] [CrossRef]
- Spiro, T.G.; Strekas, T.C. Resonance Raman spectra of heme proteins. Effects of oxidation and spin state. J. Am. Chem. Soc. 1974, 96, 338–345. [Google Scholar] [CrossRef] [PubMed]
- Maker, P.D.; Terhune, R.W. Study of optical effects due to an induced polarization third order in the electric field strength. Phys. Rev. 1965, 137, 801–818. [Google Scholar] [CrossRef]
- Cheng, J.X.; Xie, X.S. Coherent anti-stokes Raman scattering microscopy: Instrumentation, theory, and applications. J. Phys. Chem. B 2004, 108, 827–840. [Google Scholar] [CrossRef]
- Roy, S.; Gord, J.R.; Patnaik, A.K. Recent advances in coherent anti-stokes Raman scattering spectroscopy: Fundamental developments and applications in reacting flows. Prog. Energy Combust. Sci. 2010, 36, 280–306. [Google Scholar] [CrossRef]
- King, D.A.; Pittaro, R.J. Simple diode pumping of a power-buildup cavity. Opt. Lett. 1998, 23, 774. [Google Scholar] [CrossRef] [PubMed]
- Taylor, D.J.; Glugla, M.; Penzhorn, R.D. Enhanced Raman sensitivity using an actively stabilized external resonator. Rev. Sci. Instrum. 2001, 72, 1970–1976. [Google Scholar] [CrossRef]
- Campion, A.; Kambhampati, P. Surface-enhanced Raman scattering. Chem. Soc. Rev. 1998, 27, 241–250. [Google Scholar] [CrossRef]
- Stockle, R.M.; Suh, Y.D.; Deckert, V.; Zenobi, R. Nanoscale chemical analysis by tip-enhanced Raman spectroscopy. Chem. Phys. Lett. 2000, 318, 131–136. [Google Scholar] [CrossRef]
- Pettinger, B.; Picardi, G.; Schuster, R.; Ertl, G. Surface-enhanced and STM tip-enhanced Raman spectroscopy of CN—Ions at gold surfaces. J. Electroanal. Chem. 2003, 554–555, 293–299. [Google Scholar] [CrossRef]
- Neacsu, C.C.; Dreyer, J.; Behr, N.; Raschke, M.B. Scanning-probe Raman spectroscopy with single-molecule sensitivity. Phys. Rev. B 2006, 73, 193406. [Google Scholar] [CrossRef]
- Moskovits, M. Surface-enhanced Raman spectroscopy: A brief retrospective. J. Raman Spectrosc. 2010, 36, 485–496. [Google Scholar] [CrossRef]
- Pettinger, B.; Ren, B.; Picardi, G.; Schuster, R.; Ertl, G. Nanoscale probing of adsorbed species by tip-enhanced Raman spectroscopy. Phys. Rev. Lett. 2004, 92, 096101. [Google Scholar] [CrossRef] [Green Version]
- Cai, H.; Yu, X.T.; Chu, Q.; Jin, Z.Q.; Lin, B.; Wang, G.H. Hollow-core fiber-based Raman probe extension kit for in situ and sensitive ultramicro-analysis. Chin. Opt. Lett. 2019, 17, 5–9. [Google Scholar] [CrossRef]
- Zhang, N.Q.; Qin, T.L.; Wang, Z.F.; Liu, W.B.; Cao, J.Q.; Chen, Z.L. Low-loss coupling between tapered fibersand anti-resonant hollow-core photonic crystal fibers. Laser Optoelectron. Prog. 2017, 54, 100608. [Google Scholar] [CrossRef]
- Shephard, J.D.; Macpherson, W.N.; Maier, R.R.J.; Jones, J.D.C.; Knight, J.C. Single-mode mid-IR guidance in a hollow-core photonic crystal fiber. Opt. Express 2005, 13, 7139–7144. [Google Scholar] [CrossRef]
- Zhang, W.; Lou, S.; Wang, X.; Yan, S.; Xing, Z. A broadband single mode single polarization metal wires-embedded hollow core anti-resonant fiber for polarization filter. Opt. Fiber Technol. 2019, 53, 102011. [Google Scholar] [CrossRef]
- Salter, R.; Chu, J.; Hippler, M. Cavity-enhanced Raman spectroscopy with optical feedback cw diode lasers for gas phase analysis and spectroscopy. Analyst 2012, 137, 4669–4676. [Google Scholar] [CrossRef]
- Jin, Z.; Chu, Q.; Xu, W.; Cai, H.; Ji, W.; Wang, G.; Lin, B.; Zhang, X. All-fiber Raman biosensor by combining reflection and transmission mode. IEEE Photon. Technol. Lett. 2018, 30, 387–390. [Google Scholar] [CrossRef]
- Zhang, Z.M.; Chen, S.; Liang, Y.Z.; Liu, Z.X.; Zhang, Q.M.; Ding, L.X.; Ye, F.; Zhou, H. An intelligent background-correction algorithm for highly fluorescent samples in Raman spectroscopy. J. Raman Spectrosc. 2010, 41, 659–669. [Google Scholar] [CrossRef]
- Gambling, W.A.; Payne, D.N.; Matsumura, H. Gigahertz bandwidths in multimode, liquid-core, optical fibre waveguide. Opt. Commun. 1972, 6, 317–322. [Google Scholar] [CrossRef] [Green Version]
- Stone, J. Optical transmission in liquid-core quartz fibers. Appl. Phys. Lett. 1972, 20, 239–241. [Google Scholar] [CrossRef]
- Ogilvie, G.J.; Esdaile, R.J.; Kidd, G.P. Transmission loss of tetrachloroethylene-filled liquid-core-fibre light guide. Electron. Lett. 1972, 8, 533–534. [Google Scholar] [CrossRef]
- Ippen, E.P. Low-power quasi-cw Raman oscillator. Appl. Phys. Lett. 1970, 16, 303–305. [Google Scholar] [CrossRef]
- Walrafen, G.E.; Stone, J. Intensification of spontaneous Raman spectra by use of liquid core optical fibers. Appl. Spectrosc. 1972, 26, 585–589. [Google Scholar] [CrossRef]
- Fuwa, K.; Lei, W.; Fujiwara, K. Colorimetry with a total-reflection long capillary cell. Anal. Chem. 1984, 56, 1640–1644. [Google Scholar] [CrossRef]
- Fujiwara, K.; Simeonsson, J.B.; Smith, B.W.; Winefordner, J.D. Waveguide capillary flow cell for fluorometry. Anal. Chem. 1988, 60, 1065–1068. [Google Scholar] [CrossRef]
- Knebl, A.; Yan, D.; Popp, J.; Frosch, T. Fiber enhanced Raman gas spectroscopy. TrAC Trends Anal. Chem. 2017, 103, 230–238. [Google Scholar] [CrossRef]
- Frosch, T.; Di, Y.; Popp, J. Ultrasensitive fiber enhanced UV resonance Raman sensing of drugs. Anal. Chem. 2013, 85, 6264–6271. [Google Scholar] [CrossRef] [PubMed]
- Chu, Q.; Jin, Z.; Yu, X.; Li, C.; Zhang, W.; Ji, W.; Lin, B.; Shum, P.P.; Zhang, X.; Wang, G. Volumetric enhancement of Raman scattering for fast detection based on a silver-lined hollow-core fiber. Opt. Express 2019, 27, 10370–10382. [Google Scholar] [CrossRef] [PubMed]
- Jin, Z.Q.; Chu, Q.; Fan, D.Y.; Xu, W.H.; Cai, H.; Wang, G.H.; Xu, F.; Lin, B.; Zhang, X. All fiber on-line Raman detection system with silver-coated hollow fiber. In Proceedings of the 2017 16th International Conference on Optical Communications & Networks (ICOCN), Wuzhen, China, 7–10 August 2017; IEEE: Manhattan, NY, USA, 2017. [Google Scholar]
- Chu, Q.; Wang, G.H.; Jin, Z.Q.; Tan, J.; Cai, H.; Lin, B.; Zhang, X. All-fiber, portable, online Raman biosensor with enhancement of signal excitation and collection efficiency. In Proceedings of the 2018 Conference On Lasers and Electro-Optics (CLEO), San Jose, CA, USA, 13–18 May 2018; IEEE: Manhattan, NY, USA, 2018. [Google Scholar]
- Yu, X.T.; Li, C.X.; Hu, D.J.J.; Milenko, K.; Wang, G.H.; Shum, P.; Xu, F.; Lu, Y.Q.; Zhang, X.P. All-fiber online Raman sensor with enhancement via a fabry-perot cavity. Opt. Lett. 2020, 45, 5760–5763. [Google Scholar] [CrossRef]
- Russell, P. Photonic crystal fibers. Science 2003, 299, 358–362. [Google Scholar] [CrossRef]
- Benabid, F. Hollow-core photonic bandgap fibre: New light guidance for new science and technology. Philos. Trans. Math. Phys. Eng. Sci. 2006, 364, 3439–3462. [Google Scholar] [CrossRef]
- Cheng, T.L.; Li, S.G.; Zhou, G.Y.; Hou, L.T. Relation between power fraction in the core of hollow-core photonic crystal fibers and their bandgap property. Chin. J. Lasers 2007, 34, 249. [Google Scholar]
- Roberts, P.J.; Couny, F.; Sabert, H.; Mangan, B.J.; Russell, P.S.J. Ultimate low loss of hollow-core photonic crystal fibres. Opt. Express 2005, 13, 236–244. [Google Scholar] [CrossRef] [Green Version]
- Guo, X.R.; Yang, D.X. Propagating light with the full cladding of hollow-core photonic crystal fiber. J. Appl. Opt. 2011, 32, 744–748. [Google Scholar]
- Yuan, J.H.; Hou, L.T.; Wei, D.B.; Wang, H.Y.; Zhou, G.Y. Experimental investigation and the application of hollow-core photonic crystal fiber in visible range. J. Optoelectron. Laser 2008, 09, 1150–1153. [Google Scholar]
- Yan, D.; Popp, J.; Pletz, M.W.; Frosch, T. Highly sensitive broadband Raman sensing of antibiotics in step-index hollow-core photonic crystal fibers. ACS Photonics 2017, 4, 138–145. [Google Scholar] [CrossRef]
- He, D.D.; Liu, M.; Jian, D.; Li, D.; Liao, Z.Y. Study on loss in hollow-core photonic bandgap fibers. Laser Technol. 2013, 37, 243–246. [Google Scholar]
- Saitoh, K.; Koshiba, M. Confinement losses in air-guiding photonic bandgap fibers. IEEE Photonics Technol. Lett. 2003, 15, 236–238. [Google Scholar] [CrossRef]
- Kim, H.K.; Digonnet, M.; Kino, G.S.; Shin, J.; Fan, S. Simulations of the effect of the core ring on surface and air-core modes in photonic bandgap fibers. Opt. Express 2004, 12, 3436–3442. [Google Scholar] [CrossRef]
- Hanf, S.; Bogozi, T.; Keiner, R.; Frosch, T.; Popp, J. Fast and highly sensitive fiber-enhanced raman spectroscopic monitoring of molecular H2 and CH4 for point-of-care diagnosis of malabsorption disorders in exhaled human breath. Anal. Chem. 2015, 87, 982–988. [Google Scholar] [CrossRef]
- Khetani, A.; Tiwari, V.S.; Harb, A.; Anis, H. Monitoring of heparin concentration in serum by Raman spectroscopy within hollow core photonic crystal fiber. Sch. Inf. Technol. Eng. (SITE) 2011, 19, 15244–15254. [Google Scholar] [CrossRef]
- Duguay, M.A.; Kokubun, Y.; Koch, T.L.; Pfeiffer, L. Antiresonant reflecting optical waveguides in SiO2-Si multilayer structures. Appl. Phys. Lett. 1986, 49, 13–15. [Google Scholar] [CrossRef] [Green Version]
- Cao, L. Mid-Infrared Gas Raman Laser Source Based on Hollow-Core Anti-Resonant Fiber. Master’s Thesis, Beijing University of Technology, Chaoyang, China, 2018. [Google Scholar]
- Fei, Y.; Wadsworth, W.J.; Knight, J.C. Low loss (34 dB/km) silica hollow core fiber for the 3 μm spectral region. In Proceedings of the Specialty Optical Fibers, Colorado Springs, CO, USA, 17–21 June 2012. [Google Scholar]
- Yu, F.; Knight, J.C. Spectral attenuation limits of silica hollow core negative curvature fiber. Opt. Express 2013, 21, 21466–21471. [Google Scholar] [CrossRef] [Green Version]
- Gao, S.F.; Wang, Y.Y.; Wang, P. Research progress on hollow-core anti-resonant fiber and gas raman laser technology. Chin. J. Lasers 2019, 46, 183–200. [Google Scholar]
- Ling, C.; Gao, S.F.; Peng, Z.G.; Wang, X.C.; Pu, W. High peak power 2.8 μm Raman laser in a methane-filled negative-curvature fiber. Opt. Express 2018, 26, 5609–5615. [Google Scholar]
- Knebl, A.; Domes, R.; Wolf, S.; Domes, C.; Popp, J.; Frosch, T. Fiber-enhanced Raman gas spectroscopy for the study of microbial methanogenesis. Anal. Chem. 2020, 92, 12564–12571. [Google Scholar] [CrossRef]
- Wang, J.X.; Chen, W.G.; Wan, F.; Wang, P.; Zhang, R. Fiber-enhanced Raman spectroscopic monitoring of fault characteristic gases dissolved in transformer oil by hollow-core photonic crystal fiber. In Proceedings of the 2018 IEEE International Conference on High Voltage Engineering and Application (ICHVE), Athens, Greece, 10–13 September 2018. [Google Scholar]
- James, T.M.; Rupp, S.; Telle, H.H. Trace gas and dynamic process monitoring by Raman spectroscopy in metal-coated hollow glass fibres. Anal. Methods 2015, 7, 2568–2576. [Google Scholar] [CrossRef]
- Pearman, W.F.; Carter, J.C.; Angel, S.M.; Chan, W.J. Quantitative measurements of CO2 and CH4 using a multipass Raman capillary cell. Appl. Opt. 2008, 47, 4627–4632. [Google Scholar] [CrossRef] [PubMed]
- Okita, Y.; Gannot, I.; Katagiri, T.; Matsuura, Y. A Raman cell based on hollow optical fibers for breath analysis. In Proceedings of the Optical Fibers and Sensors for Medical Diagnostics and Treatment Applications X, San Francisco, CA, USA, 23–28 January 2010; Volume 7559, pp. 42–46. [Google Scholar]
- Mullen, J.C.; Buric, M.P.; Chorpening, B.T.; Woodruff, S.D. Azimuthal polarization for Raman enhancement in capillary waveguides. Opt. Eng. 2013, 52, 117103. [Google Scholar] [CrossRef]
- Simone, R.; Andreas, O.; Hendrik, S.M.; Timothy, J.; Helmut, T. Improving the detection limit in a capillary raman system for in situ gas analysis by means of fluorescence reduction. Sensors 2015, 15, 23110–23125. [Google Scholar]
- Matsuura, Y.; Abel, T.; Harrington, J.A. Optical properties of small-bore hollow glass waveguides. Appl. Opt. 1995, 34, 6842–6847. [Google Scholar] [CrossRef] [PubMed] [Green Version]
- Fan, D.; Jin, Z.; Wang, G.; Xu, F.; Lu, Y.; Hu, D.J.J.; Wei, L.; Shum, P.; Zhang, X. Extremely high-efficiency coupling method for hollow-core photonic crystal fiber. IEEE Photonics J. 2017, 9, 1–8. [Google Scholar] [CrossRef]
- Fan, D.Y. Research on On-Line Raman Detecting System Based on Hollow-Core Fiber. Master’s Thesis, Nanjing University, Nanjing, China, 2017. [Google Scholar]
- Liu, Z.Q.; Wang, Y.J.; Lu, X.B.; Kan, M.X. Determination of isopropanol content by laser Raman spectroscopic internal standard method. In Proceedings of the National Conference on Chemistry and Spectroscopic Analysis, Chengdu, China, 29 July–2 August 2011. [Google Scholar]
- Xu, Y.; Chen, X.; Zhu, Y. High sensitive temperature sensor using a liquid-core optical fiber with small refractive index difference between core and cladding materials. Sensors 2008, 8, 1872–1878. [Google Scholar] [CrossRef] [Green Version]
- Huo, L.; Lin, C.; Suen, Y.K.; Kong, S.K. Raman signal enhancement in a liquid-core optical fiber based on hollow-core photonic crystal fiber. In Proceedings of the 2007 Asia Optical Fiber Communication and Optoelectronics Conference, Shanghai, China, 17–19 October 2007; pp. 233–235. [Google Scholar]
- Wang, W.; Feng, M.Z. Characteristics of low-refractive-index liquid-core optical fibers. J. Transcluction Technol. 1996, 01, 15–18. [Google Scholar]
- Fan, Y.; Wu, R.M.; Ai, S.R.; Liu, M.H.; Yang, H.F.; Zheng, J.H. Identification study of edible oil species with laser induced fluorescence technology based on liquid core optical fiber. Spectrosc. Spectr. Anal. 2016, 36, 3202–3206. [Google Scholar]
- Altkorn, R.; Koev, I.; Duyne, R.; Litorja, M. Low-loss liquid-core optical fiber for low-refractive-index liquids: Fabrication, characterization, and application in Raman spectroscopy. Appl. Opt. 1997, 36, 8992–8998. [Google Scholar] [CrossRef]
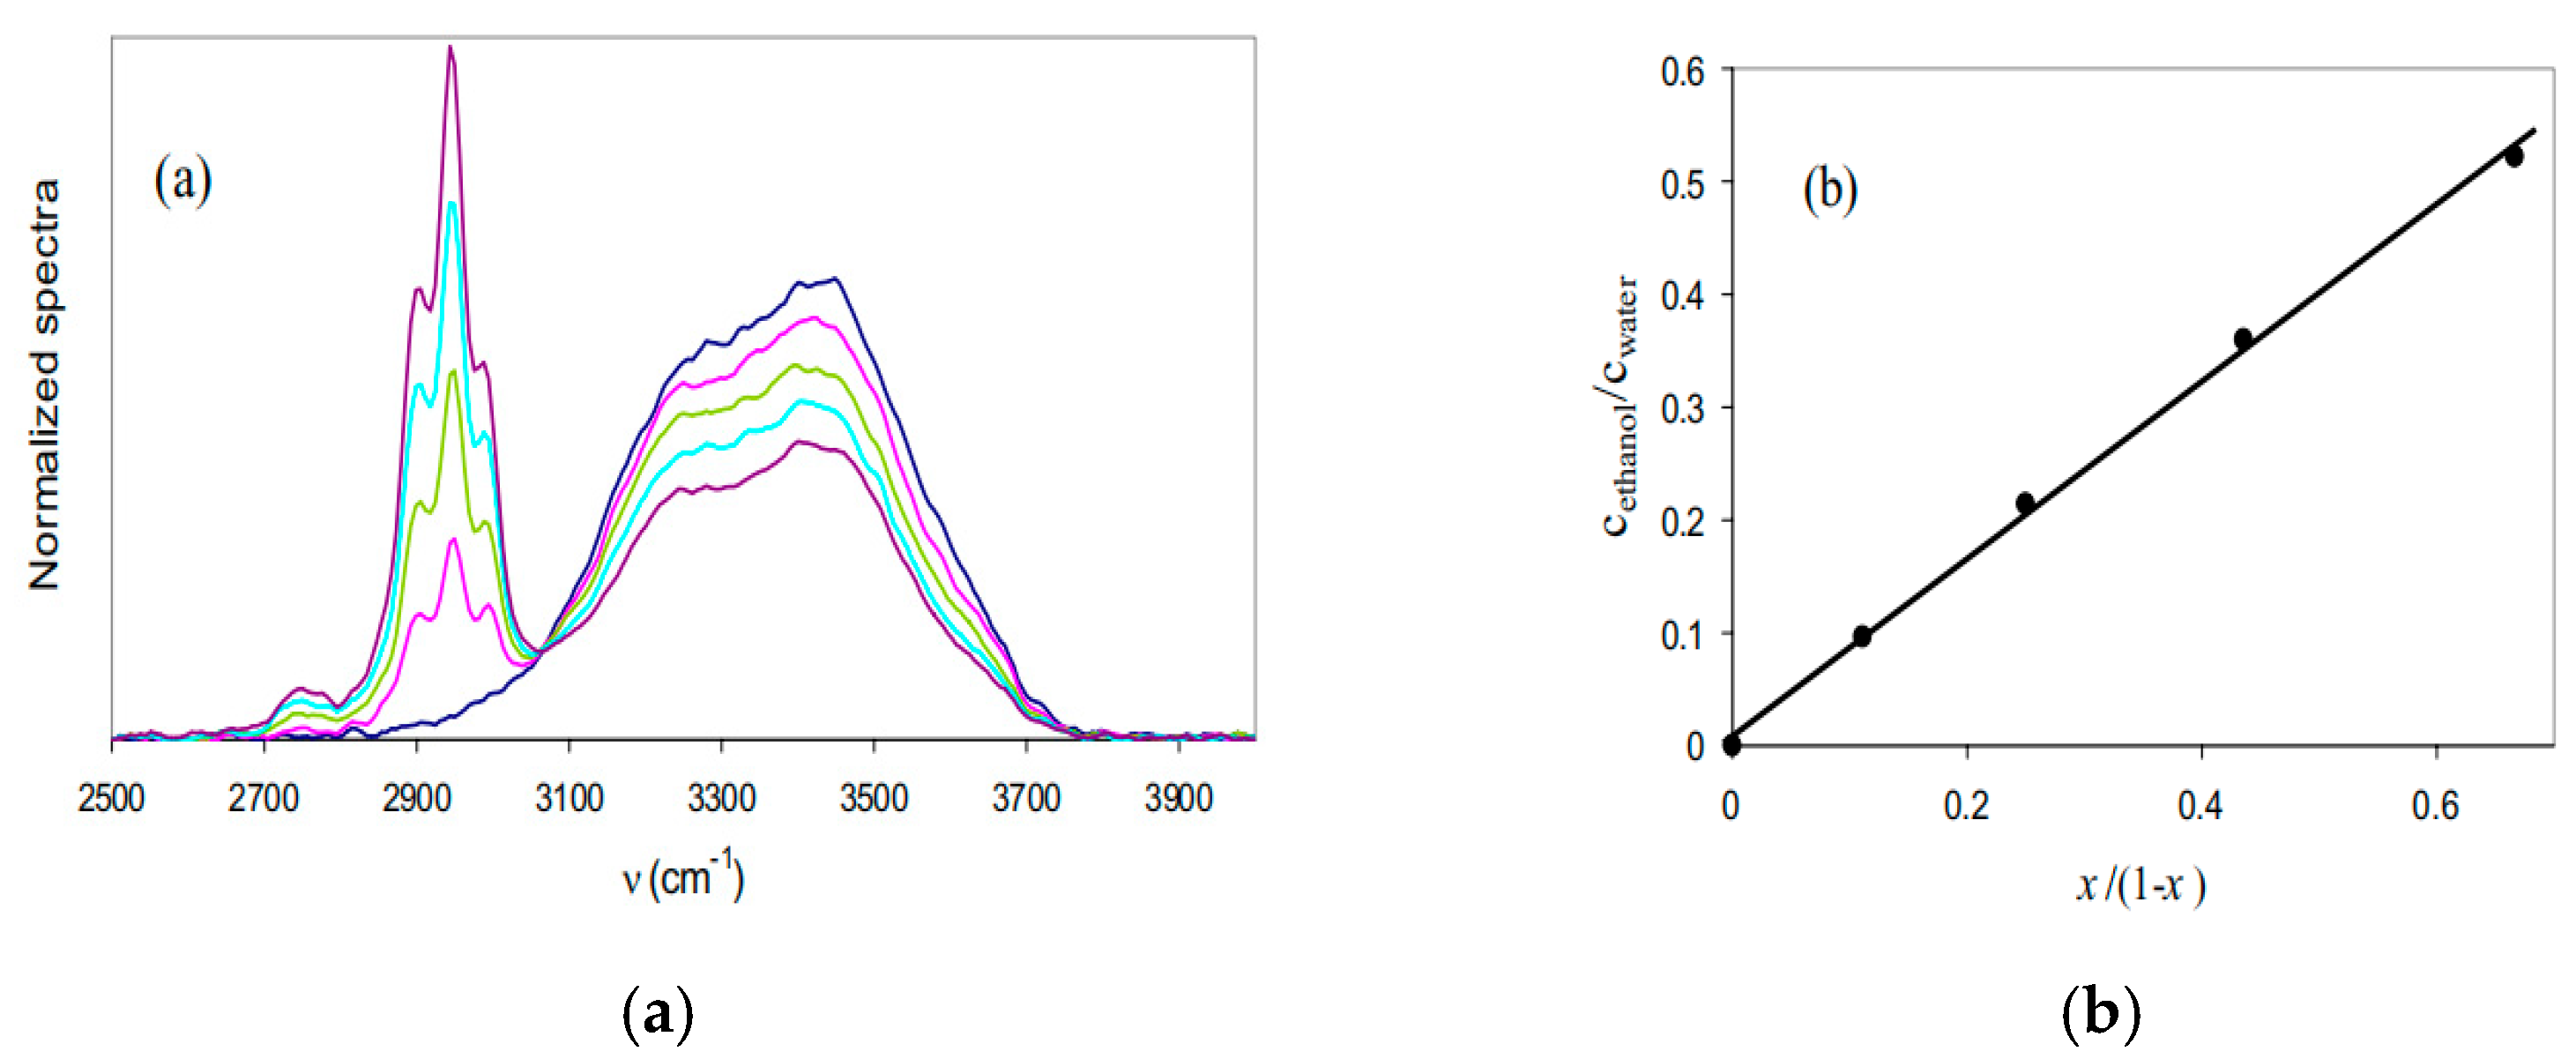
- Meneghini, C.; Caron, S.; Proulx, A.; Emond, F.; Paradis, P.; Pare, C.; Fougeres, A. Ethanol concentration measurement by Raman spectroscopy in liquid-core microstructured optical fiber. In Third European Workshop on Optical Fibre Sensors; Cutolo, A., Culshaw, B., LopezHiguera, J.M., Eds.; SPIE: Bellingham, WA, USA, 2007; Volume 6619. [Google Scholar]
- Pelletier, M.J.; Altkorn, R. Raman sensitivity enhancement for aqueous protein samples using a liquid-core optical-fiber cell. Anal. Chem. 2001, 73, 1393–1397. [Google Scholar] [CrossRef] [PubMed]
- Ramza, H.; Arsad, N.; Abdurrahman, F.; Supian, L.S.; Ab-Rahman, M.S. Optical fiber pressure sensor using extrinsic Fabry-Perot interferometry (EFPI); A theoretical study. J. Optoelectron. Adv. Mater. 2015, 17, 545–551. [Google Scholar]
- Bethoux, O.; Godoy, E.; Roche, I.; Naccari, B.; Taleb, M.A.; Koteiche, M.; Nassif, Y. A new state-observer of the inner PEM fuel cell pressures for enhanced system monitoring. Eur. Phys. J. Appl. Phys. 2014, 66, 30901. [Google Scholar] [CrossRef]
- Amezcuacorrea, R.; Leonsaval, S.; Birks, T.; Knight, J.C. Control of surface modes in low loss hollow-core photonic bandgap fibers. Opt. Express 2008, 16, 1142–1149. [Google Scholar] [CrossRef] [Green Version]
- Shen, L.B.; Zhang, X.N. A study on novel liquid-core fiber and its properties. J. Jinling Inst. Technol. 2018, 34, 25–28. [Google Scholar]
- Ishiharada M, N.K.; Tanuma, I.; Matsumuro, Y.; Honda, T. Properties of flexible light guide made of liquid core and polymer clad. Plast. Opt. Fibres Appl. 1993, 49–53. [Google Scholar]
- Marquardt, B.J.; Turney, K.P.; Burgess, L.W. Raman waveguide detector for low analyte concentrations in liquid samples. In Proceedings of the SPIE—The International Society for Optical Engineering, Boston, MA, USA, 19–22 September 1999; Volume 3860, pp. 239–249. [Google Scholar]
- Gao, S.Q.; Li, Z.W.; Zhang, W.; Li, J.N. Liquid core optical fiber preresonance and resonance raman spectroscopy and its application. Chin. J. Anal. Chem. 1997, 25, 4. [Google Scholar]
- Jin, Z.Q. On-Line Raman Liquid Detecting Methods Based on Hollow-Core Fiber. Master’s Thesis, Nanjing University, Nanjing, China, 2018. [Google Scholar]
- Pearman, W.F.; Carter, J.C.; Angel, S.M.; Chan, W.J. Multipass capillary cell for enhanced raman measurements of gases. Appl. Spectrosc. 2015, 62, 285–289. [Google Scholar] [CrossRef]
- Yang, F.; Zhao, Y.; Qi, Y.; Tan, Y.Z.; Ho, H.L.; Jin, W. Towards label-free distributed fiber hydrogen sensor with stimulated Raman spectroscopy. Opt. Express 2019, 27, 12869–12882. [Google Scholar] [CrossRef]
- Buric, M.P.; Chen, K.P.; Falk, J.; Woodruff, S.D. Enhanced spontaneous Raman scattering and gas composition analysis using a photonic crystal fiber. Appl. Opt. 2008, 47, 4255–4261. [Google Scholar] [CrossRef] [Green Version]
- Buric, M.P.; Chen, K.; Falk, J.; Velez, R.; Woodruff, S. Raman sensing of fuel gases using a reflective coating capillary optical fiber. Proc. SPIE 2009, 7316, 433–443. [Google Scholar]
- Wang, Z.; Yu, F.; Wadsworth, W.J.; Knight, J.C. Efficient 1.9 μm emission in H2-filled hollow core fiber by pure stimulated vibrational Raman scattering. Laser Phys. Lett. 2014, 11, 105807. [Google Scholar] [CrossRef] [Green Version]
- Rupp, S.; James, T.M.; Telle, H.H.; Schloesser, M.; Bornschein, B. Enhanced sensitivity of raman spectroscopy for tritium gas analysis using a metal-lined hollow glass fiber. Fusion Sci. Technol. 2015, 67, 547–550. [Google Scholar] [CrossRef]
- Guo, J.J.; Yang, D.W.; Liu, C.H. Raman signal enhancement for gas detection using a hollow core optical fiber. Spectrosc. Spectr. Anal. 2016, 36, 96–98. [Google Scholar]
- Qi, D.; Berger, A.J. Chemical concentration measurement in blood serum and urine samples using liquid-core optical fiber Raman spectroscopy. Appl. Opt. 2007, 46, 1726–1734. [Google Scholar] [CrossRef] [Green Version]
- Qiao, P.; Wang, X.H.; Gao, S.; Yin, X.; Wang, P. Integration of black phosphorus and hollow-core anti-resonant fiber enables two-order magnitude enhancement of sensitivity for bisphenol A detection. Biosens. Bioelectron. 2019, 149, 111821. [Google Scholar] [CrossRef]
- Azkune, M.; Frosch, T.; Arrospide, E.; Aldabaldetreku, G.; Bikandi, I.; Zubia, J.; Popp, J.; Frosch, T. Liquid-core microstructured polymer optical fiber as fiber enhanced raman spectroscopy probe for glucose sensing. J. Lightwave Technol. 2019, 37, 2981–2988. [Google Scholar] [CrossRef]


| Sagnac Loop | Capillary with an Inserted Reflector | Capillary with an Inserted FP Cavity | |
|---|---|---|---|
| Enhancement Ratio | 4 [44] | 1.73 [45] | 5 [46] |
| HCPBGF | HCARF | LOF | MLHCF | |
|---|---|---|---|---|
| Core diameter | Small (5–30 μm) | Medium (20–100 μm) [63] | Large (300–1000 μm) | Large (300–1000 μm) |
| Bandwidth | Narrow band [85] | Narrow band | All band [86] | All band |
| Loss | Low (1 dB/km) | Low (50 dB/km) | High (3 dB/m) [80] | Medium (1.2 dB/m) [72] |
| NA | 0.12 | 0.03 | 0.54 [87] | 0.22 [10] |
| Detection limit | 4.7 ppm [57] | 2 ppm [66] | 6 ppm [88] | 100 ppm [67] |
| Enhancement factor | 104 [39] | 104 [60] | 103–104 [89] | 103 [90] |
| Year | Research Team | Reference | Pump Wavelength | Fiber Type | Gas | Core Diameter | Enhancement |
|---|---|---|---|---|---|---|---|
| 2008 | National Energy Technology Laboratory | [93] | 514.5 nm | HCPBGF | N2, O2 | 4.9 μm | Several hundreds |
| 2009 | [94] | 1302–1637 nm | MLHCF | CO, C3H8, etc. | 300 μm | N.A. | |
| 2014 | Leibniz Institute of Photonic Technology | [57] | 670 nm | HCPCF | H2, CH4 | 10, 20, 30 μm | N.A. |
| 2014 | University of Bath | [95] | 1064 nm | HCPCF | H2 | 53 μm | N.A. |
| 2015 | Fusion Science and Technology | [96] | 532 nm | MLHCF | H2 | 1 mm | 10 |
| 2016 | Ocean University of China | [97] | 532 nm | HCF | O2, N2 | 500 μm | 60 |
| 2019 | The Hong Kong Polytechnic University | [93] | 1532 nm | HCPCF | H2 | 10 μm | N.A. |
| 2021 | Chongqing University | [67] | 532 nm | HCARF | H2, CO, etc. | 26 μm | 7 |
| Year | Research Team | Reference | Pump Wavelength | Fiber Type | Liquid | Core Diameter | Enhancement |
|---|---|---|---|---|---|---|---|
| 1997 | Northwestern University | [80] | 632.8 nm | LOF | Water, methanol, ethanol, acetonitrile | 250 μm | N.A. |
| 2001 | Northwestern University | [82] | 532 nm | LOF | Water protein | 50 μm | 500 |
| 2011 | University of Ottawa | [58] | 785 nm | HCPCF | Heparin | 10.6 μm | 90 |
| 2017 | Leibniz Institute of Photonic Technology | [53] | 532, 676, 752 nm | HCPCF | Ethanol | 20 μm | 10 |
| 2020 | Nanjing University | [10] | 785 nm | MLHCF | Ethanol | 125 μm | 4.83 |
Publisher’s Note: MDPI stays neutral with regard to jurisdictional claims in published maps and institutional affiliations. |
© 2022 by the authors. Licensee MDPI, Basel, Switzerland. This article is an open access article distributed under the terms and conditions of the Creative Commons Attribution (CC BY) license (https://creativecommons.org/licenses/by/4.0/).
Share and Cite
Ding, H.; Hu, D.J.J.; Yu, X.; Liu, X.; Zhu, Y.; Wang, G. Review on All-Fiber Online Raman Sensor with Hollow Core Microstructured Optical Fiber. Photonics 2022, 9, 134. https://doi.org/10.3390/photonics9030134
Ding H, Hu DJJ, Yu X, Liu X, Zhu Y, Wang G. Review on All-Fiber Online Raman Sensor with Hollow Core Microstructured Optical Fiber. Photonics. 2022; 9(3):134. https://doi.org/10.3390/photonics9030134
Chicago/Turabian StyleDing, Haonan, Dora Juan Juan Hu, Xingtao Yu, Xiaoxian Liu, Yifan Zhu, and Guanghui Wang. 2022. "Review on All-Fiber Online Raman Sensor with Hollow Core Microstructured Optical Fiber" Photonics 9, no. 3: 134. https://doi.org/10.3390/photonics9030134