Communication

Visible to Mid-Infrared Supercontinuum Initiated by Stimulated Raman Scattering of 1.03 μm Ultrashort Pulses in a Gas-Filled Silica Fiber

Dianov Fiber Optics Research Center, Prokhorov General Physics Institute of the Russian Academy of Sciences, 38 Vavilov St.,119333 Moscow, Russia
*
Author to whom correspondence should be addressed.
Photonics 2022, 9(12), 997; https://doi.org/10.3390/photonics9120997
Submission received: 18 November 2022 / Revised: 10 December 2022 / Accepted: 14 December 2022 / Published: 17 December 2022
(This article belongs to the Special Issue Light Control and Particle Manipulation)

Abstract

:
Multiband supercontinuum generation covering the bandwidth from 0.65 μm to 3.3 μm was demonstrated in a gas-filled hollow-core silica fiber pumped by chirped ultrashort pulses at 1.03 μm. The development of the SC spectrum into the mid-IR was initiated by cascade stimulated Raman scattering in gaseous D2, which was used as an active medium filling the hollow core. The influence of the Kerr nonlinearity was studied by changing the linear chirp of the pump pulses. The influence of gas pressure and pump pulse energy on the SC generation was investigated. As high as 14% of pump quanta were converted to the wavelength range above 2 μm.

1. Introduction

Supercontinuum (SC) sources are of great interest for many applications, which include biomedicine, remote sensing, and environmental monitoring. In recent years, much effort has been devoted to realize fiber-based SC generation at wavelengths λ > 2.4 μm in the mid-infrared (mid-IR), where many molecular species of interest have fundamental absorption bands. As silica-core fibers cannot be applied in this spectral range, most of the research has focused on non-silica fibers of various compositions. As a result, impressive progress on mid-IR SC generation has been achieved in fluoride, telluride, and chalcogenide fibers [1,2,3,4,5,6,7,8].
Negative-curvature hollow-core fibers (HCFs) present an alternative fiber design that can be applied beyond the transparency window of silica glass [9,10,11,12]. Various types of HCFs are also referred to as anti-resonant or revolver fibers. Having the cladding made of SiO2, the HCFs possess all advantages of well-developed silica glass technology. Simultaneously, most of the fundamental restrictions imposed by silica on optical fiber properties are eliminated, as high-power optical radiation is strongly localized in a gas-filled hollow core. Moreover, HCFs can be used at high intensities that are above the optical damage threshold of any solid-core fibers [13,14]. This combination of properties has made gas-filled HCFs an ideal platform for nonlinear fiber optics in a wide spectral range [15,16,17].
SC generation that was experimentally demonstrated in HCFs covers mainly the spectral range from the near-infrared to deep-ultraviolet. Typically, a HCF filled by a noble gas is pumped by near-infrared ultrashort pulses that experience soliton-driven dynamics [18] or modulation instability [19]. The dispersive wave generated in such experiments favors the energy transfer toward the deep-ultraviolet part of the spectrum. Some works make use of molecular gases [20,21,22,23], which could potentially extend the SC spectrum to longer wavelengths by means of stimulated Raman scattering (SRS). Nevertheless, in the experiments, the long-wavelength edge of the spectrum remains shorterthan 1.2 μm for the SC generated by pure SRS [23] and shorter than 2.4 μm when SRS is accompanied by the Kerr nonlinearity [24].
A mid-IR SC in HCFs was experimentally achieved only in a few works [25,26,27,28], all of which used noble gases. By using a 1.03 μm pump, Köttig et al. [25] showed that ionization of the gas in the strong-field regime can lead to the generation of a dispersive wave in the mid-IR. Although this approach works in principle and the dispersive wave was detected in the 3.3–4 μm spectral range, the efficiency of the process was very low. Another approach relies on pumping the HCF by ultrashort pulses at longer wavelengths, which results in a soliton-based SC with enhanced spectral power density in the mid-IR. In this way, efficient SCs were generated in the spectral range of 0.27–3.1 μm [26], 0.3–4.6 μm [27], and 0.2–4.0 μm [28], by pumping at 1.7 μm, 2 μm, and 2.46 μm, respectively. Although demonstrating the prospects of the gas-filled HCFs to generate a SC in the mid-IR, those works were based on complex pump sources, such as ultrafast optical parametric amplifiers. For practical applications, however, development of simplified pumping schemes is highly desired.
Recently, we showed that widespread ultrafast lasers at 1.03 μm can be efficiently used as a pump source to generate mid-IR picosecond pulses in a HCF filled by Raman-active gas [29]. Moreover, such gas fiber Raman lasers can be turned into a mid-IR SC source, as numerical simulations showed [30].
In this work, we experimentally demonstrate a multiband supercontinuum covering the bandwidth from 0.65 μm to 3.3 μm in a gas-filled hollow-core silica fiber pumped by chirped ultrashort pulses at 1.03 μm. The development of the SC spectrum into the mid-IR was initiated by cascade Raman conversion in gaseous D2, which was used as an active medium filling the hollow core. The effect of Kerr nonlinearity was studied by controllingthe amount of linear chirp introduced to the pump pulses. The influence of gas pressure and pump pulse energy on the SC generation was also investigated.

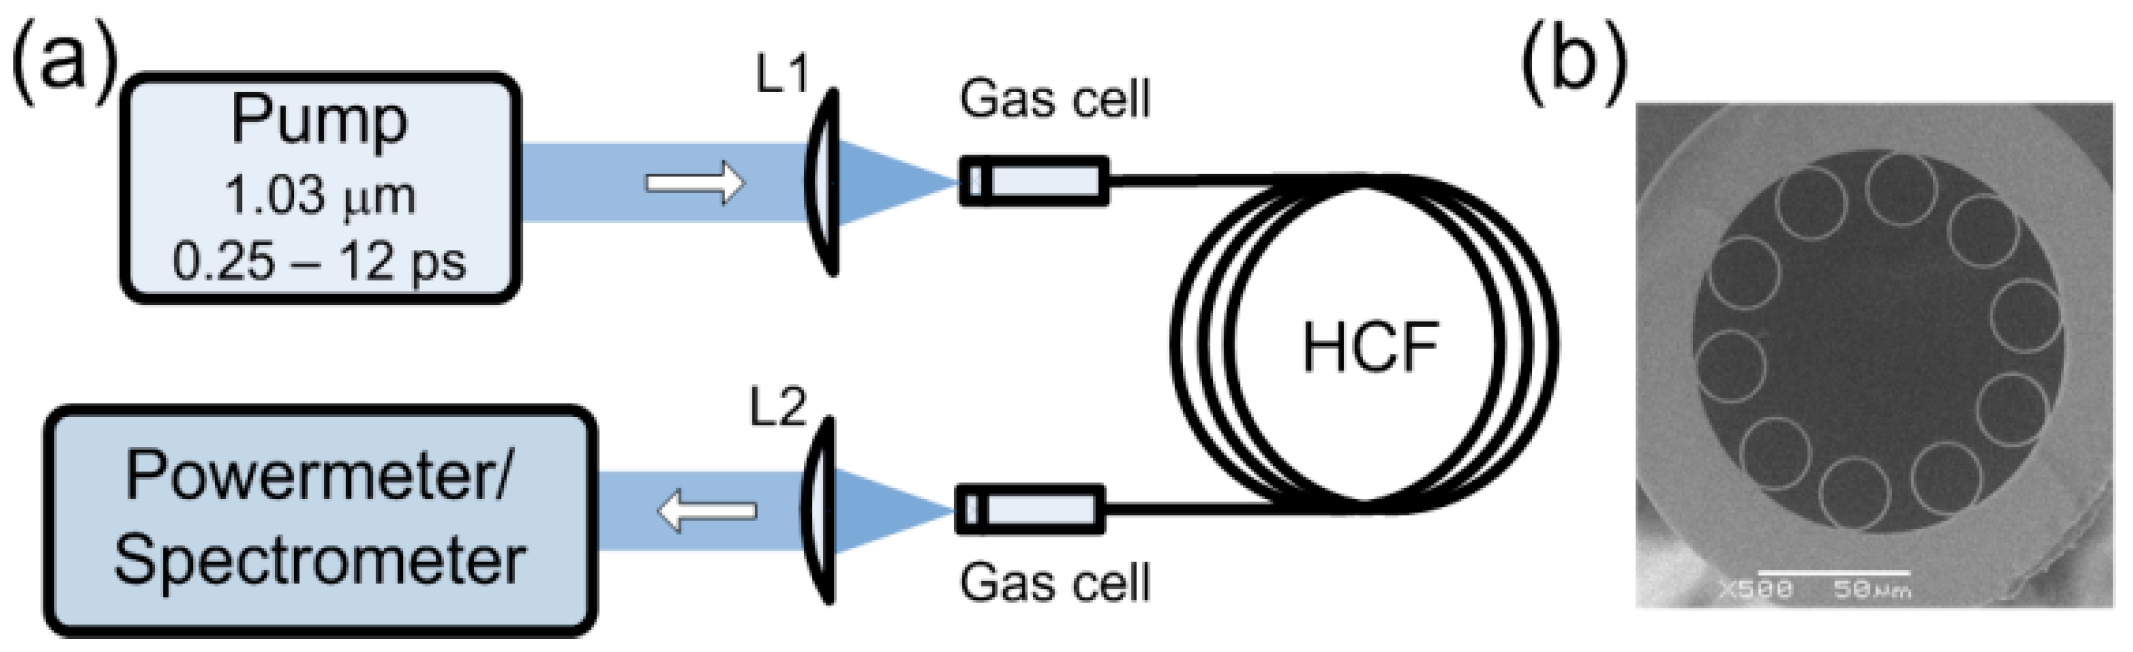
2. Materials and Methods

The experimental setup (Figure 1a) and the HCF (Figure 1b) were the same as in [29]. As a pump source, we used an ytterbium laser (TETA-6, Avesta) that generates linearly polarized transform-limited 250 fs long pulses at 1.03 μm with a pulse energy of up to 400 μJ. At the output of the pump laser, a pulse stretcher was used to control the pump pulse duration in the 0.25–12 ps range. A lens L1 couples the pump pulses into a 2.9 m long piece of a revolver-type HCF with a 75 μm core diameter and 1.15 μm thick walls of the cladding capillaries.
The HCF was filled with D2 at various pressures in the range from 5 to 30 atm. Deuterium was chosen as an active gas as it has one of the largest molecular vibration frequencies (ΩR = 2991 cm−1), and being pumped at 1.03 μm, it generates 1st (1.49 μm) and 2nd (2.68 μm) Stokes waves that match well with the transmission bands of the HCF used. Both ends of the fiber were hermetically sealed into small gas cells, which had 1 mm thick fused silica (input) and sapphire (output) windows to couple/decouple the radiation. The output radiation was collimated by a ZnSe lens and then analyzed by a powermeter (Ophir), optical spectrum analyzer (AQ6317B, Ando), and a monochromator equipped with a nitrogen-cooled InSb detector (Hamamatsu, Shizuoka, Japan). An uncoated 2 mm thick Si plate and antireflection-coated Ge filter (WG91050-C9, Thorlabs, Newton, NJ, USA) were used to separate the optical power generated in the near-IR (1.1–1.9 μm) and mid-IR (>1.9 μm) spectral ranges. To calculate the quantum efficiency of pump conversion into near-IR and mid-IR ranges, the quantum defect was approximated by that of pure vibrational Raman conversion 1.03→1.49→2.68 μm.
The numerical simulation of pulse propagation in the D2-filled revolver fiber was carried out by solving a generalized nonlinear Schrödinger equation (GNSE) for the complex spectral envelope of the pulse [31] and taking into account the higher-order dispersion, Kerr nonlinearity, and SRS on Q2 vibrations of the D2 molecules. The nonlinear response function of D2 has the form R ( t ) = ( 1 f R ) δ ( t ) + f R h R ( t ) , where the first and second terms are responsible for the instantaneous Kerr effect and the slowly relaxing Raman effect, respectively. The Raman response function of the D2 molecule was modeled as h R t = Ω 2 τ s exp t / τ d sin t / τ s , where Ω 2 = τ s 2 + τ d 2 , τ s = 1 / ω R , and ω R = 5.626 × 1 0 14 c 1 is the angular frequency of molecular vibrations; τ d = T 2 / 2 π , where T2 is the phase relaxation time for the excited vibrational level. The time T2 is a function of the gas density ρ , as T 2 = 1 / π × Δ ν R and the linewidth of the vibrational Raman transition Δ ν R depends on the D2 density as Δ ν R = 101 / ρ + 120 ρ , where Δ ν R is in MHz and ρ in Amagat [32].
The nonlinear refractive index N2 of deuterium was determined based on the data obtained in [33], where contributions to the value of N2 were measured separately for the electronic Kerr nonlinearity (N2K = 5.8 × 10⁻²⁴ m2/W) and vibrational SRS (N2vib = 1.2 × 10⁻²⁴ m2/W). The value of N2K was assumed to depend linearly on D2 pressure p. The dependence of N2vib on p was determined by taking into account the pressure dependence of the Raman gain [32]. The coefficient fR, which describes the SRS contribution to the value of N2, was estimated as f R p = N 2 vib p / N 2 K × p + N 2 vib p [34].
Numerical analysis was conducted in Matlab using built-in fast Fourier transform algorithms and solving the GNSE by the 4th-order Runge–Kutta method for the fiber fundamental mode, taking into account the spectral dependences of the effective mode area Aeff(ω), waveguide loss α(ω), and the effective refractive index. The simulated spectral range from 0.6 μm to 5 μm covered 4 transmission bands of the fiber. The maximum time interval was 120 ps with a minimum grid size of 1.8 fs. As the input pump, we considered Gaussian pulses at 1.03 μm with amplitude E ( t ) = P × exp 0 . 5 × t + iC / T 0 2 . The power P, pulse duration τ FWHM = 1 . 665 × T 0 , and chirp value C were chosen to satisfy our experimental conditions.

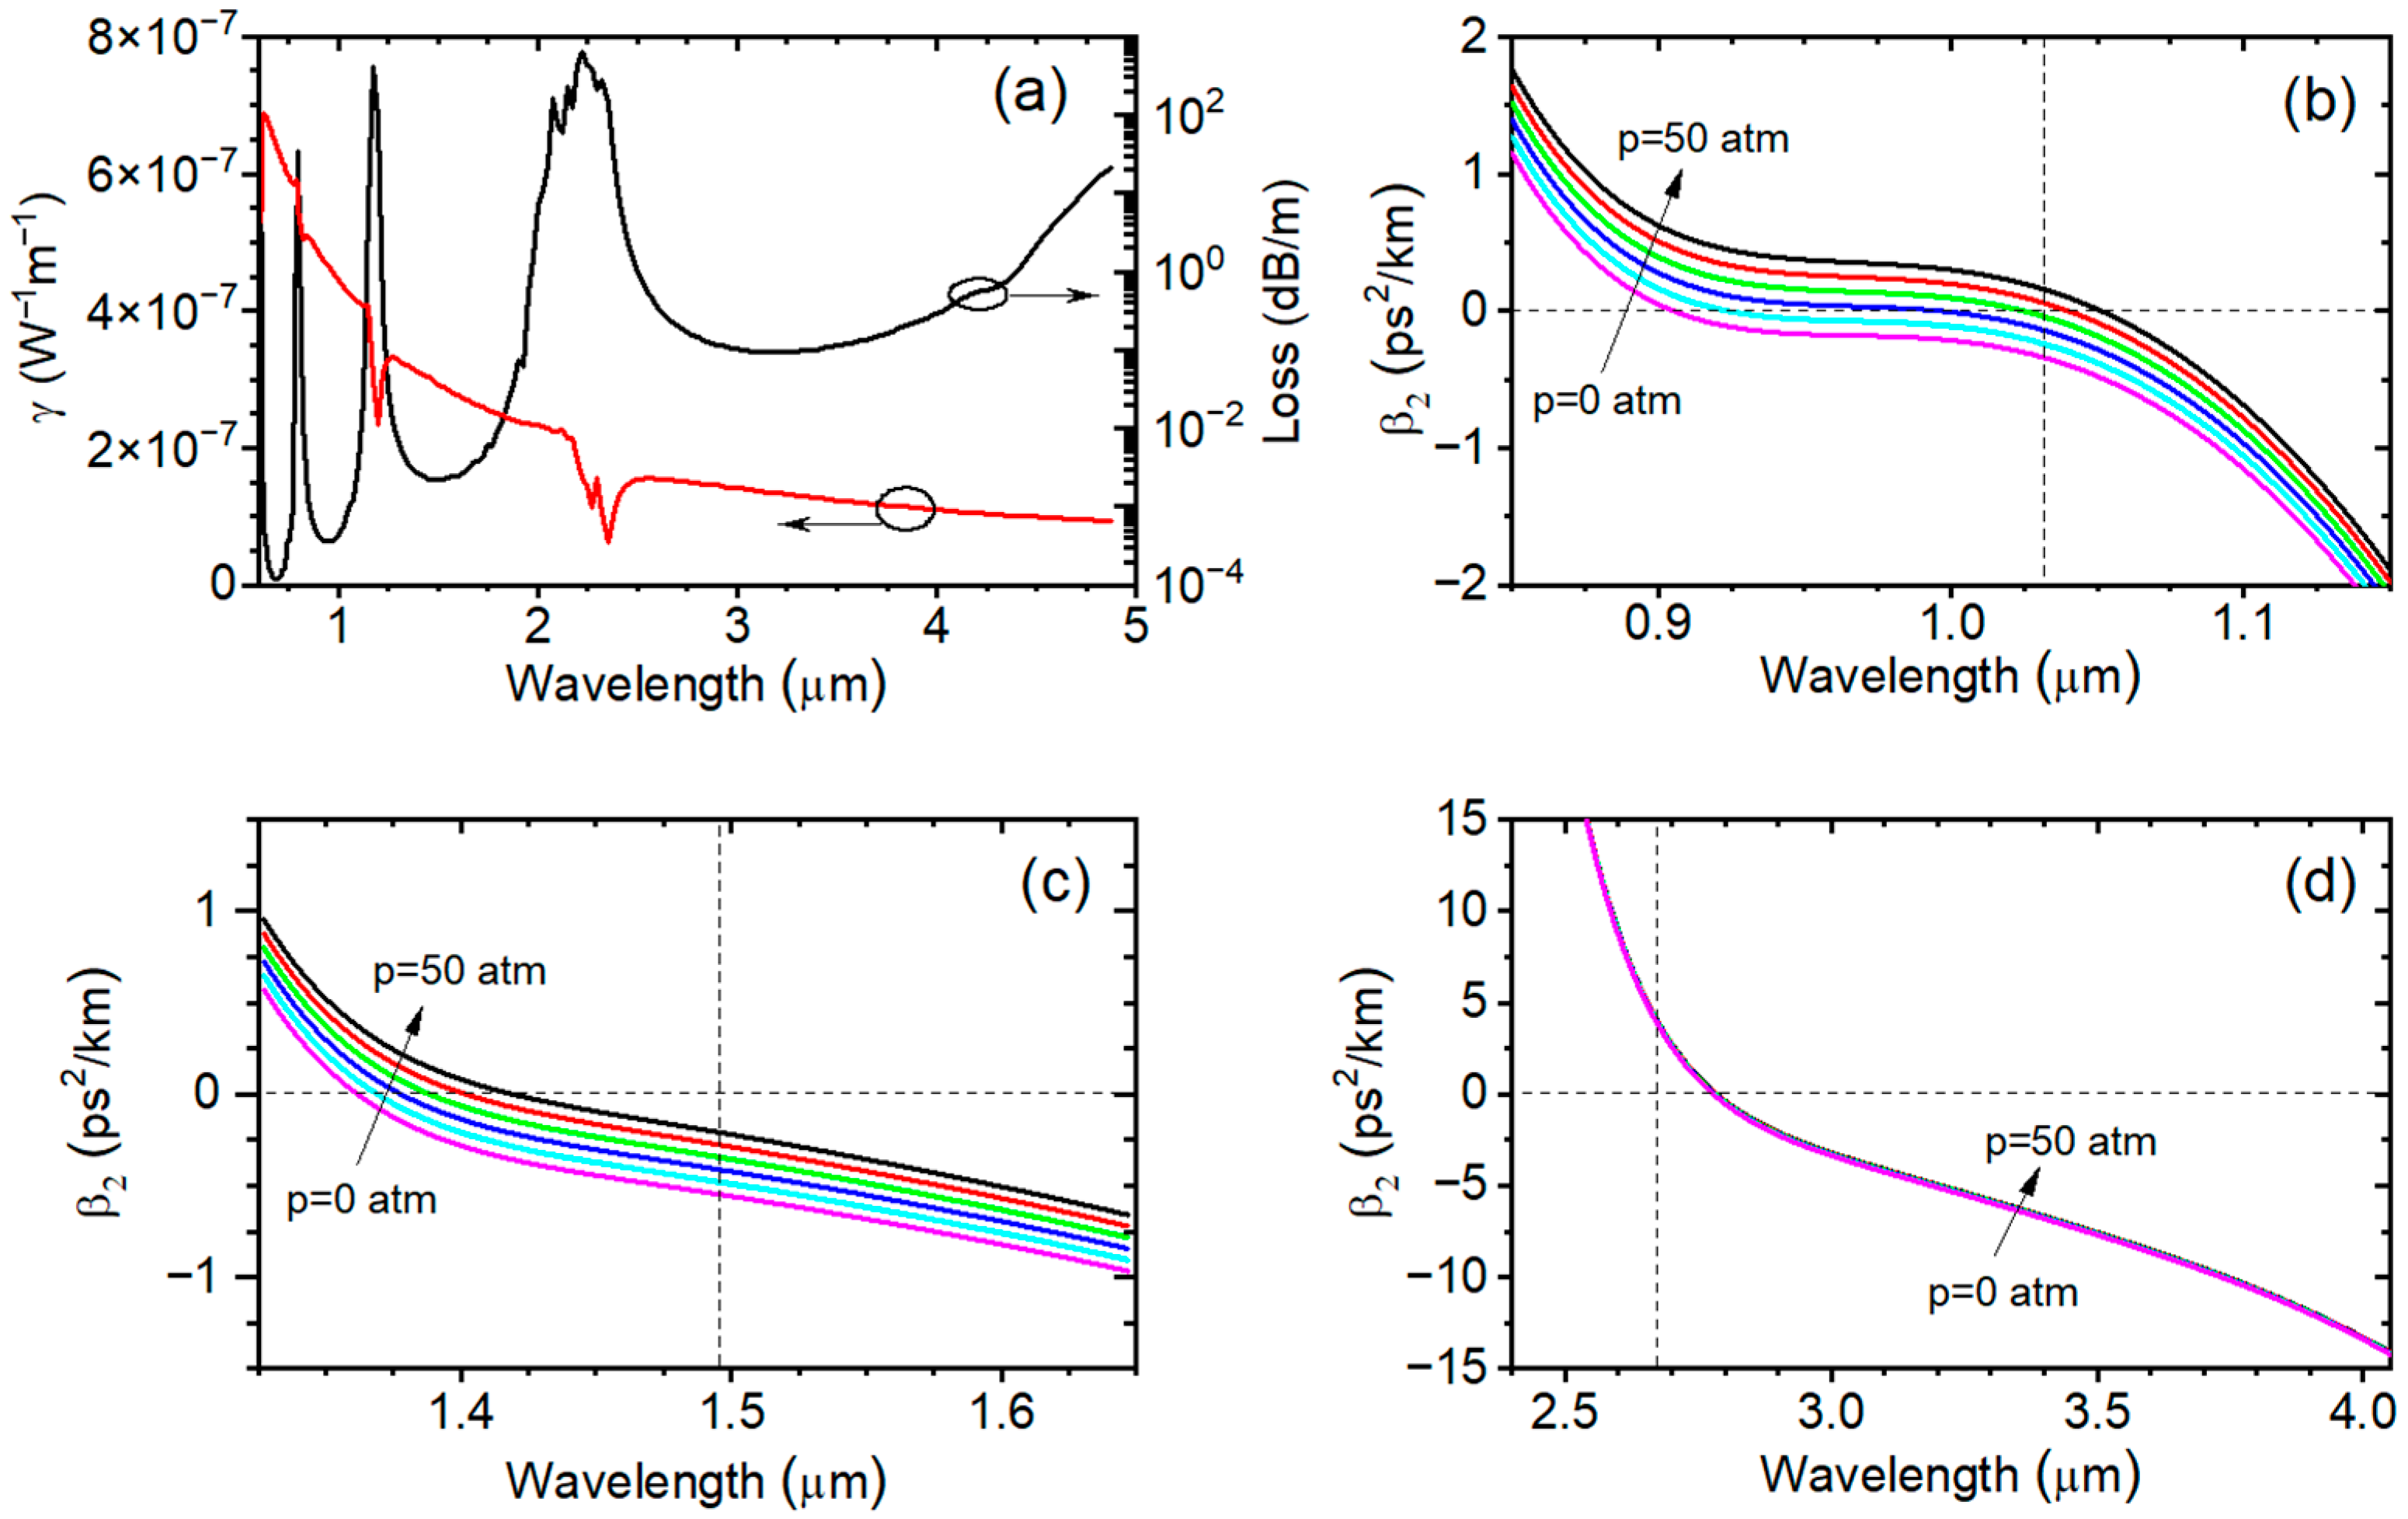
3. Dispersion and Waveguide Properties of the Revolver HCF

Waveguide, dispersion, and nonlinear characteristics of the HCF were calculated in the 0.6–5 μm wavelength range by the finite element method. The spectrum of optical losses, calculated for the fundamental mode, has several transmission bands (Figure 2a, black). The spectral position of the bands is favorable for SRS-initiated energy transfer in the D2-filled HCF from the pump toward longer wavelengths, as the wavelengths of the pump (1.03 μm), the first (1.49 μm), and the second (2.68 μm) Stokes fall within transmission bands of the fiber (the 3rd, the 2nd, and the 1st band, respectively). Meanwhile, the energy transfer to shorter wavelengths should be reduced due to high losses around the first anti-Stokes wavelength (0.79 μm).
Nonlinear coefficient γ was calculated as γ = 2π∙N2K/(λ∙Aeff), where N2K—nonlinear refractive index due to the electronic Kerr nonlinearity of D2, Aeff—effective mode area, and λ—wavelength. Figure 2a (red) shows the value of γ as a function of wavelength for the highest D2 pressure used in the experiment (30 atm).
The dispersion properties of the fiber were calculated taking into account the dispersion of deuterium [35] and the waveguide dispersion of the HCF. The total quadratic dispersion β2 of the D2-filled HCF is shown in Figure 2b–d for gas pressures from 0 to 50 atm with a step of 10 atm. Note that at the pump wavelength, the dispersion can change sign (Figure 2b), while for the 1st Stokes, it has only negative values (Figure 2c), and for the 2nd Stokes, only positive values (Figure 2d). At the highest pressure we used (30 atm), the values of dispersion are β2(1.03 μm) = −0.03 ps2/km, β2(1.49 μm) = −0.33 ps2/km, and β2(2.68 μm) = 3.6 ps2/km.

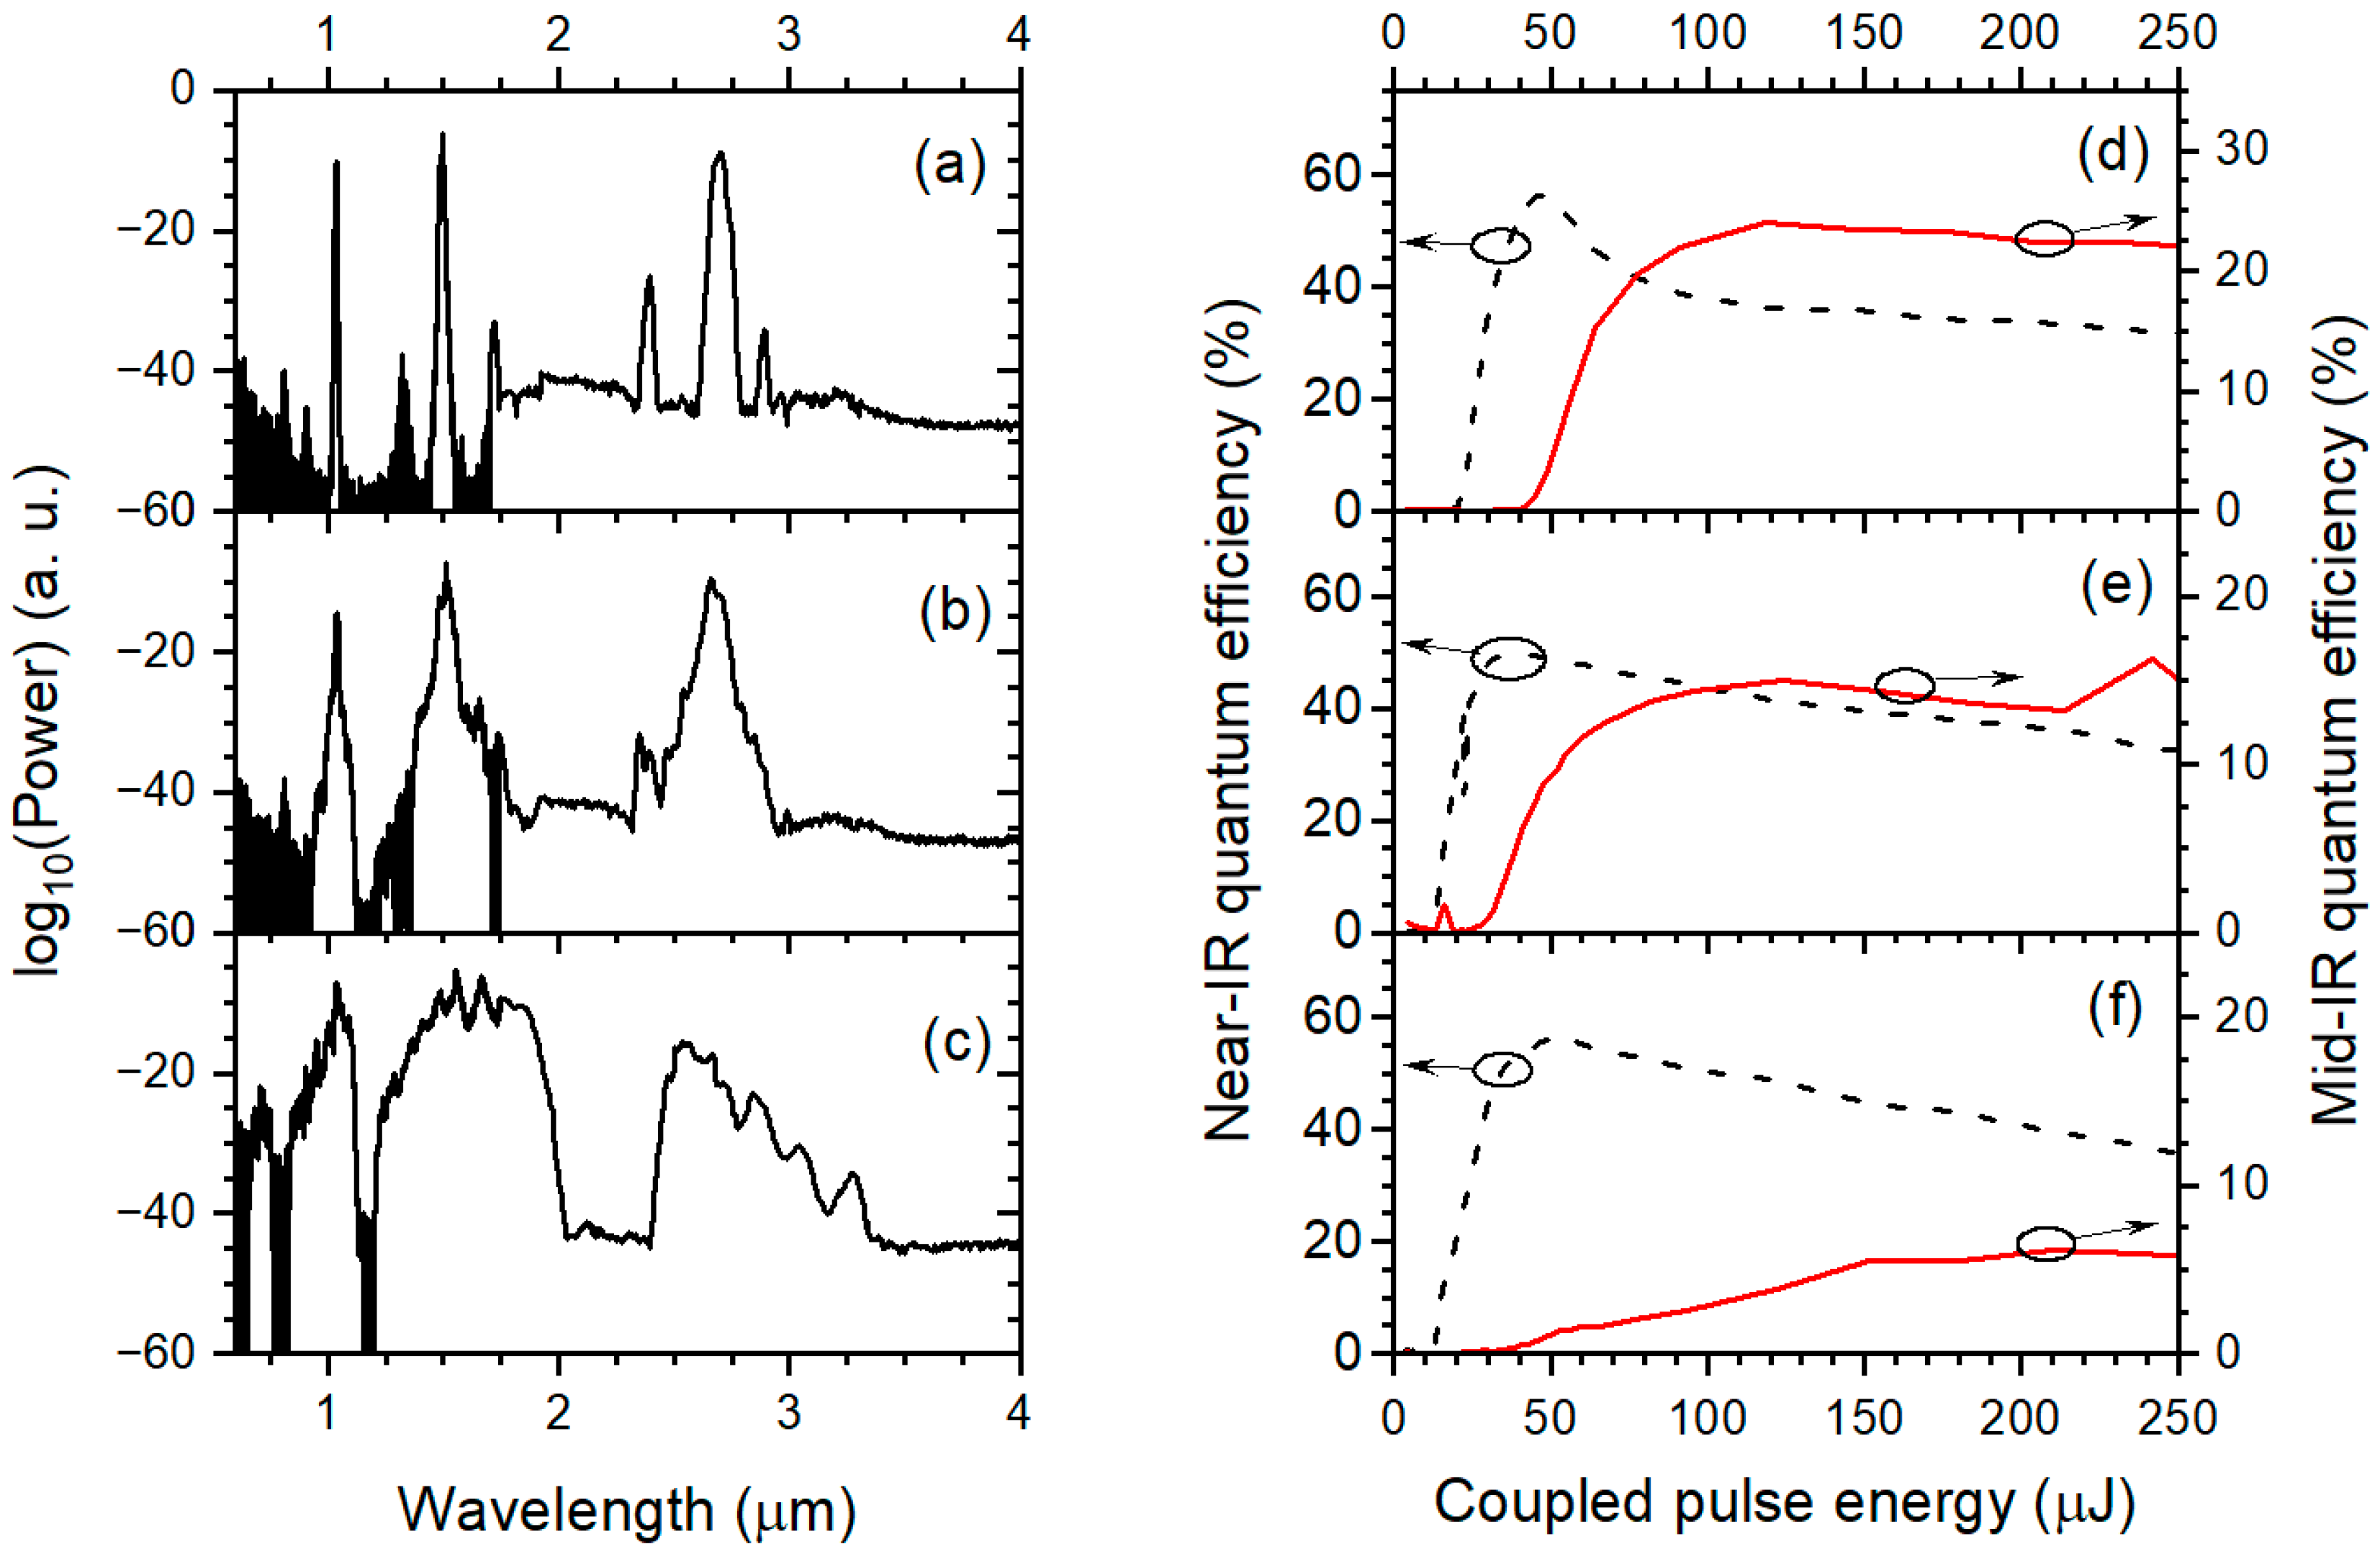
4. Results and Discussion

First, we experimentally investigated supercontinuum generation in conditions similar to those used in work [29]. The same 2.9 m long HCF was filled by gaseous D2 at a pressure of 5 atm and pumped by 1.03 μm ultrashort pulses with an energy of 210 μJ coupled into the HCF. The duration of linearly chirped pump pulses was initially set to τpump = 12 ps. Then, spectra at the output of the HCF were measured as a function of pump pulse duration, which was reduced step by step down to the transform-limited value of 250 fs.
Three qualitatively different regimes were observed. When sufficiently long pump pulses (τpump ≈ 6–12 ps) were used, vibrational SRS in D2 was a dominant nonlinear effect, which resulted in an efficient cascade Raman conversion 1.03→1.49→2.68 μm at fixed wavelengths (Figure 3a). About 25% of pump quanta were converted to the second Stokes wavelength of 2.68 μm (Figure 3d, red solid curve), and no significant spectral broadening was detected even for pump pulse energies as high as 210 μJ.
However, when τpump was shortened to below ~3 ps, a competition between SRS and other nonlinear effects, such as self-phase (SPM) and cross-phase modulation, came into play. The output spectrum experienced noticeable broadening (Figure 3b,c) with a simultaneous reduction in SRS conversion efficiency (Figure 3e,f). For τpump as short as 250 fs, the second cascade of SRS conversion into the mid-IR was completely suppressed, so it was beyond the detection limit of our setup.
The most pronounced spectral broadening was observed for the case of τpump ≈ 1 ps and Epump = 210 μJ, where a multiband supercontinuum with spectral coverage from 0.65 to 3.3 μm (at −30 dB level) was achieved (Figure 3c), and about 6% of pump quanta were converted to wavelengths above 2 μm (Figure 3f).
The three different regimes observed can be qualitatively understood by estimating broadening of the pump spectrum induced by pure SPM. The SPM-broadened spectral width is approximately Δν ≈ Δν0 + φmax/(2πτp), where Δν0 is initial bandwidth of the pulses, τpis the pulse duration, and φmax = 0.86∙γL∙Epp. In our case, Δν0 always corresponds to the spectrum of 250 fs long transform-limited pulses, while τp varies in the range of 0.25–12 ps. For the case of 210 μJ pulses propagating in the HCF at a D2 pressure of 5 atm, the dependence of Δν on τp clearly shows that noticeable spectral broadening should occur only for pump pulses shorter than 2–3 ps (Figure 4). When the pulse duration drops below ~1ps, the spectral width experiences more than 10-fold broadening and the influence of the pump bandwidth on SRS should be considered.
A comprehensive review of the pump bandwidth influence on the Raman gain can be found in [36]. Here, we just mention that to avoid reduction in the Raman gain, the pump bandwidth Δν should be less than Δνmax = 1/(L·GVM), where L is the interaction length and GVM = (1/vs − 1/vp) is group velocity mismatch, which is defined by group velocities of the Stokes (vs) and pump (vp) waves. In our case, the group velocity mismatch is as low as GVM ≈ 0.04 ps/m for 1.03→1.49 μm conversion. Thus, pump spectra as broad as Δν ≈ 10 THz should not reduce the efficiency of SRS. However, for the second stage of Raman conversion (1.49→2.68 μm), the value of GVM is as high as 1 ps/m, which means that SPM-induced spectral broadening should first reduce or even suppress the 1.49→2.68 μm Raman conversion, while the 1.03→1.49 μm SRS process still could be efficient.
All three regimes of spectral broadening mentioned above should also occur for higher D2 pressure. Moreover, as nonlinearity γ grows proportionally with D2 pressure, the pulse energy required to achieve those regimes should be proportionally reduced.
We studied the supercontinuum generation at different D2 pressures that were varied from 5 to 30 atm. At any pressure used, the output spectra had a similar dependence on pump pulse duration. As expected, the energy of pump pulses required to achieve efficient SRS and supercontinuum generation was reduced with D2 pressure. Figure 5 shows typical spectra at a D2 pressure of 30 atm, obtained for a τpump of 1ps (Figure 5, grey filled curve). The SC spectral coverage from 0.65 to 3.3 μm was observed when the coupled energy of 1pslong pump pulses was only 50 μJ, which should be compared with the 210 μJ needed to produce a similar SC bandwidth at 5 atm of D2. Moreover, the quantum efficiency of pump energy conversion to wavelengths above 2 μm was rising with pressure, reaching the value of about 14% at 30 atm of D2 (Figure 6, red solid curve).
It is instructive to consider the supercontinuum spectrum achieved in this work on a frequency scale (Figure 7). The grey filled area on Figure 7 illustrates optical loss of the hollow-core fiber. The shortening of the pump pulse duration from 12 ps to 1 ps resulted in the spectral broadening of separate SRS components (Figure 7, blue) into the SC that completely covered the 0.8–1.2 μm and 1.2–2.2 μm transmission windows of the fiber. Additionally, the SC covered the 0.6–0.8 μm transmission band in the visible part of the spectrum. In the mid-IR band of the fiber (2.2–5.0 μm), the supercontinuum reached wavelengths as long as 3.3 μm as measured at the −30 dB level.
In addition, the data presented in Figure 7 explain partially the reason for the reduction in quantum conversion efficiency that was observed in all SC generation regimes during the increase in pump pulse energy (e.g., see Figure 6, black dashed curve). Some part of the SC energy was inevitably lost in high-loss regions of the HCF near the wavelengths of 0.8, 1.2, and 2.2 μm.
Results of numerical simulations agreed well with the experiment, as can be seen in Figure 5, where measured (grey filled) and calculated (red) output spectra are compared for the case of 1 ps pulses with an energy of 50 μJ coupled into the 2.9 m long HCF that was filled by D2 at a pressure of 30 atm. More details about supercontinuum evolution can be deduced from the spectral power density plot (Figure 8, left). The pump propagated along the fiber length z and experienced slow spectral broadening due to self-phase modulation, while at about z = 1.5 m, vibrational SRS came into play by generating 1st (1.49 μm) and 2nd (2.68 μm) Stokes components. Note that two anti-Stokes components also appeared at λ = 0.79 μm and λ = 0.64 μm. At around z = 2 m, the spectrum evolved into a broad supercontinuum due to modulation instability, which is associated with the complex interplay between Kerr and Raman nonlinear processes and results in the pulse break up into multiple soliton-like pulses. At this point, four-wave mixing processes entered the competition with SRS. While SRS promotes the pump energy transfer to the mid-IR spectral range, the four-wave mixing stimulates the pump energy conversion toward the visible range, where the nonlinear coefficient γ had a higher value (Figure 2a, red). If energy transfer to anti-Stokes components is blocked in simulations, the supercontinuum evolves into the mid-IR much more efficiently (Figure 8, right). Thus, to improve spectral power density and spectral coverage of the SC in the mid-IR, it is important to place high-loss bands of the HCF at anti-Stokes wavelengths.

5. Conclusions

To conclude, a supercontinuum source is demonstrated on the basis of a hollow-core silica fiber filled by gaseous D2. Being pumped by the easily available ultrashort laser at 1.03 μm, the supercontinuum source covers the spectral bandwidth from 0.65 to 3.3 μm at the −30 dB level. As high as 14% of pump quanta were converted to the wavelength range above 2 μm.

Author Contributions

Conceptualization, I.B. and A.G.; methodology, Y.Y., I.B. and A.G.; formal analysis, Y.Y. and A.G.; investigation, A.G. and A.K.; resources, A.G. and A.K.; writing—original draft preparation, A.G.; writing—review and editing, A.G., Y.Y. and I.B.; visualization, A.G.; supervision, A.G. and I.B.; project administration, A.G. and I.B.; funding acquisition, A.G. and I.B. All authors have read and agreed to the published version of the manuscript.

Funding

This research was supported by the Russian Science Foundation (grant No. 19-12-00361), https://rscf.ru/en/project/19-12-00361/ (accessed on 16 December 2022).

Institutional Review Board Statement

Not applicable.

Informed Consent Statement

Not applicable.

Data Availability Statement

The data that support the findings of this study are available from the corresponding author, A.G., upon reasonable request.

Conflicts of Interest

The authors declare no conflict of interest.

References

  1. Théberge, F.; Bérubé, N.; Poulain, S.; Cozic, S.; Châtigny, S.; Robichaud, L.-R.; Pleau, L.-P.; Bernier, M.; Vallée, R. Infrared supercontinuum generated in concatenated InF3 and As2Se3 fibers. Opt. Express 2018, 26, 13952–13960. [Google Scholar] [CrossRef]
  2. Gauthier, J.-C.; Robichaud, L.-R.; Fortin, V.; Vallee, R.; Bernier, M. Mid-infrared supercontinuum generation in fluoride fiber amplifiers: Current status and future perspectives. Appl. Phys. B 2018, 124, 122. [Google Scholar] [CrossRef]
  3. Yang, L.; Zhang, B.; He, X.; Deng, K.; Liu, S.; Hou, J. 20.6 W Mid-Infrared Supercontinuum Generation in ZBLAN Fiber With Spectrum of 1.9–4.3 μm. J. Lightwave Technol. 2020, 38, 5122–5127. [Google Scholar] [CrossRef]
  4. Lemière, A.; Bizot, R.; Désévédavy, F.; Gadret, G.; Jules, J.-C.; Mathey, P.; Aquilina, C.; Béjot, P.; Billard, F.; Faucher, O.; et al. 1.7–18 μm mid-infrared supercontinuum generation in a dispersion engineered step-index chalcogenide fiber. Results Phys. 2021, 26, 104397. [Google Scholar] [CrossRef]
  5. Zhao, Z.; Wu, B.; Wang, X.; Pan, Z.; Liu, Z.; Zhang, P.; Shen, X.; Nie, Q.; Dai, S.; Wang, R. Mid-infrared supercontinuum covering 2.0–16 μm in a low-loss telluride single-mode fiber. Laser Photonics Rev. 2017, 11, 1700005. [Google Scholar] [CrossRef] [Green Version]
  6. Hudson, D.; Antipov, S.; Li, L.; Alamgir, I.; Hu, T.; Amraoui, M.E.; Messaddeq, Y.; Rochette, M.; Jackson, S.D.; Fuerbach, A. Toward all fibers upercontinuum spanning the mid-infrared. Optica 2017, 4, 1163–1166. [Google Scholar] [CrossRef]
  7. Venck, S.; St-Hilaire, F.; Brilland, L.; Ghosh, A.N.; Chahal, R.; Caillaud, C.; Meneghetti, M.; Troles, J.; Joulain, F.; Cozic, S.; et al. 2–10 μm mid-infrared fiber-based supercontinuum laser source: Experiment and simulation. Laser Photonics Rev. 2020, 14, 2000011. [Google Scholar] [CrossRef]
  8. Woyessa, G.; Kwarkye, K.; Dasa, M.K.; Petersen, C.R.; Sidharthan, R.; Chen, S.; Yoo, S.; Bang, O. Power stable 1.5–10.5 μm cascaded mid-infrared supercontinuum laser without thulium amplifier. Opt. Lett. 2021, 46, 1129–1132. [Google Scholar] [CrossRef]
  9. Wang, Y.Y.; Wheeler, N.V.; Couny, F.; Roberts, P.J.; Benabid, F. Low loss broadband transmission in hypocycloid-core Kagome hollow-core photonic crystal fiber. Opt. Lett. 2011, 36, 669–671. [Google Scholar] [CrossRef]
  10. Pryamikov, A.D.; Biriukov, A.S.; Kosolapov, A.F.; Plotnichenko, V.G.; Semjonov, S.L.; Dianov, E.M. Demonstration of a waveguide regime for a silica hollow-core microstructured optical fiber with a negative curvature of the core boundary in the spectral region > 3.5 μm. Opt. Express 2011, 19, 1441–1448. [Google Scholar] [CrossRef]
  11. Yu, F.; Wadsworth, W.J.; Knight, J.C. Low loss silica hollow core fibers for 3–4 μm spectral region. Opt. Express 2012, 20, 11153–11158. [Google Scholar] [CrossRef] [PubMed] [Green Version]
  12. Kolyadin, A.N.; Kosolapov, A.F.; Pryamikov, A.D.; Biriukov, A.S.; Plotnichenko, V.G.; Dianov, E.M. Light transmission in negative curvature hollow core fiber in extremely high material loss region. Opt. Express 2013, 21, 9514–9519. [Google Scholar] [CrossRef] [PubMed]
  13. Debord, B.; Alharbi, M.; Vincetti, L.; Husakou, A.; Fourcade-Dutin, C.; Hoenninger, C.; Mottay, E.; Gérôme, F.; Benabid, F. Multi-meter fiber-delivery and pulse self-compression of milli-Joule femtosecond laser and fiber-aided laser-micromachining. Opt. Express 2014, 22, 10735–10746. [Google Scholar] [CrossRef] [PubMed]
  14. Balciunas, T.; Fourcade-Dutin, C.; Fan, G.; Witting, T.; Voronin, A.A.; Zheltikov, A.M.; Gerome, F.; Paulus, G.G.; Baltuska, A.; Benabid, F. A strong-field driver in the single-cycle regime based on self-compression in a kagome fibre. Nat. Commun. 2015, 6, 6117. [Google Scholar] [CrossRef] [Green Version]
  15. Russell, P.S.J.; Hölzer, P.; Chang, W.; Abdolvand, A.; Travers, J.C. Hollow-core photonic crystal fibres for gas-based nonlinear optics. Nat. Photonics 2014, 8, 278. [Google Scholar] [CrossRef]
  16. Markos, C.; Travers, J.C.; Abdolvand, A.; Eggleton, B.J.; Bang, O. Hybrid photonic-crystal fiber. Rev. Mod. Phys. 2017, 89, 045003. [Google Scholar] [CrossRef] [Green Version]
  17. Debord, B.; Amrani, F.; Vincetti, L.; Gérôme, F.; Benabid, F. Hollow-Core Fiber Technology: The Rising of Gas Photonics. Fibers 2019, 7, 16. [Google Scholar] [CrossRef] [Green Version]
  18. Ermolov, A.; Mak, K.F.; Frosz, M.N.; Travers, J.C.; Russell, P.S.J. Supercontinuum generation in the vacuum ultraviolet through dispersive-wave and soliton-plasma interaction in a noble-gas-filled hollow-core photonic crystal fiber. Phys. Rev. A 2015, 92, 033821. [Google Scholar] [CrossRef] [Green Version]
  19. Tani, F.; Travers, J.C.; Russell PSt, J. PHz-wide Supercontinua of Nondispersing Sub cycle Pulses Generated by Extreme Modulational Instability. Phys. Rev. Lett. 2013, 111, 033902. [Google Scholar] [CrossRef]
  20. Belli, F.; Abdolvand, A.; Chang, W.; Travers, J.C.; Russell PSt, J. Vacuum-ultraviolet to infrared supercontinuum in hydrogen-filled photonic crystal fiber. Optica 2015, 2, 292. [Google Scholar] [CrossRef]
  21. Yatsenko, Y.P.; Pleteneva, E.N.; Okhrimchuk, A.G.; Gladyshev, A.V.; Kosolapov, A.F.; Kolyadin, A.N.; Bufetov, I.A. Multiband supercontinuum generation in an air-core revolver fibre. Quantum Electron. 2017, 47, 553–560. [Google Scholar] [CrossRef]
  22. Debord, B.; Maurel, M.; Gerome, F.; Vincetti, L.; Husakou, A.; Benabid, F. Strong nonlinear optical effects in micro-confined atmospheric air. Photon. Res. 2019, 7, 1134–1141. [Google Scholar] [CrossRef]
  23. Gao, S.-F.; Wang, Y.-Y.; Belli, F.; Brahms, C.; Wang, P.; Travers, J.C. From Raman frequency combs to supercontinuum generation in nitrogen-filled hollow-core anti-resonant fiber. Laser Photonics Rev. 2022, 16, 2100426. [Google Scholar] [CrossRef]
  24. Kergoustin, D.; Amrani, F.; Debord, B.; Gérôme, F.; Benabid, F. Multi-Octave Light Source with Tunable Spectral Profile: From Supercontinuum to Raman Comb Spectral-Structure. In Proceedings of the 2019 Conference on Lasers and Electro-Optics Europe & European Quantum Electronics Conference (CLEO/Europe-EQEC), Munich, Germany, 23–27 June 2019; p. 1. [Google Scholar] [CrossRef]
  25. Köttig, F.; Novoa, D.; Tani, F.; Günendi, M.C.; Cassataro, M.; Travers, J.C.; Russell PSt, J. Mid-infrared dispersive wave generation in gas-filled photonic crystal fibre by transient ionization-driven changes in dispersion. Nat. Commun. 2017, 8, 813. [Google Scholar] [CrossRef] [PubMed] [Green Version]
  26. Cassataro, M.; Novoa, D.; Günendi, M.C.; Edavalath, N.N.; Frosz, M.H.; Travers, J.C.; Russell PSt, J. Generation of broadband mid-IR and UV light in gas-filled single-ring hollow-core PCF. Opt. Express 2017, 25, 7637–7644. [Google Scholar] [CrossRef] [Green Version]
  27. Deng, A.; Gavara, T.; Hassan, M.R.A.; Jin, Y.; Wang, Q.J.; Chang, W. Four-Octave-Spanning Mid-Infrared Supercontinuum Generation in a Gas-Filled Hollow-Core Fiber. In Conference on Lasers and Electro-Optics; Kang, J., Tomasulo, S., Ilev, I., Müller, D., Litchinitser, N., Polyakov, S., Podolskiy, V., Nunn, J., Dorrer, C., Fortier, T., et al., Eds.; OSA Technical Digest (Optical Society of America): Washington, DC, USA, 2021; p. STh5A.1. [Google Scholar] [CrossRef]
  28. Adamu, A.I.; Habib, M.S.; Petersen, C.R.; Lopez, J.E.A.; Zhou, B.; Schülzgen, A.; Bache, M.; Amezcua-Correa, R.; Bang, O.; Markos, C. Deep-UV to Mid-IR Supercontinuum Generation driven by Mid-IR Ultrashort Pulses in a Gas-filled Hollow-core Fiber. Sci. Rep. 2019, 9, 1. [Google Scholar] [CrossRef] [Green Version]
  29. Gladyshev, A.; Yatsenko, Y.; Kolyadin, A.; Kompanets, V.; Bufetov, I. Mid-infrared 10-µJ-level sub-picosecond pulse generation via stimulated Raman scattering in a gas-filled revolver fiber. Opt. Mater. Express 2020, 10, 3081–3089. [Google Scholar] [CrossRef]
  30. Yatsenko, Y.P.; Gladyshev, A.V.; Bufetov, I.A. Mid-IR supercontinuum generation initiated by two-cascade stimulated Raman scattering in D2-filled revolver fibre. Quantum Electron. 2021, 51, 1068–1075. [Google Scholar] [CrossRef]
  31. Dudley, J.; Taylor, R. Supercontinuum Generation in Optical Fibers; Cambridge University Press: Cambridge, UK, 2010. [Google Scholar] [CrossRef]
  32. Ottush, J.J.; Rockwell, D.A. Measurement of raman gain coefficient of hydrogen, deuterium, andmethane. IEEE J. Quantum Electron. 1988, 24, 2076–2080. [Google Scholar] [CrossRef]
  33. Wahlstrand, J.K.; Zahedpour, S.; Cheng, Y.-H.; Palastro, J.P.; Mildberg, H.M. Absolute measurement of the ultrafast nonlinear electronic and rovibrational response in H2 and D2. Phys. Rev. A 2015, 92, 063828. [Google Scholar] [CrossRef] [Green Version]
  34. Stolen, R.H.; Gordon, J.P.; Tomlinson, W.J.; Haus, H.A. Raman response function of silica-core fibers. J. Opt. Soc. Am. B 1989, 6, 1159–1166. [Google Scholar] [CrossRef]
  35. Larsen, T. Refraktion und Dispersion des Deuteriums. Z. Phys. 1936, 100, 543–546. [Google Scholar] [CrossRef]
  36. Spence, D.J. Spectral effects of stimulated Raman scattering in crystals. Prog. Quantum Electron. 2017, 51, 1–45. [Google Scholar] [CrossRef]
Figure 1. (a) The scheme of experimental setup; (b) SEM image of the hollow-core fiber cross-section.
Photonics 09 00997 g001
Figure 2. (a) The optical loss spectrum (black) and nonlinear coefficient γ (red) calculated for the fundamental mode of the HCF. (bd) Quadratic dispersion β2 as a function of wavelength in different transmission windows of the HCF. Both waveguide and gas dispersion were taken into account. Dispersion data are presented for D2 pressures from 0 to 50 atm with a step of 10 atm.
Photonics 09 00997 g002
Figure 3. The output spectra at pump pulse duration of 12 ps (a), 3 ps (b), and 1 ps (c). Quantum conversion efficiency of the pump into 1.1–1.9 μm band (black dashed curves) and to wavelength range above 1.9 μm (red solid curves) at pump pulse duration of 12 ps (d), 3 ps (e), and 1 ps (f). The pressure of D2 was 5 atm.
Photonics 09 00997 g003
Figure 4. The estimated SPM-induced spectral broadening as a function of pump pulse duration. The pulse energy was 210 μJ and the pressure of D2 was 5 atm.
Photonics 09 00997 g004
Figure 5. The measured (grey filled) and numerically simulated (red) SC spectra for the case of 1 ps, 50 μJ pump pulses coupled into the 2.9 m long HCF that was filled by D2 at a pressure of 30 atm.
Photonics 09 00997 g005
Figure 6. Quantum conversion efficiency of the pump into 1.1–1.9 μm band (black dashed curves) and to wavelength range above 1.9 μm (red solid curves) at pump pulse duration of 1 ps.
Photonics 09 00997 g006
Figure 7. The spectra measured at the output of the HCF for pump pulse duration of 12 ps (blue curve) and 1 ps (red curve). The coupled pump pulse energy was 50 μJ, the pressure of D2 was 30 atm, and thefiber length was 2.9 m. The optical loss spectrum of the HCF is also shown (grey filled curve).
Photonics 09 00997 g007
Figure 8. Numerical simulations of the spectral evolution. The energy of the pump pulses coupled to the HCF was 50 μJ. The input pulses had a duration of 1 ps with the chirp value of C = 4. The pressure of gaseous D2 was 50 atm. The figure on the right was obtained for the case when anti-Stokes generation was intentionally blocked in the simulations.
Photonics 09 00997 g008
Publisher’s Note: MDPI stays neutral with regard to jurisdictional claims in published maps and institutional affiliations.

