Communication

Mid-Infrared Frequency Modulation Spectroscopy of NO Detection in a Hollow-Core Antiresonant Fiber

1
Department of Mechanical and Automation Engineering, The Chinese University of Hong Kong, Hong Kong SAR 999077, China
2
Optoelectronics Research Centre, University of Southampton, Hampshire SO17 1BJ, UK
*
Author to whom correspondence should be addressed.
Photonics 2022, 9(12), 935; https://doi.org/10.3390/photonics9120935
Submission received: 2 November 2022 / Revised: 28 November 2022 / Accepted: 1 December 2022 / Published: 3 December 2022
(This article belongs to the Special Issue Emerging Frontiers in Photoacoustic Spectroscopy Detection)

Abstract

:
Mid-infrared frequency modulation spectroscopy (FMS) in a tellurite hollow-core antiresonant fiber (HC-ARF) is investigated for gas detection. The spectroscopic system is demonstrated for nitric oxide (NO) detection by exploiting its strong absorption line at 1900.08 cm−1 with a quantum cascade laser (QCL). By modulating the injection current of the QCL at 250 MHz and measuring NO in a 35 cm long HC-ARF, we achieve a noise equivalent concentration of 67 ppb at an averaging time of 0.1 s. Compared to direct absorption spectroscopy with a low-pass filter for etalon noise reduction, the FMS technique shows an improvement factor of 22. The detection limit of FMS can be further improved to 6 ppb at a longer averaging time of 100 s, corresponding to a noise equivalent absorption coefficient of 1.0 × 10⁻⁷ cm−1.

1. Introduction

Tunable diode laser absorption spectroscopy (TDLAS), known for its high selectivity and simple configuration, has been widely used for the development of optical gas sensors [1]. Wavelength modulation spectroscopy (WMS) with high sensitivity and etalon noise immunity is an essential extension of TDLAS for trace gas sensing in the infrared region [2]. WMS is normally performed by tuning the laser wavelength across the target absorption line with a superimposed kHz rate wavelength modulation. By comparison, frequency modulation spectroscopy (FMS) is conducted when the modulation frequency is large enough, which is comparable to the width of the spectral feature of interest, i.e., at hundreds of MHz or several GHz [3,4].
The choice of WMS and FMS depends on the characteristics of the system and how well each technique can be experimentally implemented [5]. Frequency modulation of a monochromatic laser results in the emergence of discrete sidebands around the carrier frequency, where the modulation depth determines the relative intensities of the carrier and the sidebands. Frequency modulation can be achieved either by direct modulation of the laser source or by external phase modulation using an electro-optical modulator (EOM). The frequency-modulated laser beam can be scanned across the absorption feature either by tuning the laser frequency or the radio-level modulation frequency [6]. A phase-sensitive detection scheme can be applied to the demodulation of the heterodyne beat note after a photodetector. FMS has been investigated in the near-infrared region by several groups [7,8]. A distributed feedback (DFB) laser at 1.51 µm was modulated by an EOM at 340 MHz for the detection of acetylene, and the beat note signal was demodulated by a double-balanced mixer (DBM) [9]. To overcome the issue of light intensity fluctuations and phase randomness in quadrature demodulation, a self-corrected method was devised and applied for water detection at 1.39 µm [10].
It is more interesting to explore FMS in the mid-infrared region to target the stronger absorption lines [11]. For instance, a continuous-wave optical parametric oscillator (cw-OPO) pumped by a fiber-coupled DFB laser was used for FMS detection of CH4 at 3.26 µm by using a mid-infrared EOM and DBM detection, showing the single-tone FM absorption spectra [12]. A two-tone frequency modulation spectroscopy (TTFMS) configuration was demonstrated with a 13 m long multi-pass cell by using a portable difference-frequency source at 3.3 µm, achieving a sub ppb detection limit [13]. The use of quantum cascade lasers (QCLs) for FMS was first reported for the detection of methane (CH4) and nitrous oxide (N2O) with a current modulation of 170 MHz at 8.06 µm, reaching a noise equivalent concentration (NEC) of 20 ppm [11]. The modulation characteristics of QCL were then investigated in the frequency domain using an optical frequency-to-amplitude conversion technique based on CH4 absorption [14]. A comparison between single-tone FMS and TTFMS was performed using two QCLs of 8.06 µm and 7.3 µm, showing a considerable reduction in detection bandwidth and an improvement in detection sensitivity for the TTFMS configuration [15]. FMS was also investigated in a terahertz spectrometer by a current modulation up to 50 MHz, showing the potential of frequency modulation to be applied in high-resolution THz spectroscopy [16]. A calibration-free FMS model was then proposed in a frequency range from kHz to GHz to account for the influence of intensity tuning during the injection-current scan of the laser source [17]. In addition to the current modulation at radio frequency, FMS has also been demonstrated by optical illumination. All-optical frequency modulation of a DFB-QCL at 200 MHz was demonstrated by illuminating the 4.67 µm QCL using a 1.55 µm near-infrared laser [18]. FMS was also applied for high-temperature measurement of hydrogen cyanide (HCN) using a single-tone MIR frequency modulation detection scheme [19].
However, all the previous FMS systems were performed with bulky free-space gas cells. Recently, hollow-core antiresonant fibers (HC-ARFs) have shown the potential to replace conventional free-space gas cells for providing a smaller gas volume and a more compact system [20,21,22,23,24,25,26]. In this work, we demonstrate the FMS of nitric oxide (NO) in a tellurite HC-ARF using a DFB-QCL at 5.26 µm. The frequency modulation is achieved up to 350 MHz by the direct current modulation. A down-conversion scheme is adopted to satisfy the bandwidth limitation of the lock-in amplifier in the demodulation process. With a 35 cm long tellurite HC-ARF, we demonstrate an NEC of 67 ppb at an averaging time of 0.1 s for FMS, which shows an improvement factor of 22 compared to direct absorption spectroscopy (DAS).

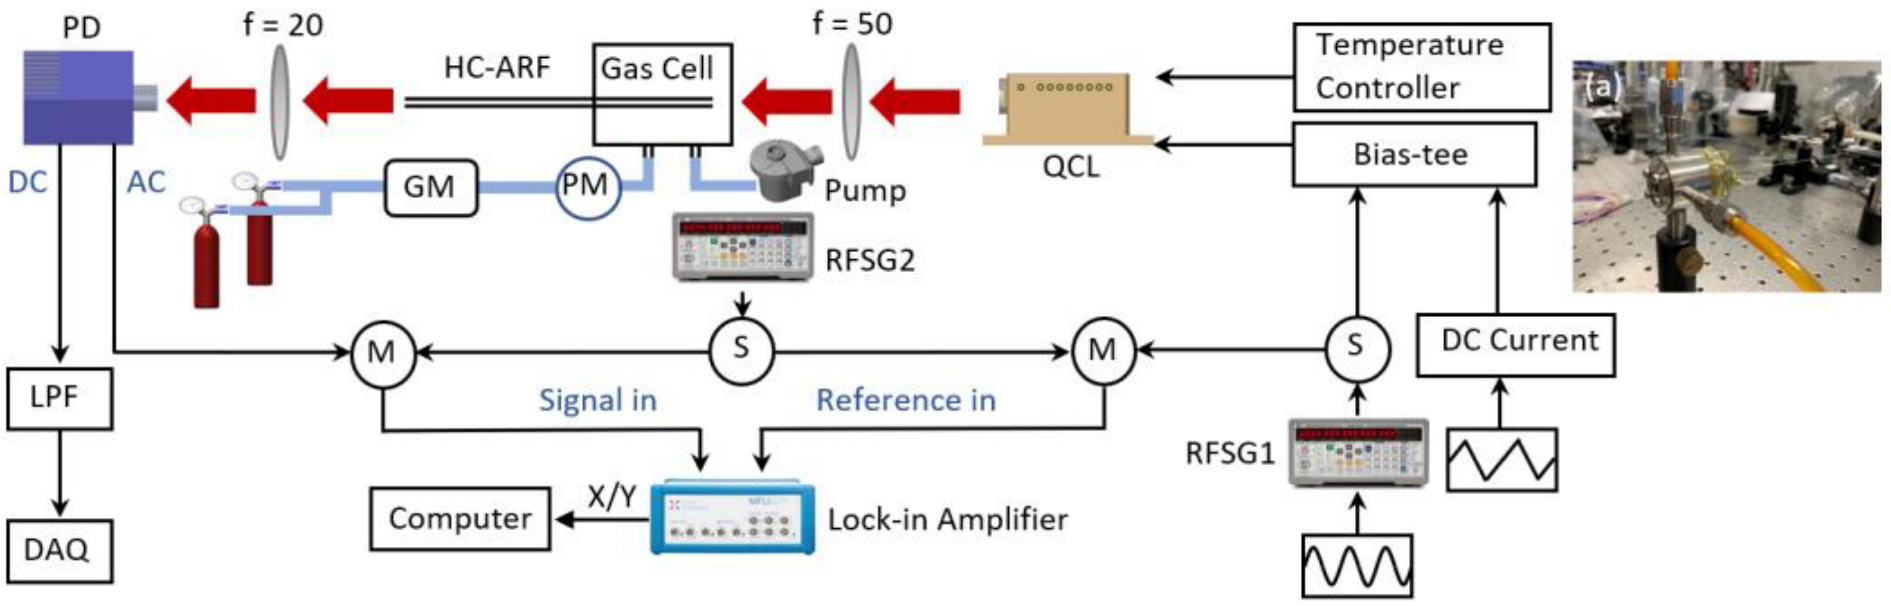
2. Experimental Setup

Figure 1 presents the experimental setup of the mid-infrared HC-ARF-coupled FMS. A continuous-wave QCL (AdTech Optics) can be tuned across the absorption line of NO centered at 1900.08 cm−1. The radio frequency modulation is achieved by the direct current modulation from RFSG1 (SG382, Stanford Research Systems) exerted from the AC port of a bias-tee circuit. The QCL current is also swept by a triangular waveform at 10 Hz to scan across the NO absorption profile. The custom-made tellurite HC-ARF is composed of a single layer of hollow capillaries, forming a hollow air core with a diameter of 130 µm, and has a total length of 35 cm. The QCL beam is coupled to the HC-ARF by an AR-coated CaF2 plano-convex lens (focal length of 50 mm) with the HE11 mode transmission. One end of the HC-ARF used in this study is fixed inside a gas cell with high compactness for gas introduction into the fiber, as indicated in the inset graph (a) of Figure 1. More details of the HC-ARF gas cell can be found in our recent work [27].
After exiting the HC-ARF, the QCL beam is focused onto an MCT photodetector (Vigo System, Ożarów Mazowiecki, Poland) with a bandwidth of 1 GHz via a plano-convex lens (focal length of 20 mm). For the frequency down-conversion to 200 kHz, the AC port of the photodetector is mixed with the sinusoidal signal from RFSG2 (SG382, Stanford Research Systems, Sunnyvale, CA, USA). The 200 kHz signal output is then sent to a commercial lock-in amplifier (Zurich Instruments, Zurich, Switzerland) with a bandwidth of 500 kHz to obtain the FMS spectra. Finally, the amplitude of the in-phase FMS-1f signal is obtained by adjusting the relative phase difference between the input and reference signals sent to the lock-in amplifier.
For comparison purposes, the DAS signal can be measured at the same time through the DC port of the photodetector. A low-pass filter with a cut-off frequency of 30 kHz is used to eliminate the fringe noise, which may come from the mode interference inside the HC-ARF. Two gas cylinders, 100 ppm NO/N2 and pure N2 (purity 99.999%), are used for the gas mixture preparation. A commercial gas mixer (Jinwei Electronics Co. Ltd., Wuhan, China) is used to dilute NO to the target gas concentration. A pressure difference of 2 kPa between the two ends of the HC-ARF is maintained to pressurize the gas mixture into the fiber core. Since one end of the fiber is open to atmosphere, a slow gas flow guarantees the homogeneous pressure inside the fiber with a short length.

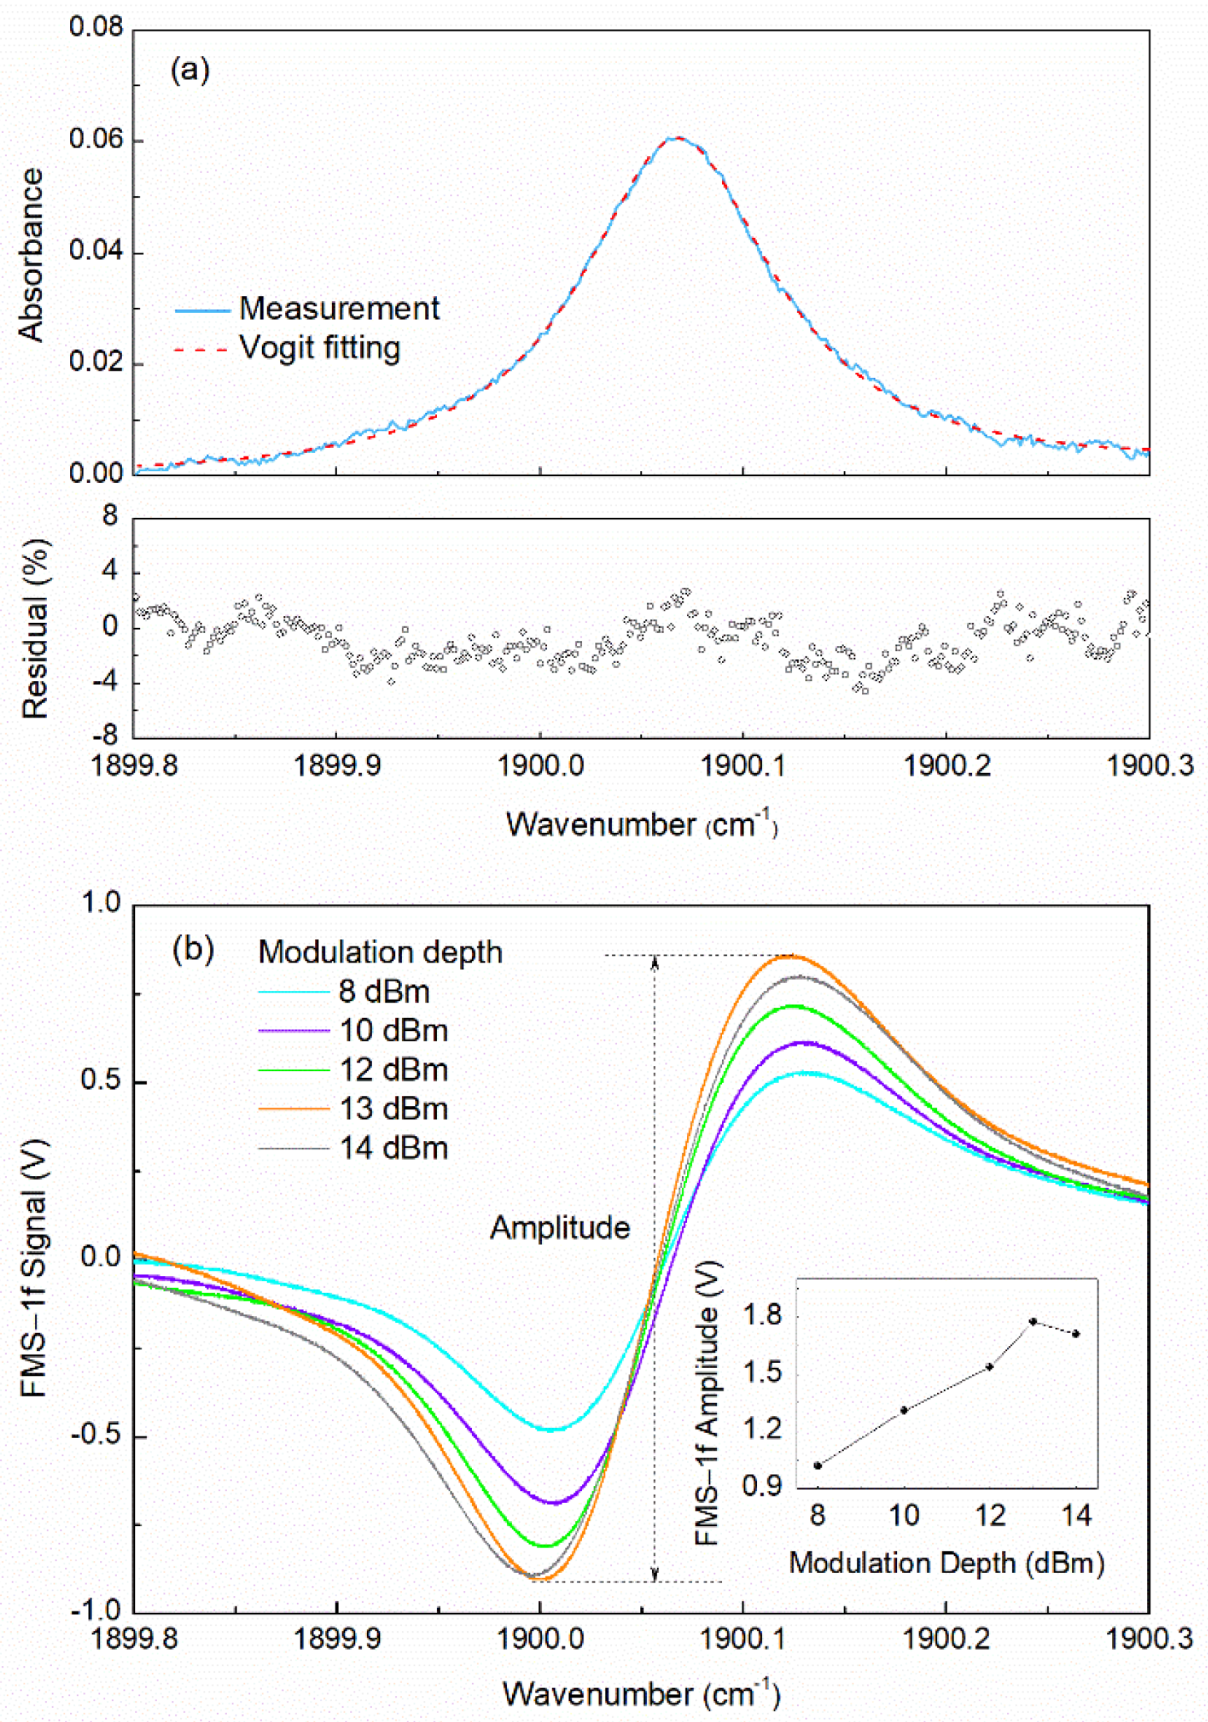
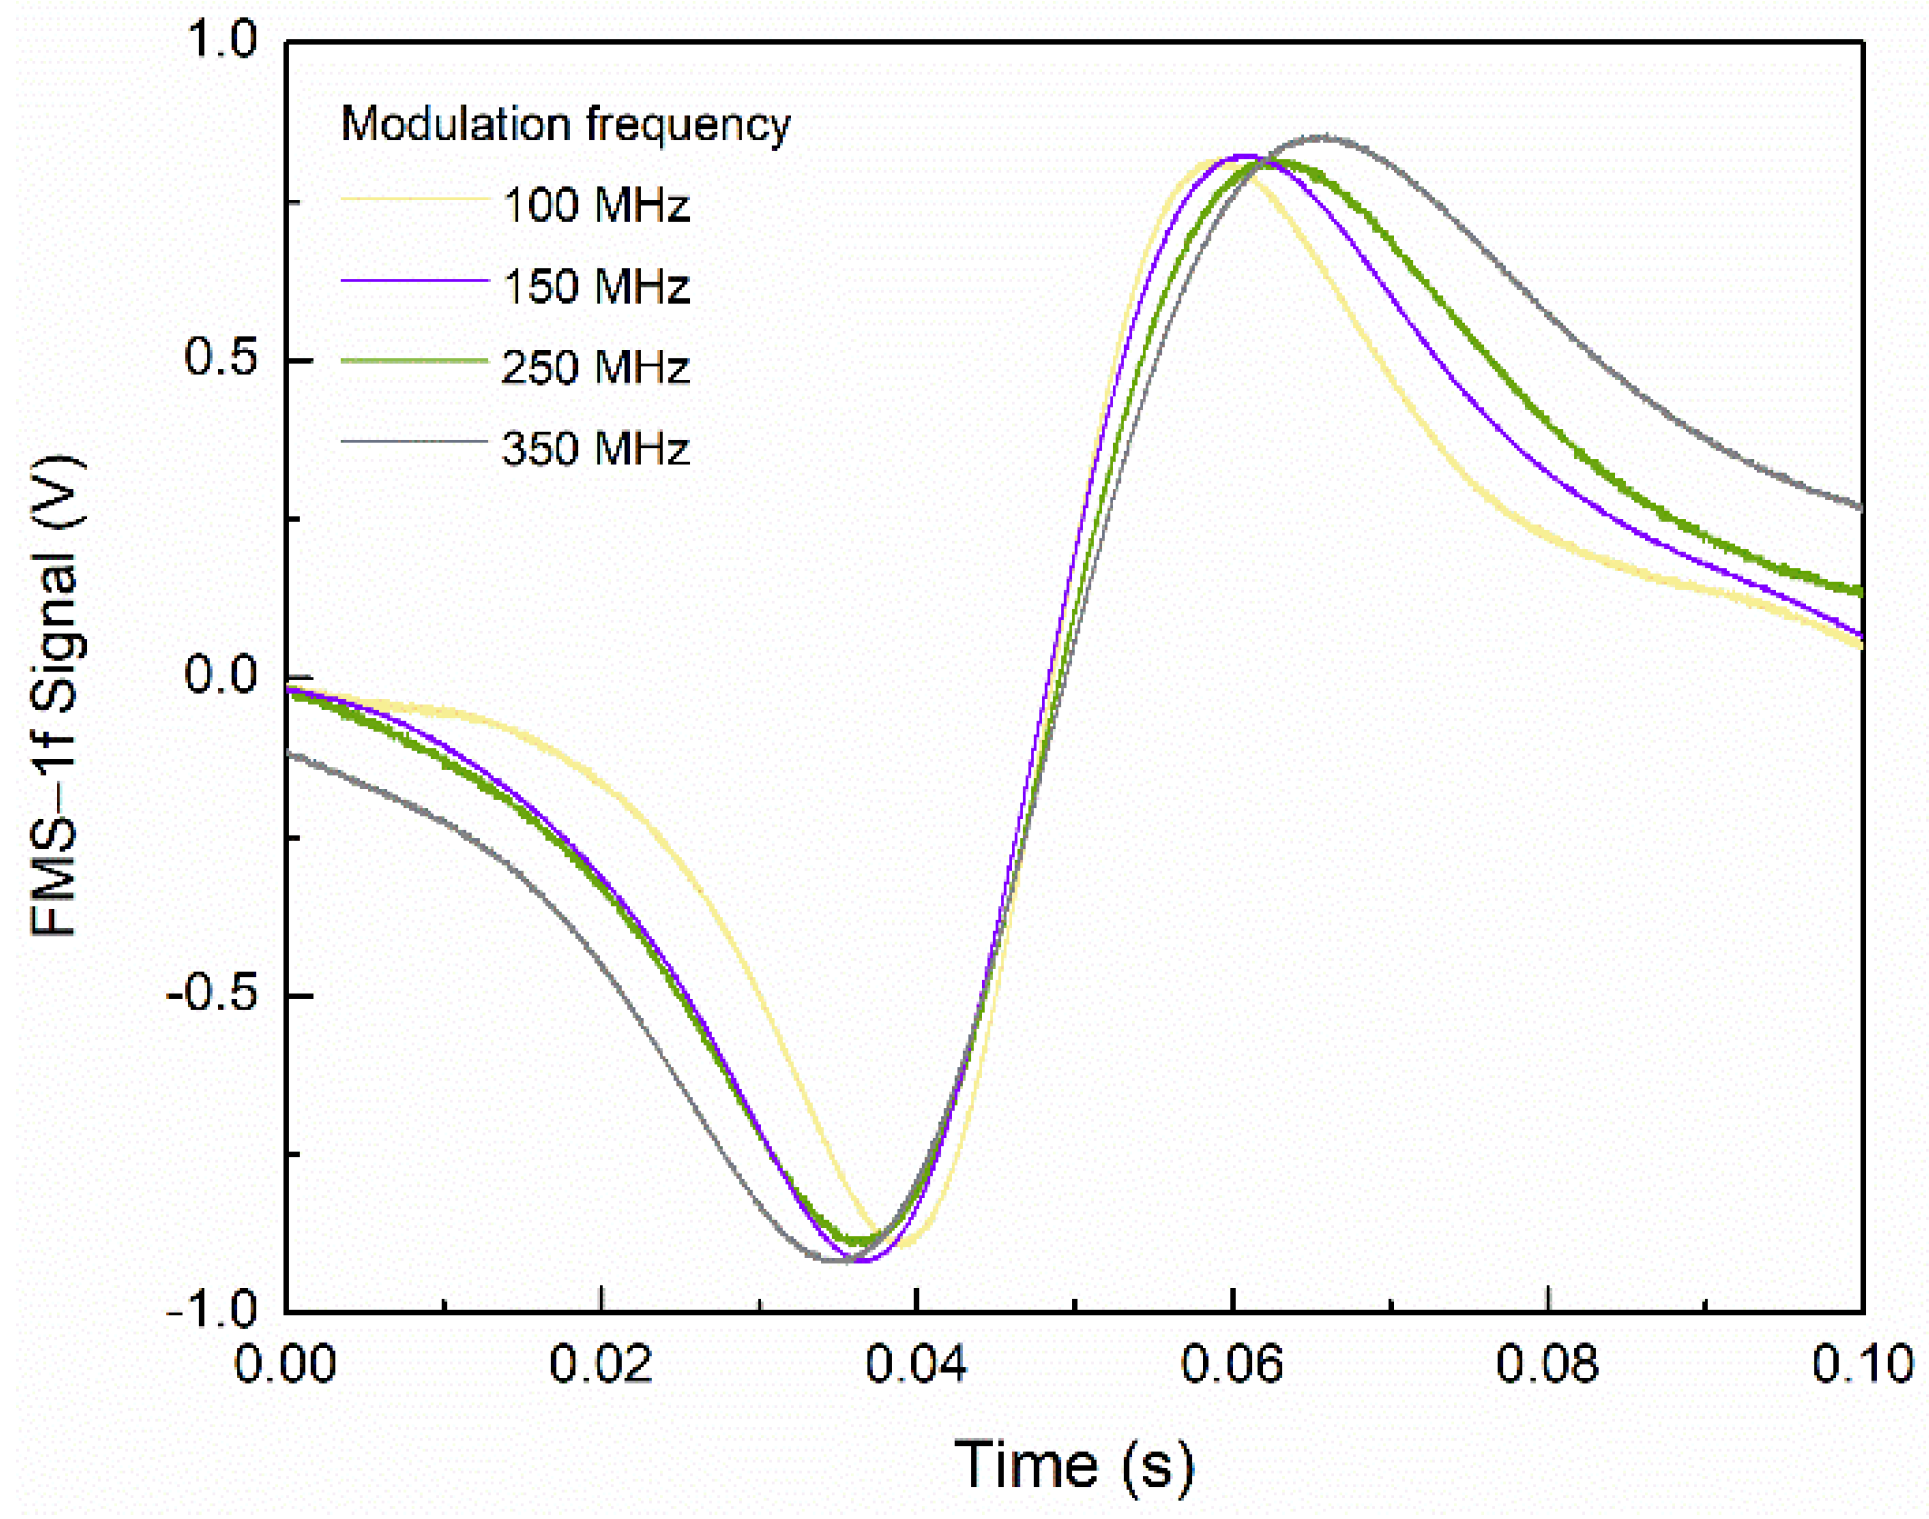
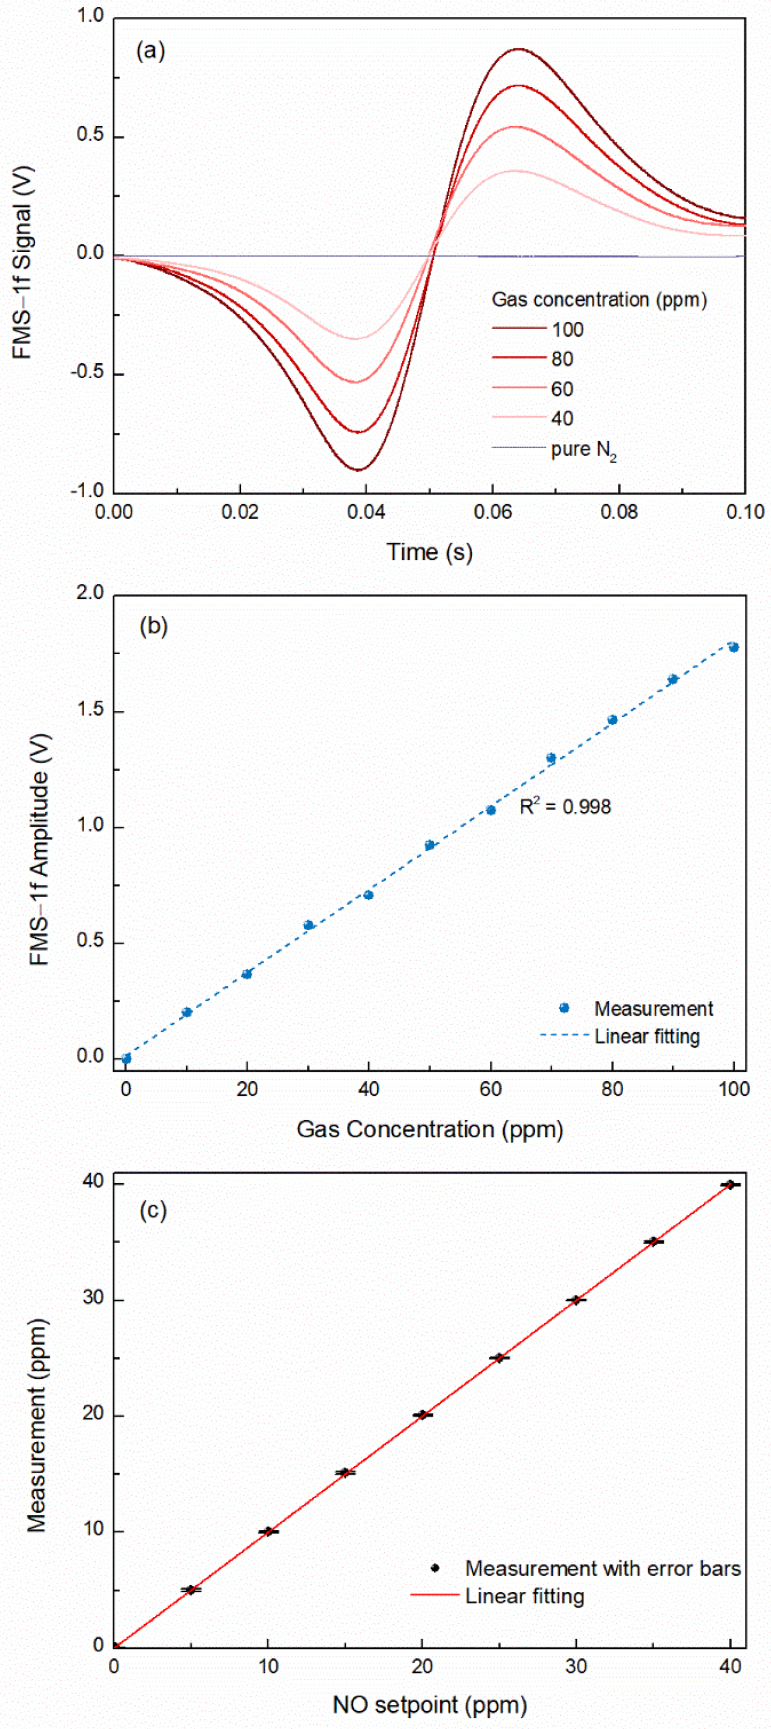
3. Results and Discussion

Figure 2 depicts the spectral measurement of 100 ppm NO using DAS and FMS methods, respectively. To mitigate the fringe noise in DAS, an electrical low-pass filter with a cut-off frequency of 30 kHz is used. The fringe noise may come from the mode interference in the HC-ARF and the etalon noise caused by the windows and lenses. Figure 2a presents the measured absorbance together with the profile fitting using the Voigt line-shape function. A germanium etalon (FSR = 0.0164 cm−1) is used in this work (not shown in Figure 1) to transform the x-axis from sample time to wavenumber. The bottom panel of Figure 2a shows the fitting residual of ±5%. The noise level is evaluated by a standard deviation (1σ) of 9 × 10⁻⁴, resulting in a signal-to-noise ratio (SNR) of 67 in DAS. Thus, an NEC of 1.5 ppm NO is determined for DAS measurement. In comparison, Figure 2b shows the representative FMS-1f signals measured under different modulation depths. The modulation depth in FMS can be varied by adjusting the output power level of RFSG1 (8–14 dBm), which is injected to the QCL through the bias-tee circuit. The peak-to-peak amplitude of the FMS-1f signal is plotted as a function of modulation depth in the inset of Figure 2b. Note that the noise level remains the same under different modulation depths. Hence, the output power of 13 dBm is selected as the optimal value for the highest SNR.
The influence of modulation frequency on FMS is also investigated with the typical results shown in Figure 3. Despite the variation of the FMS-1f profile, there is a negligible difference in the peak-to-peak amplitude when the modulation frequency is changed from 100 to 350 MHz. The tendency of the reduced spectral width of the FMS-1f profile with the decrease in modulation frequency indicates the frequency shift of the sideband [28]. Two separate peaks can be expected when the modulation frequency is larger than the spectral width [5]. In this work, we selected the modulation of 250 MHz for the following experiment.
To evaluate the performance of the FMS measurement in the mid-infrared HC-ARF, the sensor response is examined under varied NO concentrations. Figure 4a depicts the representative FMS-1f signals for various NO mixtures. The background signal of pure N2 is also shown in the same figure with a 1σ of 1.2 mV. According to the linear response (17.8 mV/ppm, R-square 0.998) of the sensor over the concentration range of 0–100 ppm, as shown in Figure 4b, the HC-ARF-coupled FMS sensor shows an NEC of 67 ppb or a noise equivalent absorption (NEA) coefficient of 1.2 × 10⁻⁶ cm−1. In order to evaluate the repeatability of the gas sensor, three groups of measurements are conducted from 5 to 40 ppm with an interval of 5 ppm, as indicated in Figure 4c. The error bars represent the standard deviation with a maximal uncertainty of 0.8%.
The long-term stability of the FMS sensor is evaluated by performing the Allan-Werle deviation analysis with pure N2 flowing through the HC-ARF. By locking the laser wavelength to the absorption line center of NO, the signal of pure N2 is continuously measured for 20 min with the acquisition rate of 10 Hz. An improved NEC of 6 ppb is observed at an averaging time of 100 s, as shown in Figure 5, corresponding to an NEA coefficient of 1.0 × 10⁻⁷ cm−1. The sensitivity of the current FMS sensor is mainly limited by the short length of the tellurite HC-ARF and the possible fringe noise.

4. Conclusions

In conclusion, we demonstrate the FMS of NO detection with the 35 cm long tellurite HC-ARF. Both DAS and FMS demonstrations are performed to evaluate the sensor performance by targeting the strong NO absorption line at 5.26 µm. For FMS, the direct current modulation of QCL at 250 MHz is conducted to achieve an NEC of 67 ppb NO, which shows an improvement factor of 22 compared to DAS. The NEC can be further reduced to 6 ppb at a longer integration time of 100 s, corresponding to an NEA coefficient of 1.0 × 10⁻⁷ cm−1. Future work involves the use of a longer HC-ARF for a more sensitive and compact FMS gas sensor development.

Author Contributions

Conceptualization, M.H. and W.R.; methodology, M.H. and W.R.; validation, M.H.; formal analysis, M.H.; investigation, M.H.; resources, A.V., J.G.H. and F.P.; writing—original draft preparation, M.H.; writing—review and editing, M.H. and W.R.; visualization, M.H.; supervision, W.R.; project administration, W.R.; funding acquisition, W.R. All authors have read and agreed to the published version of the manuscript.

Funding

This research was funded by General Research Fund (14208221, 14209220) of Research Grants Council (RGC) of Hong Kong SAR, China.

Institutional Review Board Statement

Not applicable.

Informed Consent Statement

Not applicable.

Data Availability Statement

Not applicable.

Conflicts of Interest

The authors declare no conflict of interest.

References

  1. Farooq, A.; Alquaity, A.B.; Raza, M.; Nasir, E.F.; Yao, S.; Ren, W. Laser sensors for energy systems and process industries: Perspectives and directions. Prog. Energy Combust. Sci. 2022, 91, 100997. [Google Scholar] [CrossRef]
  2. Rieker, G.B.; Jeffries, J.B.; Hanson, R.K. Calibration-free wavelength-modulation spectroscopy for measurements of gas temperature and concentration in harsh environments. Appl. Opt. 2009, 48, 5546–5560. [Google Scholar] [CrossRef] [PubMed]
  3. Supplee, J.M.; Whittaker, E.A.; Lenth, W. Theoretical description of frequency modulation and wavelength modulation spectroscopy. Appl. Opt. 1994, 33, 6294–6302. [Google Scholar] [CrossRef] [PubMed]
  4. Wang, F.; Jia, S.; Wang, Y.; Tang, Z. Recent Developments in Modulation Spectroscopy for Methane Detection Based on Tunable Diode Laser. Appl. Sci. 2019, 9, 2816. [Google Scholar] [CrossRef] [Green Version]
  5. Silver, J.A. Frequency-modulation spectroscopy for trace species detection: Theory and comparison among experimental methods: Errata. Appl. Opt. 1992, 31, 4927. [Google Scholar] [CrossRef]
  6. Bjorklund, G.C. Frequency-modulation spectroscopy: A new method for measuring weak absorptions and dispersions. Opt. Lett. 1980, 5, 15–17. [Google Scholar] [CrossRef]
  7. Zhang, W.; Martin, M.J.; Benko, C.; Hall, J.L.; Ye, J.; Hagemann, C.; Legero, T.; Sterr, U.; Riehle, F.; Cole, G.D.; et al. Reduction of residual amplitude modulation to 1 × 10⁻⁶ for frequency modulation and laser stabilization. Opt. Lett. 2014, 39, 1980–1983. [Google Scholar] [CrossRef]
  8. Tai, Z.; Yan, L.; Zhang, Y.; Zhang, L.; Jiang, H.; Zhang, S. An electro-optic modulator with ultra-low residual amplitude modulation. Opt. Lett. 2016, 41, 5584–5587. [Google Scholar] [CrossRef]
  9. Li, C.; Shao, L.; Meng, H.; Wei, J.; Qiu, X.; He, Q.; Ma, W.; Deng, L.; Chen, Y. High-speed multi-pass tunable diode laser absorption spectrometer based on frequency-modulation spectroscopy. Opt. Express 2018, 26, 29330–29339. [Google Scholar] [CrossRef]
  10. Chen, J.; Du, Z.; Sun, T.; Li, J.; Ma, Y. Self-corrected frequency modulation spectroscopy immune to phase random and light intensity fluctuation. Opt. Express 2019, 27, 30700–30709. [Google Scholar] [CrossRef]
  11. Gagliardi, G.; Borri, S.; Tamassia, F.; Capasso, F.; Gmachl, C.; Sivco, D.L.; Baillargeon, J.N.; Hutchinson, A.L.; Cho, A.Y. A frequency-modulated quantum-cascade laser for spectroscopy of CH4and N2O isotopomers. Isot. Environ. Health Stud. 2005, 41, 313–321. [Google Scholar] [CrossRef] [PubMed]
  12. Stuhr, M.; Faßheber, N.; Friedrichs, G. Single-tone mid-infrared frequency modulation spectroscopy for sensitive detection of transient species. Opt. Express 2019, 27, 26499–26512. [Google Scholar] [CrossRef] [PubMed]
  13. Maddaloni, P.; Malara, P.; Gagliardi, G.; De Natale, P. Two-tone frequency modulation spectroscopy for ambient-air trace gas detection using a portable difference-frequency source around 3 μm. Appl. Phys. A 2006, 85, 219–222. [Google Scholar] [CrossRef]
  14. Hinkov, B.; Hayden, J.; Szedlak, R.; Pilat, F.; Martin-Mateos, P.; Jerez, B.; Aecdo, P.; Strasser, G.; Lendl, B. High Frequency Modulation Characteristics of Mid-Infrared Ring Quantum Cascade Lasers. In Proceedings of the 2019 Conference on Lasers and Electro-Optics Europe & European Quantum Electronics Conference (CLEO/Europe-EQEC), Munich, Germany, 23–27 June 2019. [Google Scholar] [CrossRef]
  15. Borri, S.; Bartalini, S.; De Natale, P.; Inguscio, M.; Gmachl, C.; Capasso, F.; Sivco, D.; Cho, A. Frequency modulation spectroscopy by means of quantum-cascade lasers. Appl. Phys. A 2006, 85, 223–229. [Google Scholar] [CrossRef]
  16. Eichholz, R.; Richter, H.; Wienold, M.; Schrottke, L.; Hey, R.; Grahn, H.T.; Hübers, H.-W. Frequency modulation spectroscopy with a THz quantum-cascade laser. Opt. Express 2013, 21, 32199–32206. [Google Scholar] [CrossRef] [PubMed] [Green Version]
  17. Goldenstein, C.S.; Mathews, G.C. Simulation technique enabling calibration-free frequency-modulation spectroscopy measurements of gas conditions and lineshapes with modulation frequencies spanning kHz to GHz. Appl. Opt. 2020, 59, 1491–1500. [Google Scholar] [CrossRef]
  18. Peng, C.; Chen, G.; Tang, J.; Wang, L.; Wen, Z.; Zhou, H.; Martini, R. High-Speed Mid-Infrared Frequency Modulation Spectroscopy Based on Quantum Cascade Laser. IEEE Photon- Technol. Lett. 2016, 28, 1727–1730. [Google Scholar] [CrossRef]
  19. Stuhr, M.; Hesse, S.; Friedrichs, G. Quantitative and Sensitive Mid-Infrared Frequency Modulation Detection of HCN behind Shock Waves. Fuels 2021, 2, 437–447. [Google Scholar] [CrossRef]
  20. Yao, C.; Xiao, L.; Gao, S.; Wang, Y.; Wang, P.; Kan, R.; Jin, W.; Ren, W. Sub-ppm CO detection in a sub-meter-long hollow-core negative curvature fiber using absorption spectroscopy at 2.3 μm. Sens. Actuators B Chem. 2019, 303, 127238. [Google Scholar] [CrossRef]
  21. Zhao, P.; Zhao, Y.; Bao, H.; Ho, H.L.; Jin, W.; Fan, S.; Gao, S.; Wang, Y.; Wang, P. Mode-phase-difference photothermal spectroscopy for gas detection with an anti-resonant hollow-core optical fiber. Nat. Commun. 2020, 11, 847. [Google Scholar] [CrossRef] [Green Version]
  22. Krzempek, K.; Jaworski, P.; Kozioł, P.; Belardi, W. Antiresonant hollow core fiber-assisted photothermal spectroscopy of nitric oxide at 5.26 μm with parts-per-billion sensitivity. Sensors Actuators B Chem. 2021, 345, 130374. [Google Scholar] [CrossRef]
  23. Hu, M.; Ventura, A.; Hayashi, J.G.; Poletti, F.; Yao, S.; Ren, W. Trace gas detection in a hollow-core antiresonant fiber with heterodyne phase-sensitive dispersion spectroscopy. Sensors Actuators B Chem. 2022, 363, 131774. [Google Scholar] [CrossRef]
  24. Jaworski, P.; Dudzik, G.; Sazio, P.J.; Belardi, W.; Krzempek, K. Laser-Based Nitric Oxide Detection at 5.26 Μm Using Antiresonant Hollow-Core Fiber. In Proceedings of the Optical Fiber Communication Conference, Washington, DC, USA, 6–11 June 2021; Volume 1, pp. 5–7. [Google Scholar]
  25. Jaworski, P.; Yu, F.; Bojęś, P.; Wu, D.; Kozioł, P.; Dudzik, G.; Abramski, K.; Liao, M.; Krzempek, K. Antiresonant Hollow-Core Fiber for Multiple Gas Detection in the Mid-IR. In Proceedings of the CLEO: Science and Innovations 2020, Washington, DC, USA, 10–15 May 2020. [Google Scholar] [CrossRef]
  26. Jaworski, P.; Kozioł, P.; Krzempek, K.; Wu, D.; Yu, F.; Bojęś, P.; Dudzik, G.; Liao, M.; Abramski, K.; Knight, J. Antiresonant Hollow-Core Fiber-Based Dual Gas Sensor for Detection of Methane and Carbon Dioxide in the Near- and Mid-Infrared Regions. Sensors 2020, 20, 3813. [Google Scholar] [CrossRef] [PubMed]
  27. Yao, C.; Hu, M.; Ventura, A.; Hayashi, J.G.; Poletti, F.; Ren, W. Tellurite Hollow-Core Antiresonant Fiber-Coupled Quantum Cascade Laser Absorption Spectroscopy. J. Light. Technol. 2021, 39, 5662–5668. [Google Scholar] [CrossRef]
  28. Yang, T.; Tian, C.; Chen, G.; Martini, R. Non-resonant optical modulation of quantum cascade laser and its application potential in infrared spectroscopy. In Novel In-Plane Semiconductor Lasers XIII; SPIE: Bellingham, WA, USA, 2014; pp. 214–223. [Google Scholar] [CrossRef]
Figure 1. Schematic of the experimental setup for the HC-ARF-coupled FMS system. PD: photodetector; QCL: quantum cascade laser; LPF: low-pass filter; DAQ: data acquisition card; M: mixer; S: power splitter; RFSG1, RFSG2: radio frequency signal generator; PM: pressure meter; GM: gas mixer. Inset (a): Photo of the gas cell enclosed with the fiber end.
Photonics 09 00935 g001
Figure 2. Comparison between DAS and FMS measurements of 100 ppm NO. (a) Calculated absorbance based on the Voigt fitting. The fitting residual is plotted in the bottom panel. (b) Representative FMS-1f signals under varied modulation depths. Inset: Variation of FMS-1f amplitude with modulation depth.
Photonics 09 00935 g002
Figure 3. Representative FMS-1f signals measured under varied modulation frequencies.
Photonics 09 00935 g003
Figure 4. (a) Variation of FMS-1f signal with NO concentration. (b) Relationship between the FMS-1f signal amplitude and NO concentration. (c) Response of the present sensor to NO concentrations with error bars.
Photonics 09 00935 g004
Figure 5. Allan-Werle deviation plot (in ppb) for a 20 min measurement of pure N2.
Photonics 09 00935 g005
Publisher’s Note: MDPI stays neutral with regard to jurisdictional claims in published maps and institutional affiliations.

