Hand-Held Optoacoustic System for the Localization of Mid-Depth Blood Vessels


Abstract
:1. Introduction
2. Methods
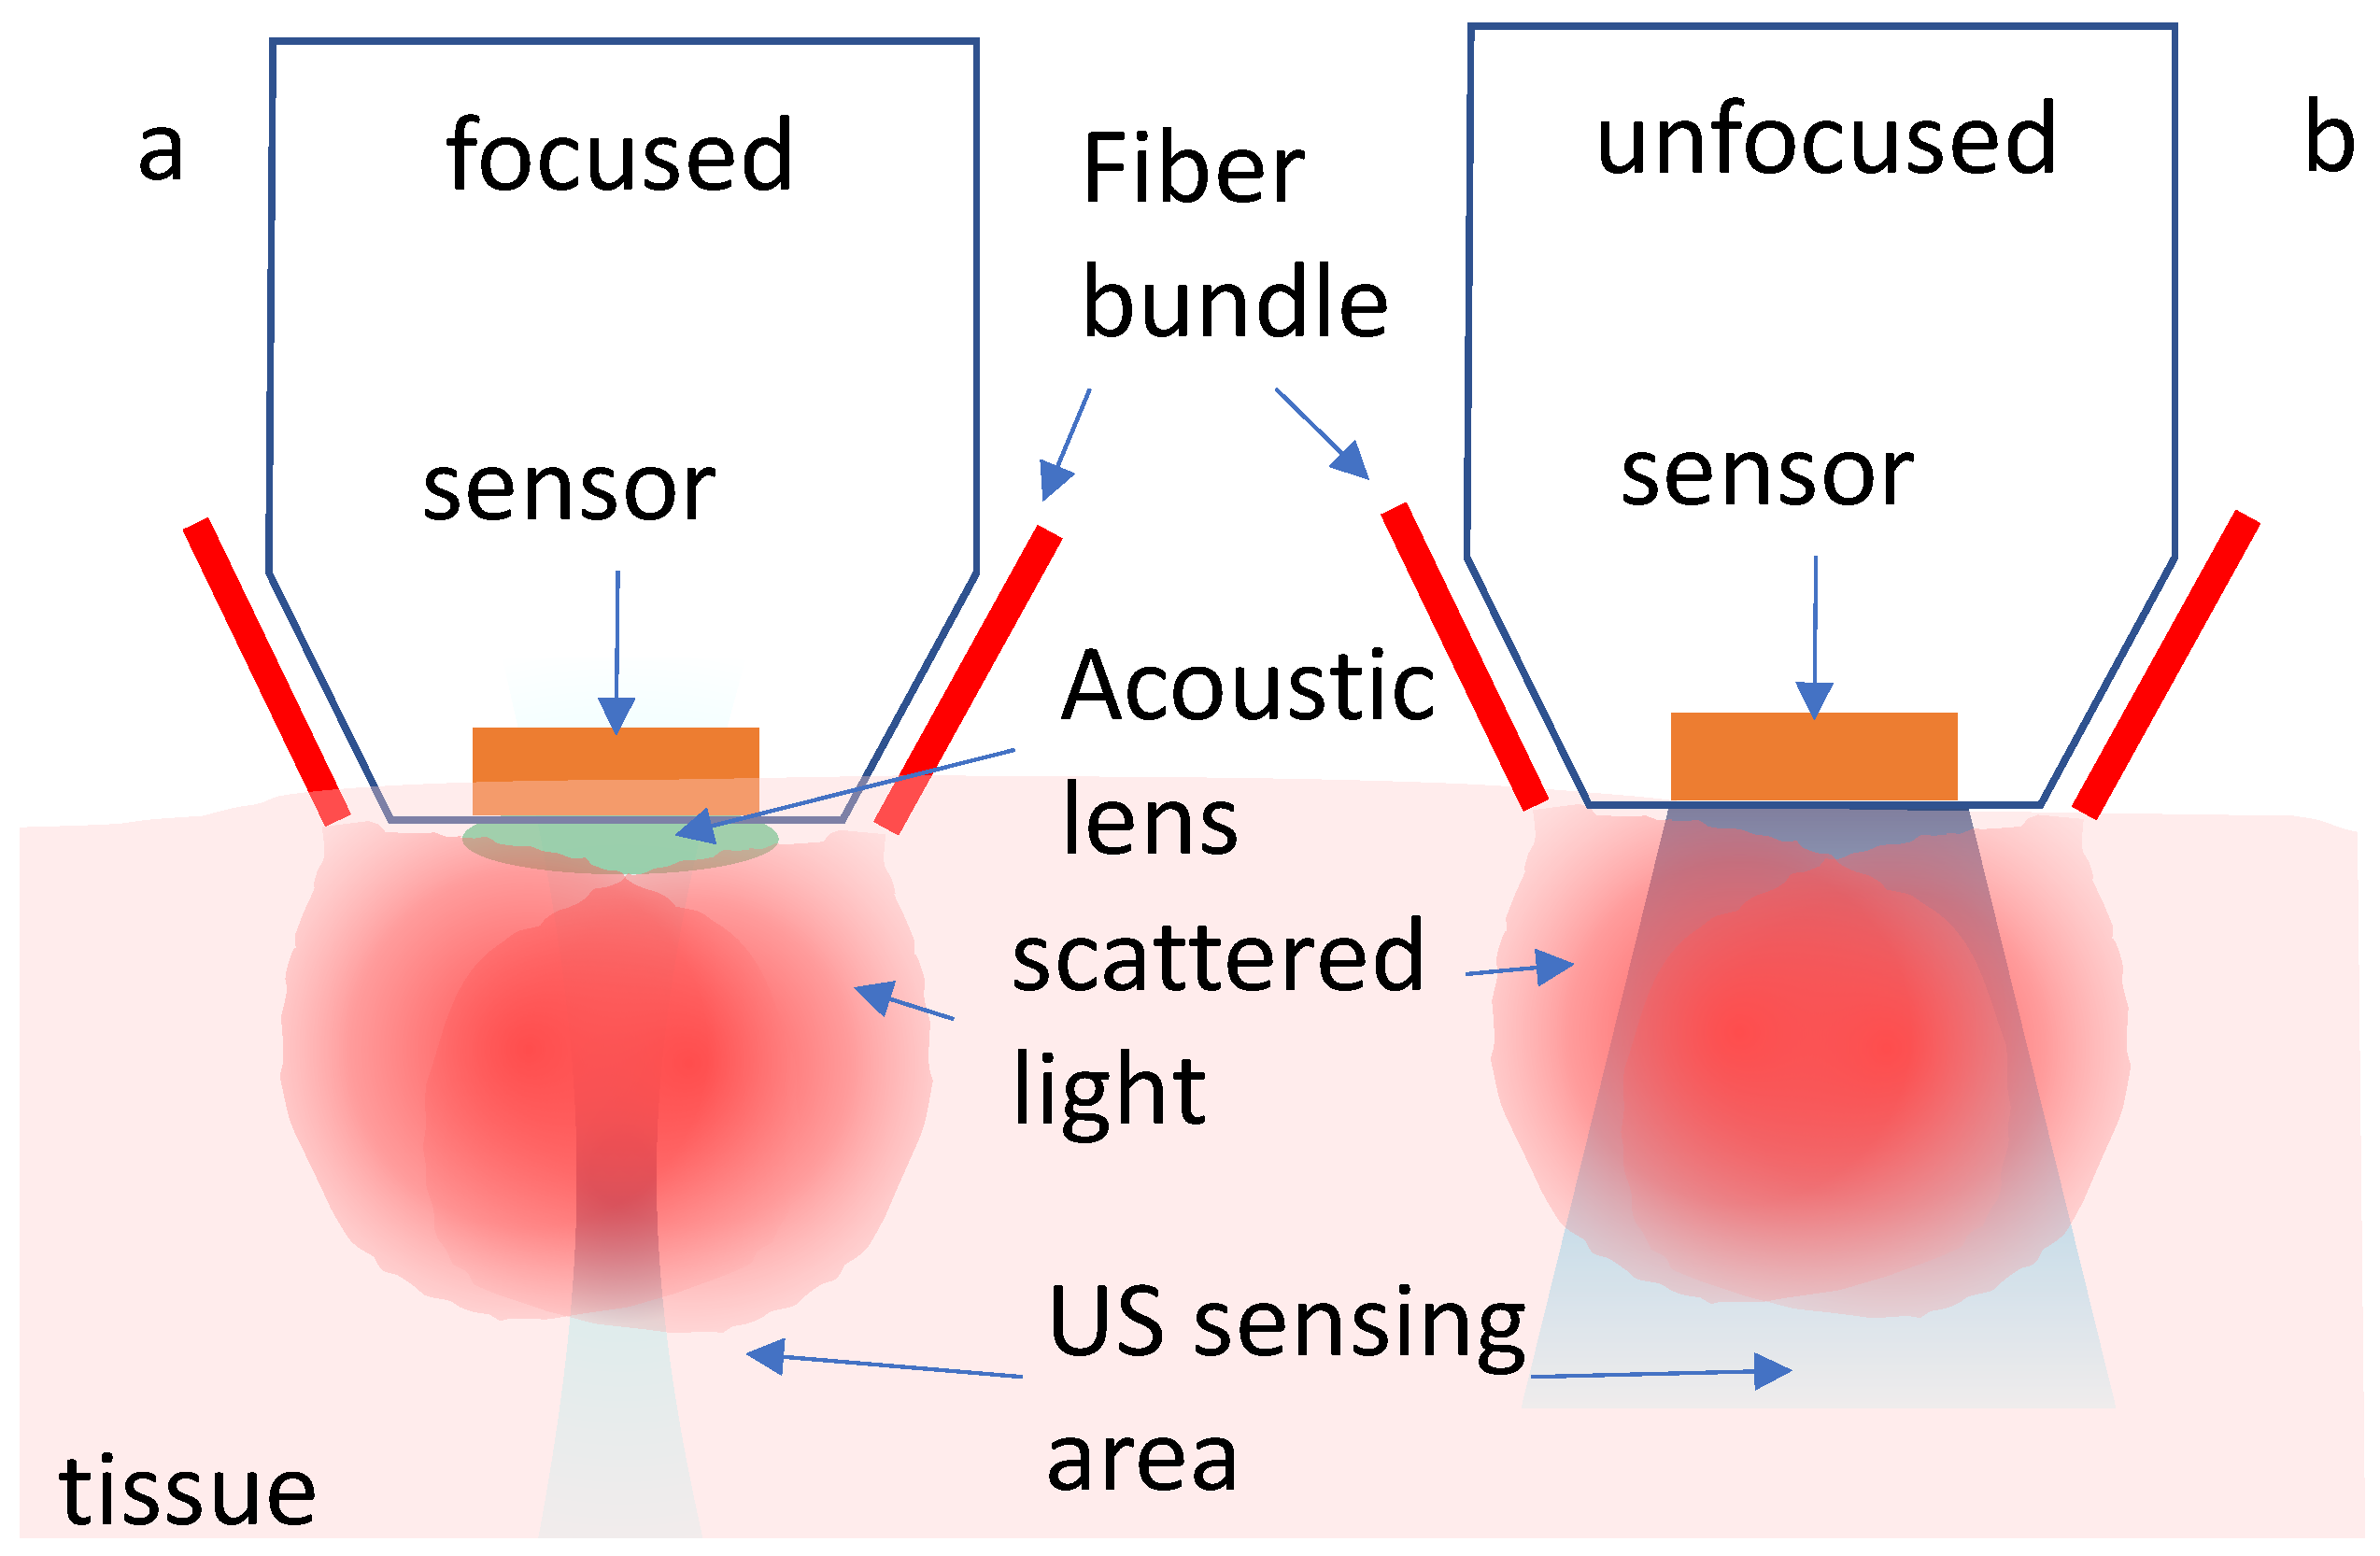
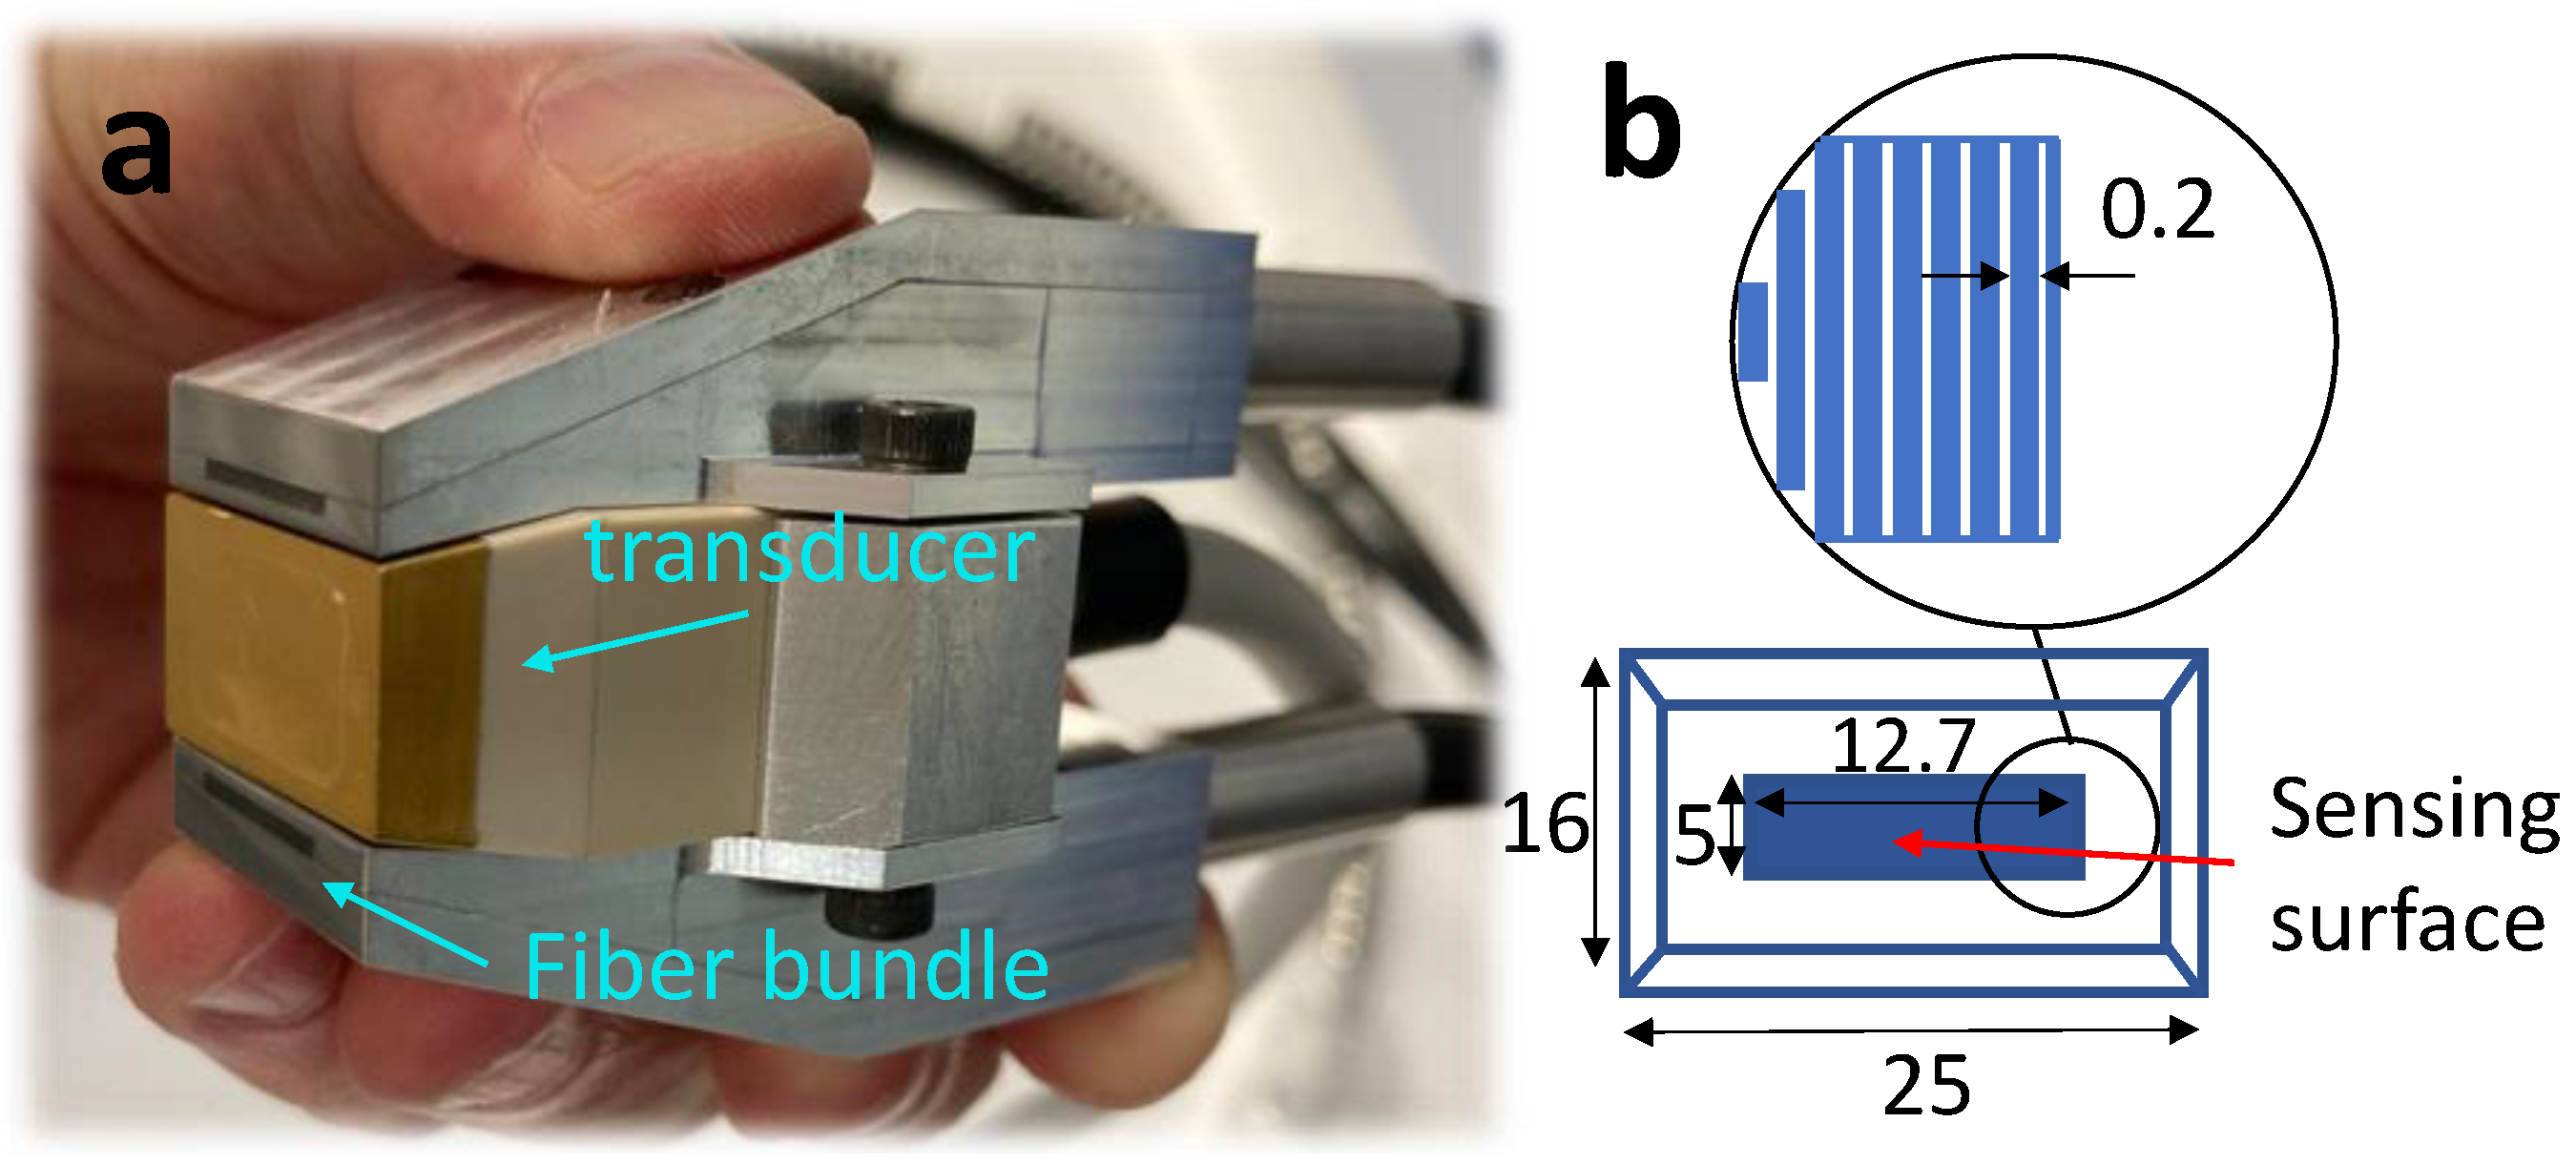
2.1. System Components
2.2. Image Reconstruction
3. Results
3.1. Characterization
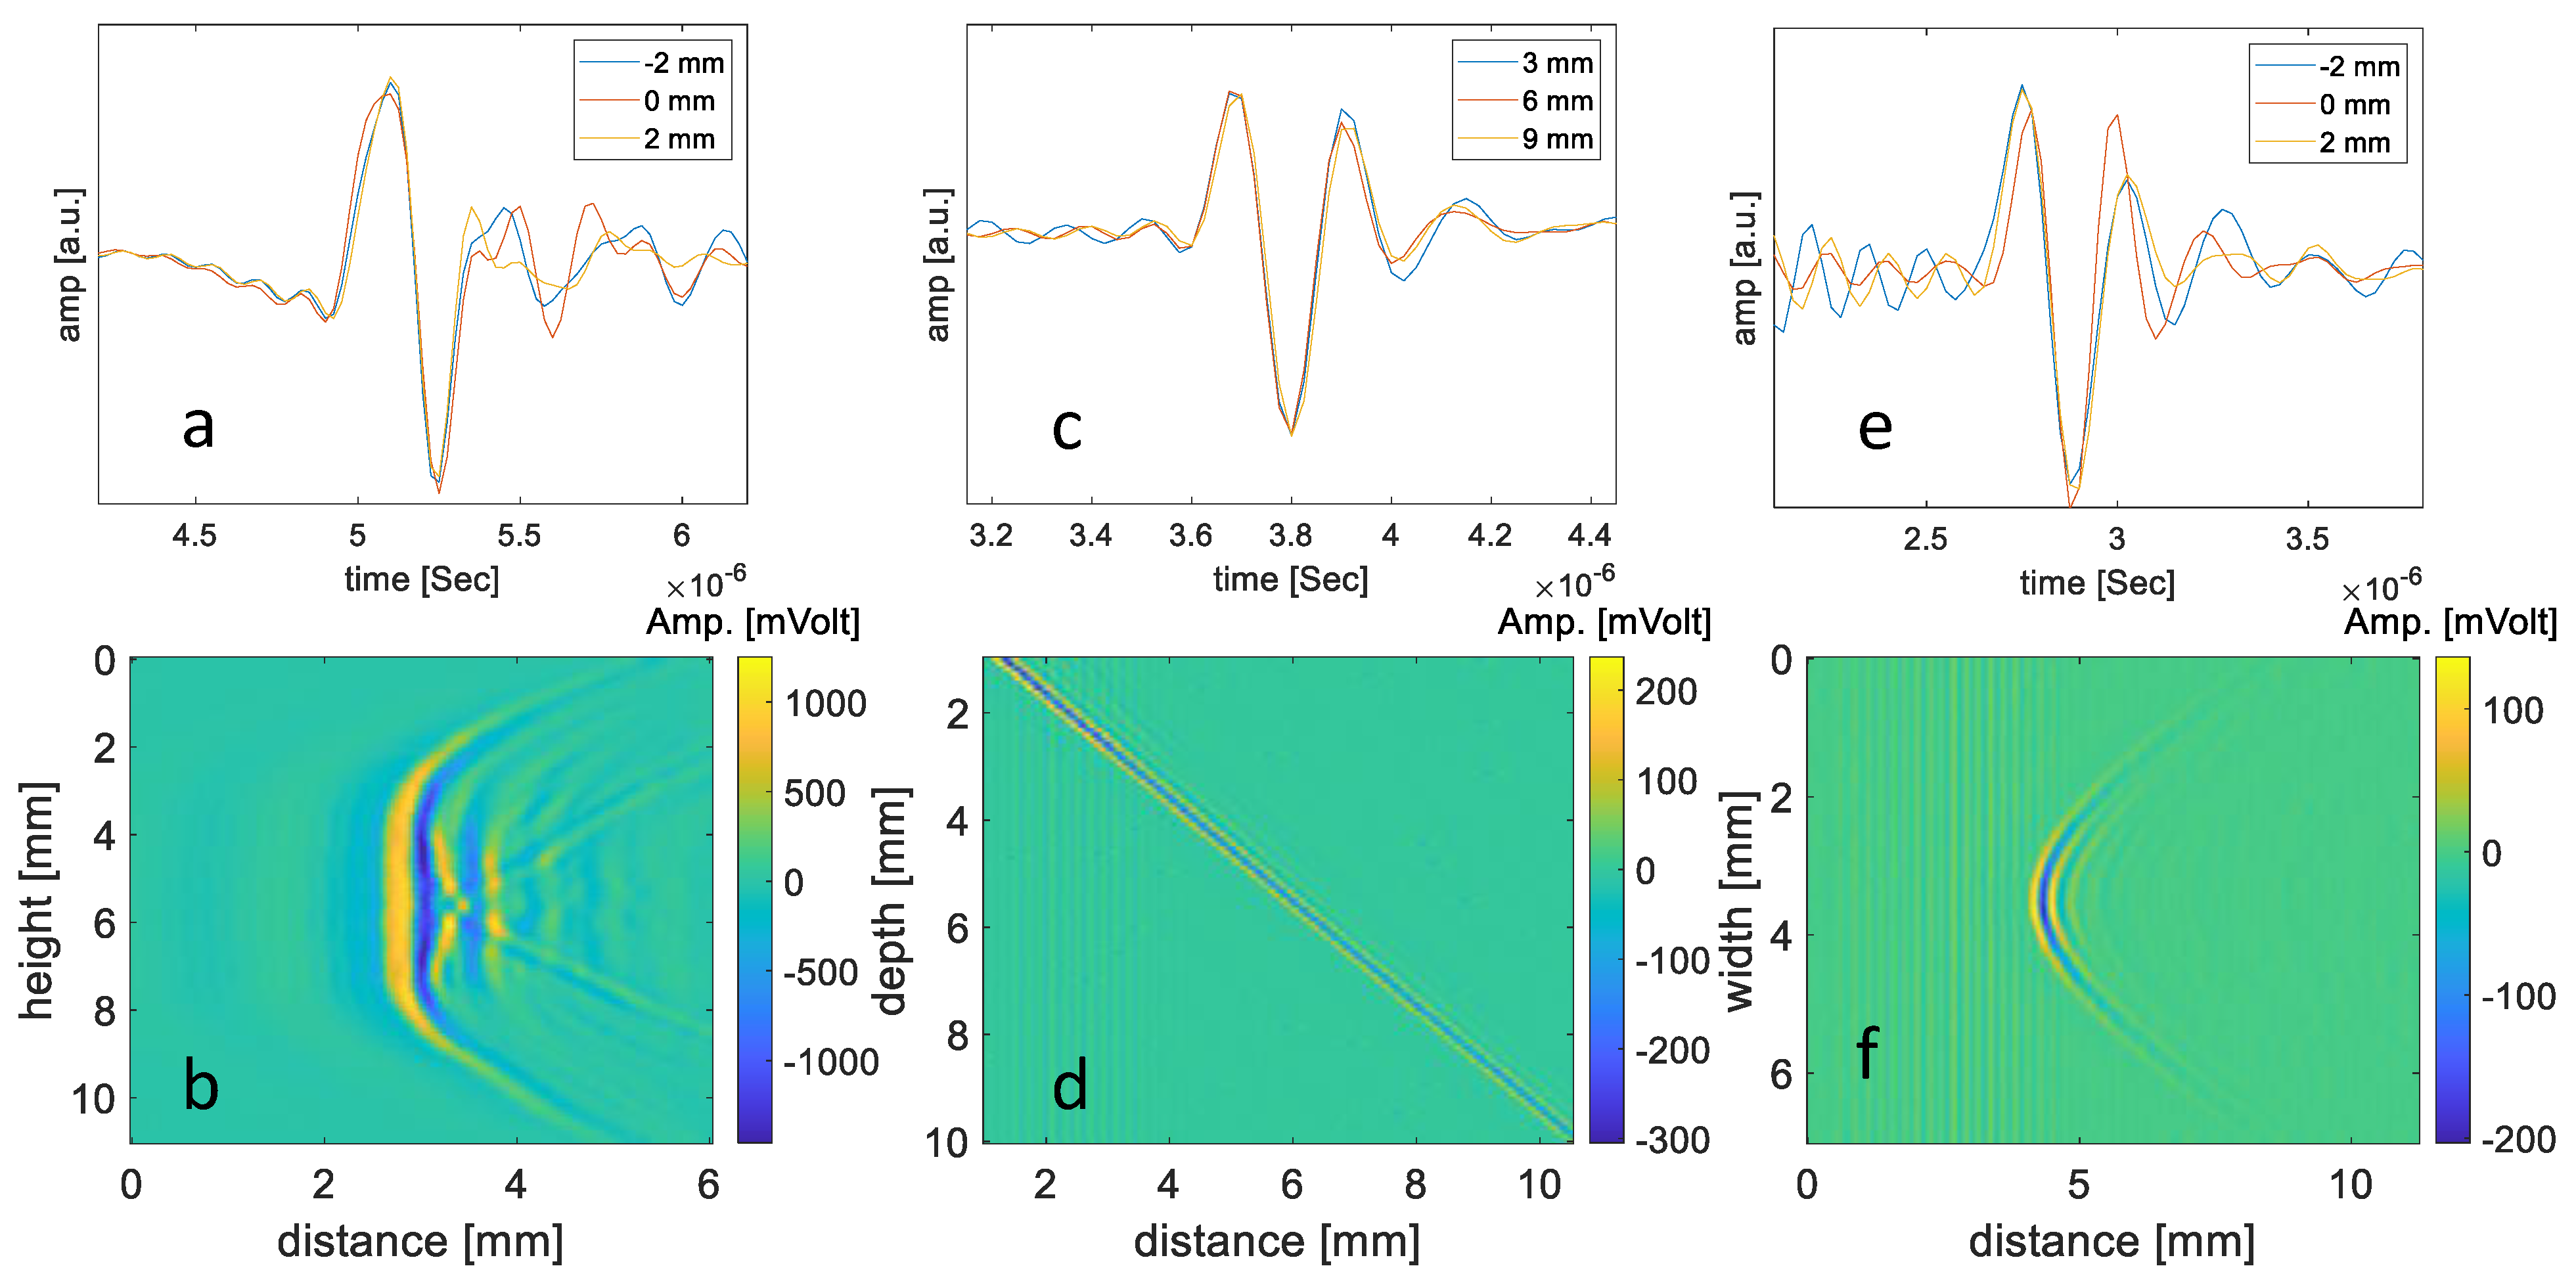
3.1.1. The Spatially Dependent Impulse Response of the Transducer
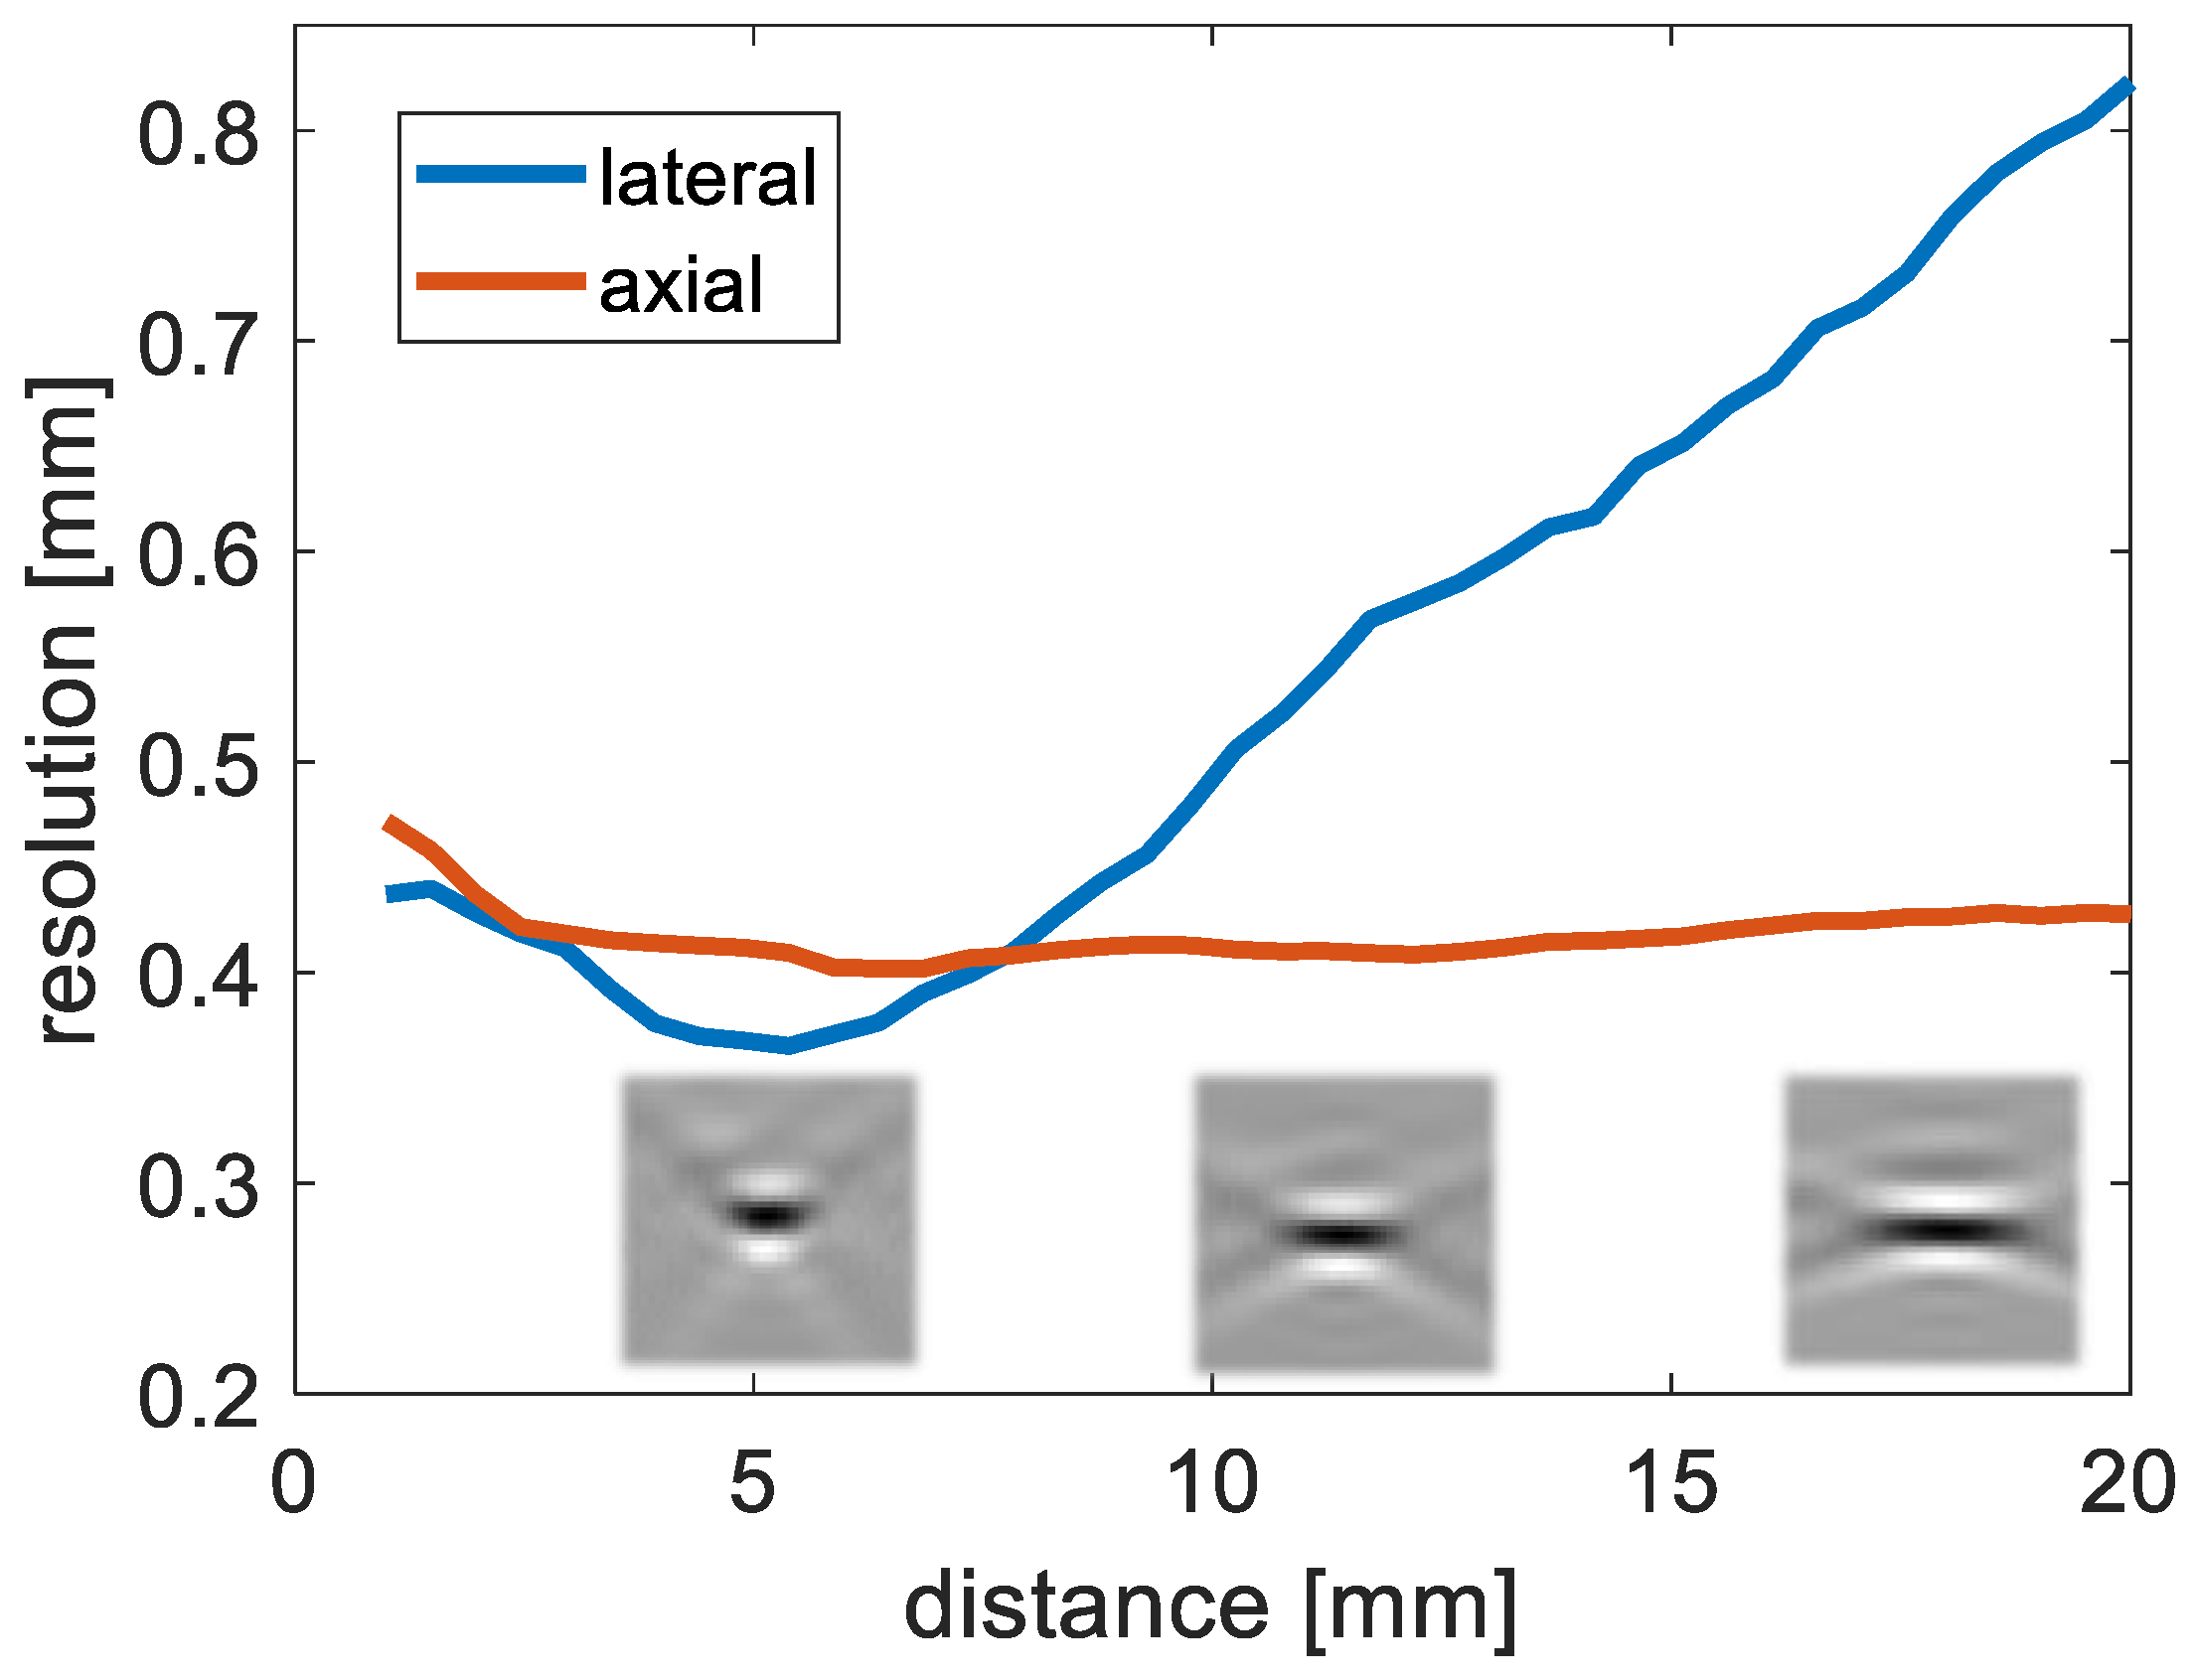
3.1.2. Resolution
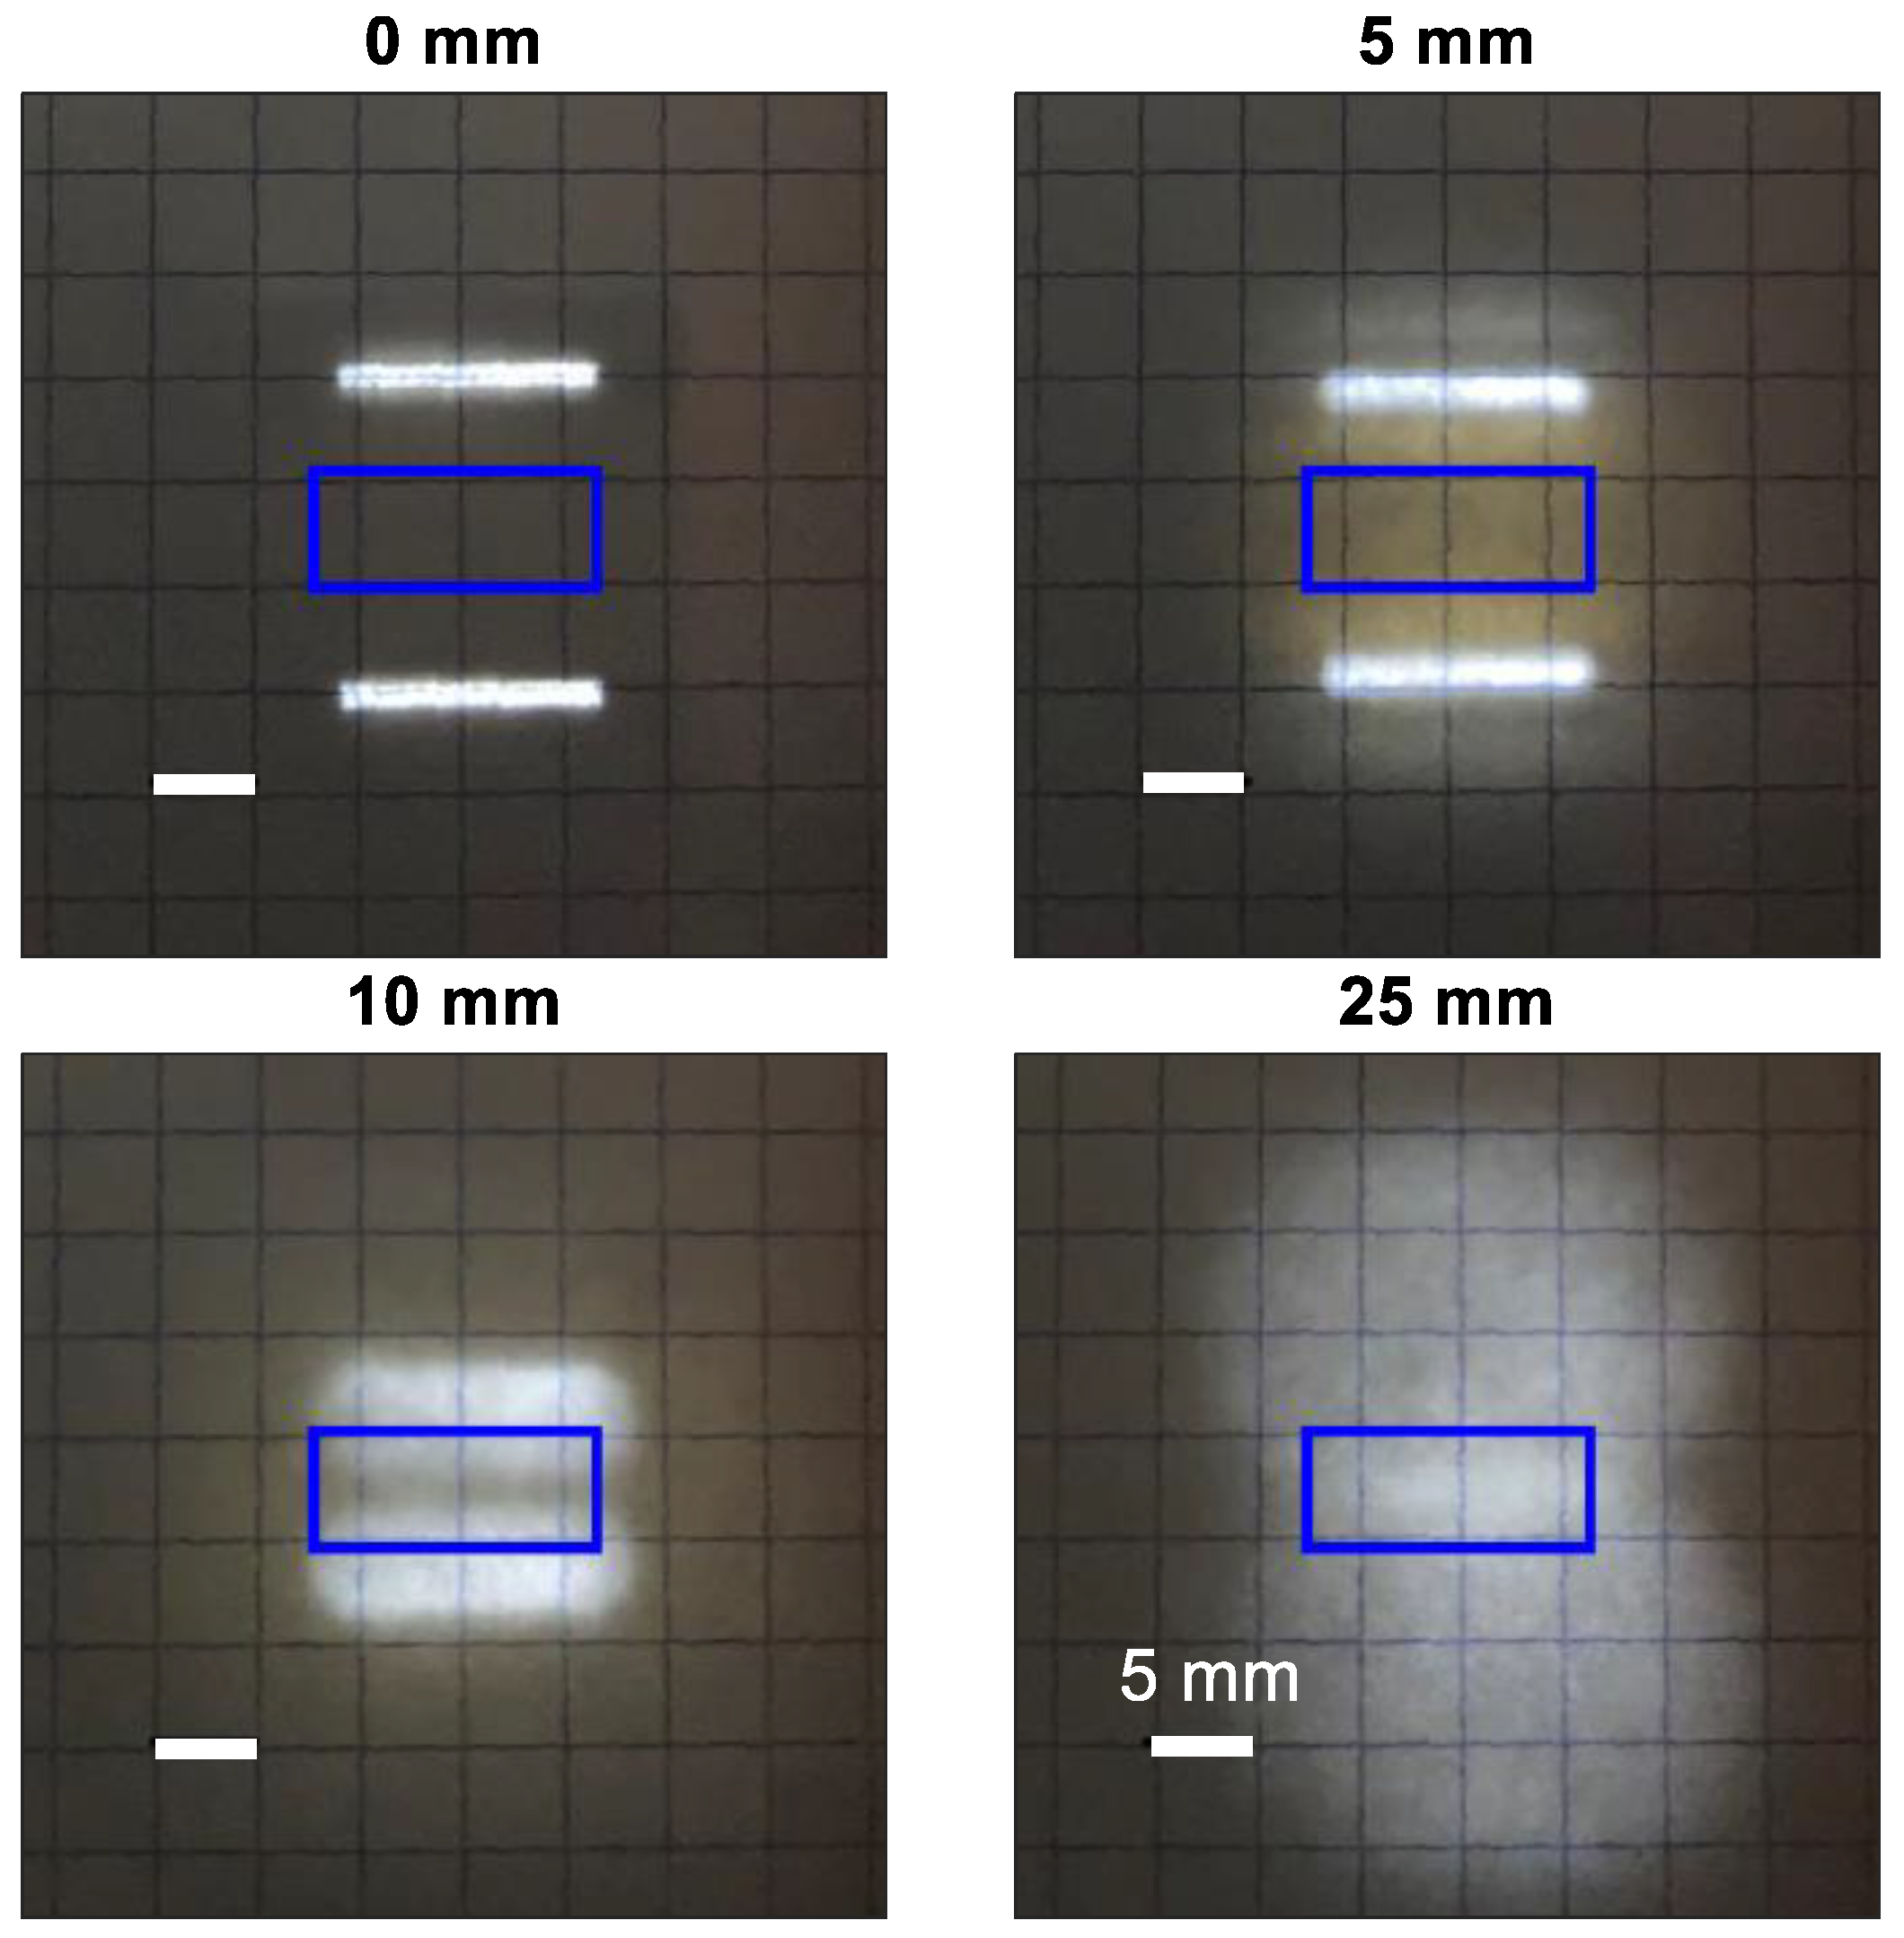
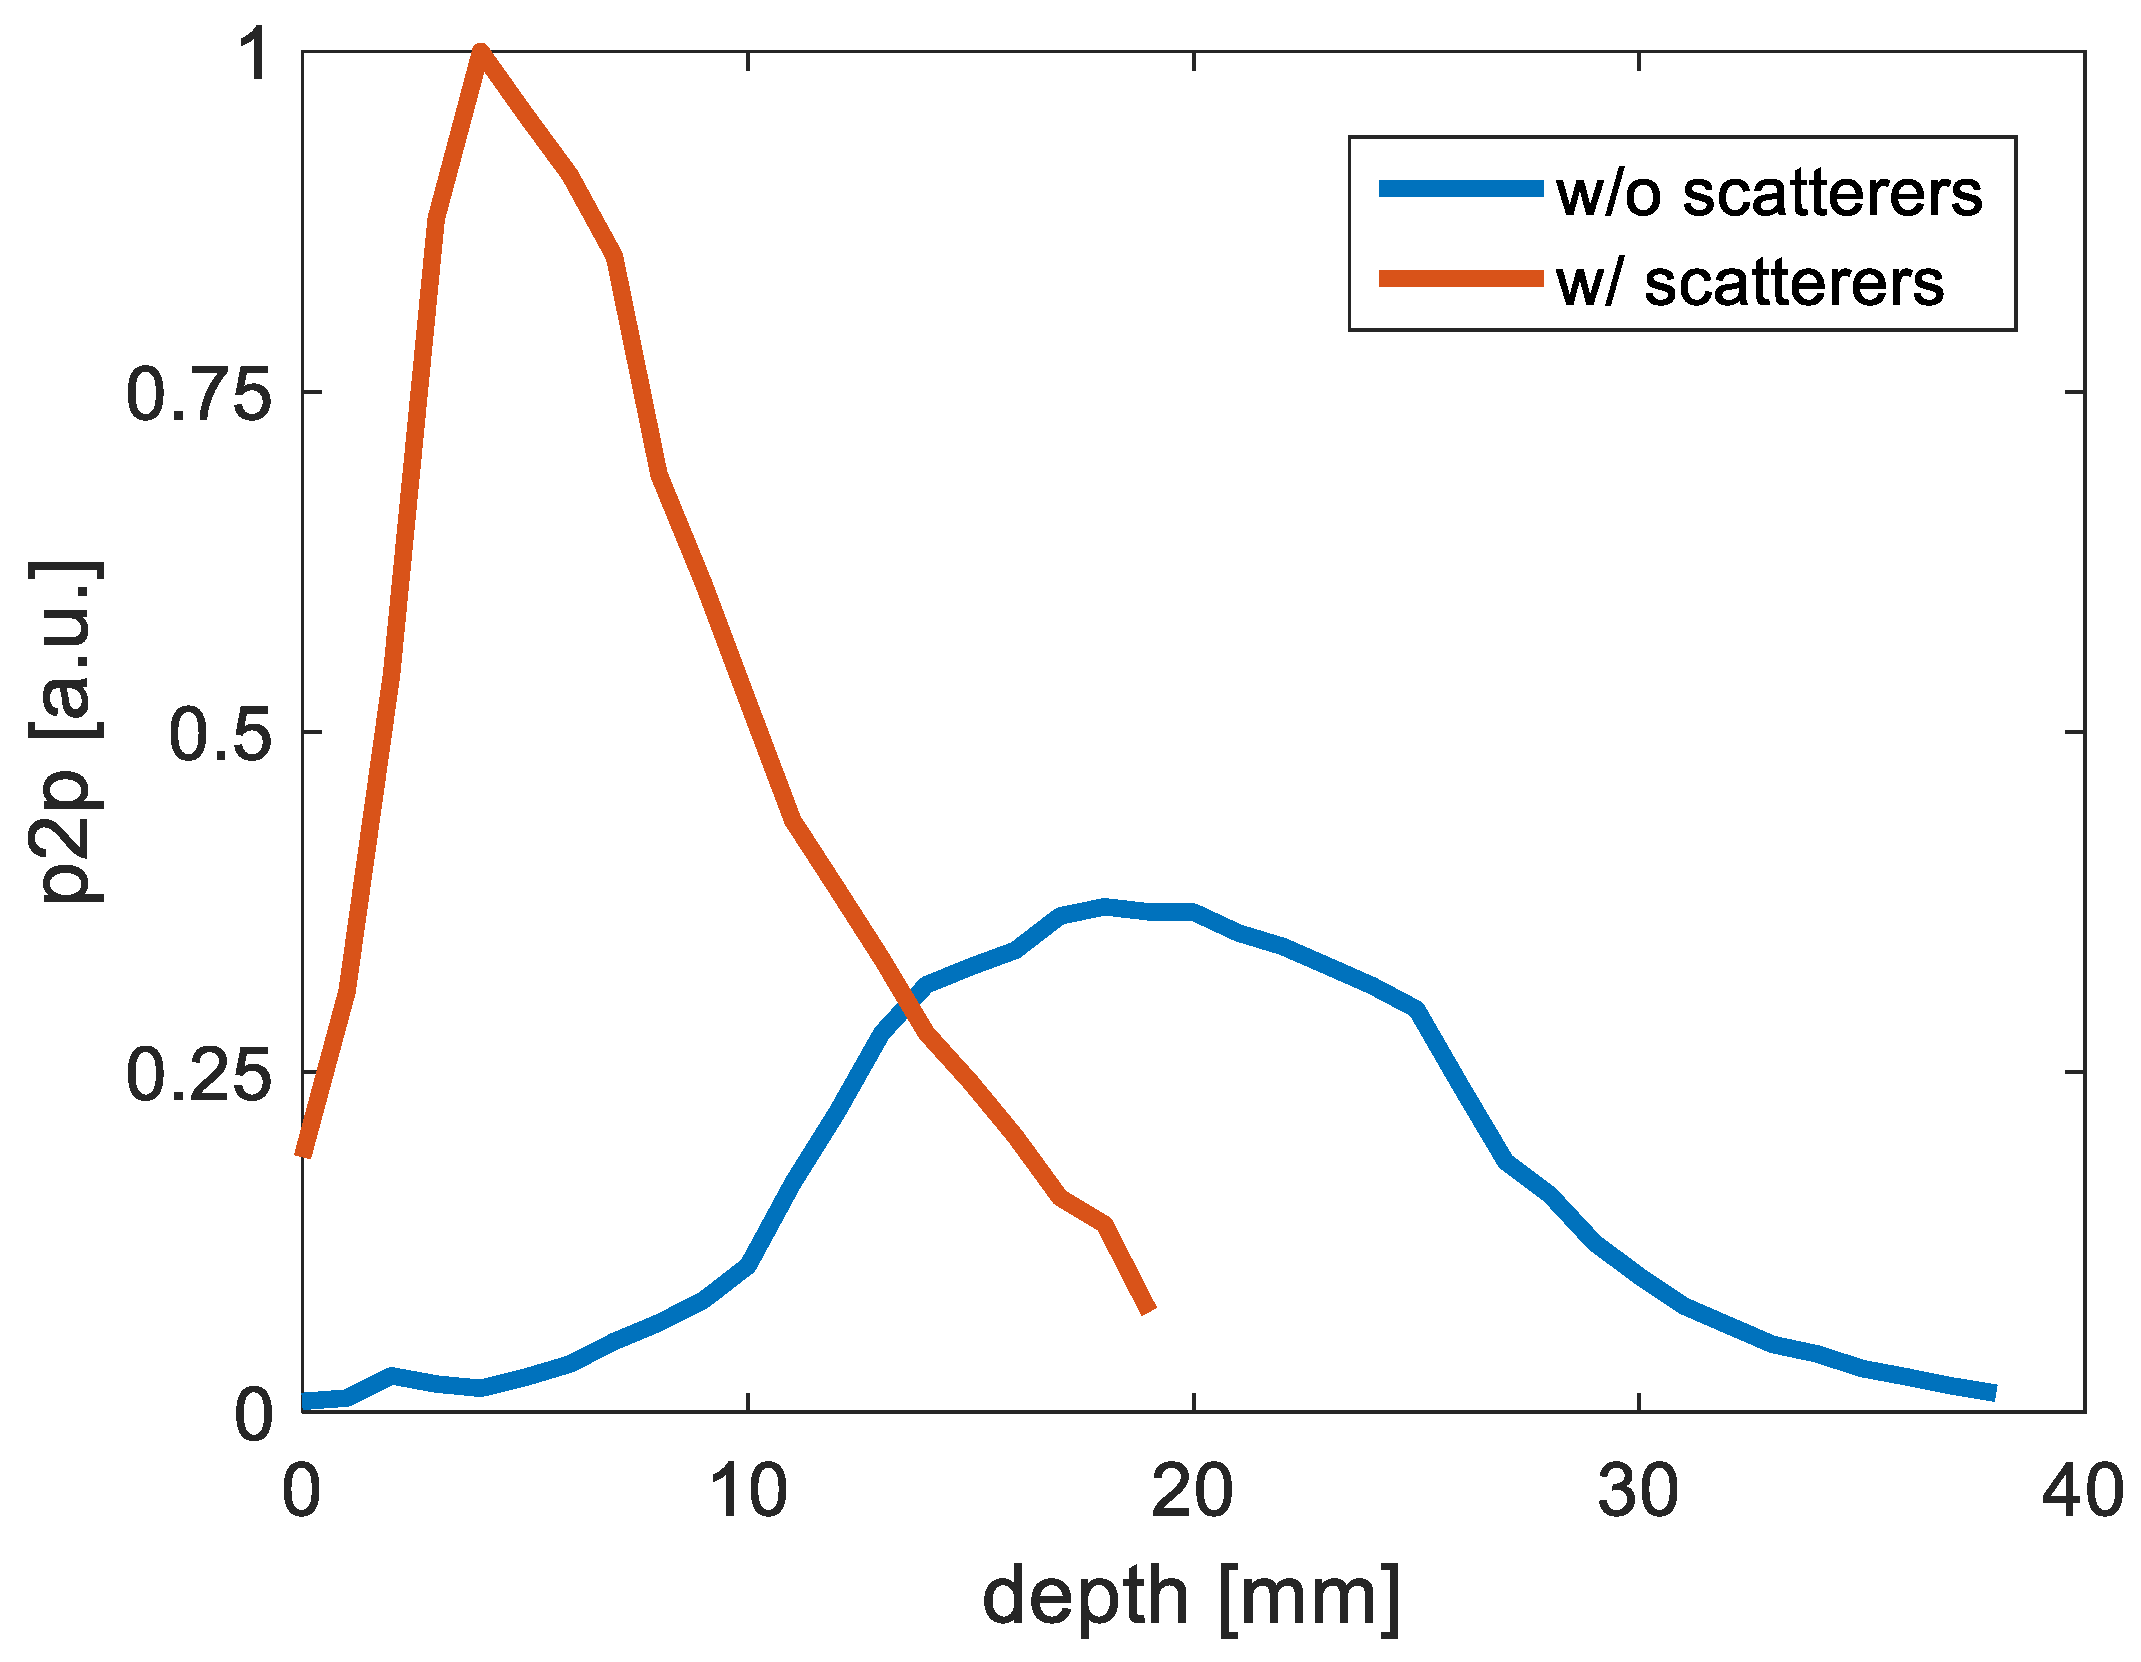
3.1.3. Illumination
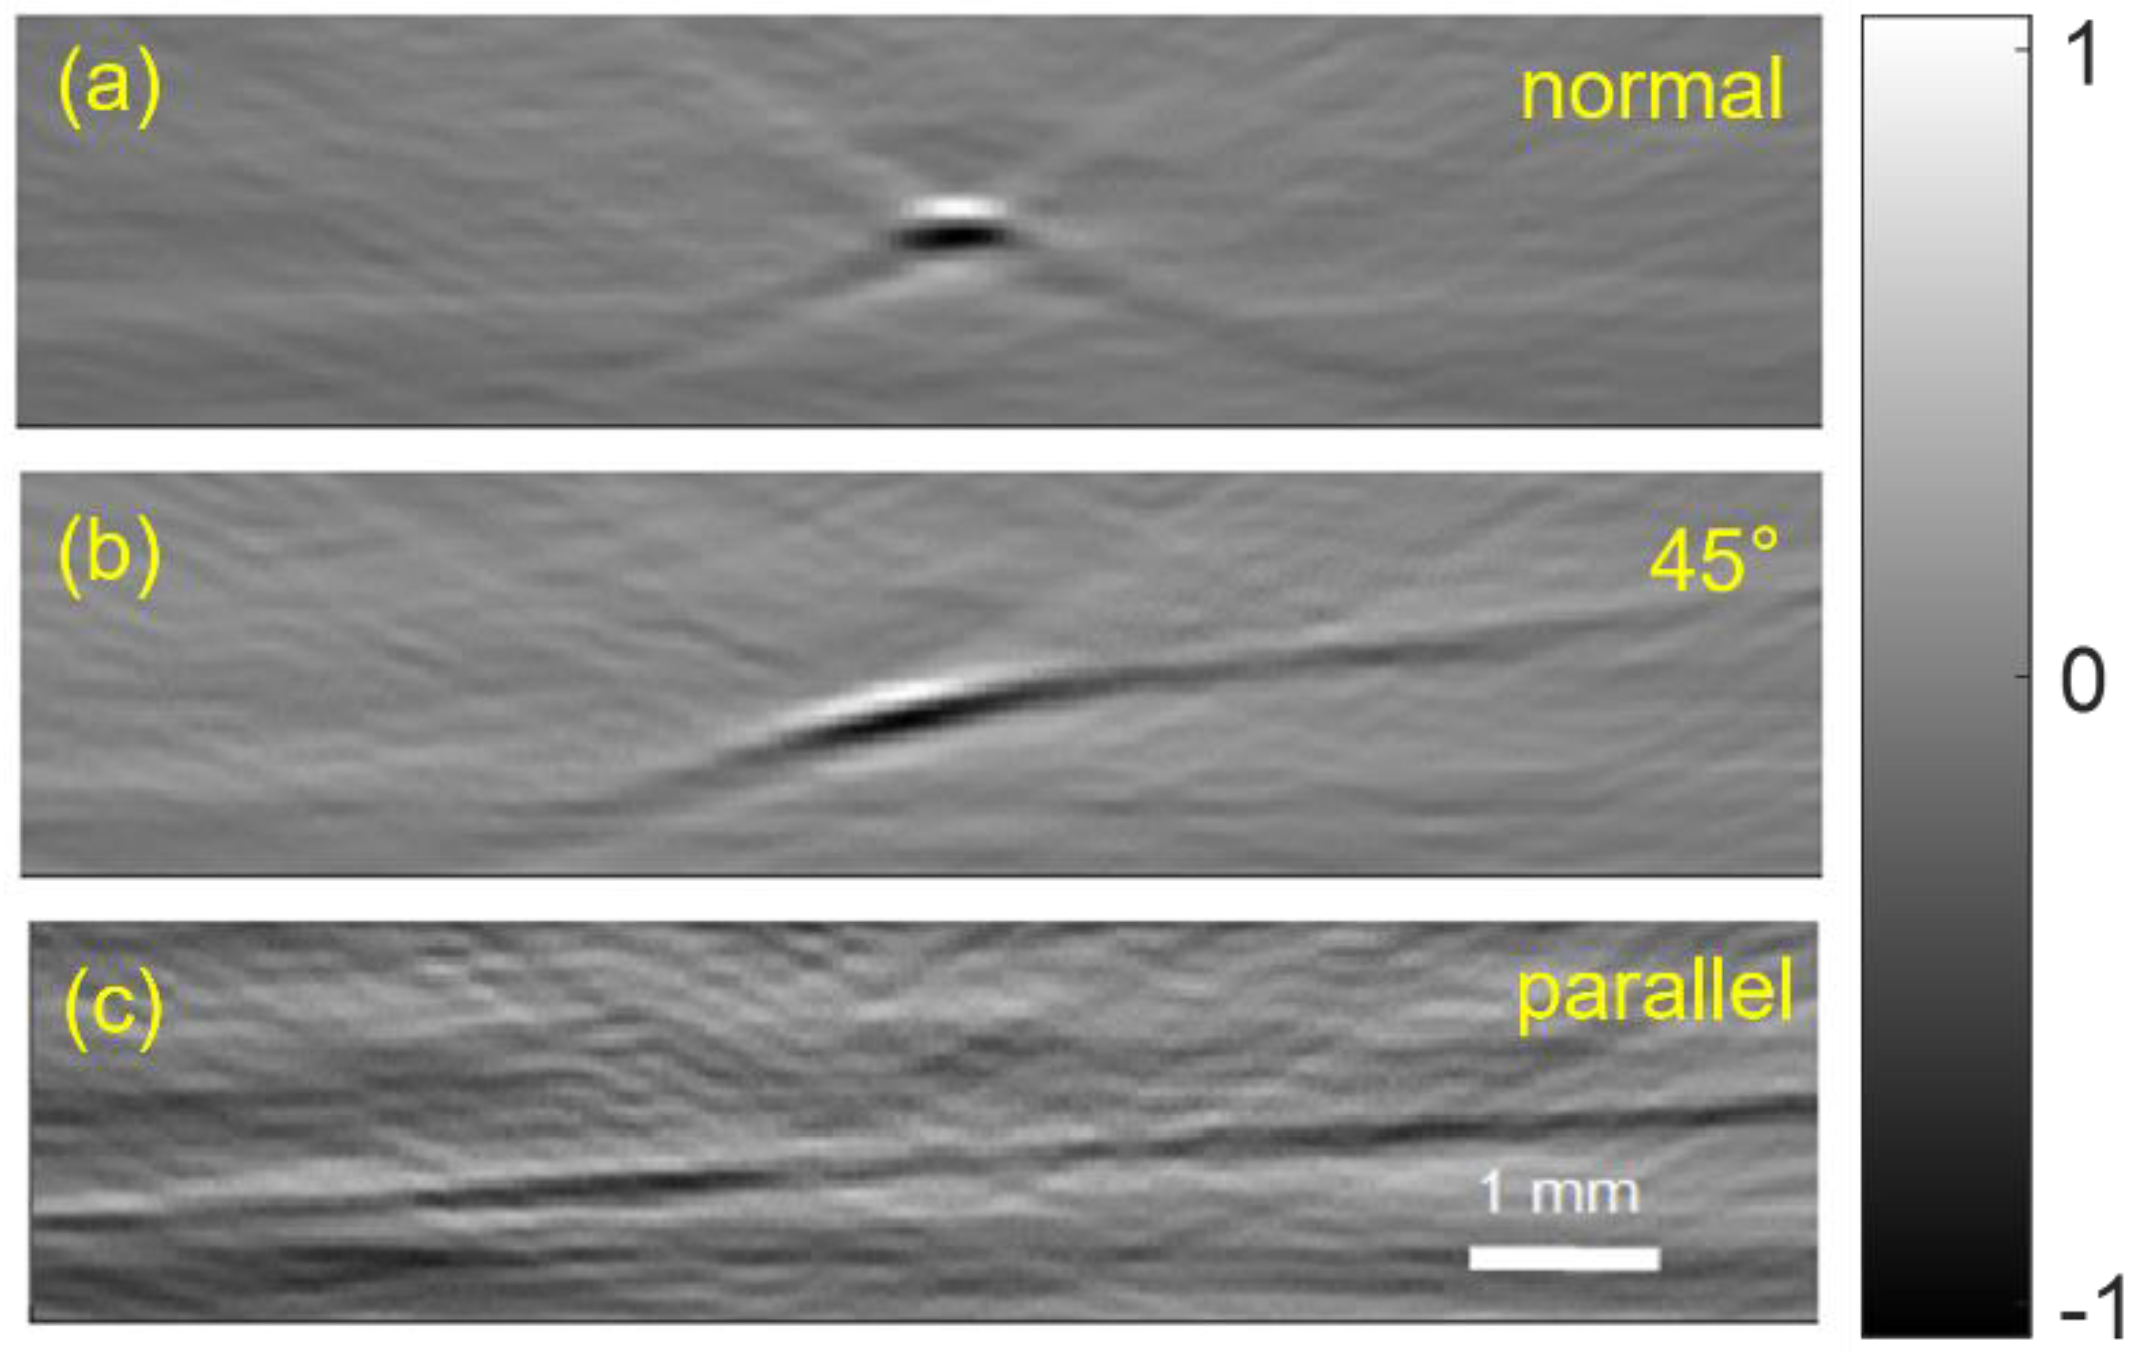
3.1.4. OAT Probe Imaging of a Wire
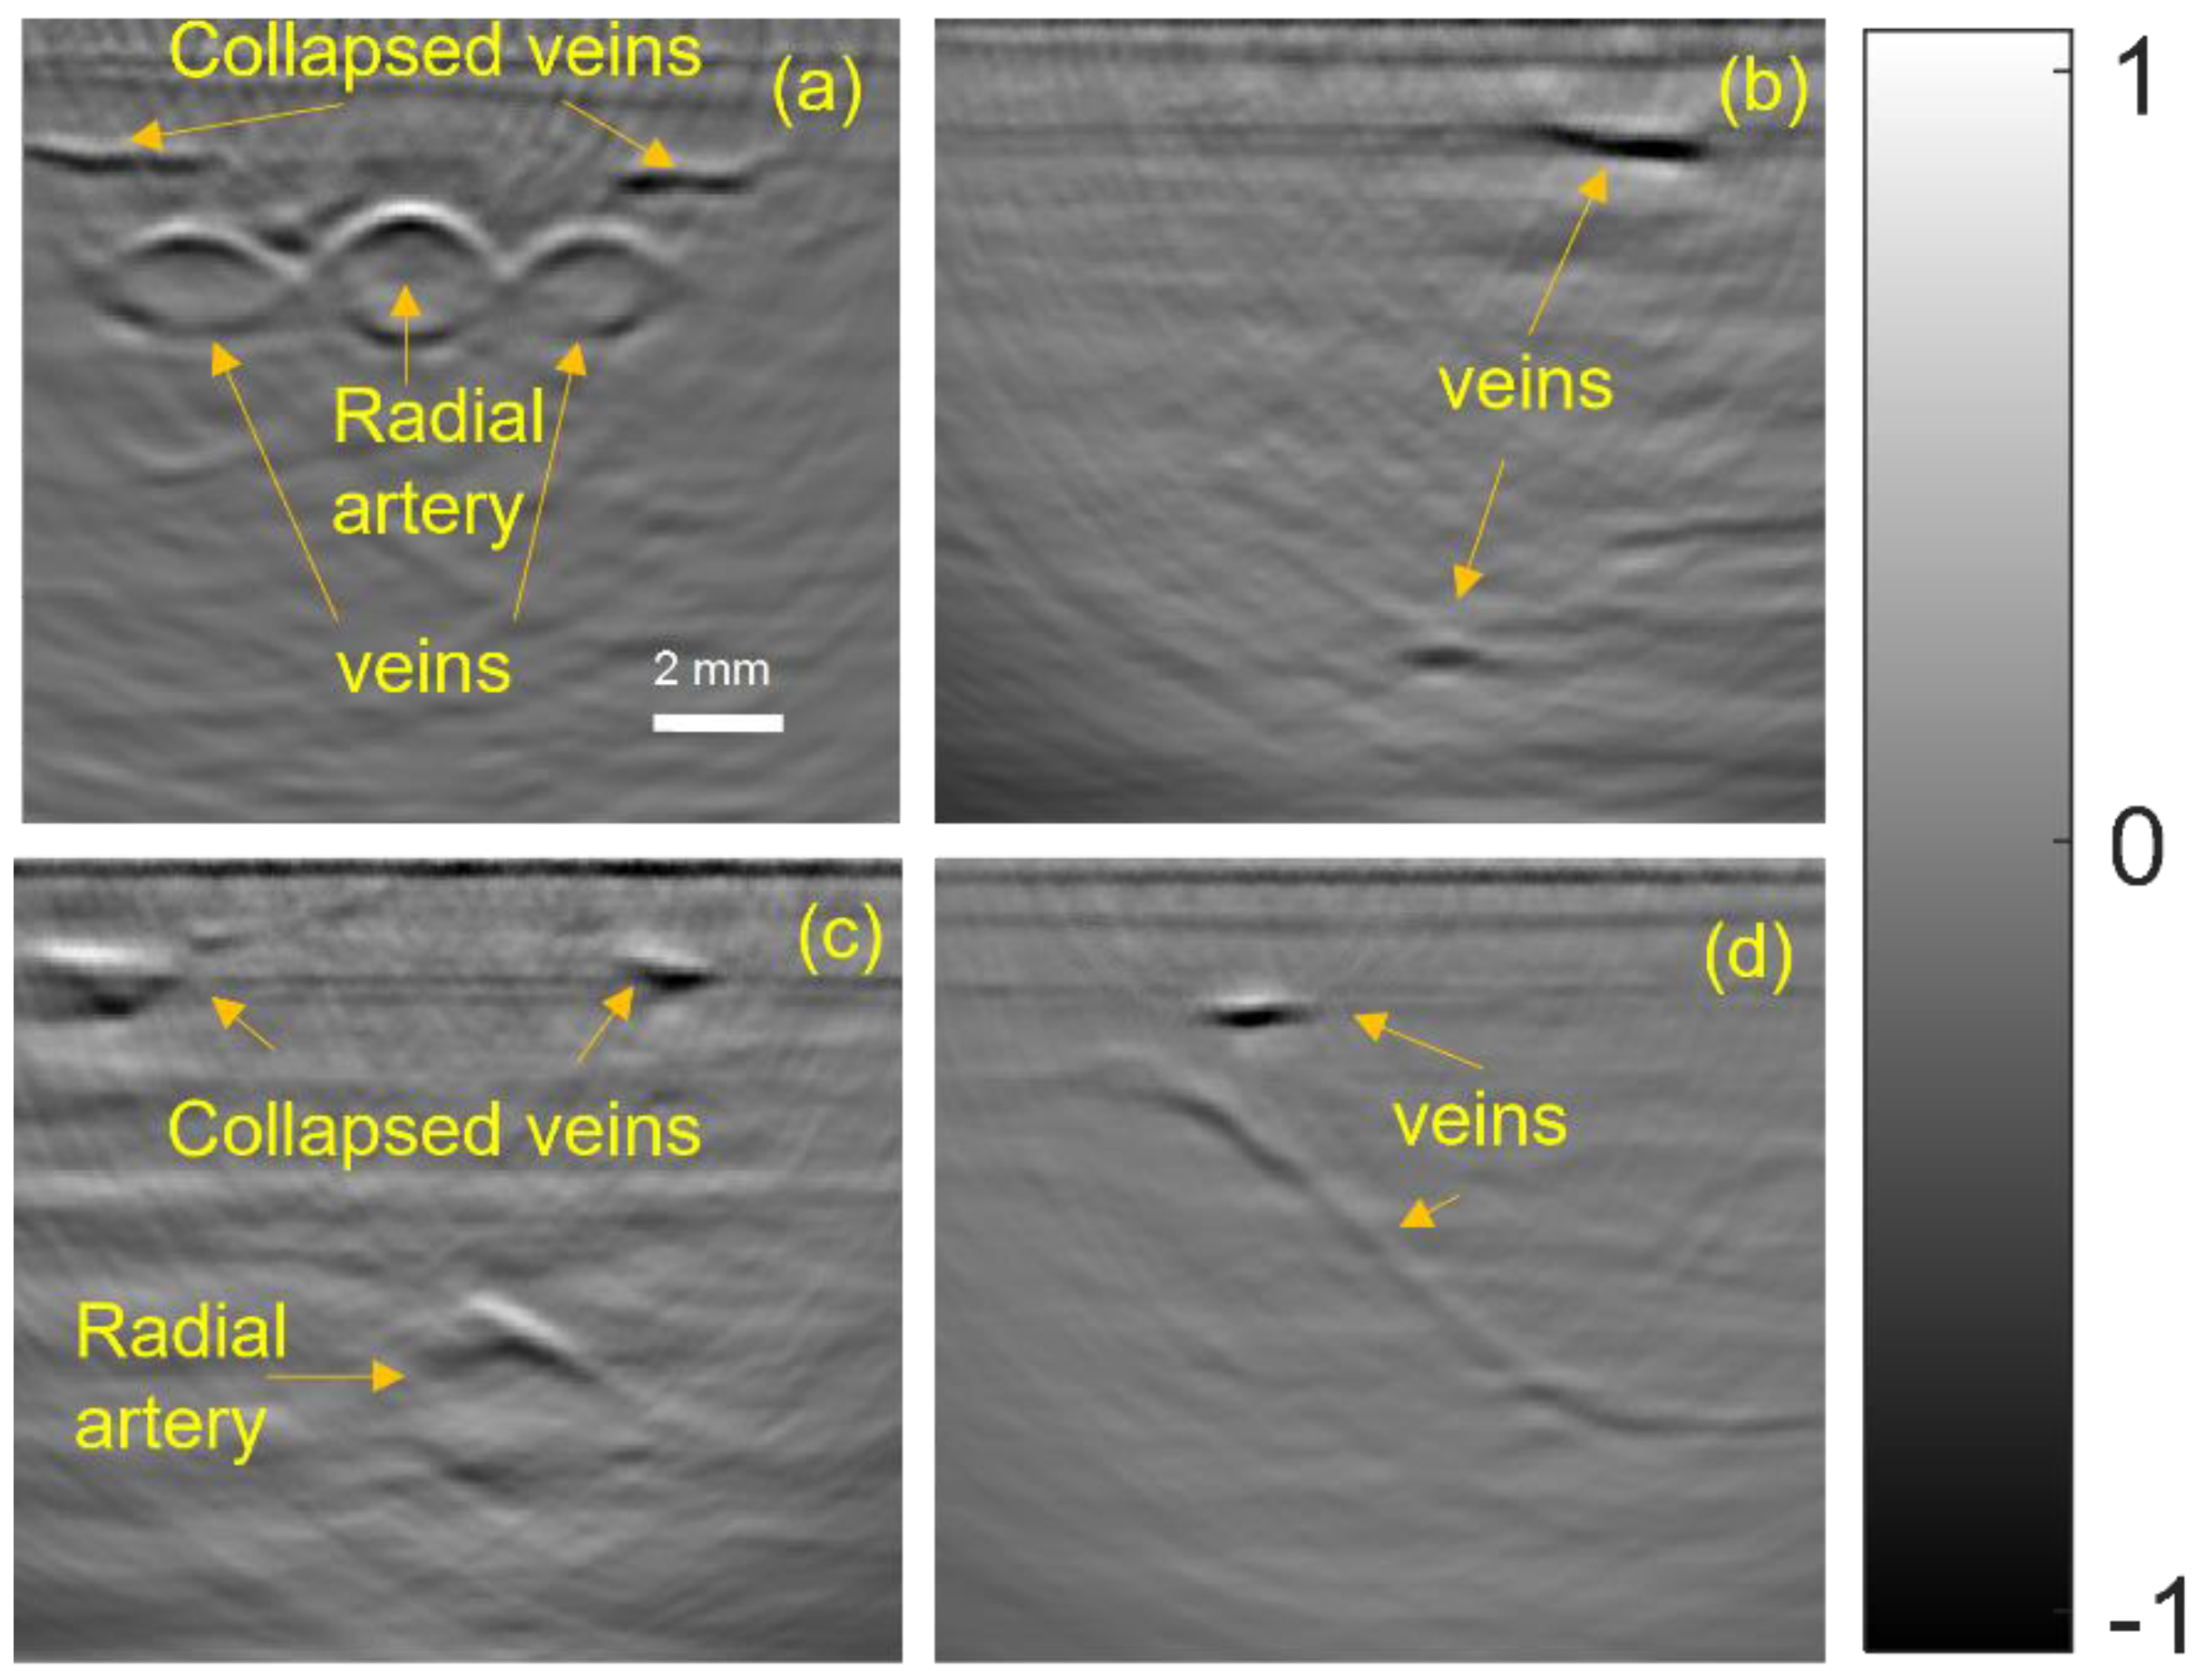
3.2. In Vivo Imaging of Peripheral Blood Vessels
4. Discussion and Conclusions
Supplementary Materials
Author Contributions
Funding
Informed Consent Statement
Data Availability Statement
Conflicts of Interest
Appendix A. Maximum Permissible Exposure (MPE) for Skin Exposure to a Laser Beam
- (1)
- Wavelength of ;
- (2)
- Repetition rate of 50 Hz;
- (3)
- Illumination area: arms = 0.225 .
References
- Seto, A.H.; Roberts, J.S.; Abu-Fadel, M.S.; Czak, S.J.; Latif, F.; Jain, S.P.; Raza, J.A.; Mangla, A.; Panagopoulos, G.; Patel, P.M.; et al. Real-Time Ultrasound Guidance Facilitates Transradial Access. JACC Cardiovasc. Interv. 2015, 8, 283–291. [Google Scholar] [CrossRef] [PubMed] [Green Version]
- Moussa Pacha, H.; Alahdab, F.; Al-khadra, Y.; Idris, A.; Rabbat, F.; Darmoch, F.; Soud, M.; Zaitoun, A.; Kaki, A.; Rao, S.V.; et al. Ultrasound-Guided versus Palpation-Guided Radial Artery Catheterization in Adult Population: A Systematic Review and Meta-Analysis of Randomized Controlled Trials. Am. Heart J. 2018, 204, 1–8. [Google Scholar] [CrossRef]
- Knipe, H.; Brideaux, A. Ultrasound-Guided Peripheral Intravenous Cannulation. In Radiopaedia.org; Radiopaedia Australia Pty Ltd.: Melbourne, Australia, 2016. [Google Scholar]
- Zhou, Y.; Liang, J.; Wang, L.V. Cuffing-Based Photoacoustic Flowmetry in Humans in the Optical Diffusive Regime. J. Biophotonics 2016, 9, 208–212. [Google Scholar] [CrossRef] [Green Version]
- Khalil, M.A.; Kim, H.K.; Kim, I.-K.; Flexman, M.; Dayal, R.; Shrikhande, G.; Hielscher, A.H. Dynamic Diffuse Optical Tomography Imaging of Peripheral Arterial Disease. Biomed. Opt. Express 2012, 3, 2288. [Google Scholar] [CrossRef] [PubMed] [Green Version]
- Schellenberg, M.W.; Hunt, H.K. Hand-Held Optoacoustic Imaging: A Review. Photoacoustics 2018, 11, 14–27. [Google Scholar] [CrossRef] [PubMed]
- Niederhauser, J.J.; Jaeger, M.; Lemor, R.; Weber, P.; Frenz, M. Combined Ultrasound and Optoacoustic System for Real-Time High-Contrast Vascular Imaging in Vivo. IEEE Trans. Med. Imaging 2005, 24, 436–440. [Google Scholar] [CrossRef]
- Taruttis, A.; Timmermans, A.C.; Wouters, P.C.; Kacprowicz, M.; van Dam, G.M.; Ntziachristos, V. Optoacoustic Imaging of Human Vasculature: Feasibility by Using a Handheld Probe. Radiology 2016, 281, 256–263. [Google Scholar] [CrossRef] [PubMed] [Green Version]
- Ntziachristos, V. Going Deeper than Microscopy: The Optical Imaging Frontier in Biology. Nat. Methods 2010, 7, 603–614. [Google Scholar] [CrossRef] [PubMed]
- Xu, M.; Wang, L.V. Photoacoustic Imaging in Biomedicine. Rev. Sci. Instrum. 2006, 77, 041101. [Google Scholar] [CrossRef] [Green Version]
- Sordillo, L.A.; Pu, Y.; Pratavieira, S.; Budansky, Y.; Alfano, R.R. Deep Optical Imaging of Tissue Using the Second and Third Near-Infrared Spectral Windows. J. Biomed. Opt. 2014, 19, 056004. [Google Scholar] [CrossRef] [PubMed]
- Bai, Y.; Cong, B.; Gong, X.; Song, L.; Liu, C. Compact and Low-Cost Handheld Quasibright-Field Linear-Array Probe Design in Photoacoustic Computed Tomography. J. Biomed. Opt. 2018, 23, 121606. [Google Scholar] [CrossRef]
- Fronheiser, M.P.; Ermilov, S.A.; Brecht, H.-P.; Conjusteau, A.; Su, R.; Mehta, K.; Oraevsky, A.A. Real-Time Optoacoustic Monitoring and Three-Dimensional Mapping of a Human Arm Vasculature. J. Biomed. Opt. 2010, 15, 021305. [Google Scholar] [CrossRef] [PubMed] [Green Version]
- Wray, P.; Lin, L.; Hu, P.; Wang, L.V. Photoacoustic Computed Tomography of Human Extremities. J. Biomed. Opt. 2019, 24, 026003. [Google Scholar] [CrossRef] [PubMed]
- Zhang, Y.; Wang, L. Video-Rate Ring-Array Ultrasound and Photoacoustic Tomography. IEEE Trans. Med. Imaging 2020, 39, 4369–4375. [Google Scholar] [CrossRef] [PubMed]
- Ermilov, S.A.; Khamapirad, T.; Conjusteau, A.; Leonard, M.H.; Lacewell, R.; Mehta, K.; Miller, T.; Oraevsky, A.A. Laser Optoacoustic Imaging System for Detection of Breast Cancer. J. Biomed. Opt. 2009, 14, 024007. [Google Scholar] [CrossRef] [PubMed]
- van Es, P.; Biswas, S.K.; Moens, H.J.B.; Steenbergen, W.; Manohar, S. Initial Results of Finger Imaging Using Photoacoustic Computed Tomography. J. Biomed. Opt. 2014, 19, 060501. [Google Scholar] [CrossRef] [Green Version]
- Zhao, L.; Yang, M.; Jiang, Y.; Li, C. Optical Fluence Compensation for Handheld Photoacoustic Probe: An in Vivo Human Study Case. J. Innov. Opt. Health Sci. 2017, 10, 1740002. [Google Scholar] [CrossRef] [Green Version]
- Xu, M.; Wang, L.V. Universal Back-Projection Algorithm for Photoacoustic Computed Tomography. Phys. Rev. E 2005, 71, 016706. [Google Scholar] [CrossRef] [PubMed] [Green Version]
- Xu, C. Development and Characterization of Tissue-Mimicking Phantom Materials for Photoacoustic Imaging; Lund University: Lund, Sweden, 2019. [Google Scholar]
- Seno Medical, Imagio. Available online: https://experienceimagio.com/ (accessed on 30 October 2022).
- Lediju Bell, M.A. Photoacoustic Imaging for Surgical Guidance: Principles, Applications, and Outlook. J. Appl. Phys. 2020, 128, 060904. [Google Scholar] [CrossRef]
- ANSI Standard Z136.1-2000; For Safe Use of Lasers. Laser Institute of America: Orlando, FL, USA, 2000.
- Rosenthal, A.; Ntziachristos, V.; Razansky, D. Acoustic Inversion in Optoacoustic Tomography: A Review. Curr. Med. Imaging Rev. 2014, 9, 318–336. [Google Scholar] [CrossRef] [PubMed]
- Shen, K.; Liu, S.; Feng, T.; Yuan, J.; Zhu, B.; Tian, C. Negativity Artifacts in Back-Projection Based Photoacoustic Tomography. J. Phys. D Appl. Phys. 2021, 54, 074001. [Google Scholar] [CrossRef]
- Kuniyil Ajith Singh, M.; Xia, W. Portable and Affordable Light Source-Based Photoacoustic Tomography. Sensors 2020, 20, 6173. [Google Scholar] [CrossRef] [PubMed]


Publisher’s Note: MDPI stays neutral with regard to jurisdictional claims in published maps and institutional affiliations. |
© 2022 by the authors. Licensee MDPI, Basel, Switzerland. This article is an open access article distributed under the terms and conditions of the Creative Commons Attribution (CC BY) license (https://creativecommons.org/licenses/by/4.0/).
Share and Cite
Or, Z.; Levi, A.R.; Hazan, Y.; Rosenthal, A. Hand-Held Optoacoustic System for the Localization of Mid-Depth Blood Vessels. Photonics 2022, 9, 907. https://doi.org/10.3390/photonics9120907
Or Z, Levi AR, Hazan Y, Rosenthal A. Hand-Held Optoacoustic System for the Localization of Mid-Depth Blood Vessels. Photonics. 2022; 9(12):907. https://doi.org/10.3390/photonics9120907
Chicago/Turabian StyleOr, Zohar, Ahiad R. Levi, Yoav Hazan, and Amir Rosenthal. 2022. "Hand-Held Optoacoustic System for the Localization of Mid-Depth Blood Vessels" Photonics 9, no. 12: 907. https://doi.org/10.3390/photonics9120907