1. Introduction
The safe and reliable operation of electrical equipment is the first defense line to avoid major accidents in the power system. Accurately grasping the operation status of electrical equipment and diagnosing its internal defect types is one of the keys to ensure the safe production of power grids and achieve efficient equipment maintenance [
1,
2]. SF
6 gas is widely used in gas-insulated electrical equipment due to its good arc extinguishing properties and insulating properties. However, according to existing research, SF
6 electrical equipment inevitably introduces defects in the process of manufacturing, transportation and maintenance. If the defects cannot be found in time, they gradually develop and cause equipment failure [
3,
4]. In the early stage of the defect, partial discharge inside the equipment is caused, which leads to the decomposition of SF
6 to produce gas decomposition components, such as CO, SO
2, SO
2F
2, SOF
2, etc. [
5,
6]. Monitoring these characteristic components can provide a basis for judging the type, and severity, of a defect [
7,
8]. Therefore, accurate monitoring of SF
6 characteristic decomposition components is of great significance for diagnosing early latent faults of gas-insulated equipment and ensuring the safe and reliable operation of power grids.
At present, the on-site detection of SF
6 characteristic decomposition components mainly adopts electrochemical sensors and spectral detection instruments [
9,
10,
11,
12,
13]. Zhang et al. proposed using a TiO
2 nanotube array sensor to detect SF
6 decomposition components, and realized SO
2 detection of 10–50 ppm [
9]. Gui et al. used a Ni-modified carbon nanotube gas sensor to carry out theoretical and experimental studies on the detection of SF
6 decomposition components H
2S, SOF
2, SO
2 and SO
2F
2, and the detection limit reached 1 ppm [
10]. Li et al. proposed a gas detection method based on TiO
2/NiSO
4 composite nanofibers, which could maximize the sensing response of 100 ppm SO
2F
2 by up to 189% at room temperature [
11]. Zhang et al. used mid-infrared laser spectroscopy to detect SO
2F
2 and SOF
2, and the detection limit could reach 1 ppm [
12]. Chen et al. studied CO detection using a 2.33 um laser and cantilever photoacoustic spectroscopy, and the detection limit reached 5.1 ppm [
13]. In general, electrochemical sensors are low cost and have high detection sensitivity, but may be affected by strong electromagnetic interference in the field. The spectral detection instruments have high sensitivity, strong anti-electromagnetic interference ability and fast response speed. However, this method is based on gas absorption spectroscopy and the Lambert–Beer law. Since the background gas inside the electrical equipment is SF
6, which has strong absorption in the infrared band, it affects the detection results [
14]. In addition, the above two methods both need to collect samples through the inlet port of the equipment for measurement when the methods are applied in the field. On the one hand, this consumes SF
6 gas inside the equipment. On the other hand, it may only detect the gas component in the area near the inlet port of the equipment. It is difficult to grasp the real component content inside the equipment, and it is impossible to truly realize the online monitoring of the SF
6 decomposition components inside the equipment.
Optical fiber sensors have the advantages of strong anti-electromagnetic interference ability, good insulation performance, high sensitivity and low cost, and are widely used in the field of sensing. Optical fiber sensors generally reflect changes in the physical parameters (temperature, stress, ultrasound, etc.) to be measured, by measuring changes in signals, such as light intensity, refractive index, and wavelength [
15,
16]. The adsorption of a specific gas by a nanomaterial causes a change in its dielectric constant (this is also the principle of an electrochemical sensor) [
17]. If the nanomaterial is used as an optical fiber layer, when the nanomaterial adsorbs gas, it indirectly causes its refractive index to change, which causes light changes and achieves gas detection [
18]. The nanomaterial-coated optical fiber gas sensor has the advantages of strong electromagnetic interference resistance, simple structure and good insulation performance [
19,
20], and it is very suitable as a built-in detection method for the characteristic gas components of the SF
6 electrical equipment. At present, there are few studies on gas sensors of nanomaterial-coated optical fiber. Some scholars have explored its gas sensing characteristics [
21,
22], and realized gas detection at the ppm level. However, its detection performance still has some gaps with existing nanomaterial-based gas sensors and spectral detection methods. It is necessary to further improve the demodulation method and the optical path structure.
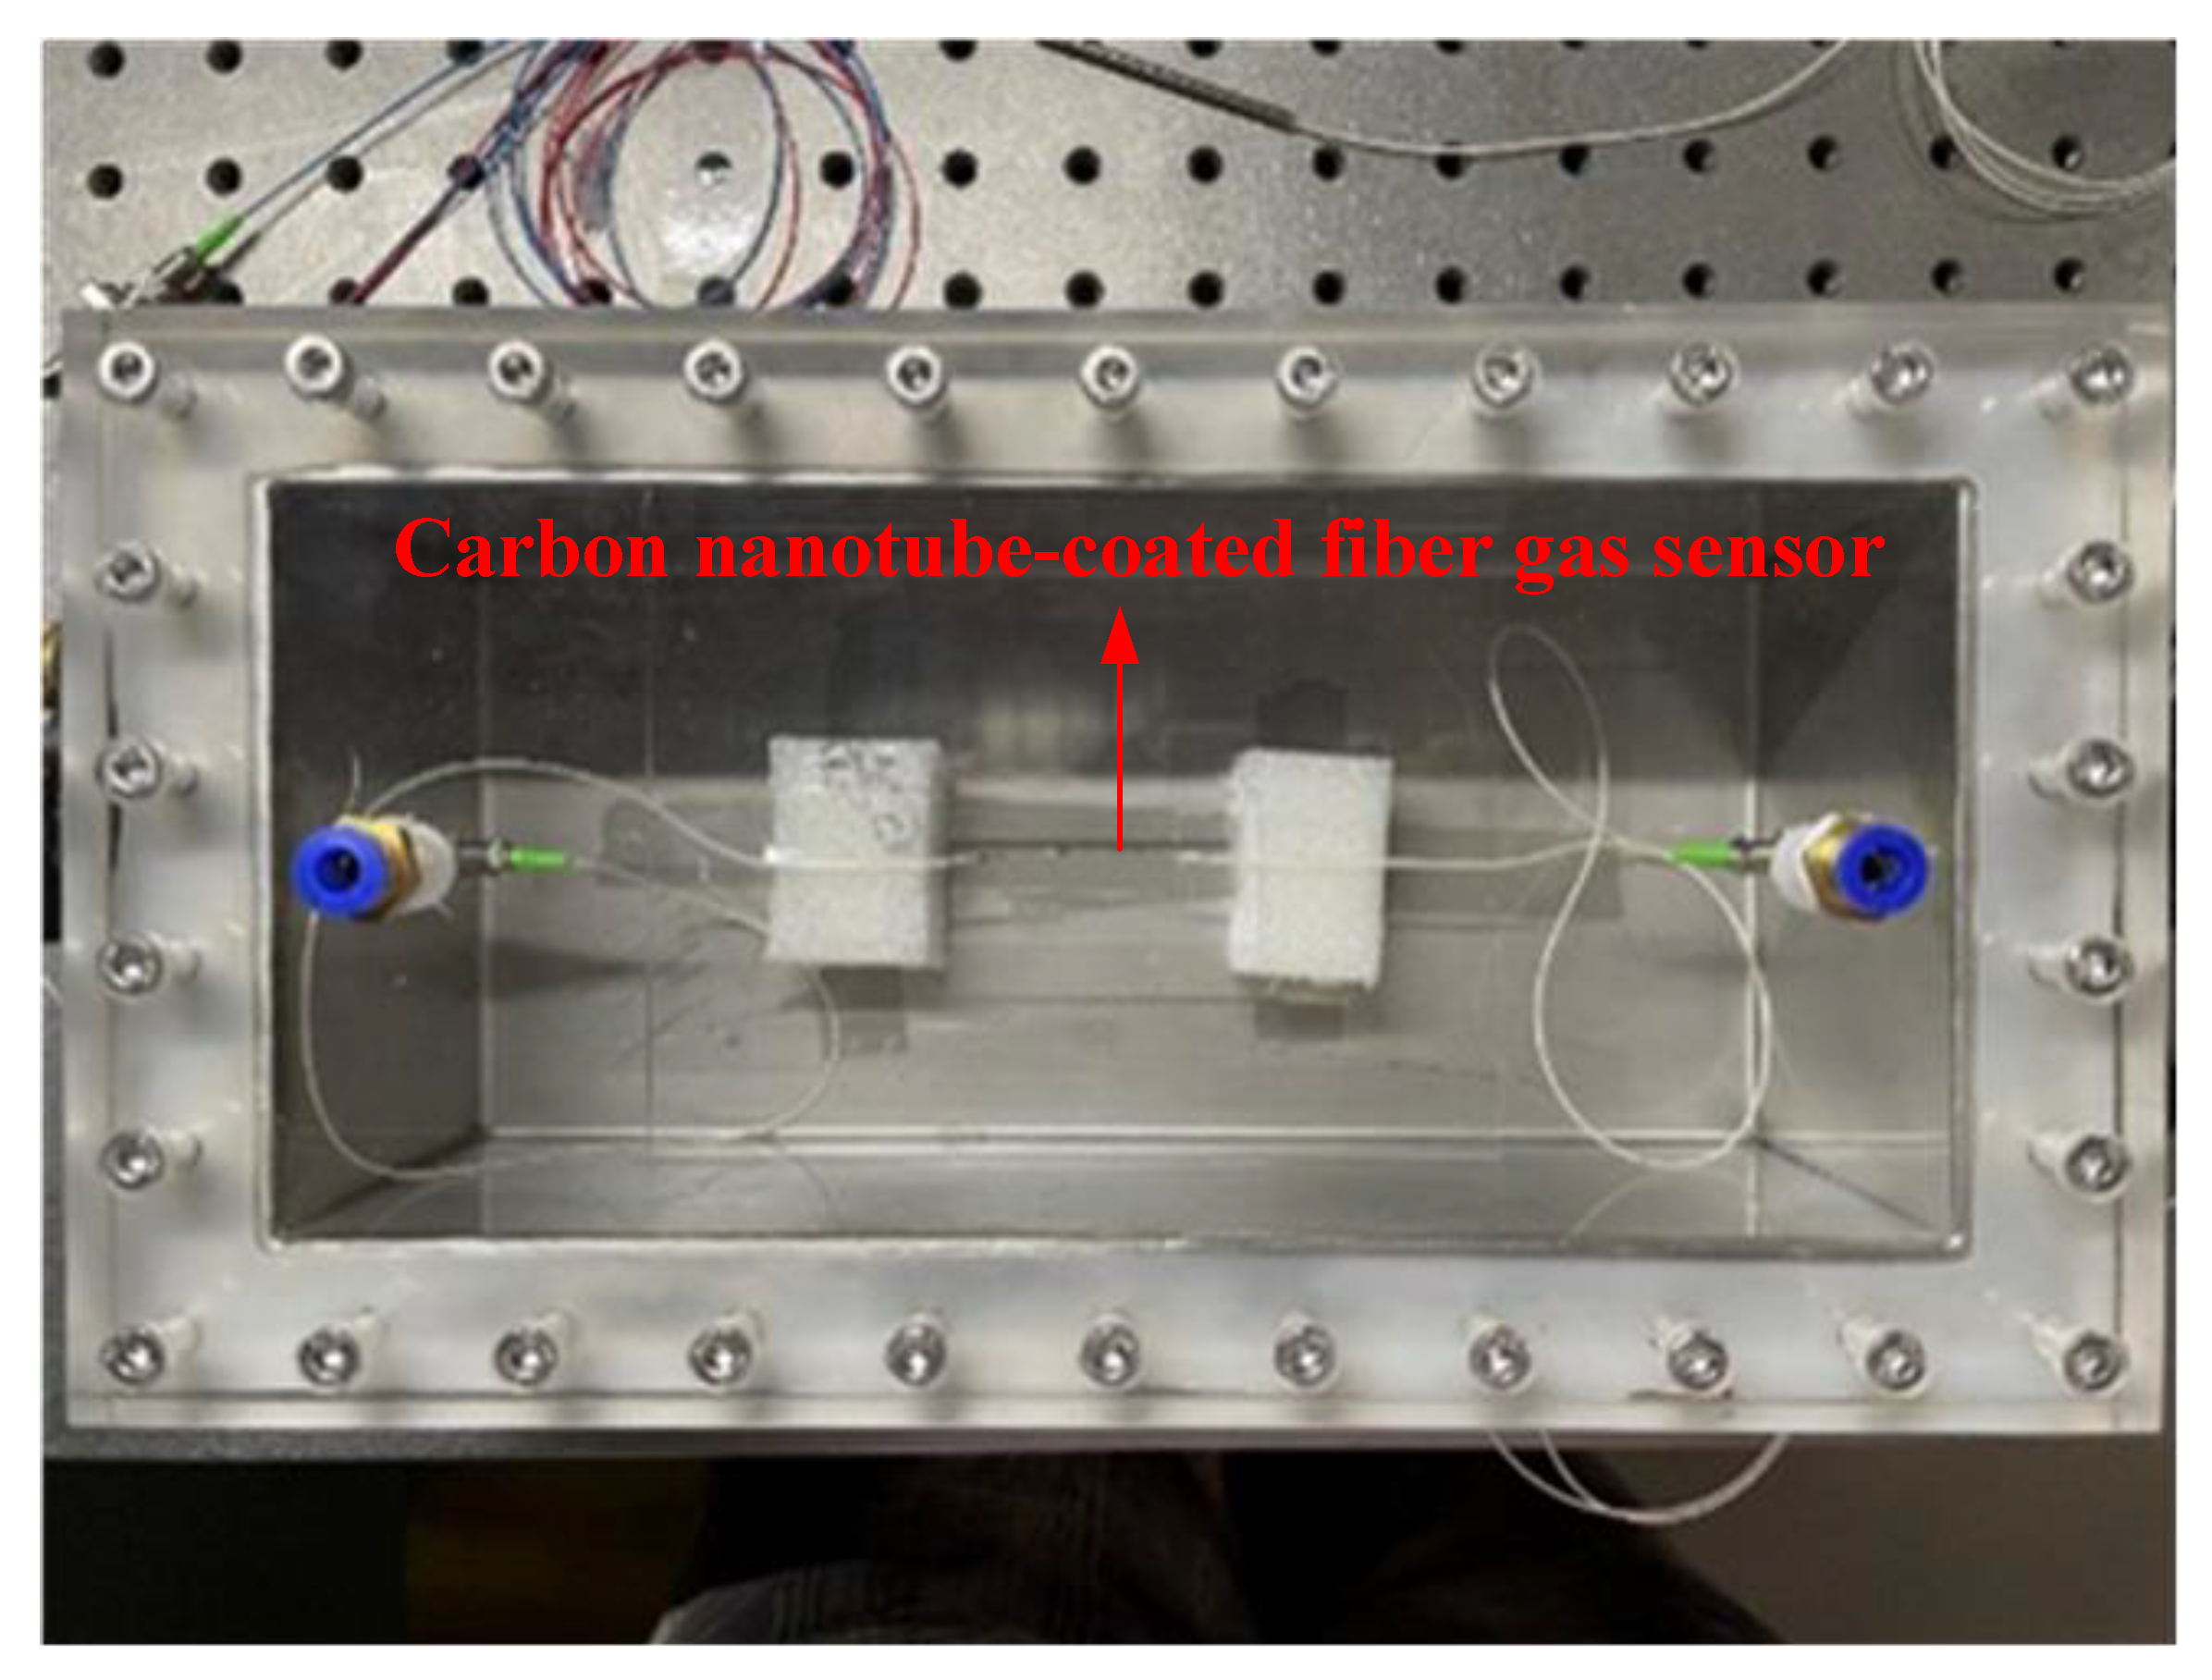
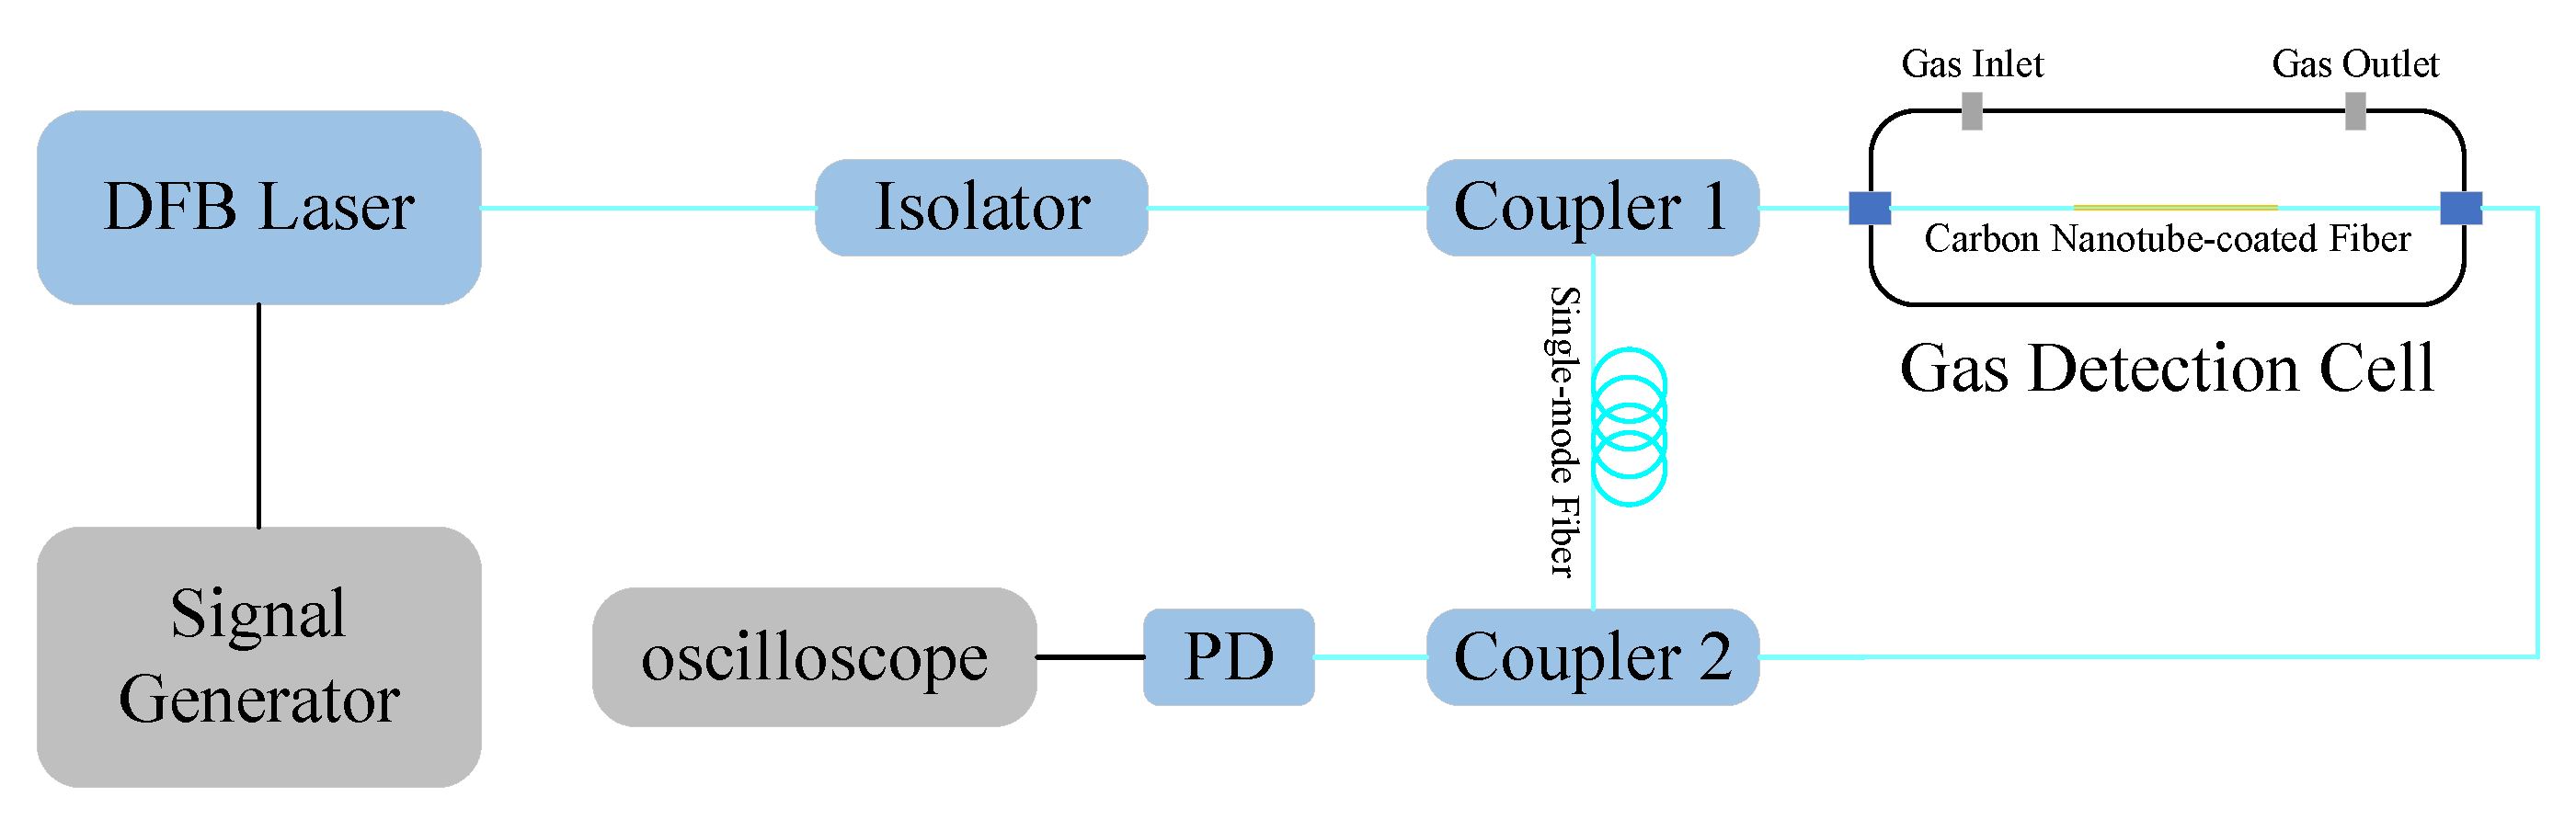
In this paper, a preliminary study on a nanomaterial-coated optical fiber gas sensor for the detection of SF6 decomposition components was carried out, and a carbon nanotube thin film optical fiber gas sensor prepared. Based on the fiber loop ring-down (FLRD) system, the gas sensing properties of the gas sensor for SF6 gas components were explored, and the detection of SF6 decomposition components, based on the carbon nanotube-fiber sensor, realized. The research results provide new ideas for future research on the online monitoring technology of SF6 electrical equipment.
3. Results
3.1. The Coupler Split Ratio Determination
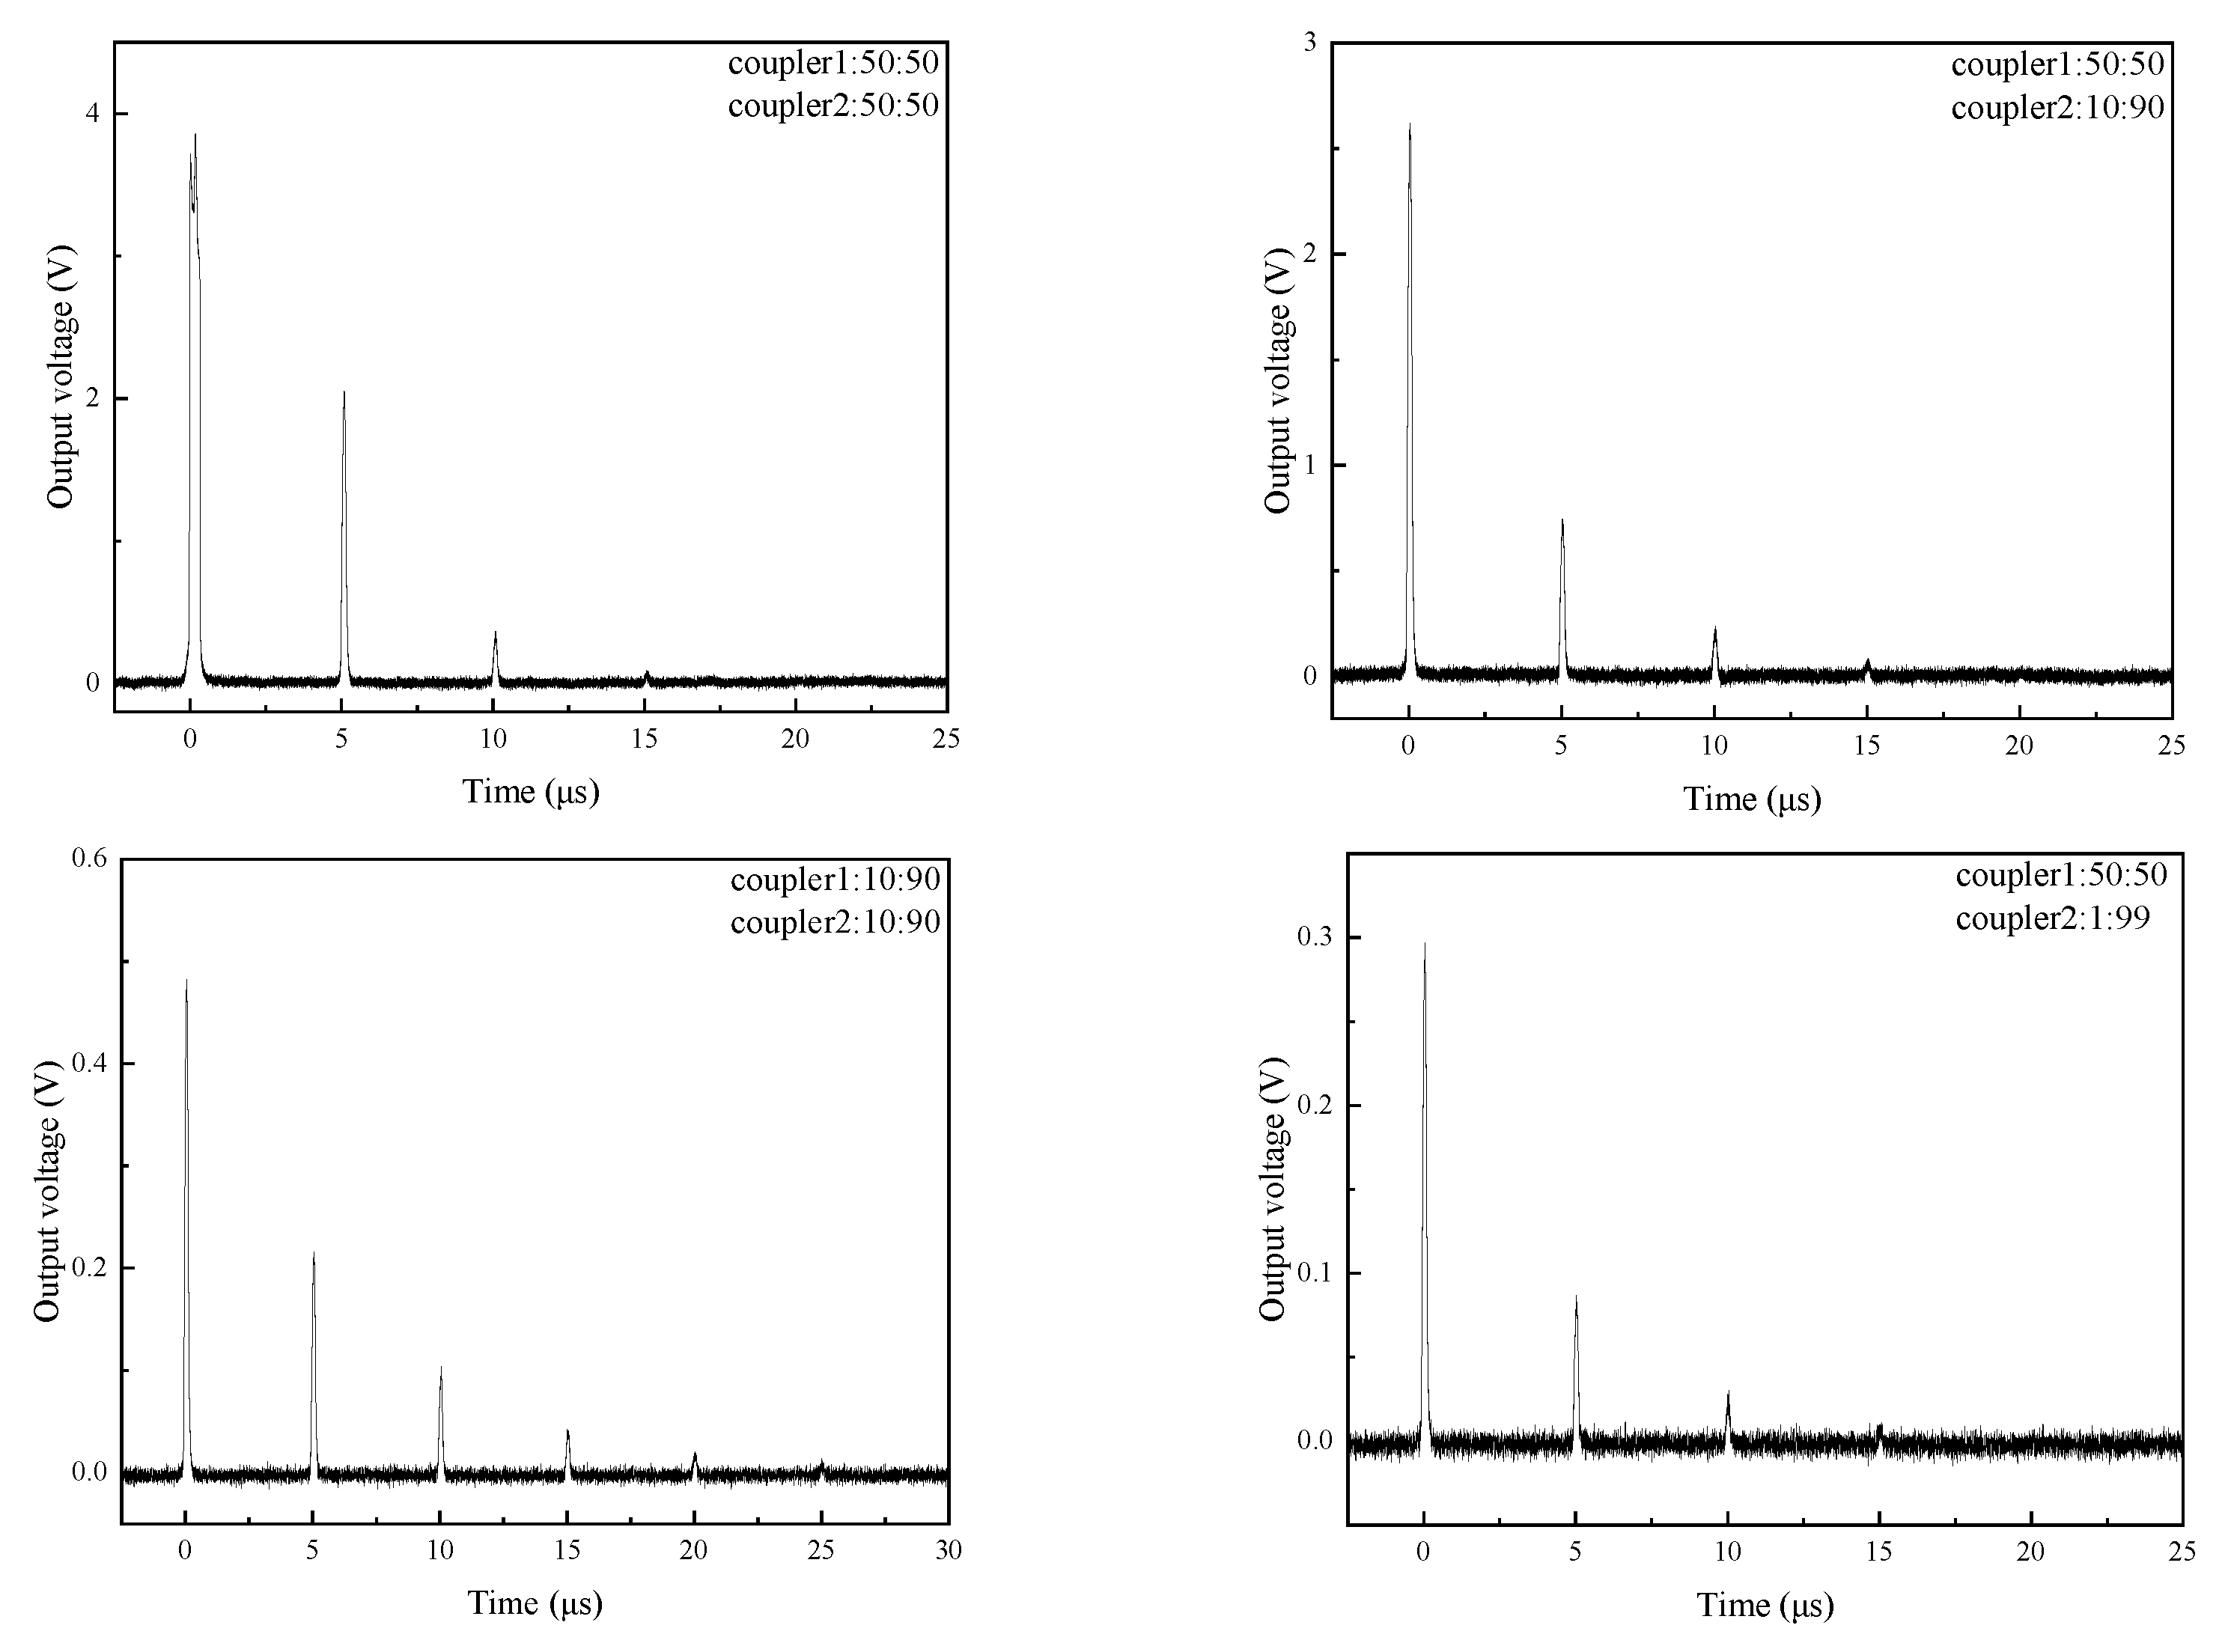
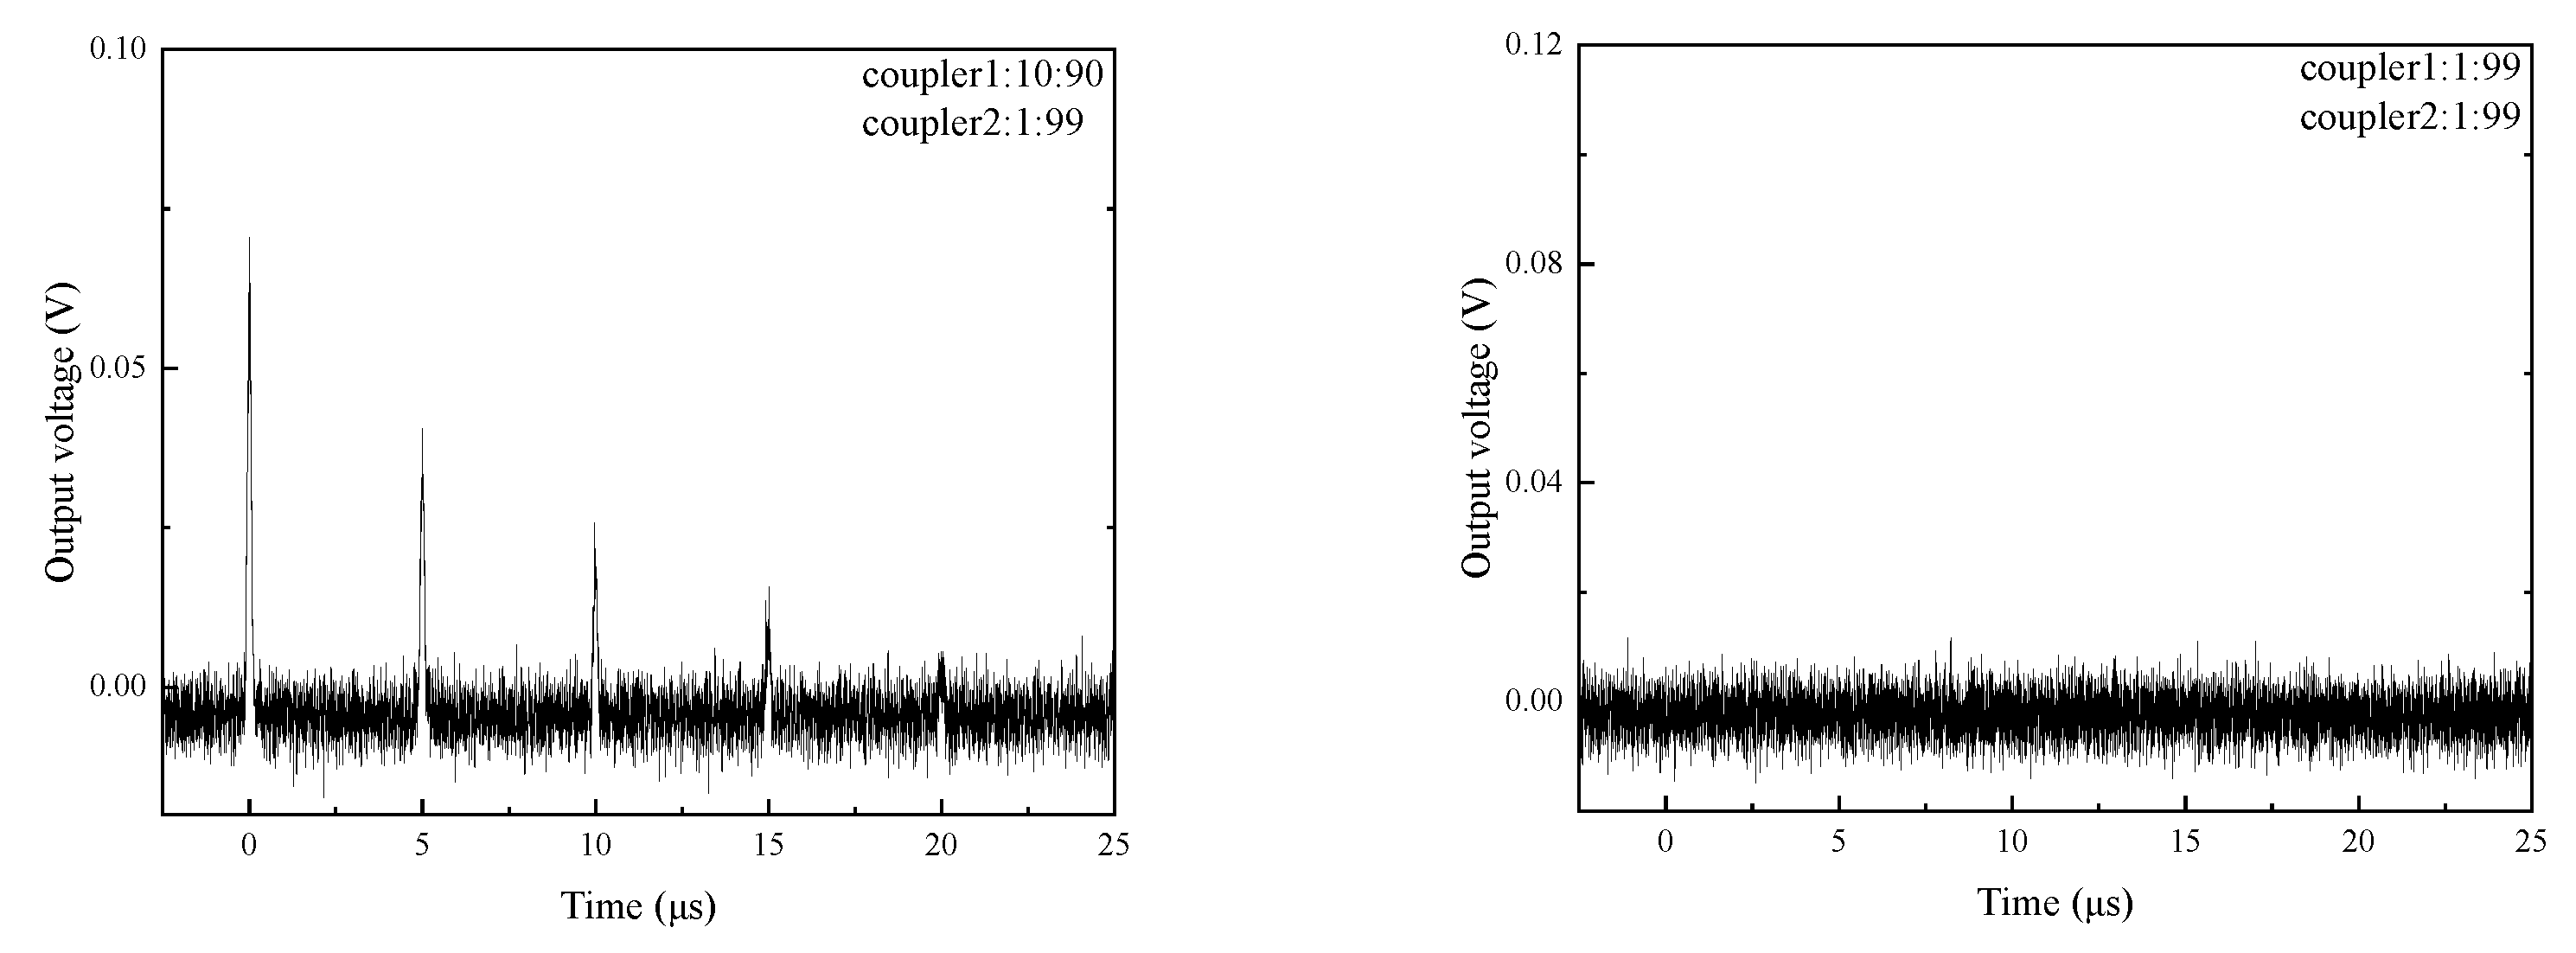
The detection result obtained by the FLRD system was a series of attenuated pulse waveforms, and the selection of the coupler split ratio would affect the optical loss of the system, which would affect the number of pulses, and the number of pulses relates to the accuracy of curve fitting. Therefore, it was necessary to determine the optimal coupler split ratio of the FLRD system.
The FLRD system was set to a frequency of 8 kHz and a duty cycle of 2%. The Gas detection cell was filled with N
2 as the background gas, and the detection results of the couplers with different split ratios were analyzed under the background gas. The split ratio adopted three common couplers of 1:99, 10:90, and 50:50, and the results under different collocations were obtained, as shown in
Figure 3 and
Table 1.
It can be seen from
Figure 3 that when the split ratio of the two couplers was 10:90, the obtained waveform had the largest number of pulses, which indicated that the laser circulated the most times in the ring cavity and the signal noise was relatively small.
Table 1 shows the peak values of the first five pulses of the attenuated pulse waveform obtained in the experiment. The data of No. 3 in the table corresponds to the split ratio of the couplers being 10:90. It can also be seen that although the peak value of the first pulse signal was small, the amplitude of the fifth pulse signal was the largest, compared with the other collocations of the couplers, indicating that the use of this collocation of the couplers had the smallest signal attenuation in the ring cavity. Therefore, two 10:90 couplers were used to conduct the experimental research. On the one hand, the number of interactions between the laser and the gas sensor was greater, which could improve the detection sensitivity, and, on the other hand, the number of pulses was greater, so a more accurate fitting curve could be obtained.
3.2. Detectable SF6 Decomposition Component Analysis
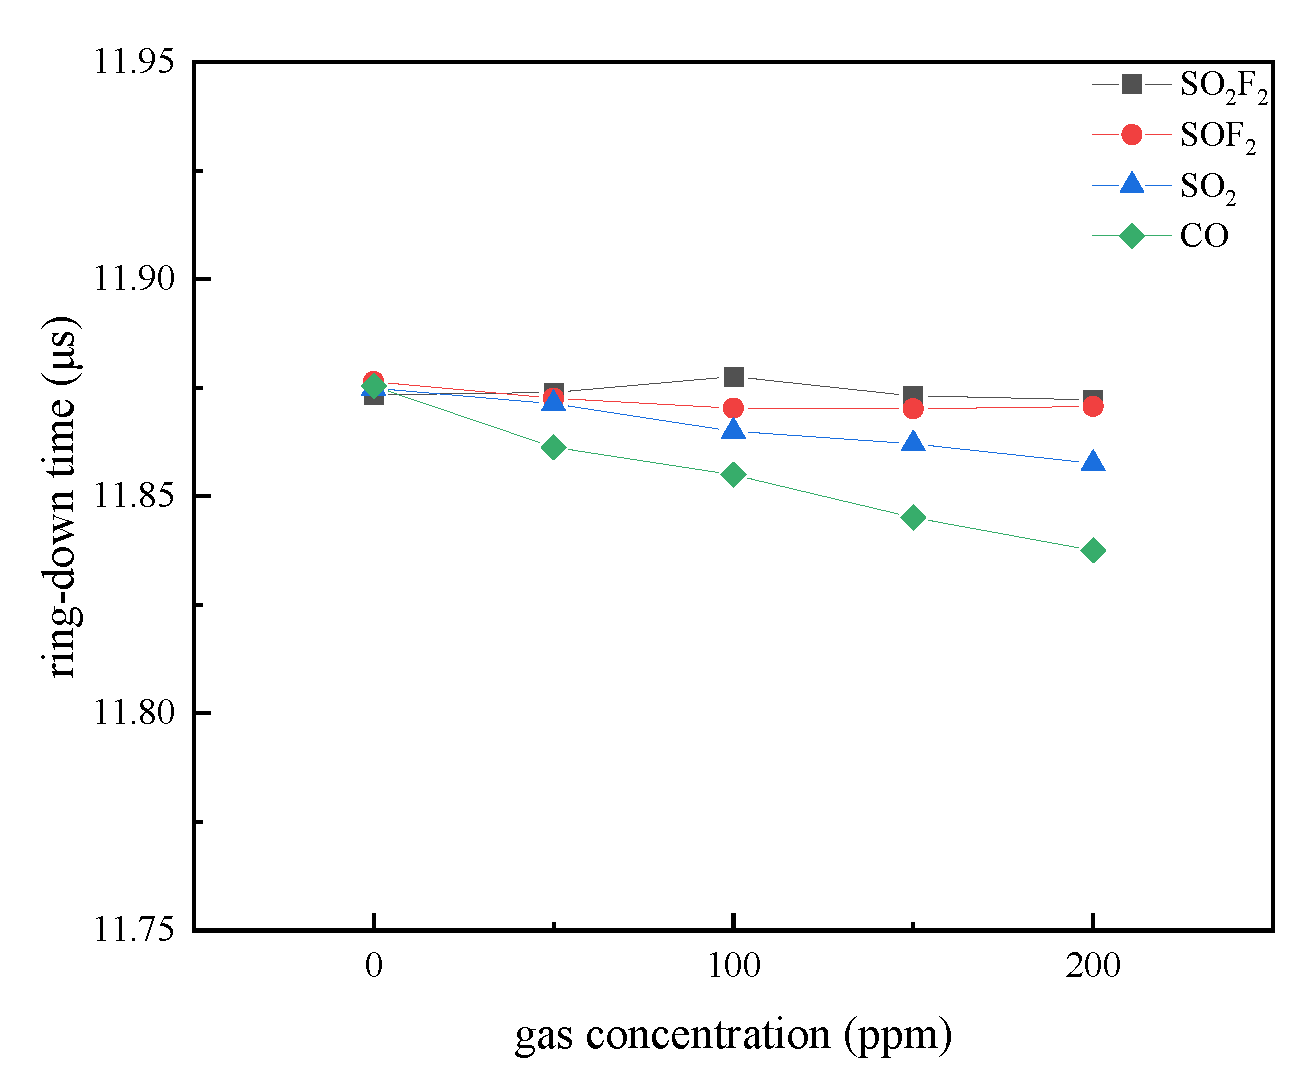
The detection experiments of several typical SF6 decomposition components of CO, SO2, SO2F2 and SOF2 were carried out, and the detection ability of the carbon nanotube-coated fiber gas sensor for the gas components was tested at room temperature, so as to determine the detectable decomposition components. The gas concentrations of 0 ppm, 50 ppm, 100 ppm, 150 ppm, and 200 ppm were selected in the experiment, and the background gas was N2. According to the influence law of different concentrations of gas on the ring-down time, it was judged whether the gas could be quantitatively detected, and the detectable gas was screened out.
The experimental results are shown in
Figure 4. Compared with the other gases, the linear law between CO and ring-down time was stronger. The change of the concentration of SO
2F
2 and SOF
2 basically did not cause the change in the ring-down time. For SO
2, there was a linear law between the concentration and the ring-down time, but the change of the ring-down time was not as obvious as that of CO detection.
Due to the evanescent field around the micro fiber, it was sensitive to change in the refractive index. When the coating material absorbed gas, its optical properties would also change accordingly, and the refractive index of the cladding would change, resulting in a decrease in the intensity of light waves transmitted in the micro fiber and an increase in the optical loss of the sensor. The change of optical loss was measured by the FLRD system.
In the process of CO detection, although there may be some SO2 interference, the selectivity of the sensor could be improved through material modification, and the decoupling algorithm of electrochemical sensors could be used for reference in the future to eliminate the interference effect. In this paper, the detection performance of carbon nanotube-coated fiber gas sensor was explored with CO detection, thus, illustrating the possibility of application of this fiber gas detection method in the power industry.
In the FLRD system, the reason for the decrease of the ring-down time was the increase of the optical loss of the system, indicating that the interaction of CO and carbon nanotubes could lead to increase of the optical loss of the fiber gas sensor. In
Figure 4, the change between CO concentration the ring-down time showed a linear law, which could be used to realize the quantitative detection of CO.
3.3. Gas Adsorption Properties
From the above experimental results, combined with the existing research [
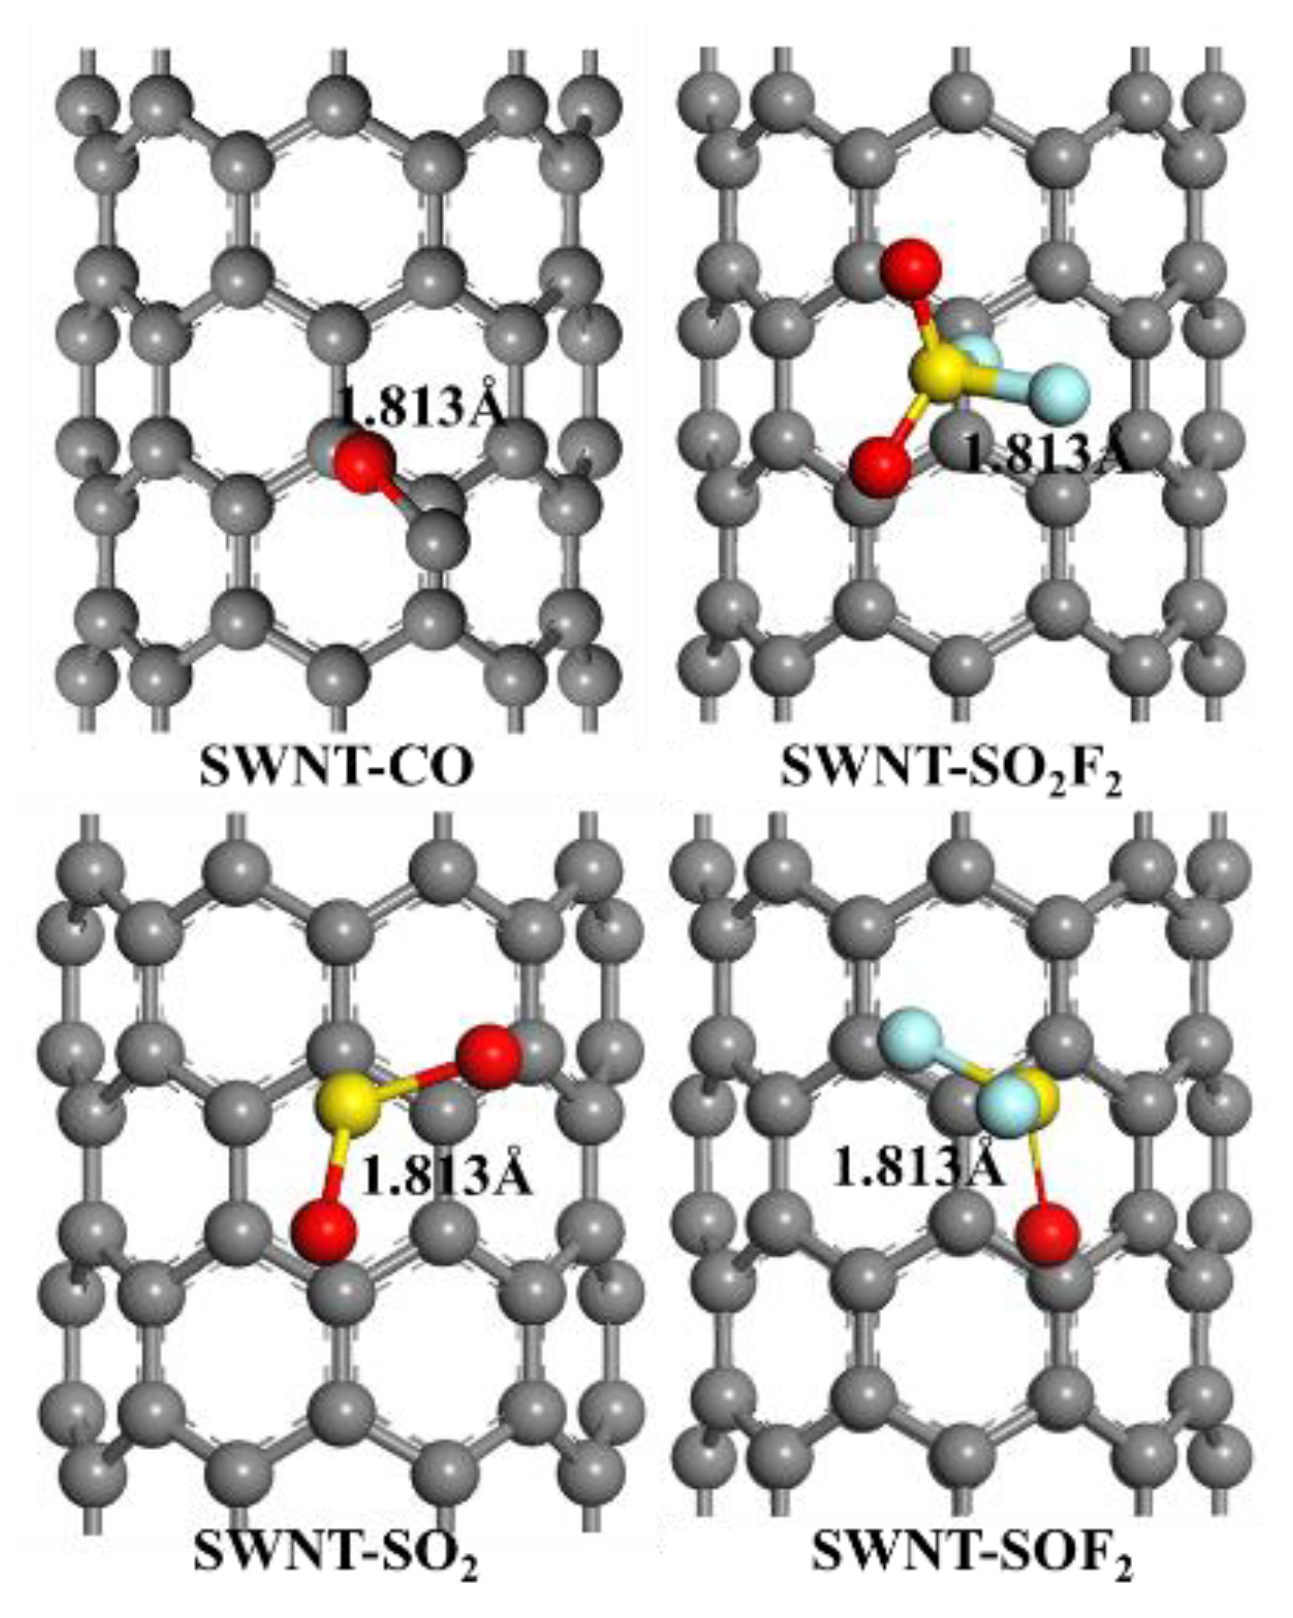
18], when the nanomaterial adsorbed gas, its dielectric constant would change, which would lead to change in the refractive index of the material and change in the optical loss of the sensor. That is to say, the gas detection capability of the coated fiber gas sensor was related to the adsorption characteristics between nanomaterials and gases. Therefore, based on the density functional theory, the theoretical analysis of the adsorption characteristics between carbon nanotubes and four kinds of gases was carried out, and the above experimental phenomena explained.
The adsorption structures of CO, SO
2, SO
2F
2 and SOF
2 gases and single-walled carbon nanotubes were constructed, and the first-principles optimization carried out, as shown in
Figure 5. The DMol
3 module of Material Studio was used for calculation, and the adsorption behavior of four kinds of gases on single-walled carbon nanotubes simulated. To calculate the optimization energy and related properties of the architecture of the gas–solid interface, the GGA–PBE functional method was utilized. Dual numerical polarization (DNP) was chosen as the basis set function for linear combination of atomic orbitals (LCAO), and the effect of Van der Waals forces corrected by considering the TS method in DFT–D dispersion correction. Under the condition that the adsorption distance between each gas molecule and single-walled carbon nanotubes was kept the same, the corresponding adsorption energy was calculated. The detailed data are shown in
Table 2. According to the adsorption parameters in
Table 2, it was judged that single-walled carbon nanotubes had the best adsorption effect on CO molecules under the same conditions, the adsorption energy reaching −0.150 Ha, and the corresponding adsorption distances were both 1.813 Å. In addition, the adsorption energy of SO
2 on single-walled carbon nanotubes was −0.117 Ha. Among the four gases, its adsorption capacity was only weaker than that of CO, which also explained why the carbon nanotube-coated fiber responded to SO
2 in the above experiment. The adsorptions of SO
2F
2 and SOF
2 were weak, so maybe only high concentrations of SO
2F
2 and SOF
2 could be detected. The simulation calculation results explained the reason why the carbon nanotube-coated fiber gas sensor could detect CO. Next, the detection performance of CO gas was analyzed.
3.4. CO Detection Performance Analysis
3.4.1. Linear Fitting and Concentration Inversion
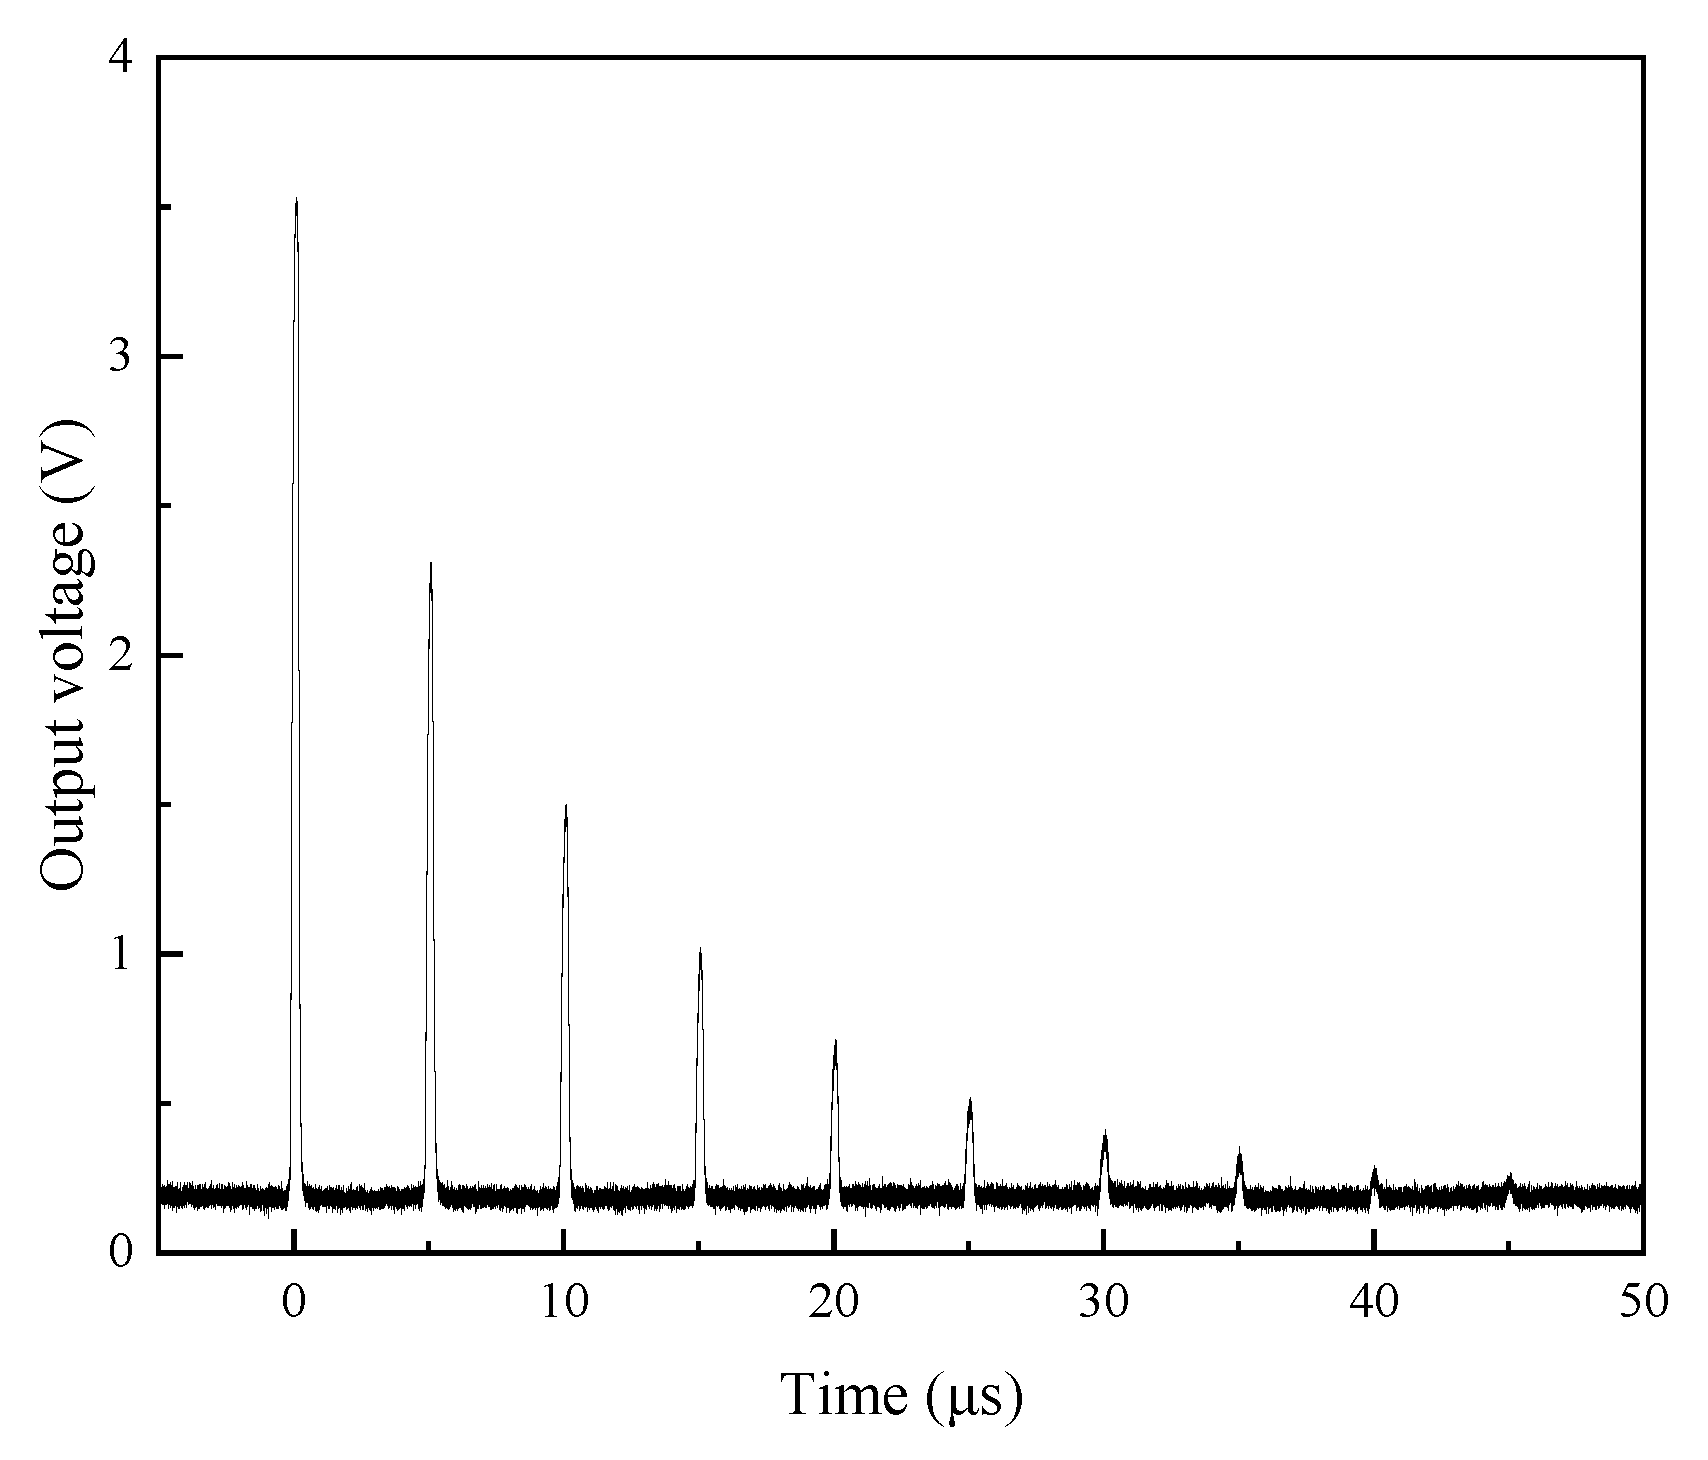
During the experiment, the background gas, N
2, was first introduced into the gas detection cell. After the airflow was stable, the pulse waveform was recorded with an oscilloscope, as shown in
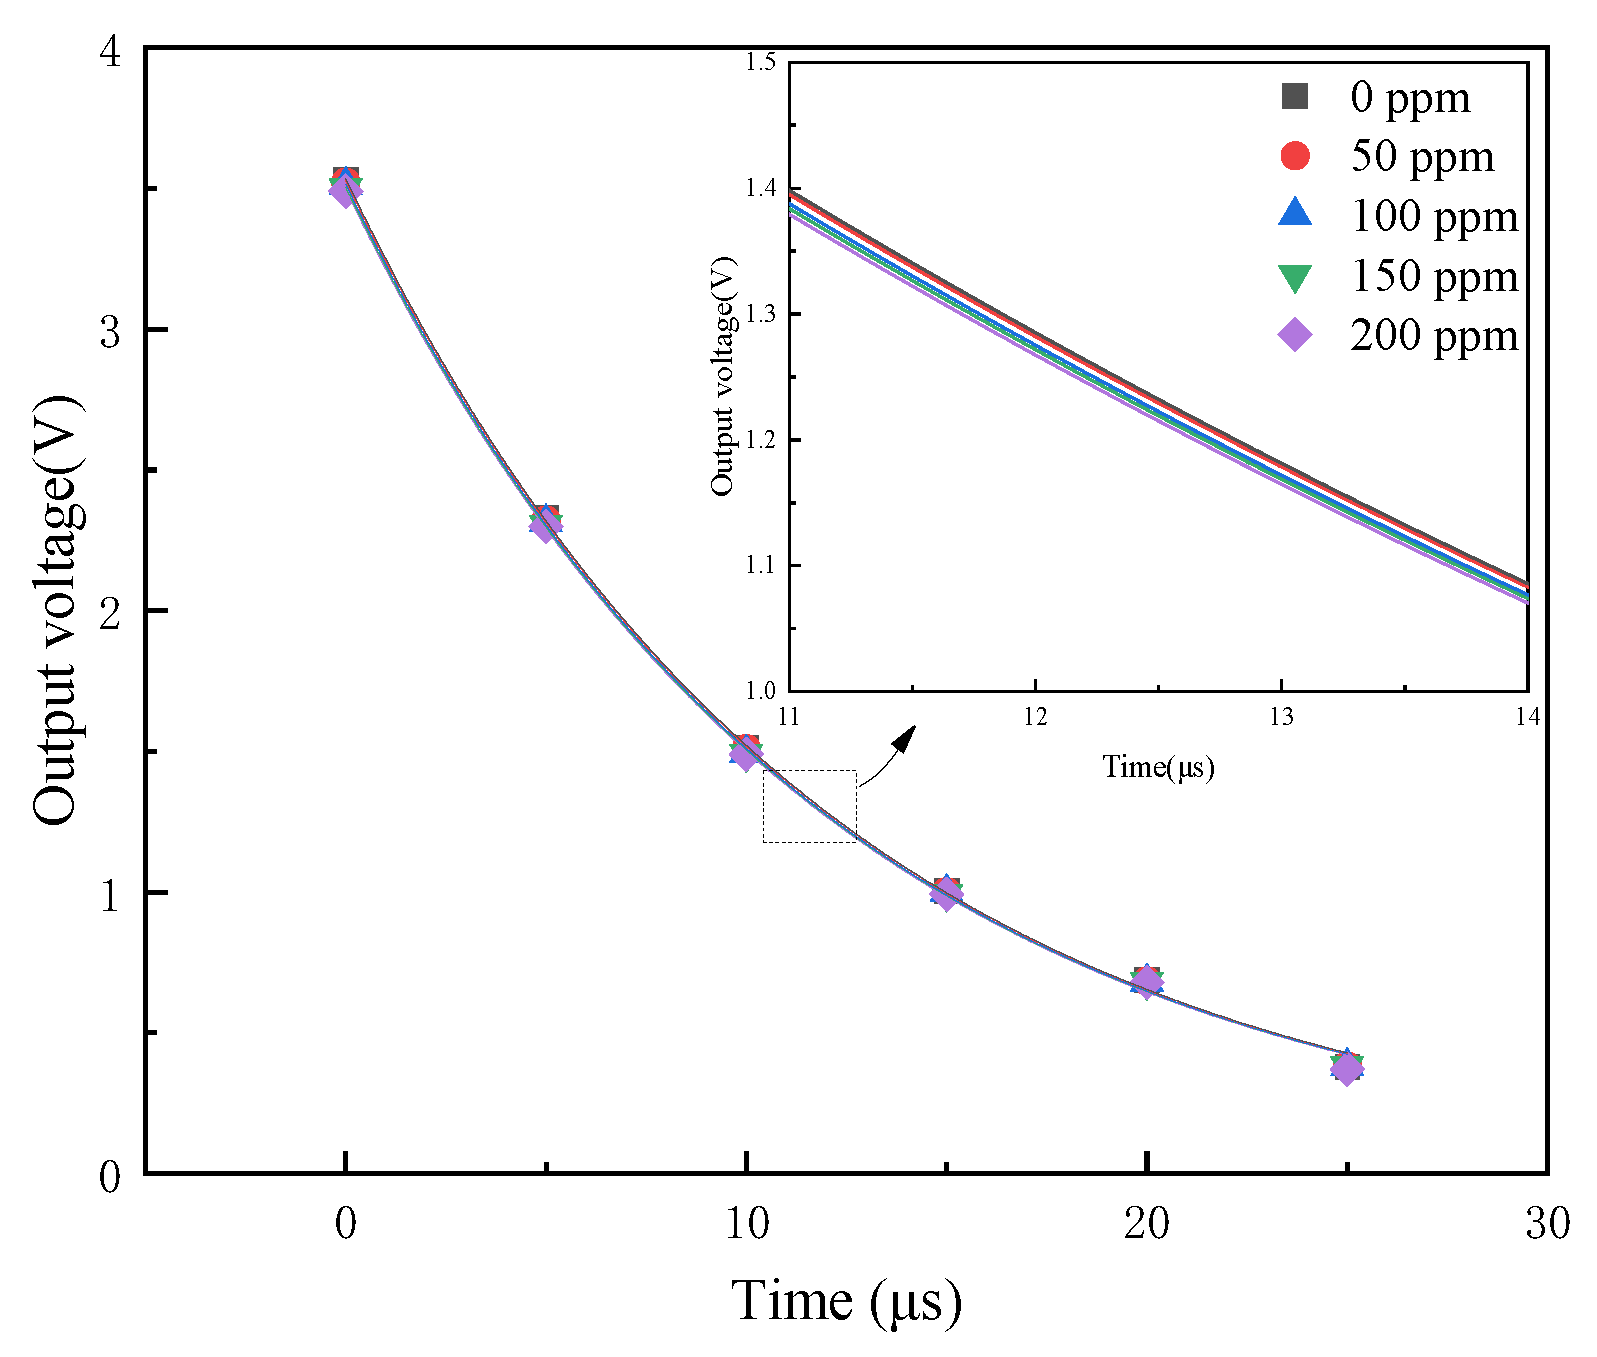
Figure 6. Then, CO gas, with concentrations of 50 ppm, 100 ppm, 150 ppm and 200 ppm, were introduced into the gas detection cell, and the original waveform recorded. When the gas concentration changed, the pulse signal also changed. Taking the peak value of the pulse signal and the corresponding time, exponential function fitting was performed, and the ring-down curve under different concentrations was obtained, as shown in
Figure 7. It can be seen that as the concentration increased, the ring-down curve also changed regularly.
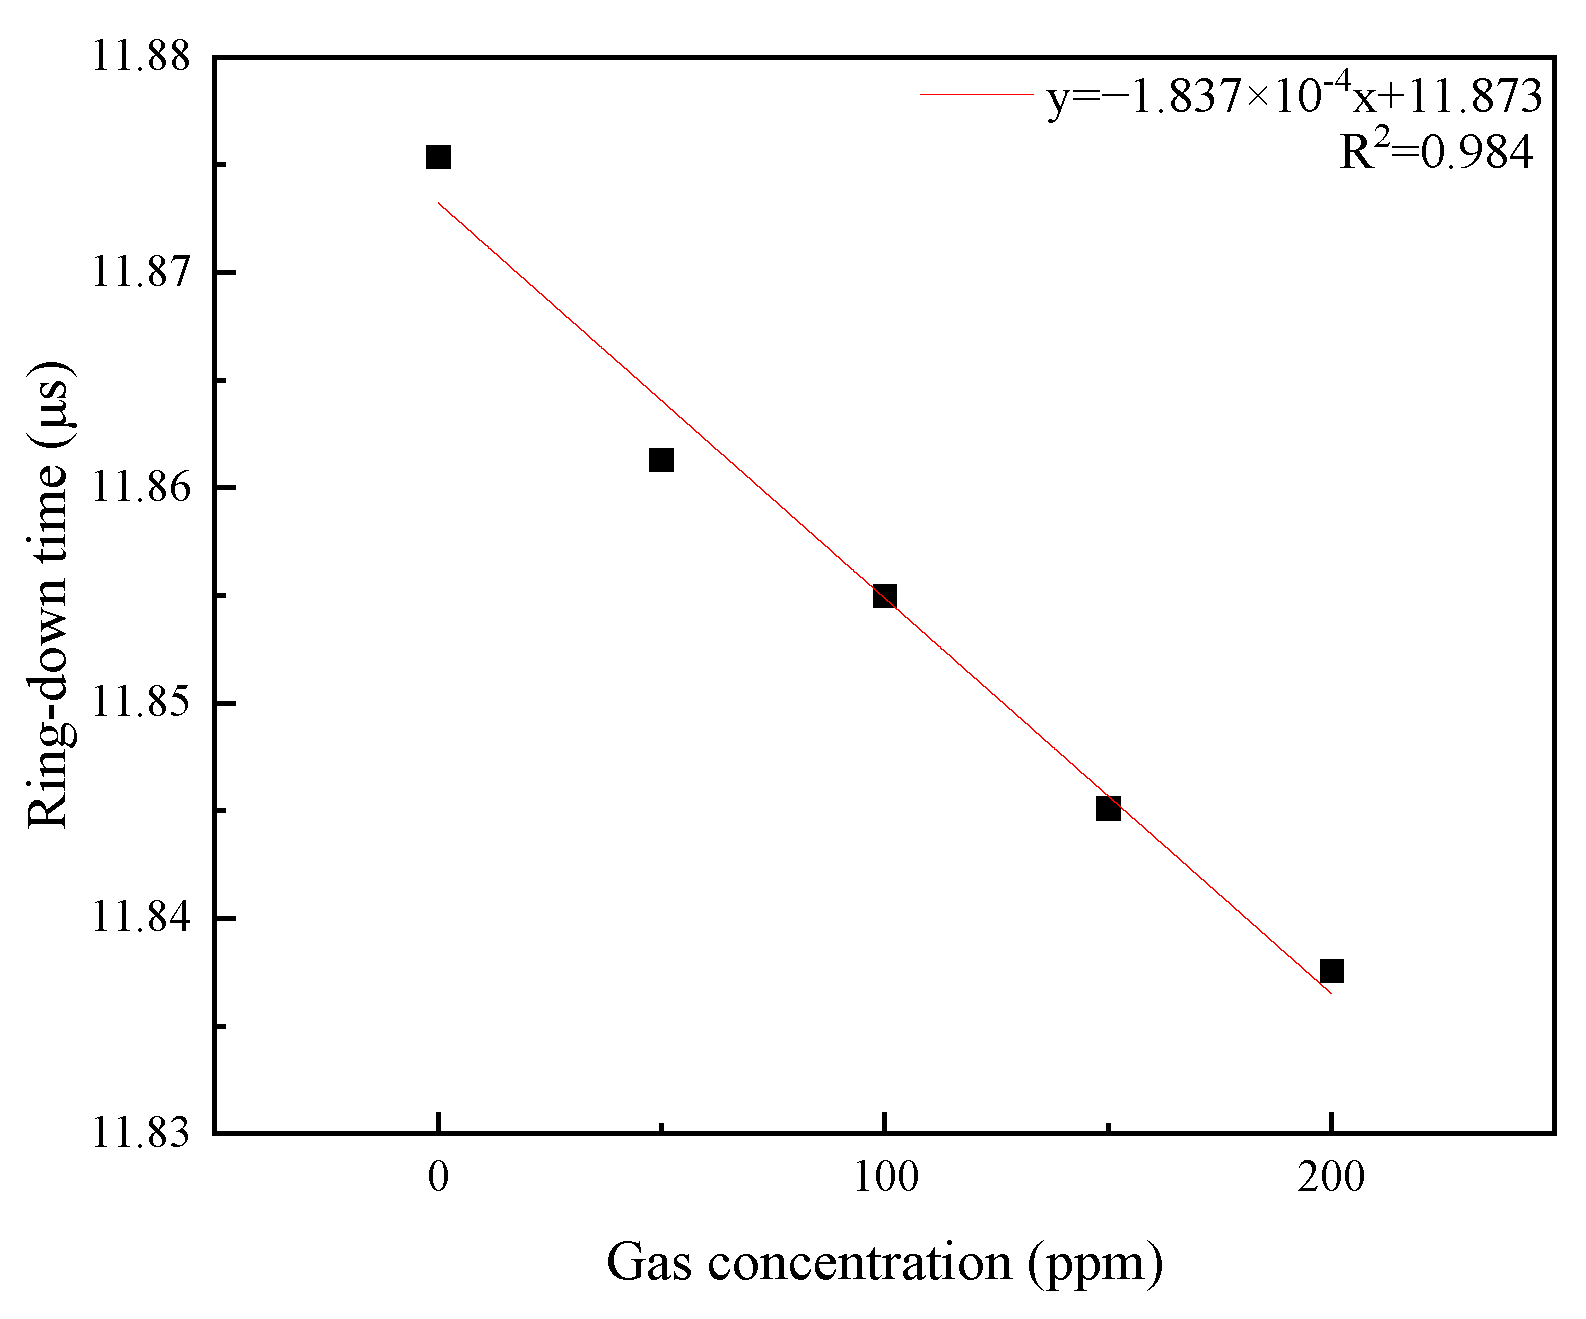
According to the fitting results of the exponential function, the ring-down time corresponding to different concentrations of CO was obtained, and the linear fitting between the concentration and the ring-down time was performed by the least squares method, as shown in
Figure 8. It can be seen that there was a good linear relationship between the ring-down time and the gas concentration, with R
2 being 0.984.
Then, after establishing the relationship between gas concentration and ring-down time, to form the quantitative method, the CO gas, with concentrations of 25 ppm, 75 ppm, 125 ppm and 175 ppm, was introduced into the gas detection cell, and the inversion calculation performed. The error analysis of the quantitative method was carried out, and the results are shown in
Table 3. It can be seen that the maximum error between the inversion result and the real value was 1.916 ppm, and the maximum relative error was 4.10%, which exhibited good measurement accuracy.
3.4.2. Sensitivity Analysis
Sensitivity reflects the change of the output relative to the input. For the FLRD system in this paper, the change of ring-down time was used to reflect the change of gas concentration. Therefore, the sensitivity of the FLRD system could be defined as the change degree of the ring-down time
τ caused by the change of the gas concentration
C to be measured, which could be expressed by the following equation:
In the equation, S represents the sensitivity, Δτ represents the variation of the ring-down time, and ΔC represents the variation of the concentration. From Equation (1), the sensitivity of the system was 0.183 ns/ppm.
3.4.3. Detection Limit Analysis
There are few related studies on the detection limit of the FLRD gas detection system. In this paper, a method for solving the gas detection limit is proposed. The detection limit represents the lowest gas concentration that the system can measure. From the above CO detection results, it could be found that, in the FLRD system, increase of CO concentration led to an increase in the optical loss of the fiber gas sensor, resulting in an increase in the overall loss of the system, a decrease in the amplitude of the optical pulse signal in the original waveform, and a decrease in the ring-down time. According to the FLRD system principle, the equation for the ring-down time is as follows:
In the equation, I represents the light intensity of the output light received by the PD, which decays exponentially with time, I0 represents the initial light intensity, t represents the time, τ represents the ring-down time, c represents the speed of light in vacuum, n represents the refractive index of the single-mode fiber, L represents the length of the fiber ring cavity, A represents the inherent loss of the system, and B represents the optical loss generated by the fiber gas sensor.
In the actual measurement, the light intensity was converted into the electrical signal by the PD, and then acquired by the oscilloscope, so Equation (2) could be expressed as:
In the equation,
U and
U0 represent the electrical signals obtained by the PD. respectively, for the light intensity of the output light and the initial light intensity. During the experiment, the original waveform was generally composed of multiple pulse signals, as shown in
Figure 6. Taking the pulse signal amplitudes at different times
t, and fitting Equation (4) to obtain the ring-down curves at different concentrations, the ring-down time
τ could be obtained, and, then, the concentration inversion calculation performed.
When the gas concentration was very low, the increase in the optical loss B of the fiber gas sensor was small, which made the change in the ring-down time τ small. At this time, the amplitude of the optical pulse signal in the original waveform would be closer to the amplitude of the optical pulse signal under the background gas. When the change in amplitude of the optical pulse signal, caused by a certain gas concentration value, could just be resolved, the value of the ring-down time τ with the smallest change could be calculated accordingly, and the concentration obtained by inversion was the detection limit of the system.
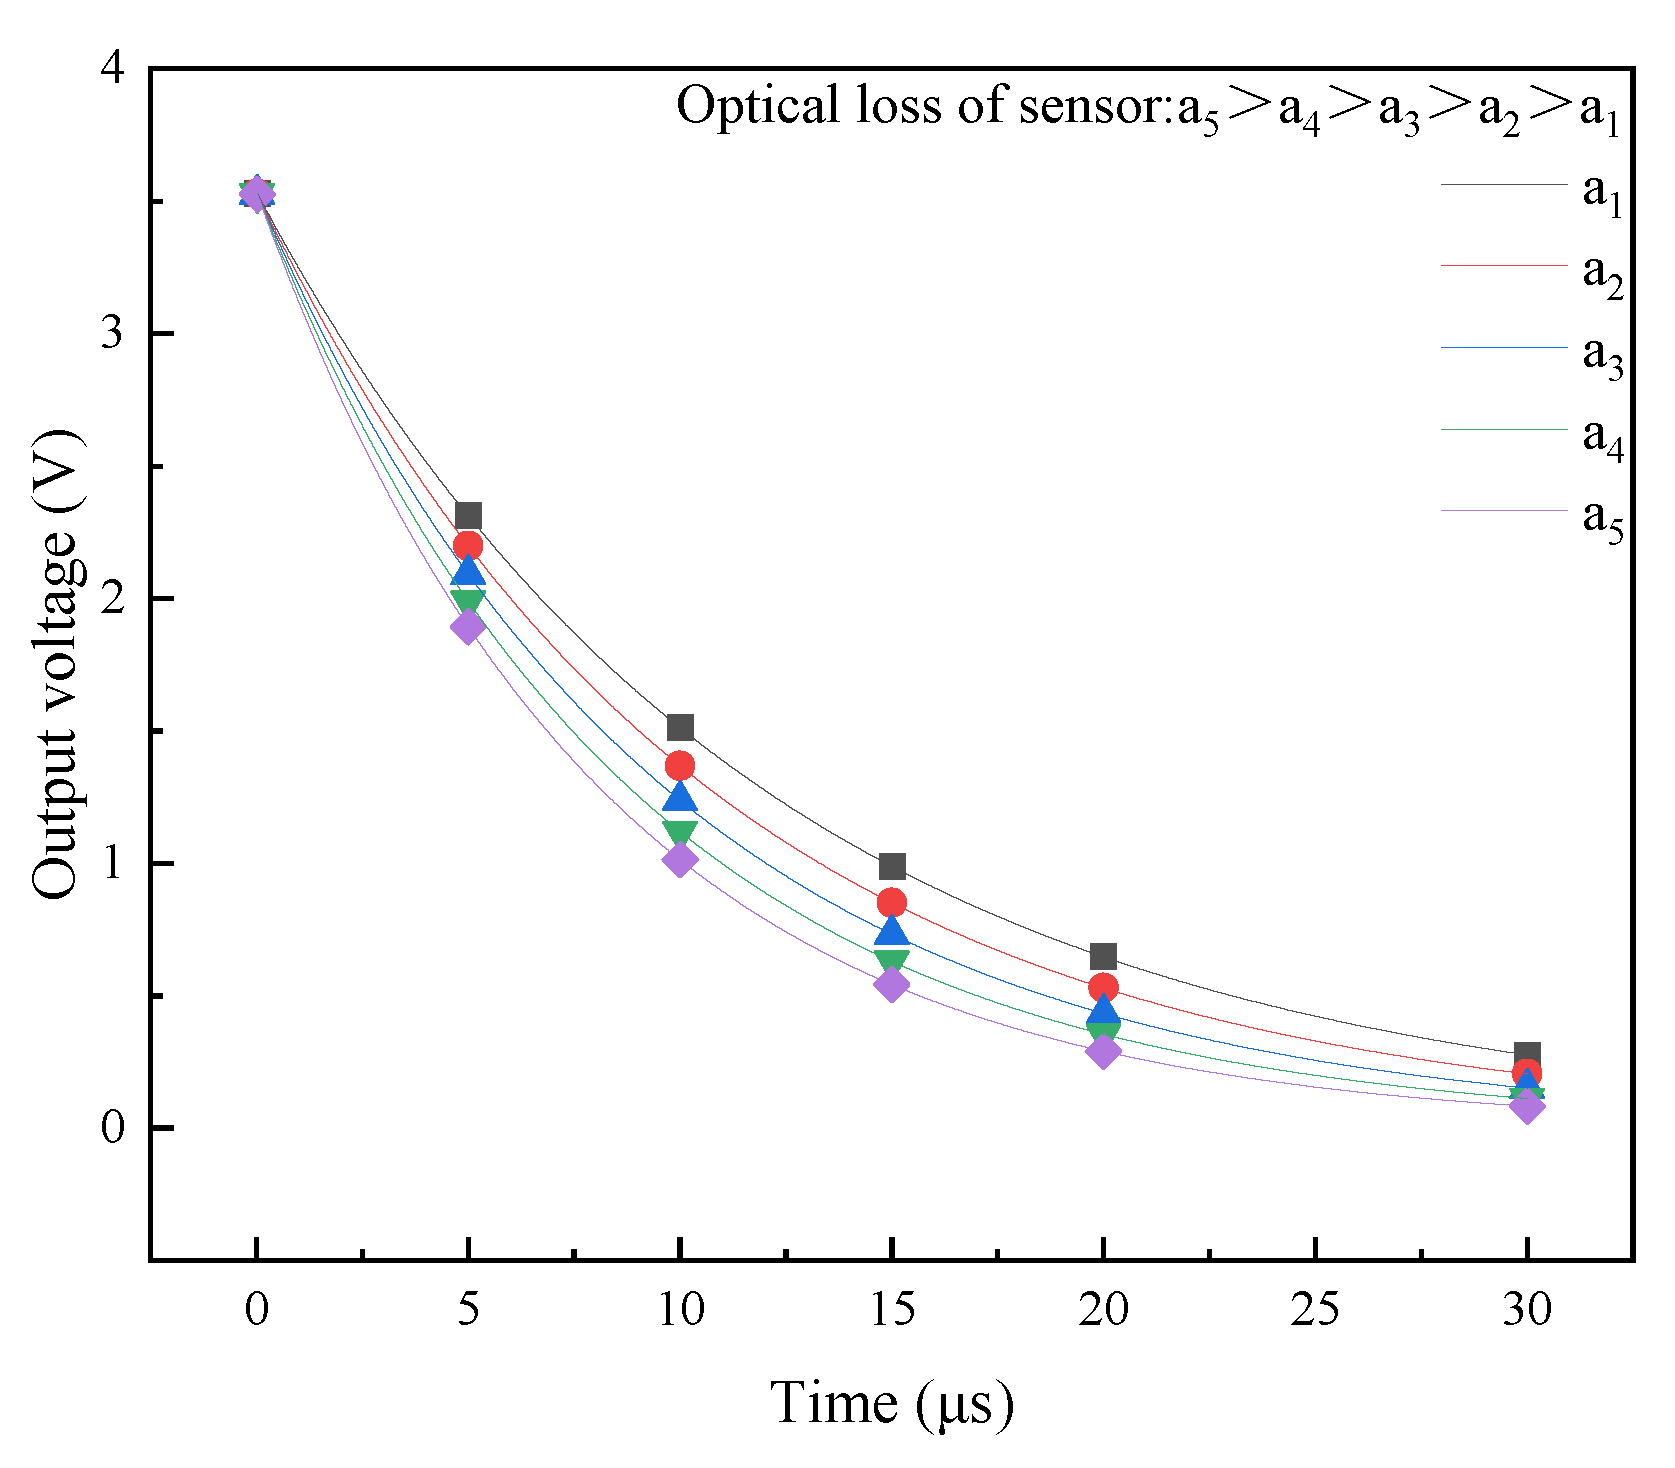
The number of optical pulses in the original pulse signal was generally 5 to 9, and the pulse signal with the most obvious pulse amplitude change with concentration change selected as the optical pulse signal for judging the detection limit. In the ring-down curves of different sensor optical losses, the voltage signal changed most obviously in the middle time period.
Figure 9 shows the simulation results of the ring-down curve of the FLRD system under the different sensor optical losses. Assuming that the optical losses corresponding to the different ring-down curves were a
5 > a
4 > a
3 > a
2 > a
1, it could be seen that when the time was between 5~20 μs, with the increase of the loss, and the voltage value changed more obviously.
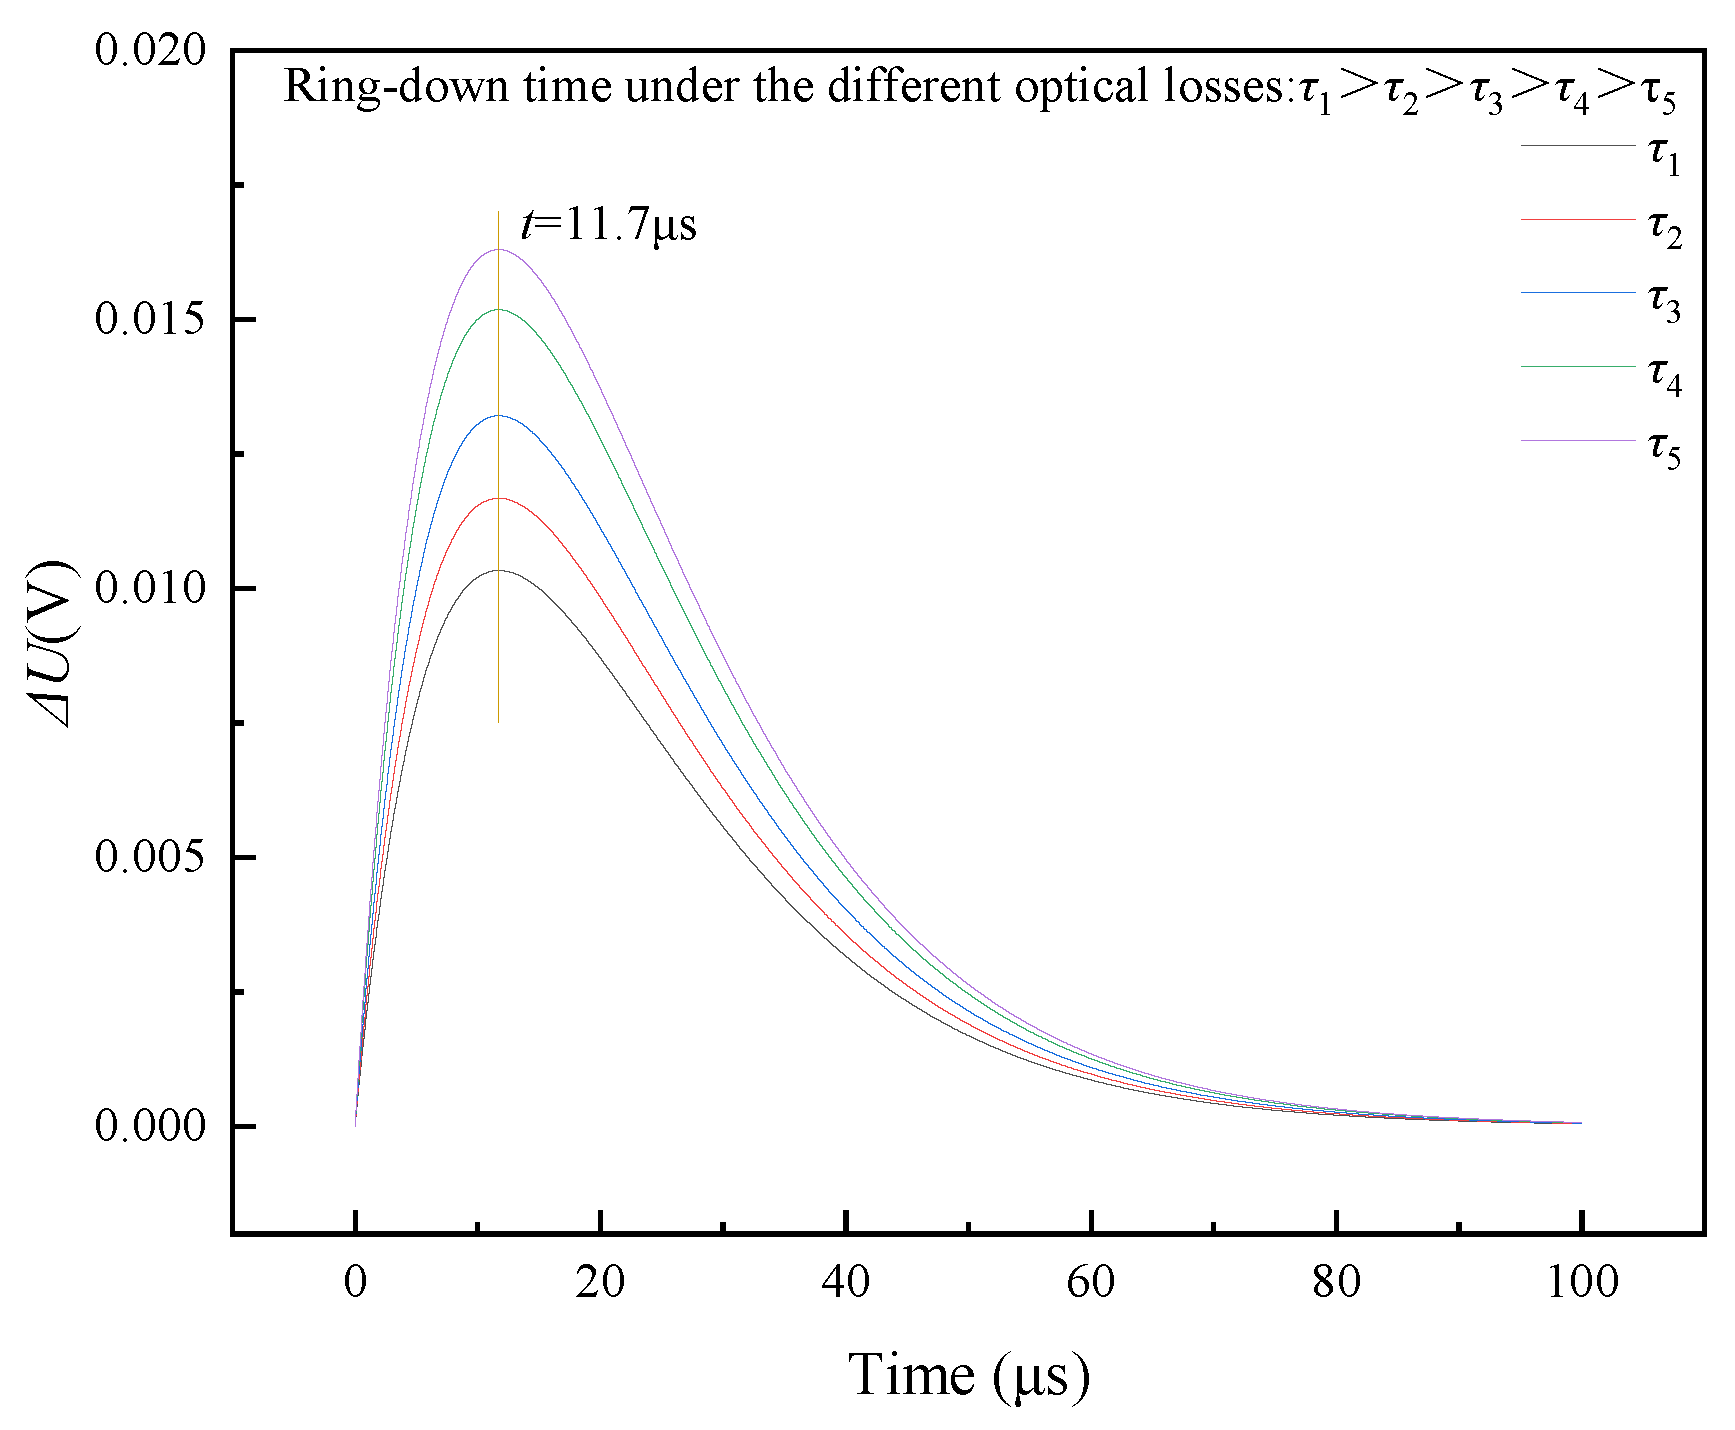
In order to accurately obtain the time corresponding to the maximum voltage change under the different sensor losses, it was necessary to solve the voltage difference between the ring-down curve under the background gas and the ring-down curve under different sensor optical losses, and find the time corresponding to the maximum voltage difference. Equation (5) could be used to solve this:
In the equation, Δ
U represents the voltage difference, and
Ub and
τb represent the voltage value and the ring-down time of the ring-down curve under the background gas. The values
Un and
τn represent the voltage value and the ring-down time of the ring-down curve under the different optical losses of the sensor. Let
n be 1, 2, 3, 4, 5,
τ1 >
τ2 >
τ3 >
τ4 >
τ5. Then, the curve of the voltage difference between the background gas ring-down curve and the ring-down curve under the different optical losses could be obtained, as shown in
Figure 10. It can be seen that when the time
t was 11.7 μs, the voltage difference had the largest variation. Therefore, the pulse signal closest to the time value was the pulse signal with the largest voltage signal change, due to the change of optical loss, which could be used as the pulse signal for judging the detection limit.
Through analysis of the experimental results, it was found that the amplitude of the third pulse signal in the original signal had the largest change with the concentration change. Therefore, it could be defined that the detection limit of the system was that the third pulse signal amplitude difference between the background gas and the detection limit concentration value was not less than the instrument resolution, which could be expressed by the following equation:
In the equation, ΔUp3 represents the amplitude difference of the third pulse signal. Vmin represents the instrument resolution. The oscilloscope was a Tektronix MSO44, and the resolution was 1 mV. The value tp3 represents the time corresponding to the third pulse signal and τmin represents the ring-down time corresponding to the detection limit concentration value. By substituting τmin into the fitting curve of the ring-down time and CO concentration, the detection limit of the system for CO could be calculated. After calculation, the detection limit of CO for the system was 19.951 ppm.
3.4.4. Stability Analysis
The repeatability of single-point measurement refers to the degree of difference between repeated measurements of the same measure and under the same working conditions, expressed as the relative standard deviation of multiple measurements. CO gas with a concentration of 100 ppm was introduced into the gas detection cell, and the value recorded after the gas concentration in the gas detection cell stabilized. The ring-down time was calculated and the result is shown in
Figure 11. The standard deviation of single-point repeatability was 0.00356, indicating that the detection system had good single-point repeatability.
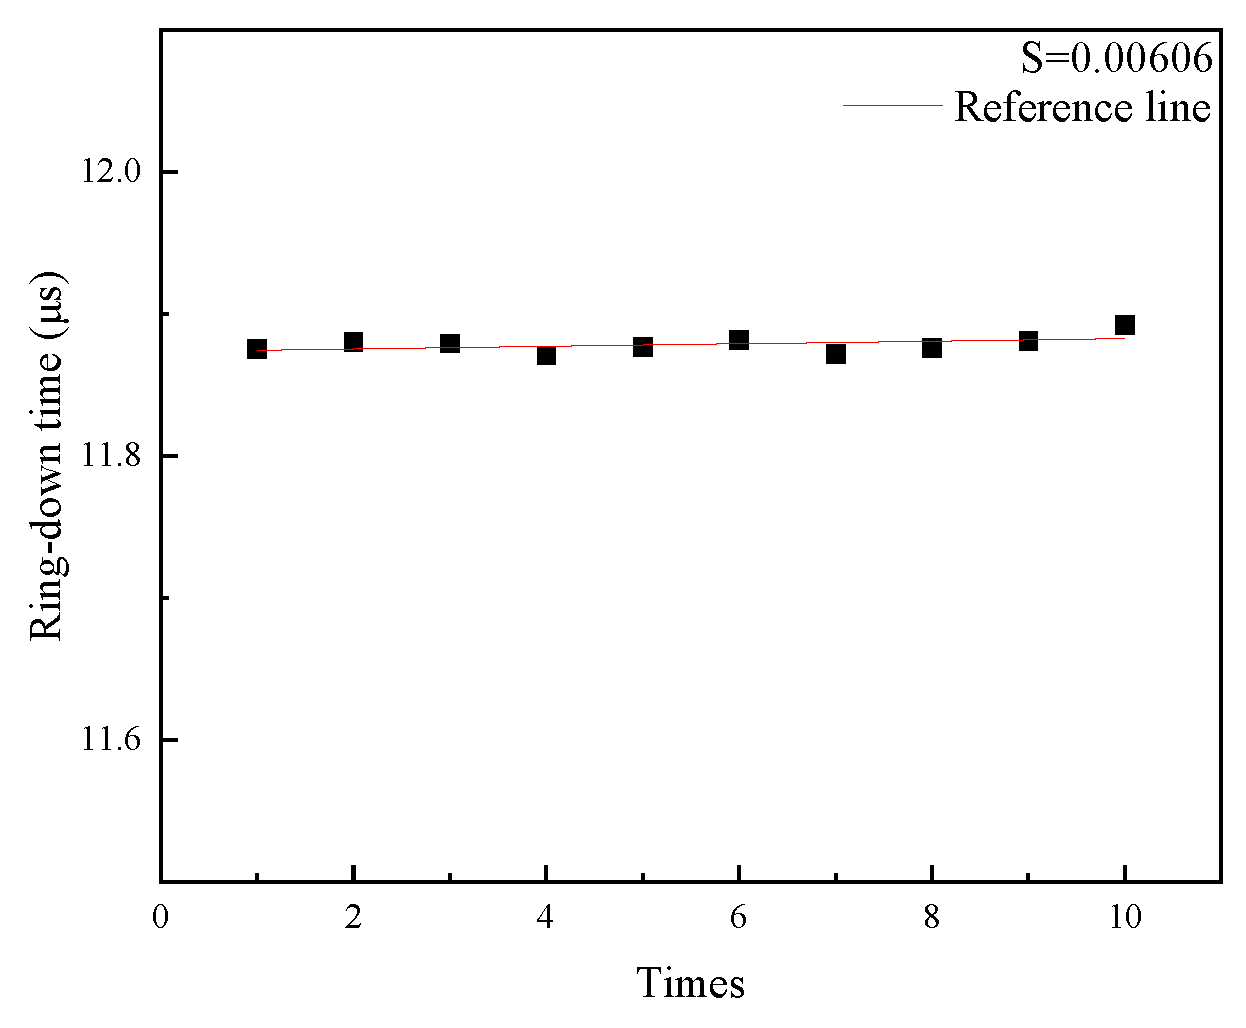
Stability refers to the ability of the detection system to remain constant for a specified period when its performance remains constant under specified working conditions. In the stability experiment, CO gas with a concentration of 100 ppm was introduced into the gas detection cell. After it stabilized, the value was recorded every 5 min and its ring-down time calculated. The results are shown in
Figure 12. It can be seen that after a long period of experiment, the ring-down time fluctuated slightly, and the standard deviation was 0.00606. Therefore, the detection system had good stability.
4. Conclusions
In this paper, a carbon nanotube-coated fiber gas sensor was proposed, which has the potential to act as a built-in sensor for online monitoring of SF6 decomposition components in SF6 electrical equipment. A CO gas detection method, based on a coated fiber gas sensor, was realized in the FLRD system, which could also provide technical reference for other fields with CO detection needs. The following conclusions were obtained:
1. Among the four typical SF6 decomposition components of SO2, SO2F2 and SOF2 and CO, the carbon nanotube-coated fiber gas sensor is more sensitive to CO gas. From the theoretical analysis of the adsorption properties of the material, single-walled carbon nanotubes have the best adsorption effect on CO molecules under the same conditions.
2. The FLRD system, based on the carbon nanotube-coated fiber gas sensor, can realize CO detection at room temperature. With increase of CO concentration, its optical loss gradually increases. There is a good linear relationship between the 0~200 ppm CO and the ring-down time, with R2 being 0.984.
3. The carbon nanotube-coated fiber gas sensor combined with the FLRD detection system can achieve quantitative detection of 0~200 ppm CO, with a maximum error of 1.916 ppm and a maximum relative error of 4.10%. The sensitivity of the system is 0.183 ns/ppm, and the detection limit of the system is 19.951 ppm. It has good detection stability, the standard deviation of single-point repeatability is 0.00356, and the standard deviation of long period of experiment is 0.00606.
In the future, various gas-sensitive nanomaterials could be used to study the detection ability of nanomaterial-coated fiber gas sensors for SF6 decomposition components. At the same time, in-depth research on gas detection performance optimization methods could be conducted from the aspects of micro-fiber structural parameters and demodulation technology. The feasibility of multi-SF6 decomposition component detection in multi-fiber gas sensor distributed sensing could be explored.


