Ultra-Sensitive Intensity Modulated Strain Sensor by Tapered Thin-Core Fiber Based Modal Interferometer


Abstract
:1. Introduction
2. Principles and Simulations
3. Fabrication
4. Experiments and Results
5. Discussions
6. Conclusions
Author Contributions
Funding
Institutional Review Board Statement
Informed Consent Statement
Data Availability Statement
Conflicts of Interest
References
- Islam, R.; Ali, M.M.; Lai, M.-H.; Lim, K.-S.; Ahmad, H. Chronology of Fabry-Perot Interferometer Fiber-Optic Sensors and Their Applications: A Review. Sensors 2014, 14, 7451–7488. [Google Scholar] [CrossRef] [Green Version]
- Peng, J.; Zhou, X.; Jia, S.; Jin, Y.; Xu, S.; Chen, J. High precision strain monitoring for lithium ion batteries based on fiber Bragg grating sensors. J. Power Sources 2019, 433, 226692. [Google Scholar] [CrossRef]
- Koyama, Y.; Nishiyama, M.; Watanabe, K. Smart Textile Using Hetero-Core Optical Fiber for Heartbeat and Respiration Monitoring. IEEE Sens. J. 2018, 18, 6175–6180. [Google Scholar] [CrossRef]
- Lopez-Higuera, J.M.; Cobo, L.R.; Incera, A.Q.; Cobo, A. Fiber Optic Sensors in Structural Health Monitoring. J. Light. Technol. 2011, 29, 587–608. [Google Scholar] [CrossRef]
- Miliou, A. In-Fiber Interferometric-Based Sensors: Overview and Recent Advances. Photonics 2021, 8, 265. [Google Scholar] [CrossRef]
- Zhang, L.; Liu, Y.; Gao, X.; Xia, Z. High temperature strain sensor based on a fiber Bragg grating and rhombus metal structure. Appl. Opt. 2015, 54, E109–E112. [Google Scholar] [CrossRef]
- Feng, W.; Yang, X.; Yu, J.; Yue, Z. Strain and temperature sensor based on fiber Bragg grating cascaded bi-tapered four-core fiber Mach–Zehnder interferometer. J. Phys. D Appl. Phys. 2020, 53, 465104. [Google Scholar] [CrossRef]
- Wang, Y. Review of long period fiber gratings written by CO2 laser. J. Appl. Phys. 2010, 108, 081101. [Google Scholar] [CrossRef]
- Ascorbe, J.; Coelho, L.; Santos, J.L.; Frazao, O.; Corres, J. Temperature Compensated Strain Sensor Based on Long-Period Gratings and Microspheres. IEEE Photon. Technol. Lett. 2018, 30, 67–70. [Google Scholar] [CrossRef]
- Carlos, M.; Arnaldo, L.J.; Rui, M.; Maria, D.; Catia, L.; Paulo, A.; Beatriz, O.; Paulo, A. Advances on polymer optical fiber gratings using a KrF pulsed laser system operating at 248 nm. Fibers 2018, 6, 13. [Google Scholar] [CrossRef] [Green Version]
- Soge, A.O.; Dairo, O.F.; Sanyaolu, M.E.; Kareem, S.O. Recent developments in polymer optical fiber strain sensors: A short review. J. Opt. 2021, 50, 299–313. [Google Scholar] [CrossRef]
- Leal-Junior, A.; Avellar, L.; Frizera, A.; Marques, C. Smart textiles for multimodal wearable sensing using highly stretchable multiplexed optical fiber system. Sci. Rep. 2020, 10, 13867. [Google Scholar] [CrossRef] [PubMed]
- Qureshi, K.K.; Liu, Z.; Tam, H.-Y.; Zia, M.F. A strain sensor based on in-line fiber Mach–Zehnder interferometer in twin-core photonic crystal fiber. Opt. Commun. 2013, 309, 68–70. [Google Scholar] [CrossRef]
- Gong, H.; Chan, C.C.; Chen, L.; Dong, X. Strain Sensor Realized by Using Low-Birefringence Photonic-Crystal-Fiber-Based Sagnac Loop. IEEE Photon. Technol. Lett. 2010, 22, 1238–1240. [Google Scholar] [CrossRef]
- Gao, X.; Ning, T.; Zhang, C.; Xu, J.; Zheng, J.; Lin, H.; Li, J.; Pei, L.; You, H. A dual-parameter fiber sensor based on few-mode fiber and fiber Bragg grating for strain and temperature sensing. Opt. Commun. 2020, 454, 124441. [Google Scholar] [CrossRef]
- Dong, L.; Gang, T.; Bian, C.; Tong, R.; Wang, J.; Hu, M. A high sensitivity optical fiber strain sensor based on hollow core tapering. Opt. Fiber Technol. 2020, 56, 102179. [Google Scholar] [CrossRef]
- Zhu, T.; Wu, D.; Liu, M.; Duan, D.-W. In-Line Fiber Optic Interferometric Sensors in Single-Mode Fibers. Sensors 2012, 12, 10430–10449. [Google Scholar] [CrossRef] [Green Version]
- Zheng, J.; Yan, P.; Yu, Y.; Ou, Z.; Wang, J.; Chen, X.; Du, C. Temperature and index insensitive strain sensor based on a photonic crystal fiber in line Mach–Zehnder interferometer. Opt. Commun. 2013, 297, 7–11. [Google Scholar] [CrossRef]
- Dash, J.N.; Negi, N.; Jha, R. Graphene Oxide Coated PCF Interferometer for Enhanced Strain Sensitivity. J. Light. Technol. 2017, 35, 5385–5390. [Google Scholar] [CrossRef]
- Pang, M.; Xiao, L.M.; Jin, W.; Cerqueira S., A. Birefringence of Hybrid PCF and Its Sensitivity to Strain and Temperature. J. Light. Technol. 2012, 30, 1422–1432. [Google Scholar] [CrossRef]
- Du, J.; Li, L.; Fan, X.; Liu, Q.; He, Z. Sensitivity Enhancement for Fiber Bragg Grating Sensors by Four Wave Mixing. Photonics 2015, 2, 426–439. [Google Scholar] [CrossRef] [Green Version]
- Han, T.; Liu, Y.-G.; Wang, Z.; Guo, J.; Yu, J. A High Sensitivity Strain Sensor Based on the Zero-Group-Birefringence Effect in a Selective-Filling High Birefringent Photonic Crystal Fiber. IEEE Photon. J. 2018, 10, 7100109. [Google Scholar] [CrossRef]
- Liu, Y.; Yu, C.Y. Highly stretchable hybrid silica/polymer optical fiber sensors for large-strain and high-temperature application. Opt Express 2019, 27, 20107–20116. [Google Scholar] [CrossRef]
- Ruan, J. High sensitivity Sagnac interferometric strain sensor based polarization maintaining fiber enhanced coupling. IET Optoelectron. 2021, 15, 48–51. [Google Scholar] [CrossRef]
- Yin, C.C.; Cao, Z.G.; Zhang, Z.; Shui, T.; Wang, R.; Wang, J.; Lu, L.; Zhen, S.L.; Yu, B.L. Temperature-independent ultrasensitive Fabry-Perot all-fiber strain sensor based on a bubble-expanded microcavity. IEEE Photon. J. 2014, 6, 1–9. [Google Scholar] [CrossRef]
- Tian, J.J.; Li, Z.G.; Sun, Y.X.; Yao, Y. High-sensitivity fiber-optic strain sensor based on the vernier effect and separated Fabry-Perot interferometers. J. Lightw. Technol. 2019, 37, 5609–5618. [Google Scholar] [CrossRef]
- Kang, J.; Yang, J.; Zhang, X.; Liu, C.; Wang, L. Intensity Demodulated Refractive Index Sensor Based on Front-Tapered Single-Mode-Multimode-Single-Mode Fiber Structure. Sensors 2018, 18, 2396–2404. [Google Scholar] [CrossRef] [Green Version]
- Zheng, Y.; Shum, P.P.; Liu, S.; Li, B.; Auguste, J.-L.; Humbert, G.; Luo, Y. Strain sensitivity enhancement based on periodic deformation in hollow core fiber. Opt. Lett. 2020, 45, 3997–4000. [Google Scholar] [CrossRef] [PubMed]
- Wang, Y.; Shen, C.; Lou, W.; Shentu, F. Intensity modulation type fiber-optic strain sensor based on a Mach–Zehnder interferometer constructed by an up-taper with a LPG. Opt. Commun. 2016, 364, 72–75. [Google Scholar] [CrossRef]
- Zhang, H.; Zhang, M.; Kang, J.; Zhang, X.D.; Yang, J.R. High sensitivity fiber-Optic strain sensor based on modified microfiber-assisted open-cavity Mach-Zehnder interferometer. J. Lightw. Technol. 2021, 39, 4556–4563. [Google Scholar] [CrossRef]
- Khalifa, A.B.; Cherif, R.; Salem, A.B. Ultrahigh sensitivity with different taper geometries of thin-core fiber modal interferometer for refractive index sensing. Opt. Eng. 2019, 58, 026109. [Google Scholar] [CrossRef]
- Huang, X.; Li, X.; Yang, J.; Tao, C.; Guo, X.; Bao, H.; Yin, Y.; Chen, H.; Zhu, Y. An in-line Mach-Zehnder Interferometer Using Thin-core Fiber for Ammonia Gas Sensing with High Sensitivity. Sci. Rep. 2017, 7, 44994. [Google Scholar] [CrossRef] [Green Version]
- Kong, Y.; Shu, X.; Cao, H.; Deng, J. Thin-Core Fiber Taper-Based Multi-Mode Interferometer for Refractive Index Sensing. IEEE Sens. J. 2018, 18, 8747–8754. [Google Scholar] [CrossRef]
- Zhang, X.; Liu, C.; Liu, J.; Yang, J. Single Modal Interference-Based Fiber-Optic Sensor for Simultaneous Measurement of Curvature and Strain with Dual-Differential Temperature Compensation. IEEE Sens. J. 2018, 18, 8375–8380. [Google Scholar] [CrossRef]
- Hou, L.T.; Liu, J.P.; Liu, X.J.; Zhang, X.D.; Yang, J.R.; Ran, L.L. Comparisons of Strain Response in Symmetric and Asymmetric Single-Mode-Thin-Core Single-Mode Fiber Structures. In Proceedings of the Asia Communication and Photonics (ACP), M4A.135, Chengdu, China, 2–5 November 2019. [Google Scholar]
- Yoon, M.-S.; Park, S.; Han, Y.-G. Simultaneous Measurement of Strain and Temperature by Using a Micro-Tapered Fiber Grating. J. Light. Technol. 2012, 30, 1156–1160. [Google Scholar] [CrossRef]


| Fibers | nco/ncl | Diameter (μm) | Length |
|---|---|---|---|
| lead-in/lead-out SMF | 1.4501/1.445 | 8.3/125 | – |
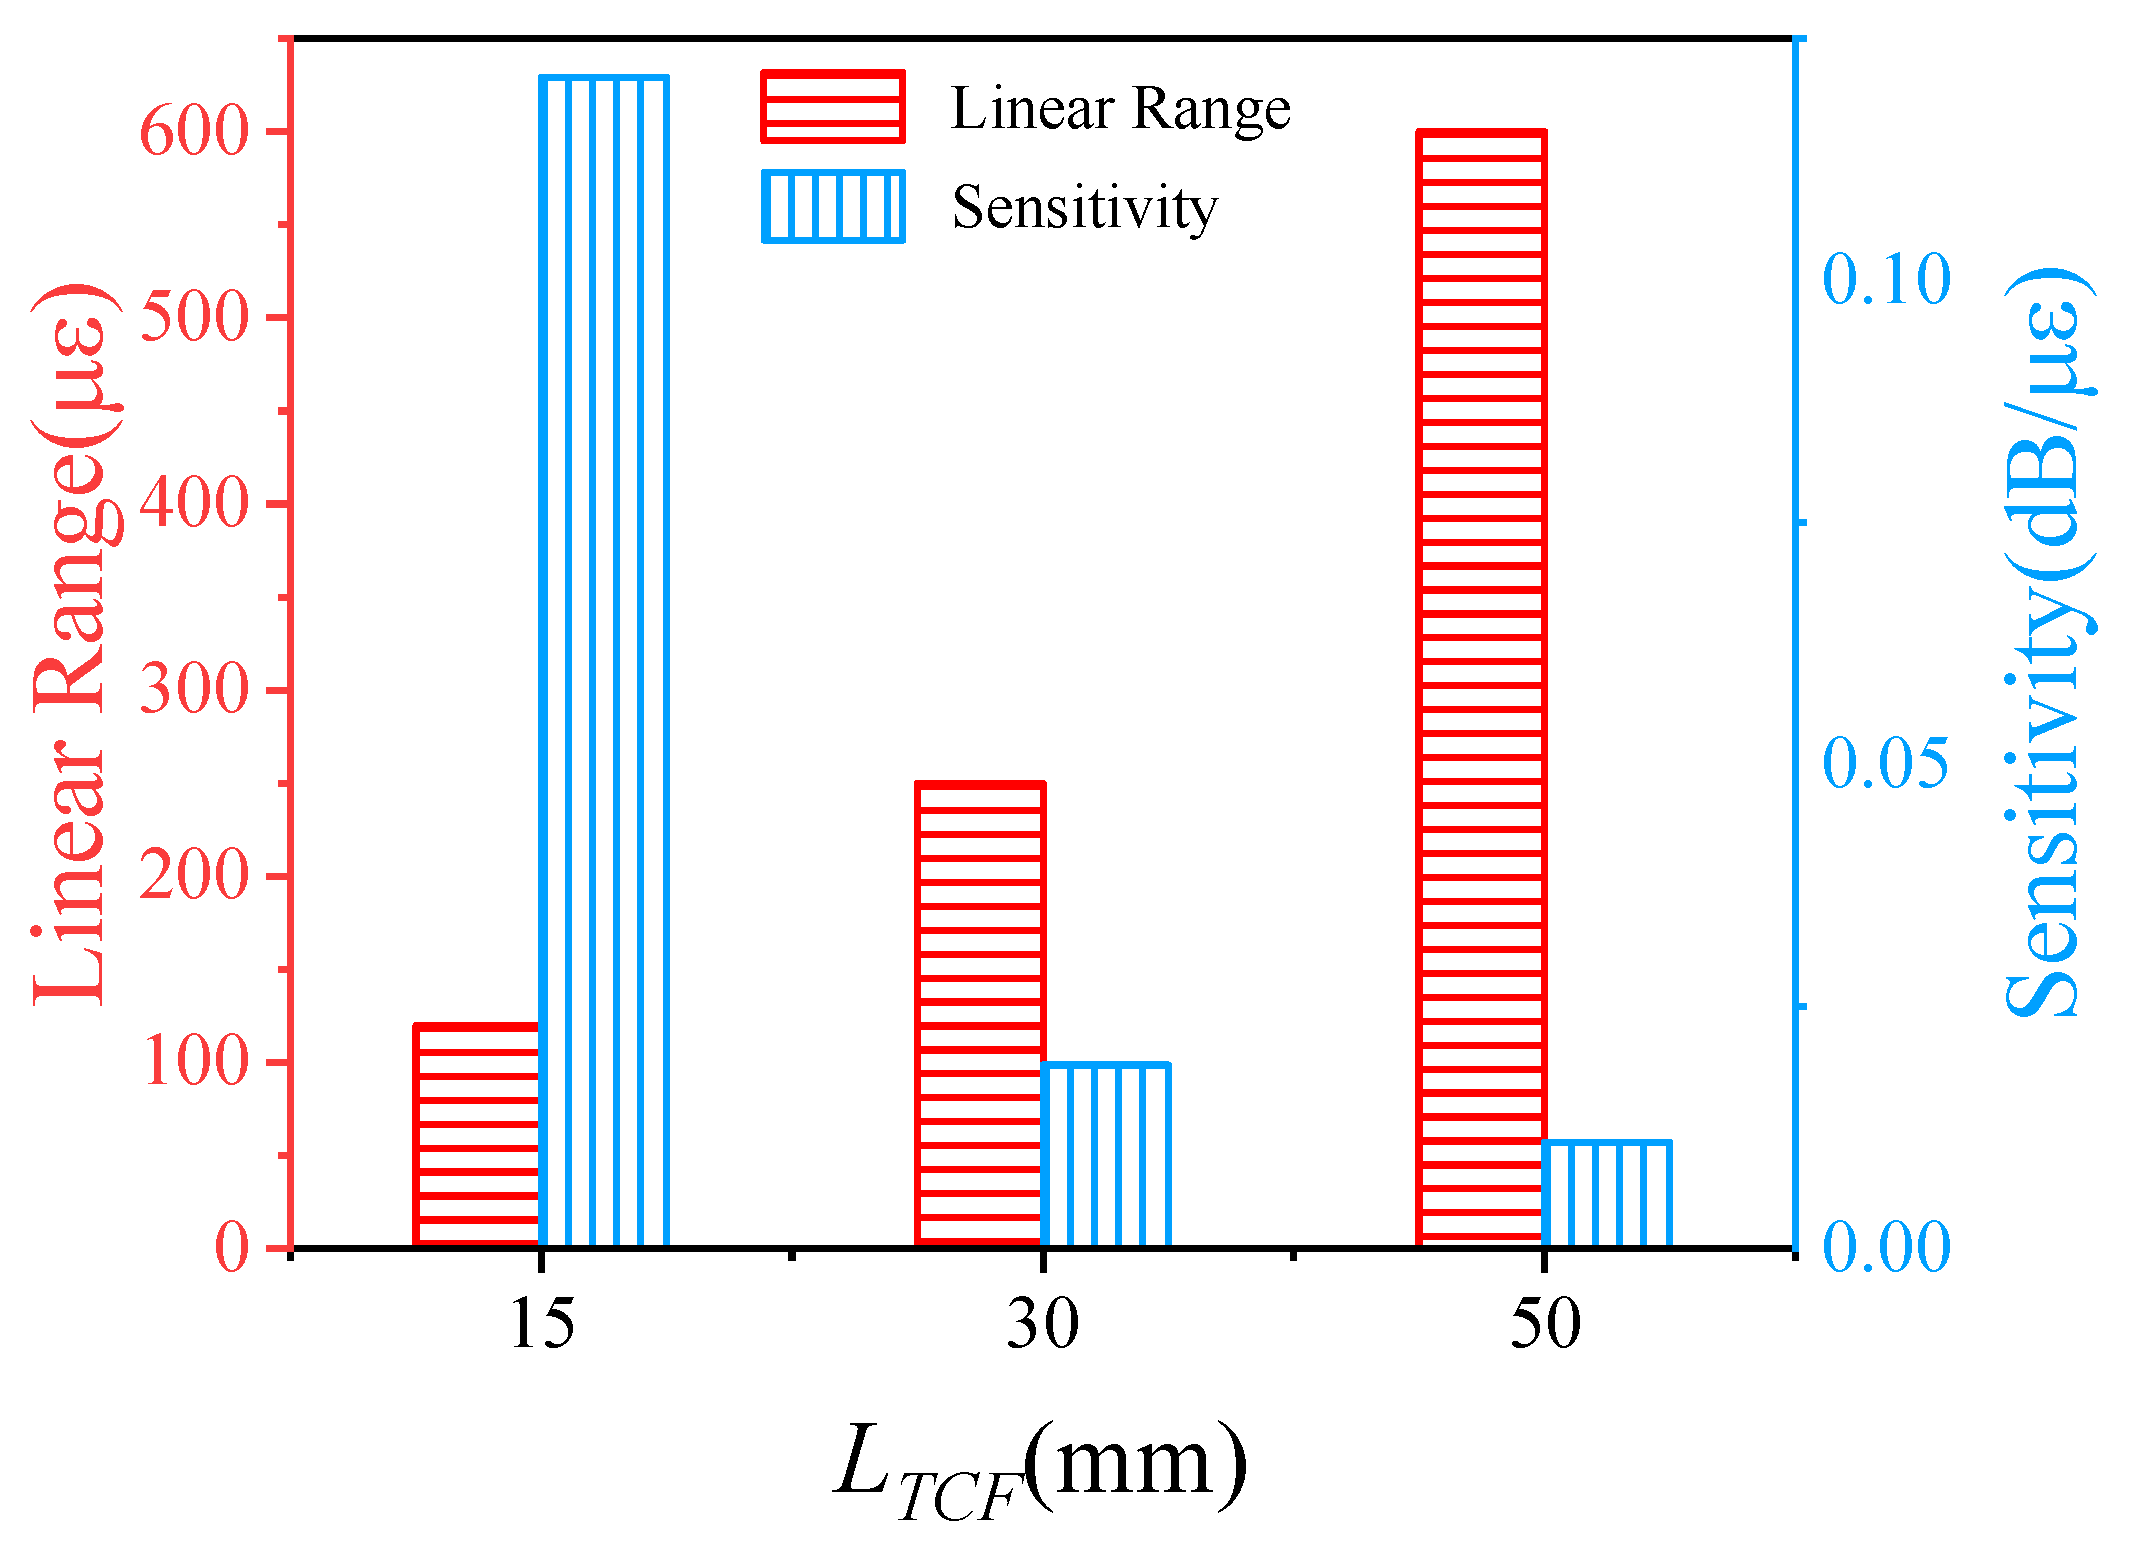
| un-tapered TCF | 1.46/1.445 | 3.6/125 | 15–50 mm |
| tapered TCF | 1.46/1.445 | 0.3–1.44/10–50 | 800 μm |
| Samples | LTCF (mm) | Transition Areas (μm) | Diameters (μm) | Offset Values (μm) |
|---|---|---|---|---|
| S1 | 50 | 774.4 | 30.12 | 11.78/12.15 |
| S2 | 30 | 765.6 | 32.25 | 12.37/11.93 |
| S3 | 15 | 770.2 | 31.37 | 12.28/12.05 |
| Sturctures | Sensitivity | Detection Resolution | Cross Senstivity | Linear Range | Refs |
|---|---|---|---|---|---|
| Few-mode FBG | 2 pm/με | 30 με | 17.15 με/°C | 0–450 με | [15] |
| SMF-PCF-SMF | 2.1 pm/με | 28.6 με | 6.3 με/°C | 0–3000 με | [18] |
| FBG with FWX | 13.3 pm/με | 4.51 με | 10.6 με/°C | 0–137 με | [21] |
| Filled high birefring-ent PCF | 25 pm/με | 2.4 με | – | 0–61 με | [22] |
| Panda-type PMF | 32 pm/με | 1.875 με | – | 0–900 με | [24] |
| Bubble based micro-cavity | 30.66 pm/με | 1.95 με | 0.04 με/°C | 0–600 με | [25] |
| Dual-micro cavity | 1.15 nm/με | 0.052 με | 0.06 με/°C | 0–230 με | [26] |
| MS-HCF | 0.0036 dB/με | 2.78 με | – | 0–1000 με | [28] |
| Up-tapered LPFG | 0.026 dB/με | 0.38 με | – | 0–590 με | [29] |
| Core-offset TCF | 0.024 dB/με | 0.42 με | – | 0–700 με | [35] |
| MMA-OC | 0.051 dB/με | 0.196 με | 0.106 με/°C | 0–500 με | [30] |
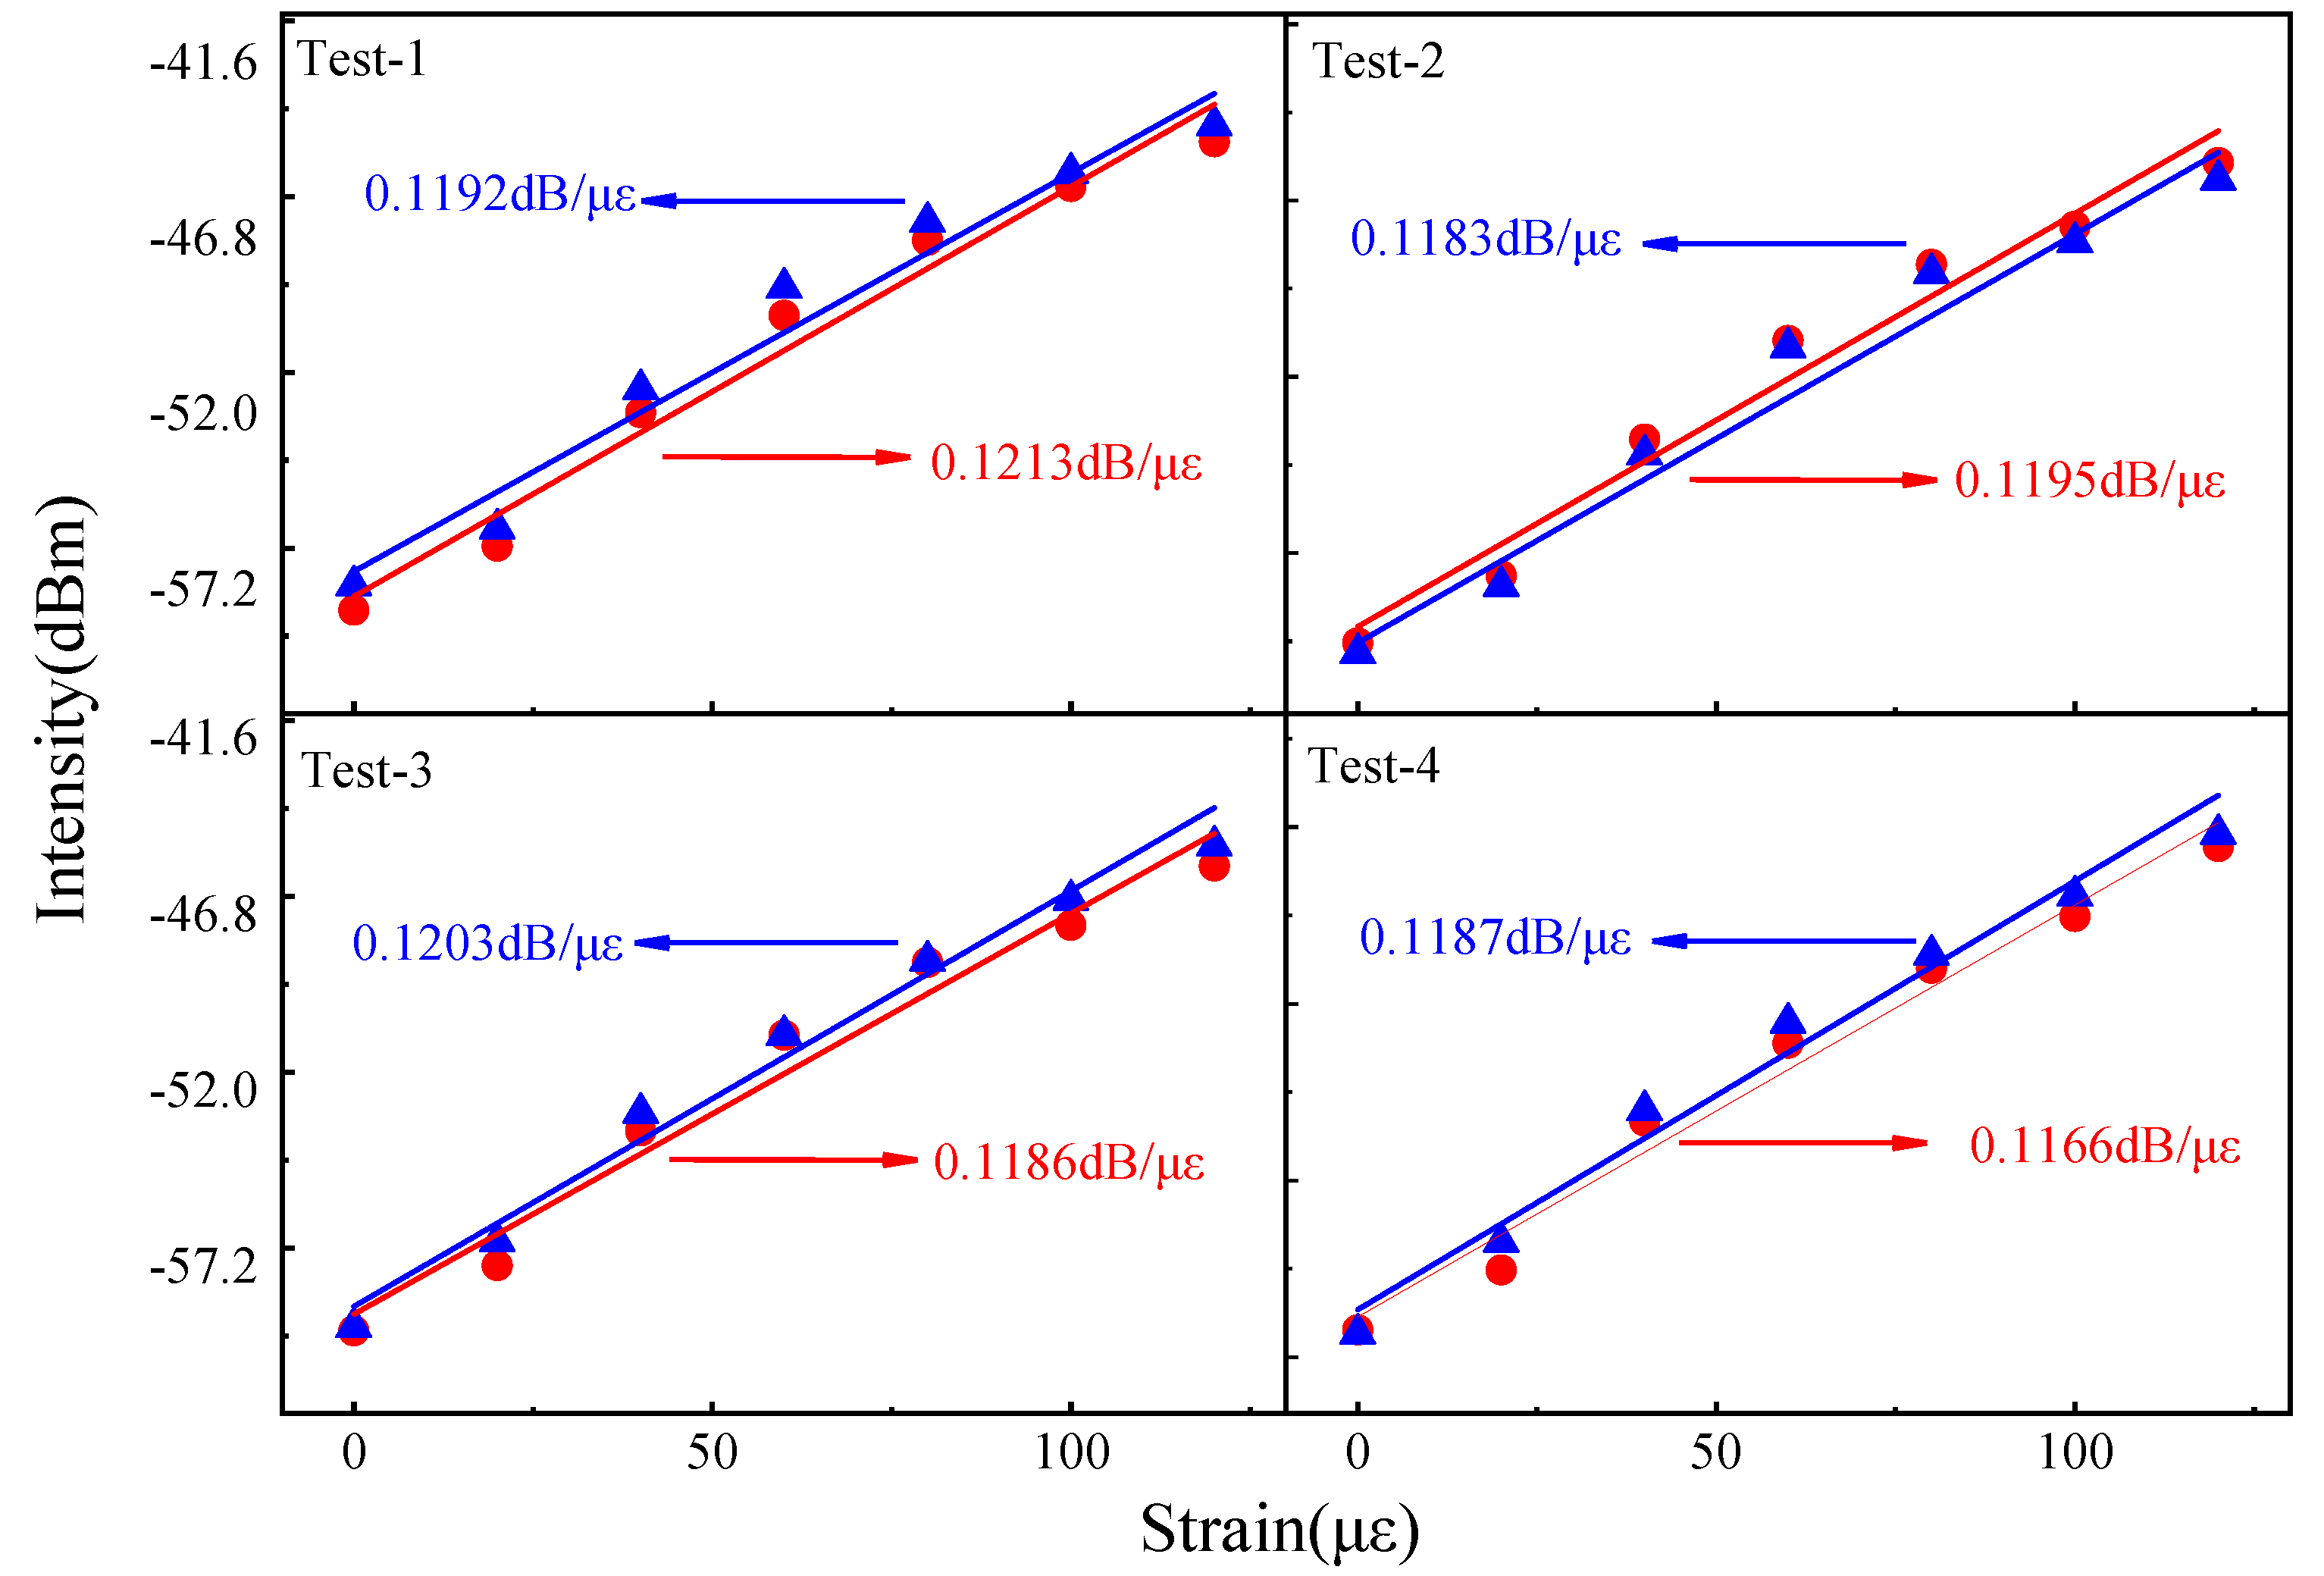
| tapered-TCF | 0.119 dB/με | 0.084 με | 0.32 με/°C | 0–120 με | Our work |
Publisher’s Note: MDPI stays neutral with regard to jurisdictional claims in published maps and institutional affiliations. |
© 2021 by the authors. Licensee MDPI, Basel, Switzerland. This article is an open access article distributed under the terms and conditions of the Creative Commons Attribution (CC BY) license (https://creativecommons.org/licenses/by/4.0/).
Share and Cite
Liu, C.; Sun, D.; Yang, J.; Zhang, H.; Ran, L. Ultra-Sensitive Intensity Modulated Strain Sensor by Tapered Thin-Core Fiber Based Modal Interferometer. Photonics 2021, 8, 372. https://doi.org/10.3390/photonics8090372
Liu C, Sun D, Yang J, Zhang H, Ran L. Ultra-Sensitive Intensity Modulated Strain Sensor by Tapered Thin-Core Fiber Based Modal Interferometer. Photonics. 2021; 8(9):372. https://doi.org/10.3390/photonics8090372
Chicago/Turabian StyleLiu, Chuanxu, Dexue Sun, Jiuru Yang, Hui Zhang, and Lingling Ran. 2021. "Ultra-Sensitive Intensity Modulated Strain Sensor by Tapered Thin-Core Fiber Based Modal Interferometer" Photonics 8, no. 9: 372. https://doi.org/10.3390/photonics8090372