Article

Correlation-Based Out-of-Plane Displacement Measurement for Optical Fiber Material

1
State Key Laboratory of Green Building Materials and Beijing Key Laboratory of Solar Energy and Building Energy-Saving Glass Materials Processing Technology, China Building Materials Academy, Beijing 100024, China
2
Shandong Provincial Key Laboratory of Optics and Photonic Device, Shandong Normal University, Jinan 250358, China
3
CNBM Guangxin Technology Co., Ltd., Zaozhuang 277100, China
*
Author to whom correspondence should be addressed.
Photonics 2021, 8(9), 348; https://doi.org/10.3390/photonics8090348
Submission received: 16 July 2021 / Revised: 14 August 2021 / Accepted: 22 August 2021 / Published: 25 August 2021
(This article belongs to the Section Optical Communication and Network)

Abstract

:
Due to the monitoring requirement of optical fiber industrial production, an out-of-plane displacement measurement method is proposed. Firstly, the in-plane displacements between two consecutive images, captured through a microscope with a CCD camera, are estimated by the Digital Speckle Correlation Method (DSCM). Subsequently, the out-of-plane displacement of optical fiber material can be obtained by the wedge model. Finally, the effectiveness of the method is verified experimentally by comparing the measurement data of routine practice with its theoretical values. Simulation and experimental results indicate that the absolute errors and the relative errors of the measurement by the optical microscope with a magnification of 50× are less than ±0.2 μm and 5%, respectively. The new method only needs two images obtained by the microscopic imaging system with a single camera to accomplish the measurement, which can significantly reduce the measurement time and complexity of the arrangement. Further, the method needs neither frequency domain conversion nor phase unwrapping operation, therefore, it is especially suitable for dynamic out-of-plane displacement measurement. The proposed method has been applied to the industrial uniformity and micro–nano-scale deformation monitoring of optical fiber image transmission materials.

1. Introduction

Optical fiber material (OFM), such as fiber-optic plate (FOP), fiber-optic inverter(FOI), and micro-channel plate (MCP) are mainly used to prepare photomultiplier devices that have been extensively applied in the fields of low-light night vision, electronics, aerospace and other fields [1,2,3]. However, during the course of service and production, the surface of OFM will become deformed due to physical or chemical processes such as polishing, acid etching, and hydrogen reduction. Although it is micro-scale deformation, the properties and performance of OFM will be seriously affected. For instance, in a night vision photomultiplier tube, once the coupling gap between MCP and FOP increases by 0.1 mm, the resolution of the photomultiplier tube will decrease by more than 20% [4]. Therefore, it is necessary to detect and monitor the deformation of OFM in practice in order to ensure the performance of the device works well.
Currently, there exist many out-of-plane displacement measurement methods, based mainly on laser spot scanning [5], interferometry [6,7], and fringe projection techniques [8,9]. However, due to the constraints of the detecting conditions, these methods cannot work perfectly in these applications. Despite the high-precision result, the scanning technique cannot realize rapid detection due to the long scanning time; although optical interferometry can easily obtain the deformation characteristics of OFM, it is not suitable for industrial detection due to the requirement of a high-level detecting environment and the complicated setup. Fringe projection is an alternative full-field optical technique that can be used to determine displacements in the direction of the camera optical axis for a deformed object. However, since the diameter of the deform area is usually less than 13 cm, especially for the OFM which consists of 5 μm monofibers, small area fringe projection is a troublesome task for applications. Moreover, most interferometry and fringe projection techniques need phase unwrapping operation. Even though numerous algorithms have been developed, phase unwrapping is a challenging task in industrial detection. Hence, it is meaningful to put forward a new method for OFM deformation detection.
Correlation-based displacement measurement methods, such as the digital image correlation (DIC) method [10,11] and the digital speckle correlation method (DSCM) [12], are 2D displacement measurement techniques that utilize block matching algorithms to obtain the deformation of an object. Since then, these methods have been widely used in experimental mechanics, real-time measurement, and microscale deformation measurement, because of their advantages of high accuracy, simple experimental setup, and noncontact for micro-deformation. Nevertheless, since the correlation-based methods are insensitive to out-of-plane deformation, multiple cameras and images are often required during measurement. Considering the inevitable oscillation and space restriction, these multi-view correlation-based methods are not suitable for industrial detection [13]. It is worth mentioning that many researchers proposed a Fiber Specklegram Sensor (FSS) method [14,15,16] to measure the displacement of a microbend on an optical fiber, which provided a new approach for out-of-plane displacement measurement. However, OFM is a kind of inflexible image transmission component that is made of millions of glass fibers and is hard to generate high-quality specklegrams of the fiber end facet due to the short length of OFM (the length range of OFM is 1–50 mm). Consequently, the FSS method also cannot satisfy the deformation detecting requirement of OFM.
In this paper, we present a novel correlation-based out-of-plane displacement measurement method. Once the in-plane displacements between two consecutive frames are determined by DSCM, then the out-of-plane displacement map can be obtained by the wedge model. Meanwhile, in order to verify the effectiveness, the new algorithm is applied to simulated and real OFM images captured through a microscope with a CCD camera. Simulation and experimental results show that the proposed algorithm has high precision in deformation measurement. The new method only needs two images obtained by the microscopic imaging system with a single camera, which indicates that the out-of-plane motion information carried by in-plane displacement is fully utilized. It is worth mentioning that neither frequency domain conversion nor phase unwrapping operation is required in this method, which provides a new approach for industrial dynamic deformation measurement.

2. Principle

2.1. Principle of DSCM

In the routine practice of DSCM, a cross-correlation (CC) criterion is predefined to evaluate the similarity between the reference subset and the target subset, i.e., the deformed subset. The zero-mean normalized cross-correlation (ZNCC) coefficient, which is a typical CC criterion, can be given as [17]
C ( Δ u , Δ v ) = i m j m [ f ( x i , y j ) f ¯ ] [ g ( x i + Δ u , y j + Δ v ) g ¯ ] i m j m [ f ( x i , y j ) f ¯ ) ] 2 i m j m [ g ( x i + Δ u , y j + Δ v ) g ¯ ) ] 2
where f ( x , y ) and g ( x , y ) represent gray values of the reference subset and the target subset, respectively. The sizes of these subsets are m × m pixels. Δu and Δv are the integer-pixel displacements in x and y directions and f ¯ and g ¯ represent the average gray values of the reference subset and deformed subset, respectively. The matching procedure is completed through searching the peak position of the distribution of correlation coefficients. Once the correlation coefficient extreme is detected, the position of the deformed subset can be determined. The differences of the positions of the reference subset center and the target subset center yield the displacements u and v at point ( x i , y j ) . However, the displacements in practice are not integers. To further improve the accuracy of DSCM, a certain kind of sub-pixel registration algorithm should be applied. Here, we utilized the correlation coefficient of the gradient-based algorithm which can be expressed by [17]:
C ( Δ u , Δ v ) = { i m j m [ f ( x i , y j ) f ¯ ] [ g ( x i + Δ u + u , y j + Δ v + v ) g ¯ ] } 2 i m j m [ f ( x i , y j ) f ¯ ) ] 2 i m j m [ g ( x i + Δ u + u , y j + Δ v + v ) g ¯ ) ] 2
where u and v represent the sub-pixel displacements in x and y directions, respectively. We expand g ( x i + Δ u + u , y i + Δ v + v ) g ¯ in a Taylor series and take the first order, then the sub-pixel displacements u and v can be obtained by considering C u = 0 , C v = 0 :
u v = B C E H 1 A D
where
A = i = 1 m j = 1 m F G i = 1 m j = 1 m G G x i = 1 m j = 1 m F G x i = 1 m j = 1 m G 2 ,
B = i = 1 m j = 1 m F G x i = 1 m j = 1 m G G x i = 1 m j = 1 m G x 2 i = 1 m j = 1 m F G ,
C = 2 i = 1 m j = 1 m F G x i = 1 m j = 1 m G G y i = 1 m j = 1 m G G x i = 1 m j = 1 m F G y i = 1 m j = 1 m G x G y i = 1 m j = 1 m F G ,
D = i = 1 m j = 1 m F G i = 1 m j = 1 m G G y i = 1 m j = 1 m F G y i = 1 m j = 1 m G 2 ,
E = 2 i = 1 m j = 1 m F G y i = 1 m j = 1 m G G x i = 1 m j = 1 m G G y i = 1 m j = 1 m F G x i = 1 m j = 1 m G x G y i = 1 m j = 1 m F G ,
H = i = 1 m j = 1 m F G y i = 1 m j = 1 m G G y i = 1 m j = 1 m G y 2 i = 1 m j = 1 m F G ,
G x i , y j = g x i + Δ u , y j + Δ v g ¯ ,
G x = g x g ¯ x , G y = g y g ¯ y ,
F x i , y j = f x i , y j f ¯ .
The x and y subscripts of variables are the partial derivatives. Thus, the velocity field between two consecutive frames, i.e., u = Δ u + u and v = Δ v + v , can be estimated.

2.2. Out-of-Plane Displacement Measurement by Wedge Model

A microscope can mainly be classified into two classes, according to their magnification principle, i.e., optical microscope and electronic microscope. Generally speaking, an optical microscope has lower magnification, but it can show the most authentic feature data of an object. Based on the differential theory, if a deformed object is observed under an optical microscope, all kinds of convex or concave deformation can be treated as a wedge shape, as shown in Figure 1, where point O is the fulcrum, α is the tilt angle, R is the width of image, and R = OA = OA1. When we observe the deformation along the downward direction, it will be found that point A moved to point A’. Therefore, w and d are the out-of-plane displacement and in-plane displacement, respectively.
Once the original and deformed images are captured by the optical microscope, the in-plane displacement d can be easily determined by DSCM. Finally, the out-of-plane displacement w can be calculated by the geometrical relationships:
d = R ( 1 cos α ) α = cos 1 R d R w = R sin α

3. Simulated Results and Analysis

Commonly, the microscopic images of OFM can be treated as 2D Gaussian function array distributions [2,18], as shown in Figure 2a, where the diameter ratio of core glass and cladding glass is set to 5:1. Figure 2b illustrates the deformed image generated by the image spherizing algorithm and the loading angle α = 0.15 rad ≈ 8.599°. All of these simulated images are created by Matlab software. For the convenience of comparison, the sizes of these two images are set as 400 pixels × 400 pixels, and the intensity distributions of two images at x = 200 in the y direction are shown in Figure 2c. It can be seen that the loaded deformation causes an intensity shift in the positive direction of the y axis, which is consistent with the wedge model.
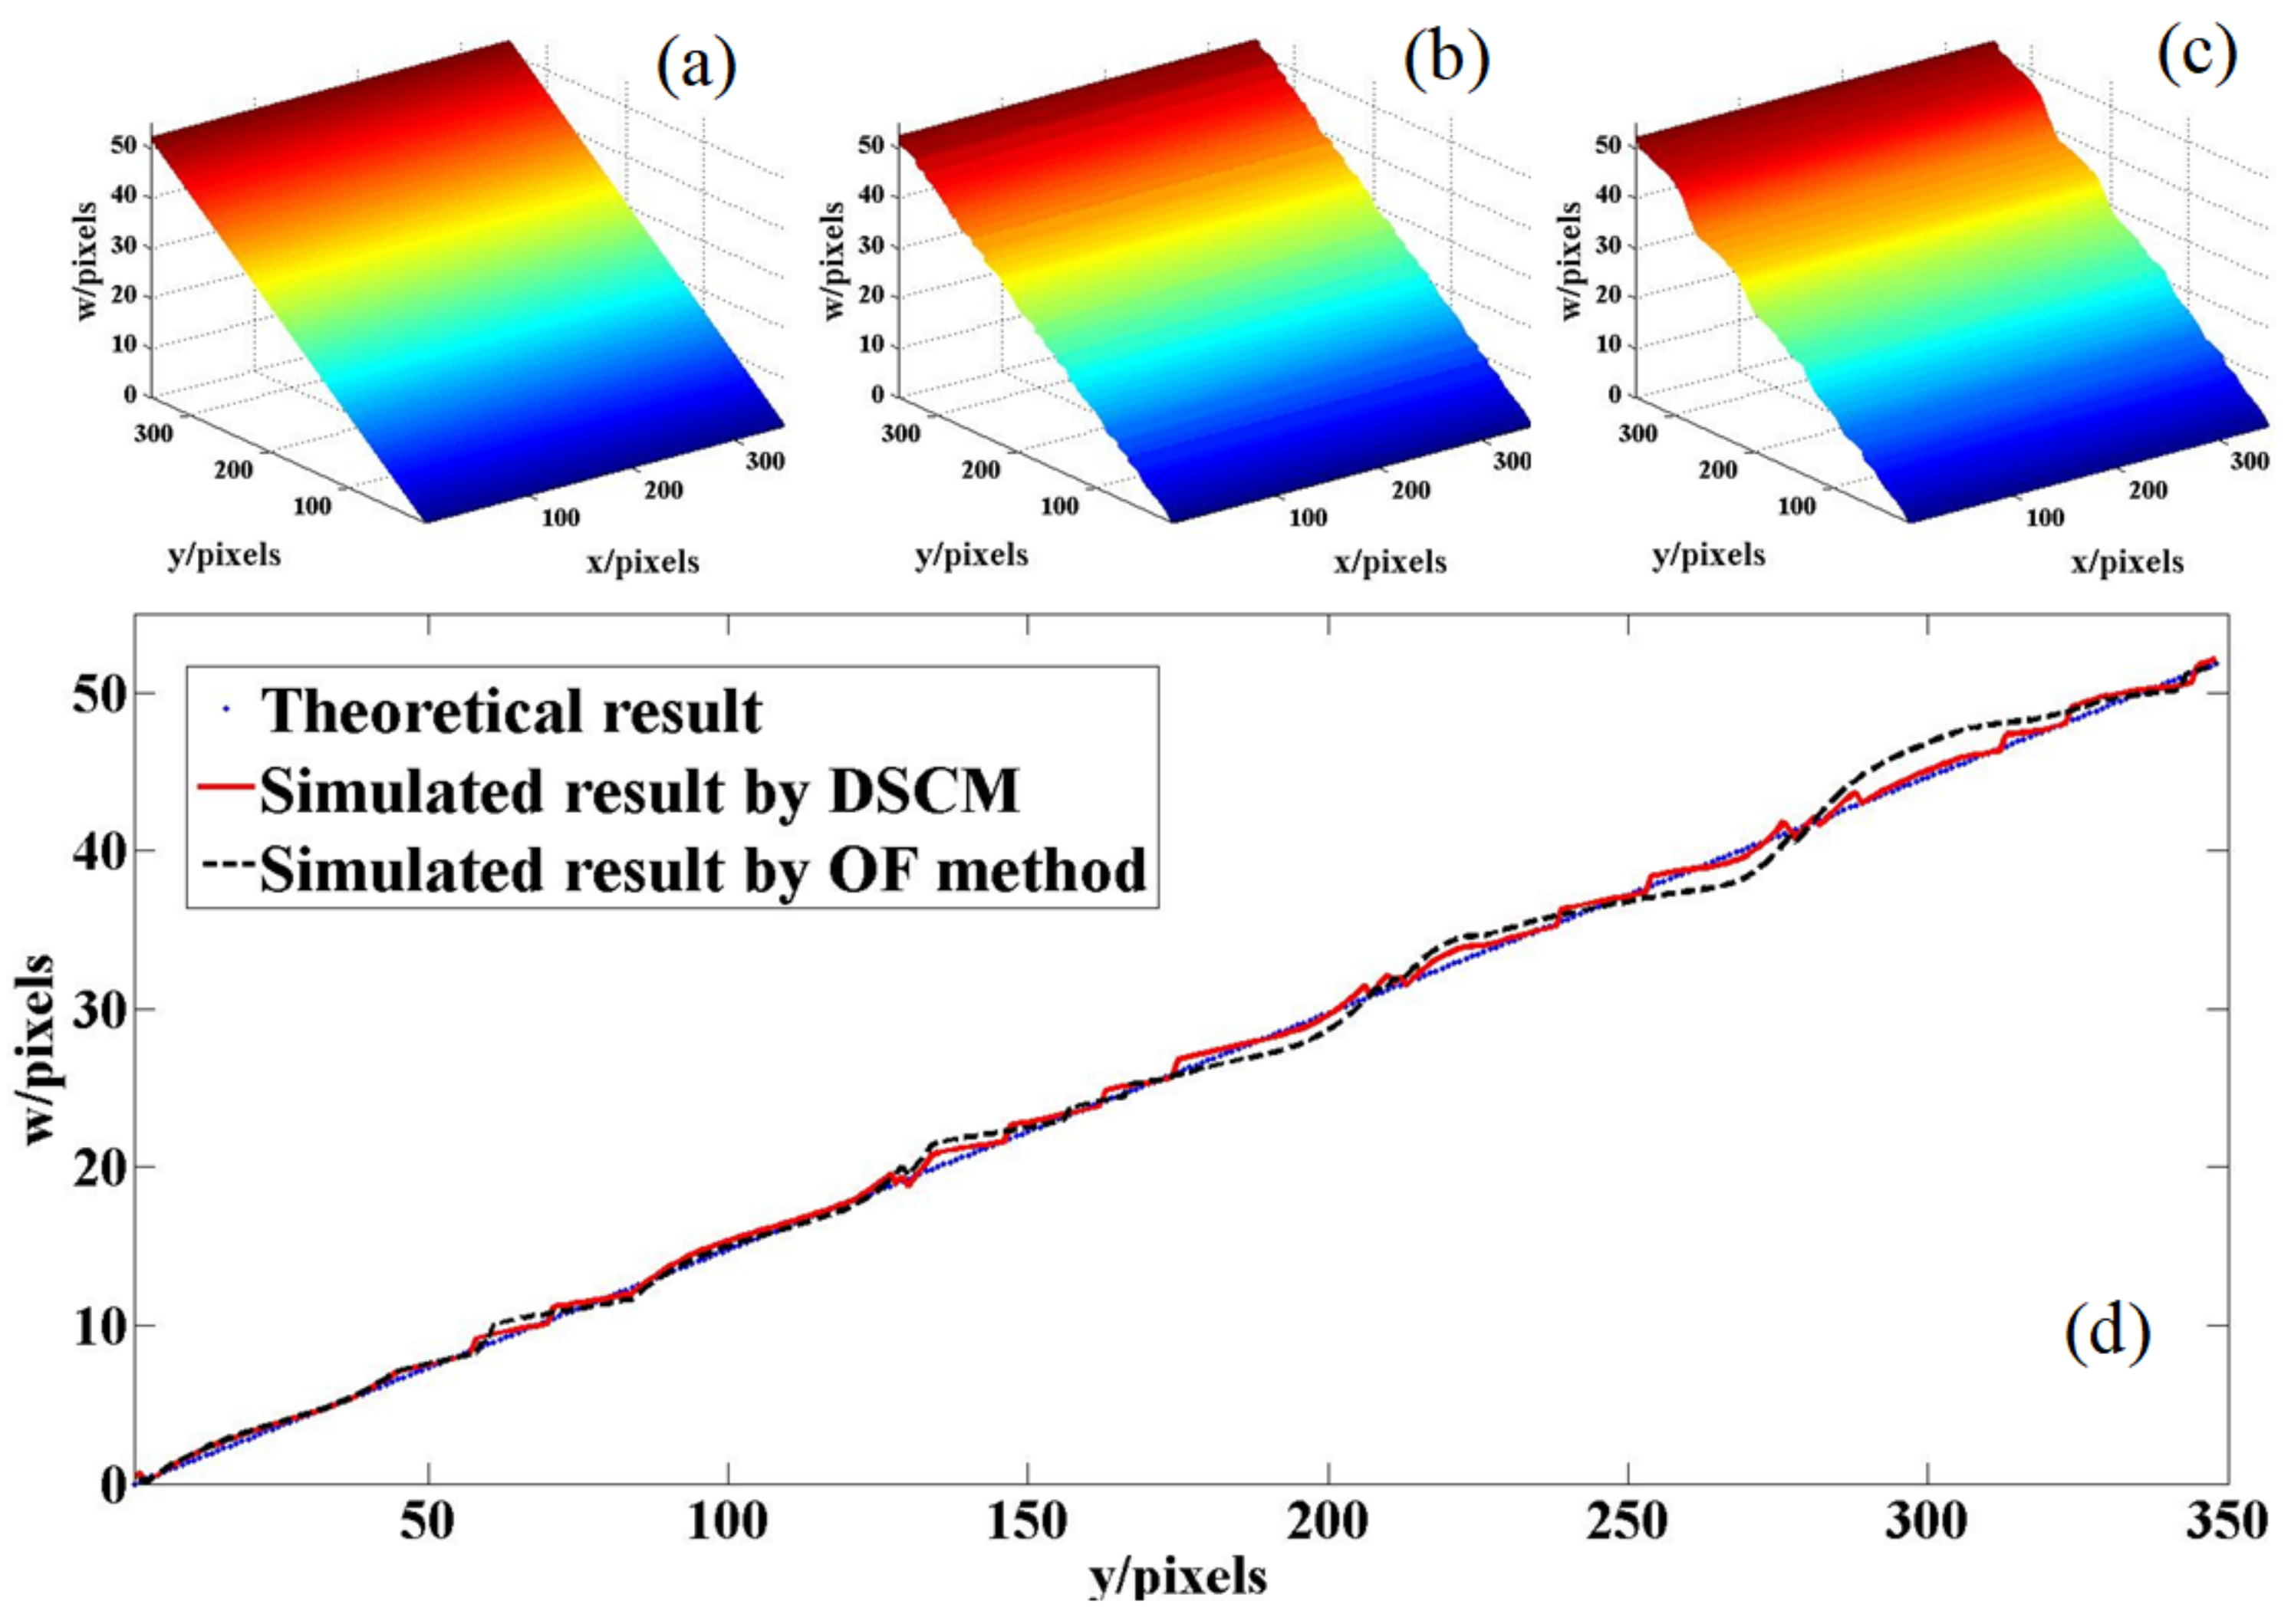
Based on Equation (4), the out-of-plane displacement is extracted by DSCM and the subset is set as 50 pixels × 50 pixels. Due to the inevitable boundary effect of DSCM, the valid region of data is 347 pixels× 347 pixels in the center of the image. Figure 3a,b show the theoretical and simulated results, respectively, and it can be observed that out-of-plane displacements reach a maximum at y = 347 pixels in the x direction. The mean value of the maxima in Figure 3b is 52.39 pixels and the corresponding tilt angle α = 0.1498 rad ≈ 8.586°, which is consistent with the theoretical values (52.47 pixels, 8.599°). Since the optical flow (OF) algorithm is a mature method for in-plane displacement measurement [6,9], for comparison, the simulated result by the Horn–Schunck (HS)-OF method [6] is shown in Figure 3c. Figure 3d shows the cross-section data comparison of Figure 3a–c in the y direction at x = 174 for further analysis. It can be seen that in order to ensure continuity and smoothness, the errors of the HS-OF method are significantly increased compared with DSCM at y ∈ [180, 347], which proves that the OF method is more suitable for smaller displacement measurements [8]. If the relative error is defined as |Experimental value-Theoretical value|/Theoretical value × 100%, the relative errors of the results by DSCM and the HS-OF method in Figure 3d are 0.9% and 6.2%, respectively, which perfectly verifies the effectiveness of the new method.

4. Experimental Results and Analysis

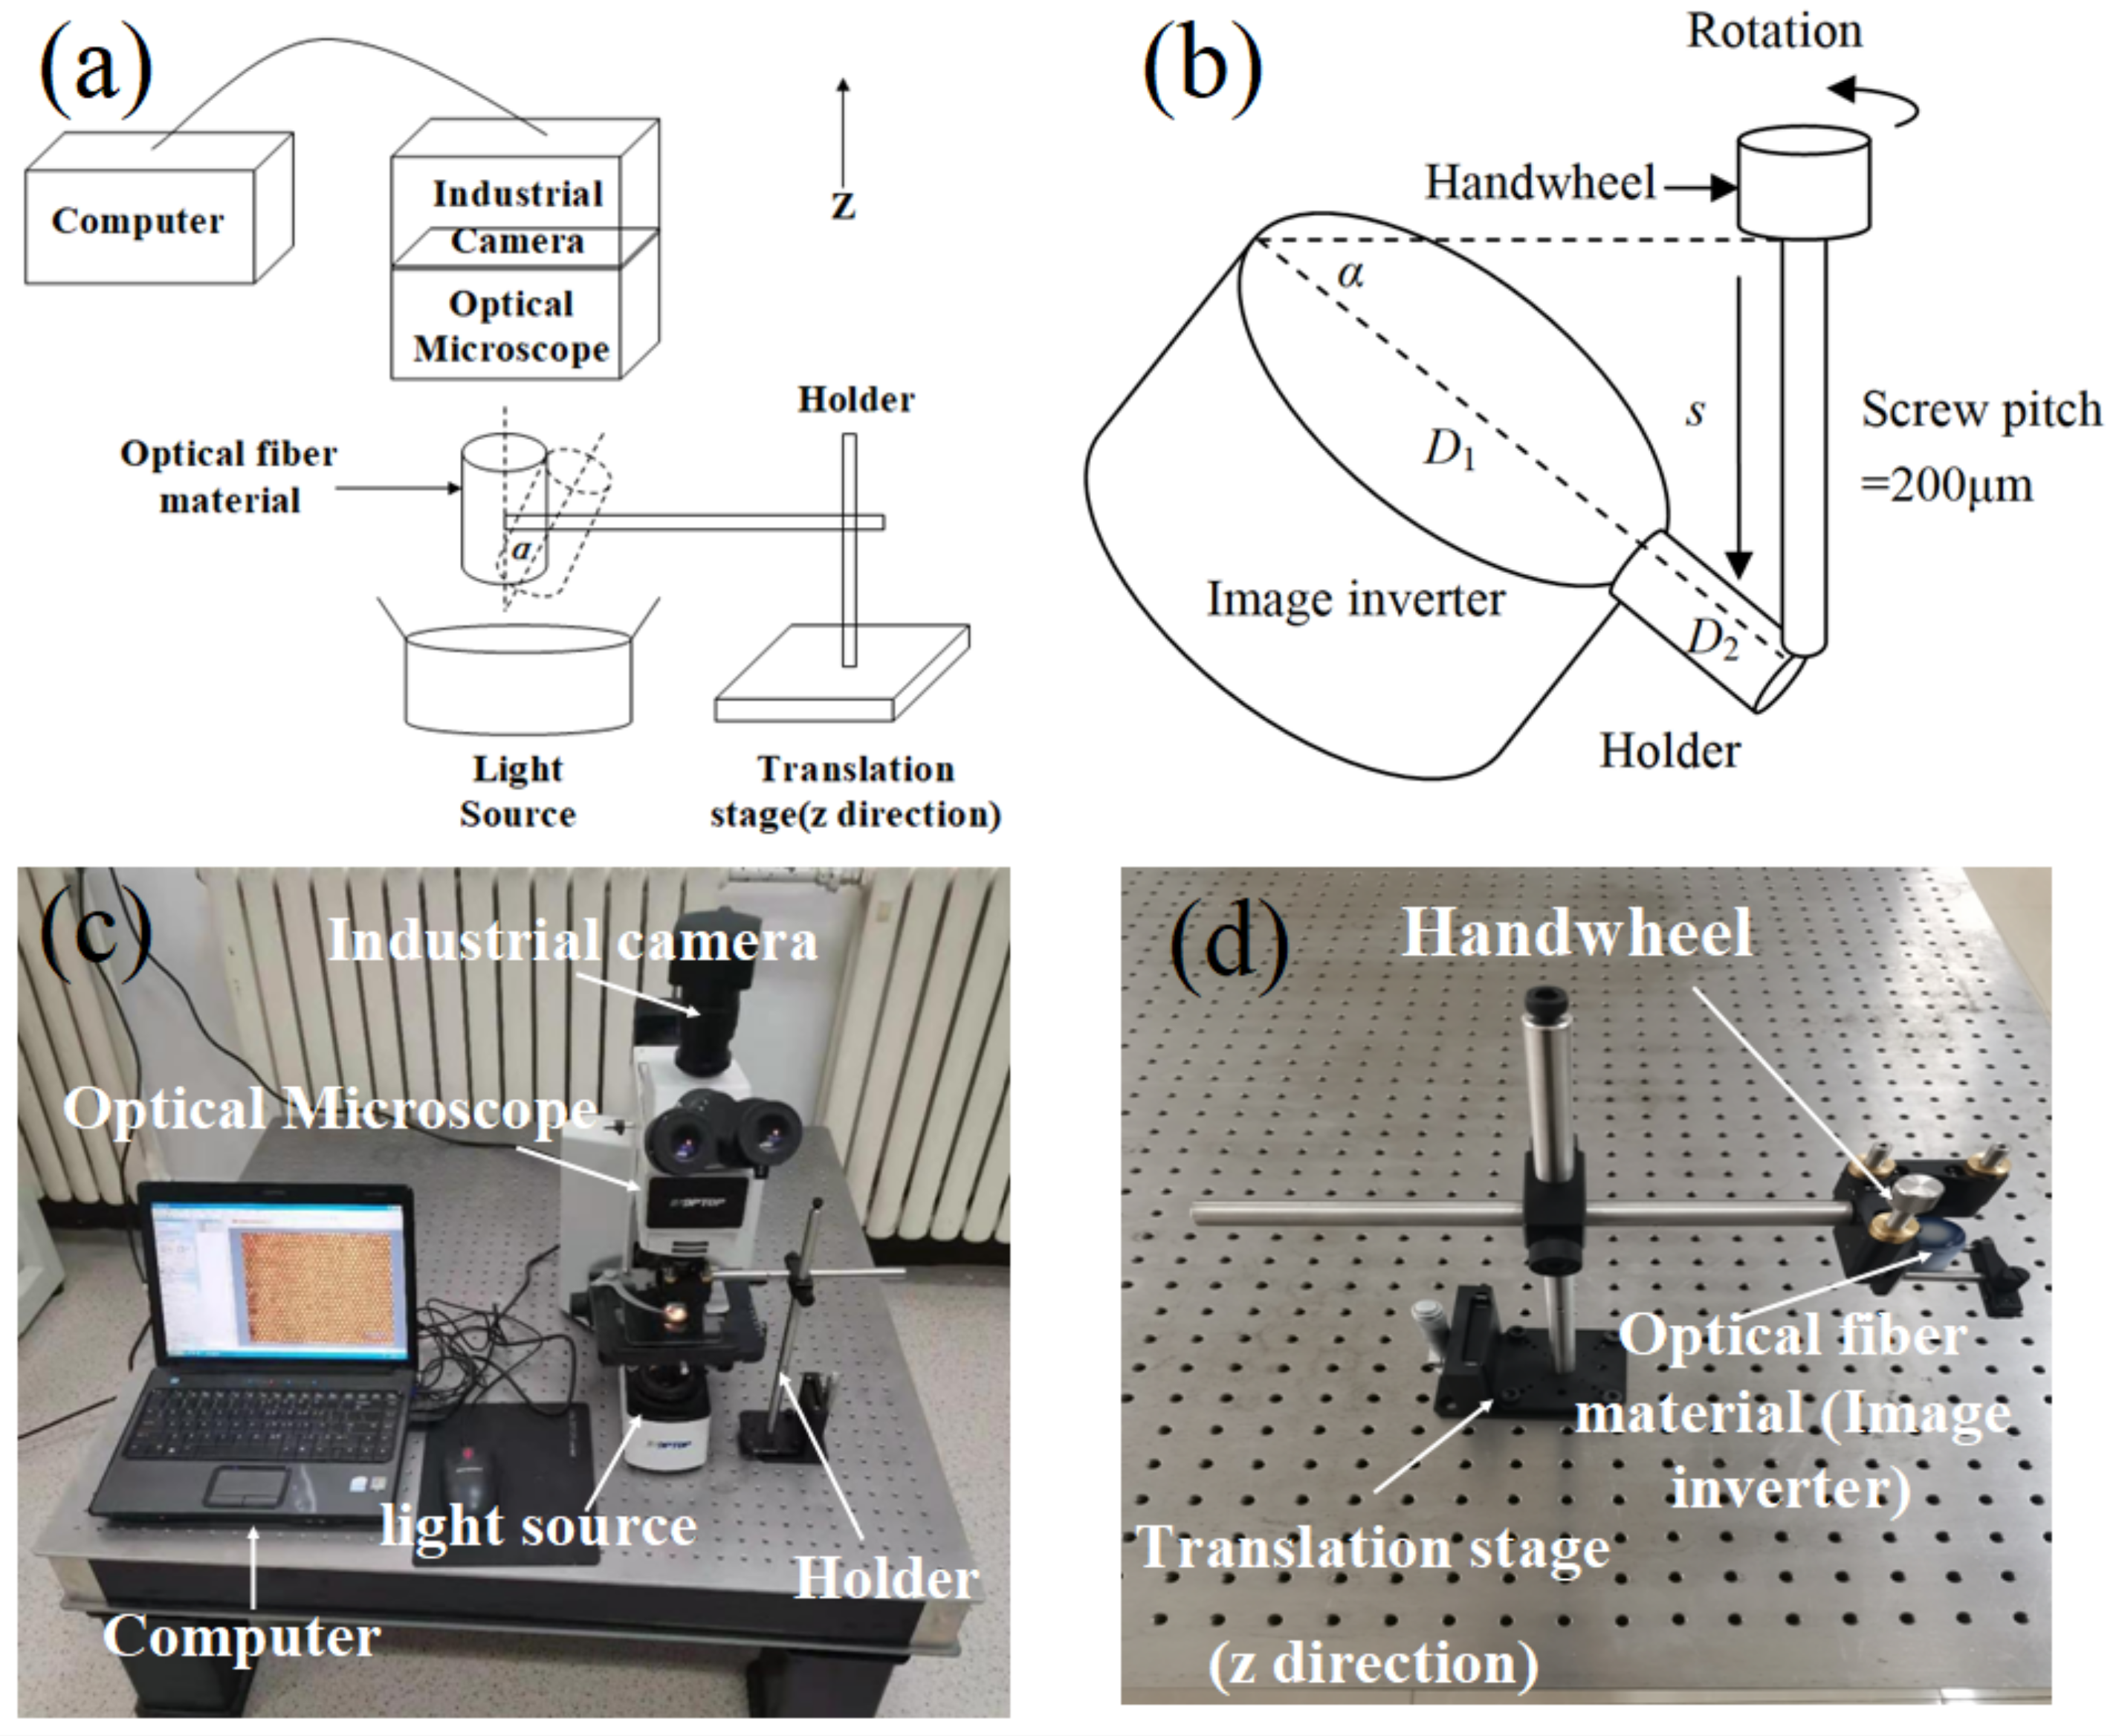
The experimental measurement schematic is illustrated in Figure 4a. An FOI, which is clamped around its edges by a holder, can be tilted by rotating a graduated handwheel. Since the handwheel screw pitch is 200 μm (i.e., the screw will move upward or downward 200 μm when the handwheel is rotated 360°), the tilt angle α can be determined by the sizes of FOI and the holder, as shown in Figure 4b. Parameter s is the screw elongation, D1 = 20 mm is the diameter of FOI, and D2 = 5 mm is the length of the holder. Therefore, the relation between tilt angle α, D1, and D2 can be expressed as: sinα = s/(D1 + D2). The test system includes an optical microscope (Mitutoyo, 50× magnification, NA = 0.55), a translation stage (z direction), and an industrial camera (Andor, ZYLA 4.2 Plus, maximum resolution 4632 pixels × 3488 pixels, chip size 13.3 mm × 13.3 mm, diagonal line 18.8 mm). It should be noted that the size of the chip is chosen as large as possible for a larger field of view. The experimental setup is shown in Figure 4c,d.
The experimental images before and after deformation are shown in Figure 5. For comparison with simulation experiment results, the sizes of the experimental images are set as 400 pixels × 400 pixels (1 pixel = 80 nm). Since the intensity shift in Figure 2c is 3 pixels, the intensity shift range in the experiment should be set from 1 pixel to 5 pixels for correspondence, which indicates that the tilt angles should be set from 6° to 10°. For this reason, the loaded tilt angles in the experiment are set as 6°, 8°, 9°, and 10°, and the corresponding experiment images are shown in Figure 5b–e, respectively. Similarly, Figure 5f shows that the intensity distributions of Figure 5a–e at x = 200 in the y direction, which can also illustrate that the loaded deformation causes an intensity shift in the positive direction of the y axis.
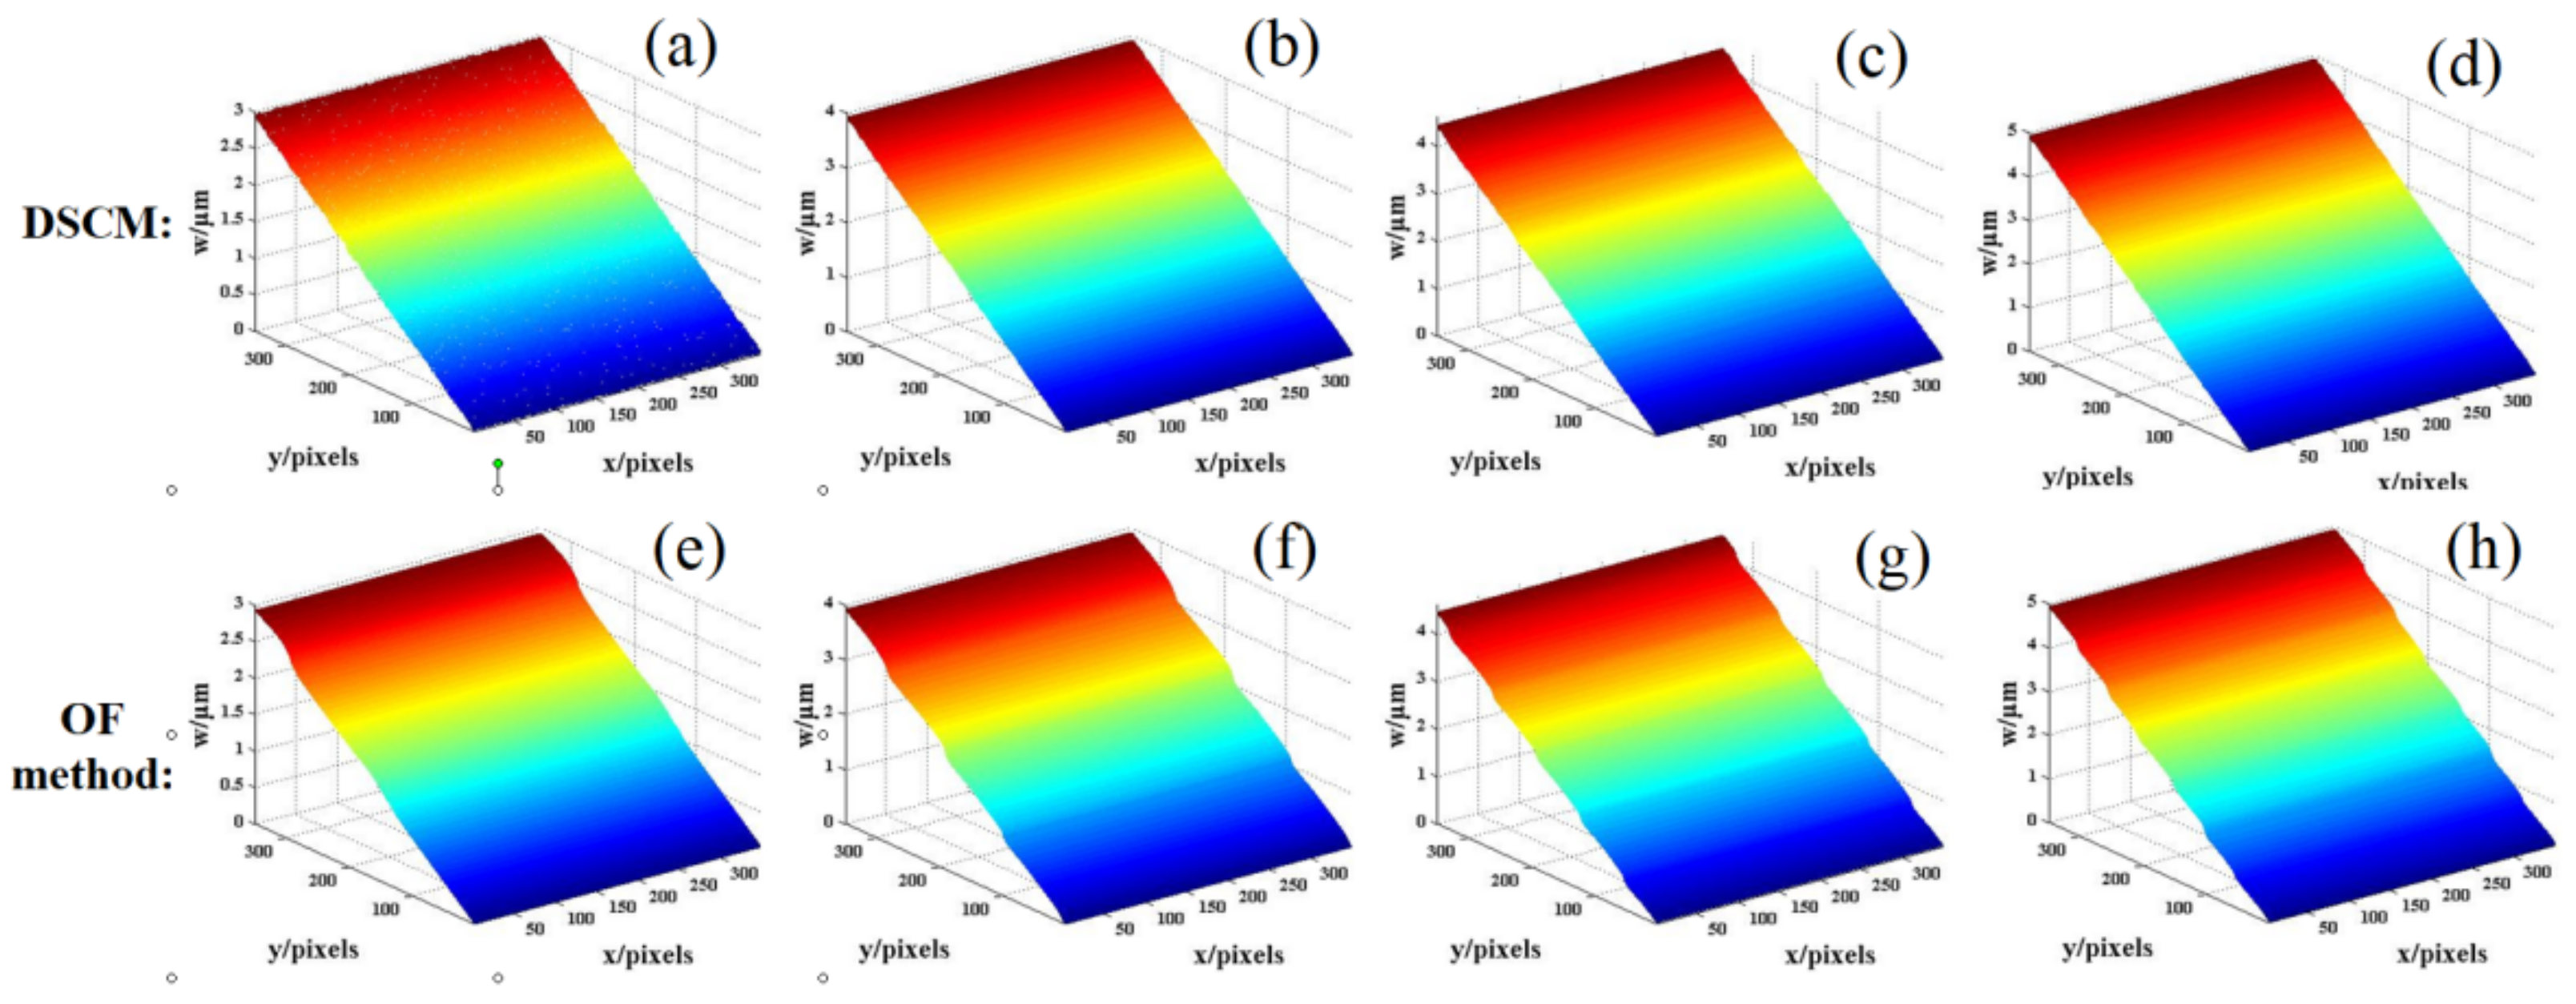
Likewise, the out-of-plane displacement is extracted by DSCM and the subset is set as 50 pixels × 50 pixels in the experiment. Ignoring the invalid data caused by the inevitable boundary effect of DSCM, the theoretical maxima of out-of-plane displacement of Figure 5b–e are 2.92 μm, 3.90 μm, 4.40 μm, and 4.89 μm, respectively. The experimental results by DSCM and the HS-OF method are shown in Figure 6a–h and the mean values of the maxima (y = 347 pixels in the x direction) of these eight trials are 2.92 μm, 3.90 μm, 4.43 μm, 4.95 μm, 2.88 μm, 3.88 μm, 4.46 μm, and 4.86 μm, respectively. Note that all of the relative errors of the maxima in Figure 6a–d are smaller than 1.5%, which clearly proves the accuracy of the present method.
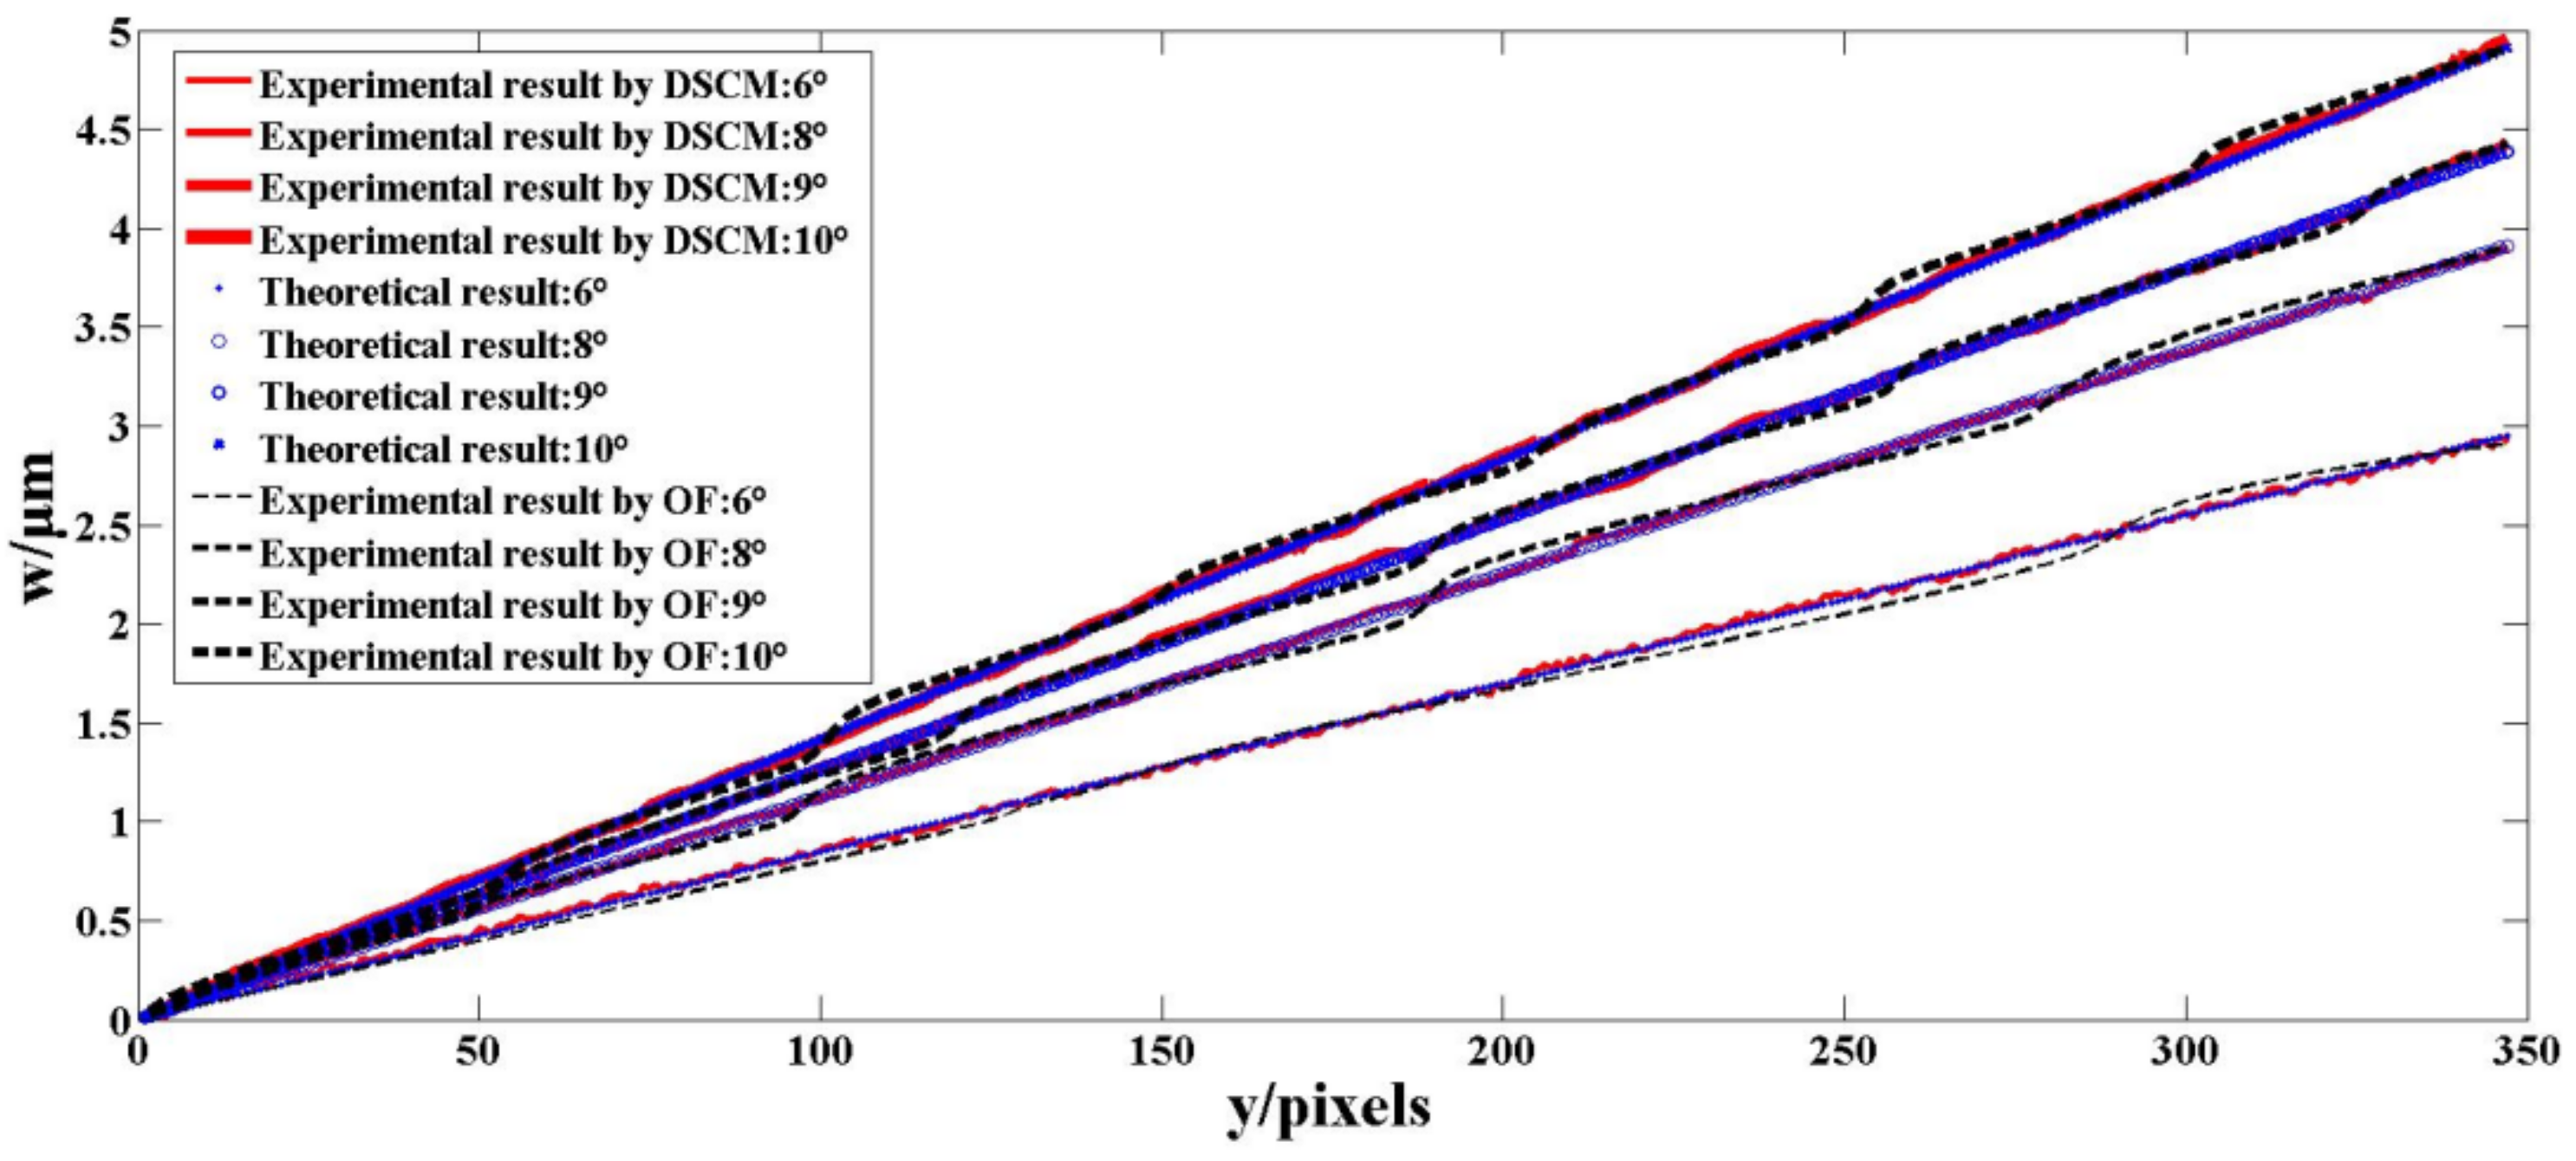
Figure 7 shows the cross-section data of the theoretical result, the experimental results by DSCM, and the experimental results by the HS-OF method in the y direction at x = 174. Simultaneously, the comparison of the main parameters of DSCM and the OF method based on the data of Figure 7 is shown in Table 1, where the absolute error and relative error are the means of the errors of the points in the y direction at x = 174 and the computing time is recorded by Matlab software. For further analysis, the theoretical data and the experimental data of DSCM in Figure 7 at y = 172, y = 173, y = 174, and y = 175 are listed in Table 2. According to the data in Figure 7 and Table 1, it can be found that the means of the relative errors of the experimental results by DSCM at α = 6°, 8°, 9°, and 10° are 4.2%, 1.5%, 1.6%, and 1.5%, respectively, whereas the means of the relative errors of the HS-OF method are 7.2%, 6.6%, 4.9%, and 6.1% (note that all of the absolute errors of these experimental values are less than ±0.2 μm). In particular, since the data in Table 2 are located in the center of images, all of the absolute errors at the points y = 172:175 are less than ±0.05 μm. It is worth mentioning that the relative errors of the best results in Table 2 for each trial (indicated in bold) are 0.07%, 0.51%, 1.54%, and 0.12%, respectively and the minimum absolute error of these values is only 0.001 μm (α = 6°, y = 175). Moreover, the mean of the relative errors at α = 10° is 0.32%, which is significantly lower than other trials and proves that DSCM is more appropriate for measuring the in-plane displacement that is larger than 5 pixels [8]. These good agreements indicate that the proposed method has a better performance in out-of-plane displacement measurement.
In practice, OFM will undergo micro–nano-scale deformation for several hours or even several days after hot pressing, annealing, and hydrogen reduction processes. As mentioned above, this deformation will directly affect coupling performance. On the other hand, because the OFM is not uniform, it should be noted that the deformation distribution is not symmetrical. Therefore, the uniformity of OFM can also be determined by deformation measurement. In industrial production, laser scanning and probe technique are two major methods for OFM deformation measurement and the accuracies and absolute errors of these two methods are commonly less than 1 nm and ±0.02 μm, respectively. However, as a conventional contact measurement method, the probe technique will more or less damage the surface of the material; although the laser scanning technique has many advantages such as non-contact, simple, and robust; as stated earlier, this method cannot realize rapid detection due to the long scanning time (for instance, if the measurement region is set as 1 mm ×1 mm, it will take several hours for scanning and splicing). Hence, the laser scanning technique is only suitable for static measurement. The presented method only needs two images obtained by the microscopic imaging system with a single camera to accomplish the measurement, which can significantly reduce the measurement time and complexity of the arrangement (the measurement times of four experiments are 47.21 s, 46.67 s, 48.97 s, and 50.22 s, respectively). Moreover, the comparison of the results in Figure 7 proves that the absolute errors of the measurement system with a magnification of 50× is less than ±0.2 μm, which can completely satisfy the industrial detection requirements of OFM [19]. Hence, the new method has been applied to the deformation and uniformity dynamic detection in OFM industrial production.

5. Conclusions

A novel correlation-based out-of-plane displacement measurement method for OFM is proposed. The out-of-plane displacement is obtained by the combination of the DSCM and the wedge model. In this method, only two images obtained by the microscopic imaging system with a single camera are required and neither frequency domain conversion nor phase unwrapping operation is needed. Simulation and experimental results show that the absolute errors of the measurement by an optical microscope with a magnification of 50× are less than ±0.2 μm, which can completely satisfy the industrial detection requirements of OFM. Therefore, the new method has been applied to the deformation and uniformity dynamic detection in OFM industrial production. Further, the proposed method provides a new approach for solid material deformation detection and monitoring.

Author Contributions

Conceptualization, R.Z.; methodology, R.Z. and Y.S.; software, P.S.; validation, G.Y. and Y.Z.; formal analysis, R.Z.; investigation, R.Z. and J.J.; resources, R.Z.; data curation, R.Z.; writing—original draft preparation, R.Z.; writing—review and editing, R.Z.; visualization, R.Z.; supervision, R.Z.; project administration, R.Z. and Y.H.; funding acquisition, R.Z. All authors have read and agreed to the published version of the manuscript.

Funding

This work is supported by the National Natural Science Foundation of China under grant nos. 11902317 and 61975099 and 52072357, the Major scientific and technological innovation projects in Shandong Province under grant 2019TSLH0122, the Collaborative innovation projects of Beijing Chaoyang District under grant CYXC2108.

Institutional Review Board Statement

This study did not involve humans or animals.

Informed Consent Statement

Not applicable.

Data Availability Statement

This study does not report any data.

Conflicts of Interest

The authors declare no conflict of interest.

References

  1. Huang, Y.; Gu, Z.; Zhang, Y.; Liu, H.; Li, G. Nano-scale Morphology on Micro-channel Plate Lead Silicate Glass Surface. J. Chin. Ceram. Soc. 2012, 40, 994–999. [Google Scholar]
  2. Jiao, P.; Jia, J.; Zhang, L.; Wang, Y.; Wang, J.; Zhou, Y.; Shi, P.; Zhao, R.; Huang, Y. Detection of blemish for fiber-optic imaging elements. Opt. Eng. 2020, 59, 053105. [Google Scholar] [CrossRef]
  3. Huang, Y.; Shi, P.; Zhou, Y.; Wang, Y.; Fu, Y.; Wang, J.; Jia, J. Conductive mechanism of reduced lead silicate glass for microchannel plate. Int. J. Appl. Glass Sci. 2020, 11, 285–293. [Google Scholar] [CrossRef]
  4. Zhao, R.; Huang, Y.; Wang, J.; Sun, Y.; Huang, K.; Zhou, Y.; Wang, Y.; Fu, Y. Image spherizing based planeness detecting method for MCP. Appl. Optics. 2019, 58, 554–560. [Google Scholar] [CrossRef] [PubMed]
  5. Ren, J.; Song, Z.; Li, B.; Liu, J.; Lv, R.; Liu, G. Structure feature and evolution mechanism of pores in different metamorphism and deformation coals. Fuel 2021, 283, 119292. [Google Scholar] [CrossRef]
  6. Zhao, R.; Sun, P. Deformation-phase measurement by optical flow method. Opt. Commun. 2016, 371, 144–149. [Google Scholar] [CrossRef]
  7. Gu, G.; Pan, Y.; Qiu, C.; Zhu, C. Improved depth characterization of internal defect using the fusion of shearography and speckle interferometry. Opt. Laser Technol. 2021, 135, 106701. [Google Scholar] [CrossRef]
  8. Lei, Z.; Sun, P.; Hu, C. The sensitivity and the measuring range of the typical differential optical flow method for displacement measurement using the fringe pattern. Opt. Commun. 2021, 487, 126806. [Google Scholar] [CrossRef]
  9. Sun, P.; Dai, Q.; Tang, Y.; Lei, Z.A. Coordinate calculation for direct shape measurement based on optical flow. Appl. Opt. 2020, 59, 92–96. [Google Scholar] [CrossRef] [PubMed]
  10. Peters, W.H.; Ranson, W.F. Digital imaging techniques in experimental stress analysis. Opt. Eng. 1982, 21, 427–431. [Google Scholar] [CrossRef]
  11. Chen, B.; Ji, L.; Pan, B. High-temperature stereo-digital image correlation using a single polarization camera. Appl. Opt. 2020, 59, 4008–4015. [Google Scholar] [CrossRef] [PubMed]
  12. Sun, Q.; Cai, C.; Zhang, S.; Tian, S.; Li, B.; Xia, Y.; Sun, Q. Study of localized deformation in geopolymer cemented coal gangue-fly ash backfill based on the digital speckle correlation method. Constr. Build. Mater. 2019, 215, 321–331. [Google Scholar] [CrossRef]
  13. Liang, Z.; Zhang, J.; Qiu, L.; Lin, G.; Yin, F. Studies on deformation measurement with non-fixed camera using digital image correlation method. Measurement 2021, 167, 108139. [Google Scholar] [CrossRef]
  14. Rodriguez-Cobo, L.; Lomer, M.; Cobo, A.; Lopez-Higuera, J. Optical fiber strain sensor with extended dynamic range based on specklegrams. Sens. Actuators A Phys. 2013, 203, 341–345. [Google Scholar] [CrossRef]
  15. Leal-Junior, A.; Frizera, A.; Marques, C.; Pontes, M. Optical Fiber Specklegram Sensors for Mechanical Measurements: A Review. IEEE Sens. J. 2018, 20, 569–576. [Google Scholar] [CrossRef]
  16. Fujiwara, E.; Santos, M.; Suzuki, C. Optical fiber specklegram sensor analysis by speckle pattern division. Appl. Opt. 2017, 56, 1585–1590. [Google Scholar] [CrossRef] [PubMed]
  17. Zhao, R.; Sun, P. Deformation-phase measurement by digital speckle correlation method. Appl. Phys. B Lasers Opt. 2016, 122, 251. [Google Scholar] [CrossRef]
  18. Shealy, D.L.; Hoffnagle, J.A. Laser beam shaping profiles and propagation. Appl. Opt. 2006, 45, 5118–5131. [Google Scholar] [CrossRef] [PubMed]
  19. Pan, G.; He, Y.; Miao, K. Specification for microchannel plate. In GJB1596-93, Commission of Science, Technology and Industry for National Defense; Library of Congress: Beijing, China, 1993. [Google Scholar]
Figure 1. Wedge model.
Photonics 08 00348 g001
Figure 2. Simulated OFM microscopic image: (a) origin image; (b) deformation image; (c) intensity distributions of (a,b) at x = 200, y direction.
Photonics 08 00348 g002
Figure 3. Simulation experiment results: (a) theoretical result; (b) simulated result by DSCM; (c) simulate result by OF method (d) comparison cross-section data in the y direction at x = 174.
Photonics 08 00348 g003
Figure 4. Experimental setup and schematic diagram: (a) measurement schematic; (b) relation between loading deformation and α; (c) setup diagram; (d) holder and material.
Photonics 08 00348 g004
Figure 5. Experimental images: (a) original image (α = 0°); (b) α = 6°; (c) α = 8°; (d) α = 9°; (e) α = 10°; (f) intensity distributions of (a,e) at x = 200, y direction.
Photonics 08 00348 g005
Figure 6. Experimental results by DSCM: (a) α = 6°; (b) α = 8°; (c) α = 9°; (d) α = 10°; and OF method: (e) α = 6°; (f) α = 8°; (g) α = 9°; (h) α = 10°.
Photonics 08 00348 g006
Figure 7. Comparison cross-section data in the y direction at x = 174.
Photonics 08 00348 g007
Table 1. Main parameters comparison of DSCM and OF method based on the data in Figure 7.
MethodDSCMHS-OF Method
Pre-Set ParametersSubset Size: 50 pixels × 50 pixelsSmoothness Weight factor [6]: 1
Computing MethodGradient-Based Correlation AlgorithmGauss–Seidel Iterative Solution
Absolute Error
(Mean)/μm
Relative Error
(Mean)
Computing Time/sAbsolute Error
(Mean)/μm
Relative Error
(Mean)
Computing Time/s
0.1314.2%47.210.3327.2%67.33
0.0141.5%46.670.3116.6%66.54
0.0251.6%48.970.2464.9%63.25
10°0.0191.5%50.220.2986.1%64.46
Table 2. Theoretical results and experimental results by DSCM in Figure 7 at y = 172:175.
AngleTheoretical Values/μmExperimental Values/μm Relative Error Theoretical Values/μmExperimental Values/μm Relative Error
1.4621.4461.09%1.4711.4412.08%
1.4791.4850.41%1.4881.4870.07%
1.9381.9480.51%1.9491.9620.66%
1.9611.9750.71%1.9721.9870.76%
2.1762.2111.61%2.1892.2241.60%
2.2012.2351.54%2.2142.2521.71%
10°2.4342.4400.24%2.4482.4510.12%
10°2.4622.4560.24%2.4762.4590.69%
Publisher’s Note: MDPI stays neutral with regard to jurisdictional claims in published maps and institutional affiliations.

