Article

Elasticity Changes in the Crystalline Lens during Oxidative Damage and the Antioxidant Effect of Alpha-Lipoic Acid Measured by Optical Coherence Elastography

1
Department of Biomedical Engineering, University of Houston, 3517 Cullen Blvd., Room 2027, Houston, TX 77204, USA
2
Molecular Physiology and Biophysics, Baylor College of Medicine, One Baylor Plaza, BCM335, Houston, TX 77030, USA
3
Department of Mechanical Engineering, University of Houston, 4726 Calhoun Rd., Room N207., Houston, TX 77204, USA
*
Author to whom correspondence should be addressed.
Photonics 2021, 8(6), 207; https://doi.org/10.3390/photonics8060207
Submission received: 20 April 2021 / Revised: 25 May 2021 / Accepted: 4 June 2021 / Published: 8 June 2021
(This article belongs to the Special Issue Tissue Optics)

Abstract

:
Age-related cataracts are one of the most prevalent causes of visual impairment around the world. Understanding the mechanisms of cataract development and progression is essential to enable early clinical diagnosis and treatment to preserve visual acuity. Reductive chemicals are potential medicines effective on cataract treatment. In this work, we investigated the cataract-induced oxidative damage in the crystalline lens and a kind of reductant, α-lipoic acid (ALA), ability to reduce the damage. We created oxidative environment to investigate the relationship between the progression of oxidative cataract and lenticular biomechanical properties measured by dynamic optical coherence elastography in porcine crystalline lenses ex vivo. The efficacy of ALA to minimize the stiffening of the lens was also quantified. The results showed a significant increase in Young’s modulus of the lens due to the formation of the oxidative cataract. We found a statistically significant difference between Young’s modulus of the lenses stored in phosphate-buffered saline and ALA solution after incubation in H2O2 solution for 3 h (43.0 ± 9.0 kPa versus 20.7 ± 3.5 kPa, respectively). These results show that the lens stiffness increases during oxidative cataract formation, and ALA has the potential to reverse stiffening of the lens caused by oxidative damage.

Graphical Abstract

1. Introduction

A cataract is an opacity of the crystalline lens that can severely impair vision with symptoms including blurry vision, faded colors, poor night vision, and halos around light [1]. Cataracts are one of the most prevalent causes of vision loss, accounting for approximately 50% of blindness worldwide [1,2]. While cataracts can have various causes, including trauma, chemical exposure, radiation, and drug abuse, the leading reason for cataract development is aging [1,2,3,4]. The mechanisms of age-related changes in the crystalline lens are not fully understood. However, oxidative stress is often considered a major factor contributing to lens changes during aging and cataract formation [1,5,6,7,8,9,10]. The oxidation of methionine residues and loss of sulfhydryl groups of proteins are both progressive as the cataract worsens until 90% of cysteine and half the methionine residues are oxidized in the most advanced form of cataract [10,11,12].
Glutathione (GSH) in the crystalline lens functions as an antioxidant for lens proteins, and loss of nuclear GSH may be the critical event that precedes age-related cataract formation [10,13,14,15,16]. Previous studies have indicated an important hydroxyl radical scavenging function of GSH in lens epithelial cells to preserve the lens by offering a reductive environment [17,18]. Therefore, antioxidants may have the potential to protect the lens from oxidative damage and, subsequently, cataracts. Several antioxidants have been reported to delay cataract formation in ex vivo and in vivo animal models [4,13,19]. In the past few decades, α-lipoic acid (ALA) has emerged as an antioxidant and nutritional supplement [20] that, among other benefits, has been shown to be effective in preventing the onset and progression of cataract [21,22,23,24,25,26]. Moreover, it has recently been demonstrated that alpha-lipoic acid has a potential therapeutic role in restoring accommodation to the presbyopic eyes by reducing lens stiffness [15]. Previous research shows that both presbyopic [27,28,29] and cataract [30] lenses are stiffer than healthy lenses, which suggests that monitoring the biomechanical properties of the lens can provide important information about the mechanisms of lens aging, presbyopia, and cataract formation. Furthermore, it has been hypothesized that progressive age-dependent hardening of the crystalline lens may be responsible for both presbyopia and age-related cataracts [7].
Various methods have been proposed to characterize the elastic properties of the crystalline lens [27,28,29,30,31,32,33,34]. However, the majority of these techniques are invasive and destructive, thus limiting their clinical applicability. Several noninvasive techniques have been proposed to measure lens elasticity, such as Brillouin microscopy [35,36], ultrasound elastography [37,38,39,40], and optical coherence elastography (OCE) [41,42,43,44]. The application of OCE can measure the lenticular biomechanical properties from analysis of nanometer-scale force-induced displacements. Dynamic OCE is based on external dynamic stimulation and the measurement of the tissue motion using optical coherence tomography (OCT) [45]. In our previous work, we demonstrated that the biomechanical properties of the lens could be measured in situ and quantified lenticular biomechanical properties as a function of age and intraocular pressure using dynamic OCE [43,44,46]. Recently, we used shear wave OCE to show the correlation between lens opacity and elasticity during cold cataract formation in a porcine model ex vivo [47].
To simulate cataract formation, we incubated the lenses in hydrogen peroxide. It has been shown that there is a close parallel between protein modifications found in cataract and those generated with hydrogen peroxide [48]. In this study, we first applied OCE to observe the elasticity of the lens during the oxidation process of the lenses. We investigated the changes in the lens elastic properties during oxidative cataract formation and the effect of ALA on resisting oxidation and lens hardening. We used shear wave OCE to quantitatively evaluate the changes in surface wave velocity and Young’s modulus during cataract formation. After measuring surface wave propagation in fresh porcine lenses, the lenses were incubated with hydrogen peroxide (H2O2) to induce oxidative cataracts [24]. Subsequently, the lenses were incubated in ALA to investigate their effect on cataract development. The results show a significant increase in lens stiffness during cataract formation and the potential of ALA to reduce the stiffening of the lens caused by oxidative damage.

2. Materials and Methods

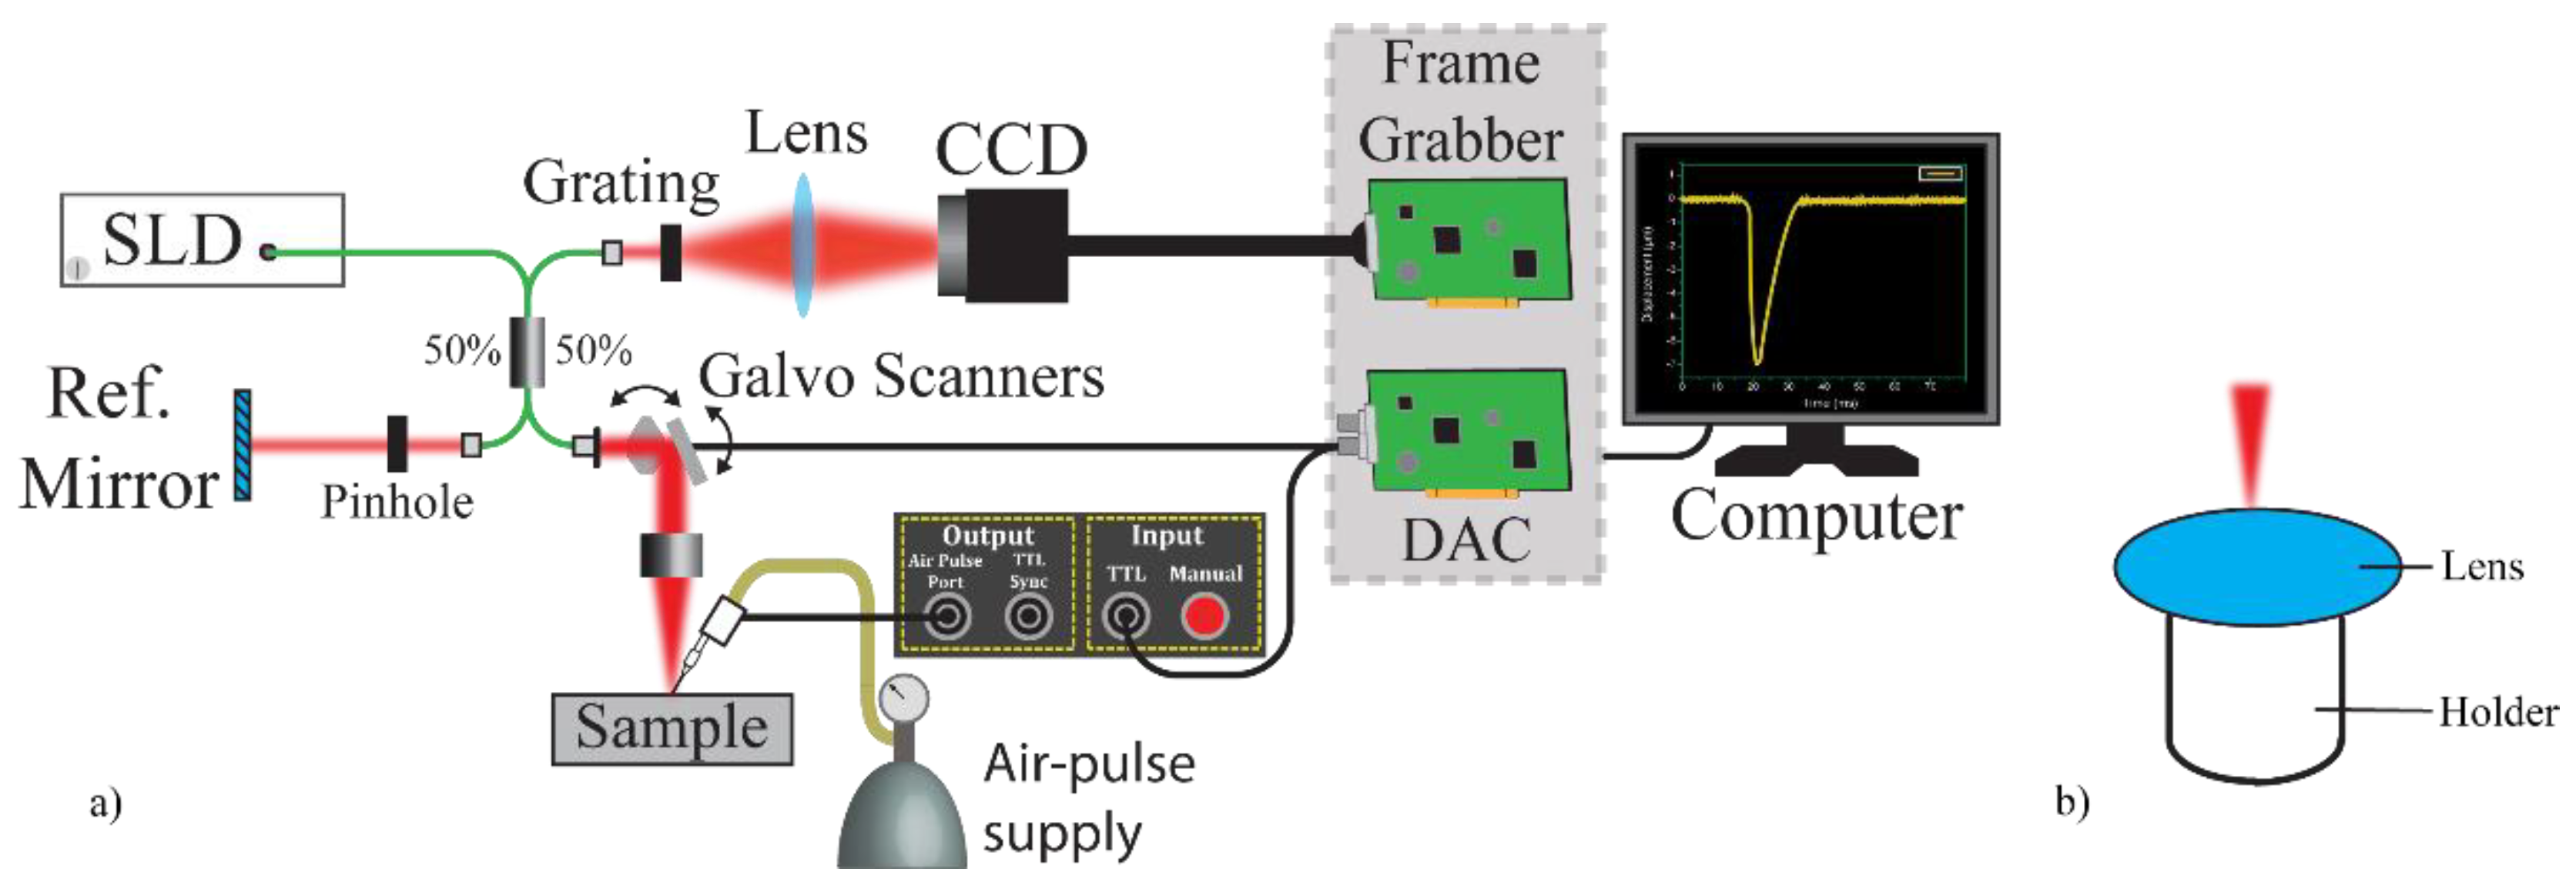
2.1. Experimental Set-Up

The dynamic OCE system is built based on a phase-sensitive spectral domain OCT (SD-OCT) system, which is combined with an air-pulse excitation system. A schematic of the experimental system is shown in Figure 1 and has been described in our previous work [49,50]. The OCE system includes a superluminescent diode (SLD, S840-B-I-20, Superlum Co., Cork, Ireland) with a central wavelength of 840 nm and a bandwidth of 49 nm. The acquisition speed of the camera (spL4096-140km, Basler AG, Ahrensburg, Germany) was set as 40 kHz. The displacement stability of the system was measured as 12 nm in air. The air-pulse excitation system used an electronically controlled pneumatic solenoid and control unit to produce a short air-pulse (≤1 ms) [50]. The pressure was controlled by a pneumatic valve and monitored by a pressure gauge. The air-pulse was synchronized with the SD-OCT system frame trigger.

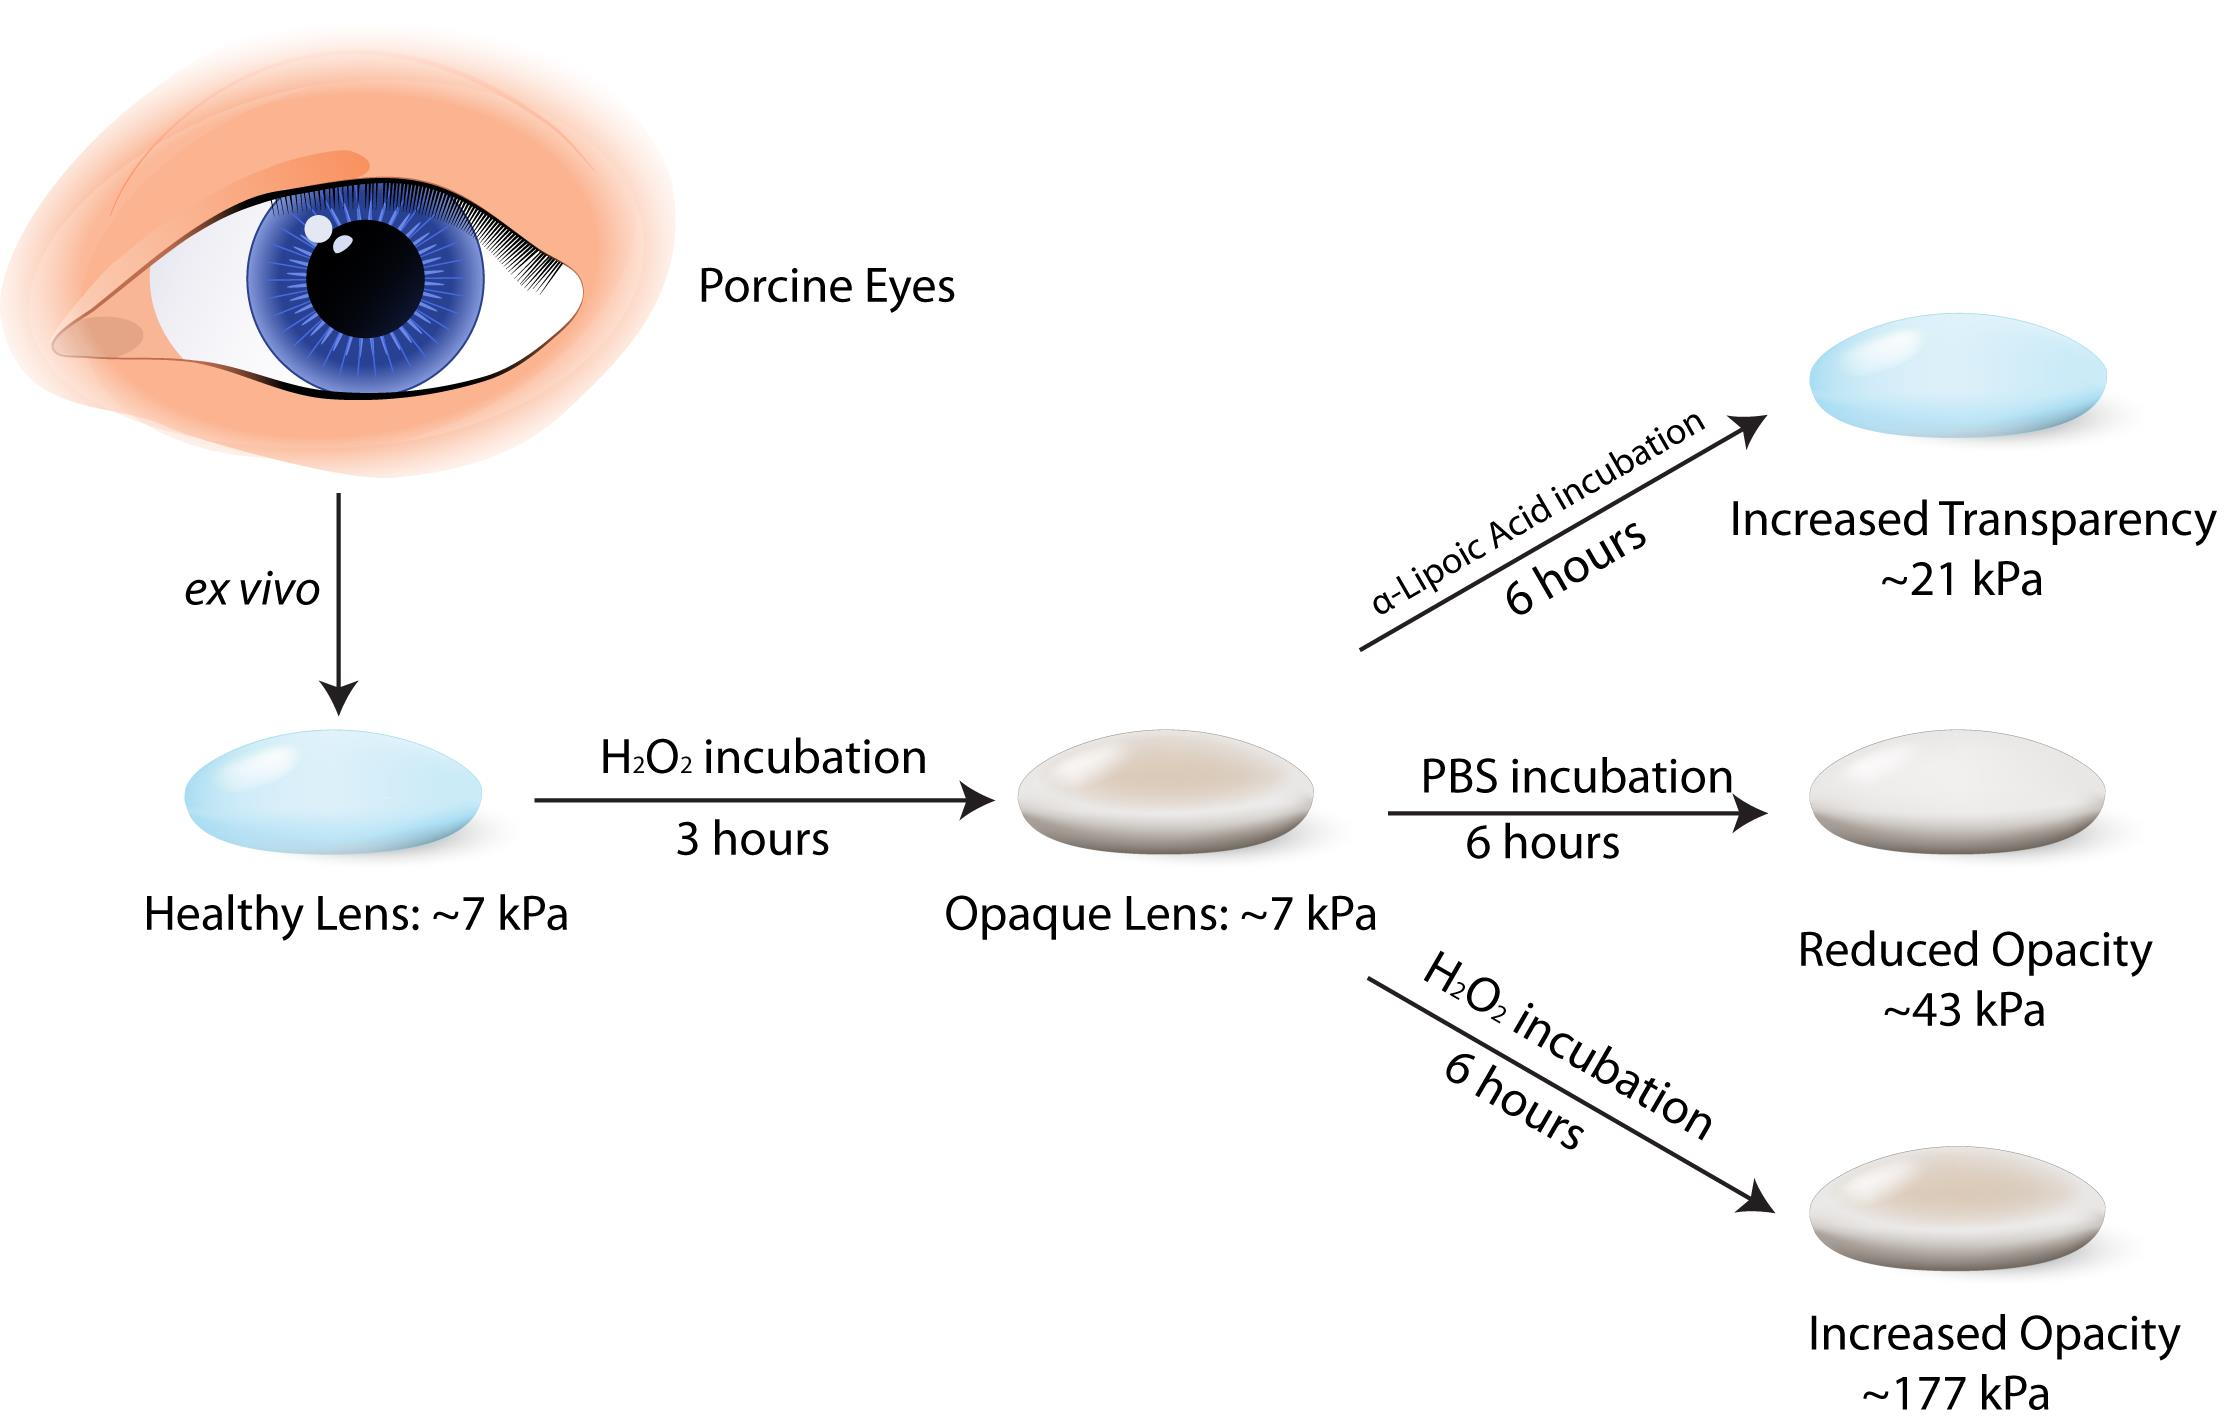
2.2. Sample Preparation

Fifteen porcine eyes from animals within 4-6 months of age were shipped overnight on ice (Sioux-Preme Packing Co., Sioux City, IA, USA). The lenses were extracted carefully from the eye globes and visually inspected to ensure there was no damage. The lenses were divided into five groups of three lenses each and incubated at 37 °C in different storage media. The first group was incubated in a solution of 500 mM H2O2 in 1X phosphate buffered saline (PBS) for 9 h. The second group was first incubated in the peroxide solution for 3 h and then was removed and incubated in a 100 mM ALA (sodium salt) solution for an additional 6 h (H2O2 → α-Lipoic Acid). The third group was incubated in the H2O2 solution for 3 h and then was removed and incubated in 1X PBS for 6 h (H2O2 →PBS). The fourth group was incubated in the ALA solution for 9 h. Finally, the fifth group was incubated in 1X PBS for 9 h. The OCE measurements of lens elasticity were repeated every 3 h for 9 h.
PBS-only group was the negative control. ALA-only group was a negative control to investigate if ALA would cause changes in lenticular stiffness even in the presence of no oxidative damage. The H2O2 group was the positive control, showing the direct effect of oxidative damage on lenticular biomechanical properties. The H2O2→PBS group was a positive control group to demonstrate that PBS cannot ameliorate or reverse oxidative damage. The H2O2→ALA group was the primary experimental group, showing that ALA could reduce or reverse oxidative damage induced changes to lens stiffness. We performed preliminary experiments with 12-, 9-, 6-, and 3-hour increments and found that we could detect elasticity changes even at 3 hour increments.

2.3. Optical Properties Measurements

The pictures of the lenses in different media were taken by a standard dissection microscope (Stemi 508, Carl Zeiss Microscopy, LLC, Thornwood, NY, USA). For quantitative assessments of the changes in optical transparency, the OCT images were utilized to calculate the reciprocal of the OCT signal slope [50], referred to here as the attenuation, to quantify the opacity of the lenses. One hundred A-lines taken from the center of the lens were averaged for the calculation to eliminate artifacts in the calculations due to sensitivity roll-off and de-focusing. The A-lines were averaged for each sample, and least-squares linear fit was performed to calculate the OCT signal slope. The selected region was 112 µm below the surface to avoid the influence of the specular reflection and the linear fit was over 1.68 mm, which was where the intensity was indistinguishable from the background noise.

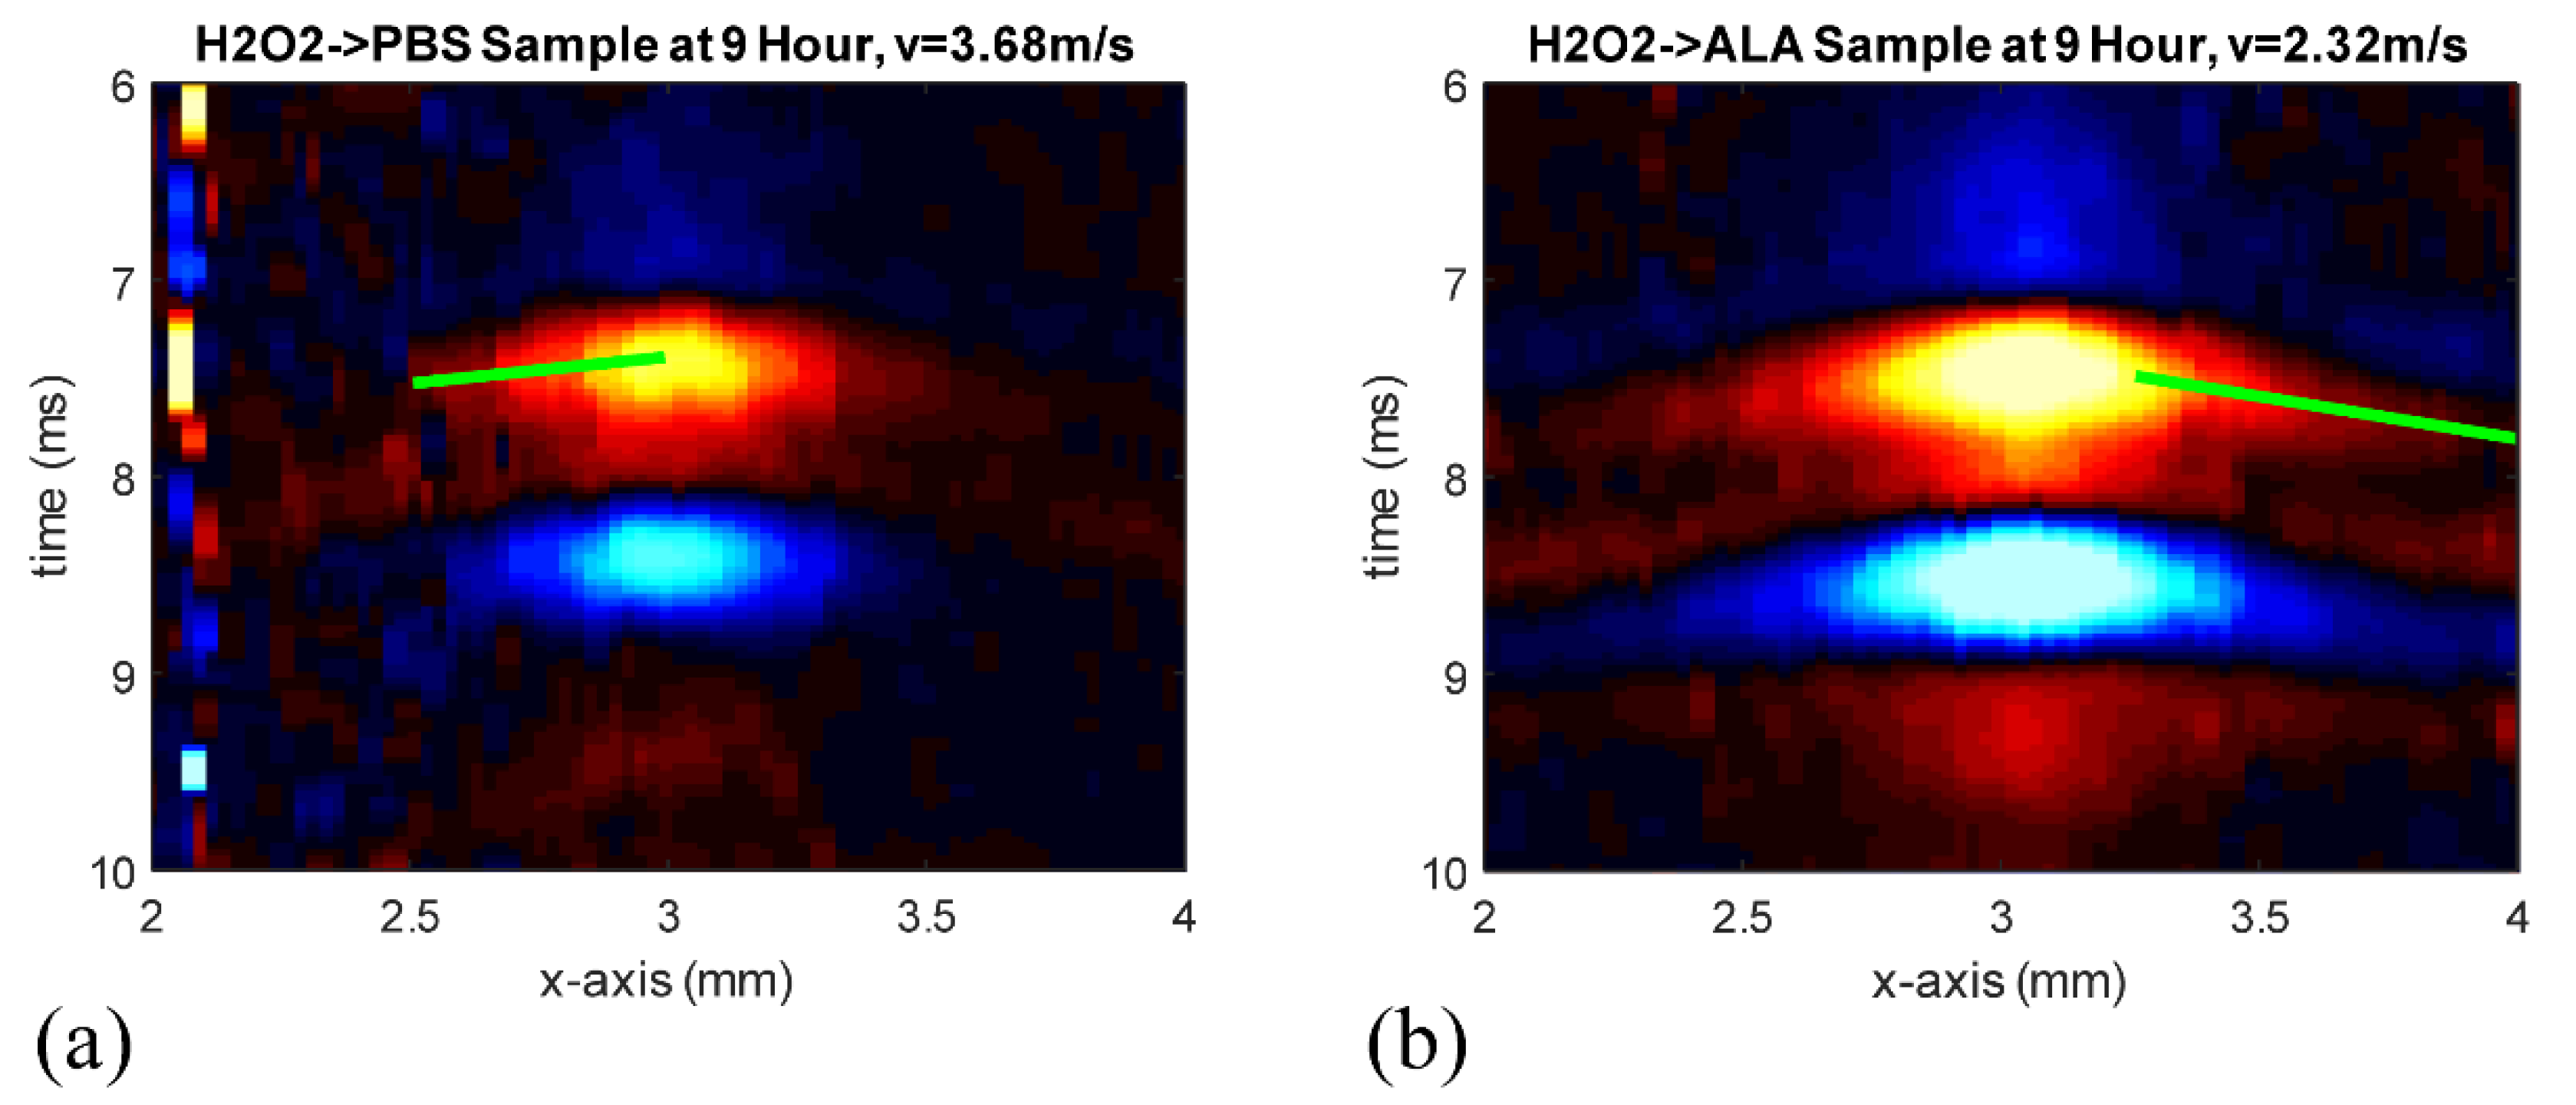
2.4. Surface Wave Measurements

The extracted lenses were placed in the home-made lens holder. During OCE measurements, the lenses were half-submerged in 1X PBS, and an additional 1X PBS was topically dropped on the upper surface of the lenses every 20 s to make sure the lenses were hydrated. The focused air-pulse was targeted at the apex of the lens. The air-pulse induced a low amplitude localized displacement (≤10 μm) at the surface of the lens, which then propagated as an elastic wave. The SD-OCT system acquired successive M-mode images (n = 251) over a ~6.1 mm line [50], where the center of the scan was at the apex of the lens. The scan time for one position was approximately 10 ms, and the entire M-B scan time was approximately 30 s. The lenses were placed on a hollow tube with diameter of 7.3 mm. The raw temporal phase profiles were unwrapped, converted to displacement, and corrected for surface motion and refractive index mismatch artifacts [51]. The displacement profiles along the propagation path (i.e., along the curvature of the sample) were then processed by a cross-correlation algorithm to obtain the elastic wave propagation delays [52]. In short, the displacement profile at the excitation was used as a reference profile, and the displacement profiles from successively more distant positions were then cross-correlated with the reference profile. The peak of the subsequent cross-correlation was selected as the temporal delay for the elastic wave propagation to that OCE measurement position. A linear fit was then performed on the elastic wave propagation delays and their corresponding distances (incorporating the curvature of the sample). The speed of the elastic wave was converted to Young’s modulus, E, by the surface wave equation for incompressible material [53,54]:
E = 3 ρ ( c g 0.955 ) 2
where ρ   = 1183 kg/m3 was the lens density [55], and cg was the OCE-measured surface wave group velocity. Before measurements, all porcine lenses were physically measured with calipers, and there were no detectable changes in sample geometry during storage.

3. Results

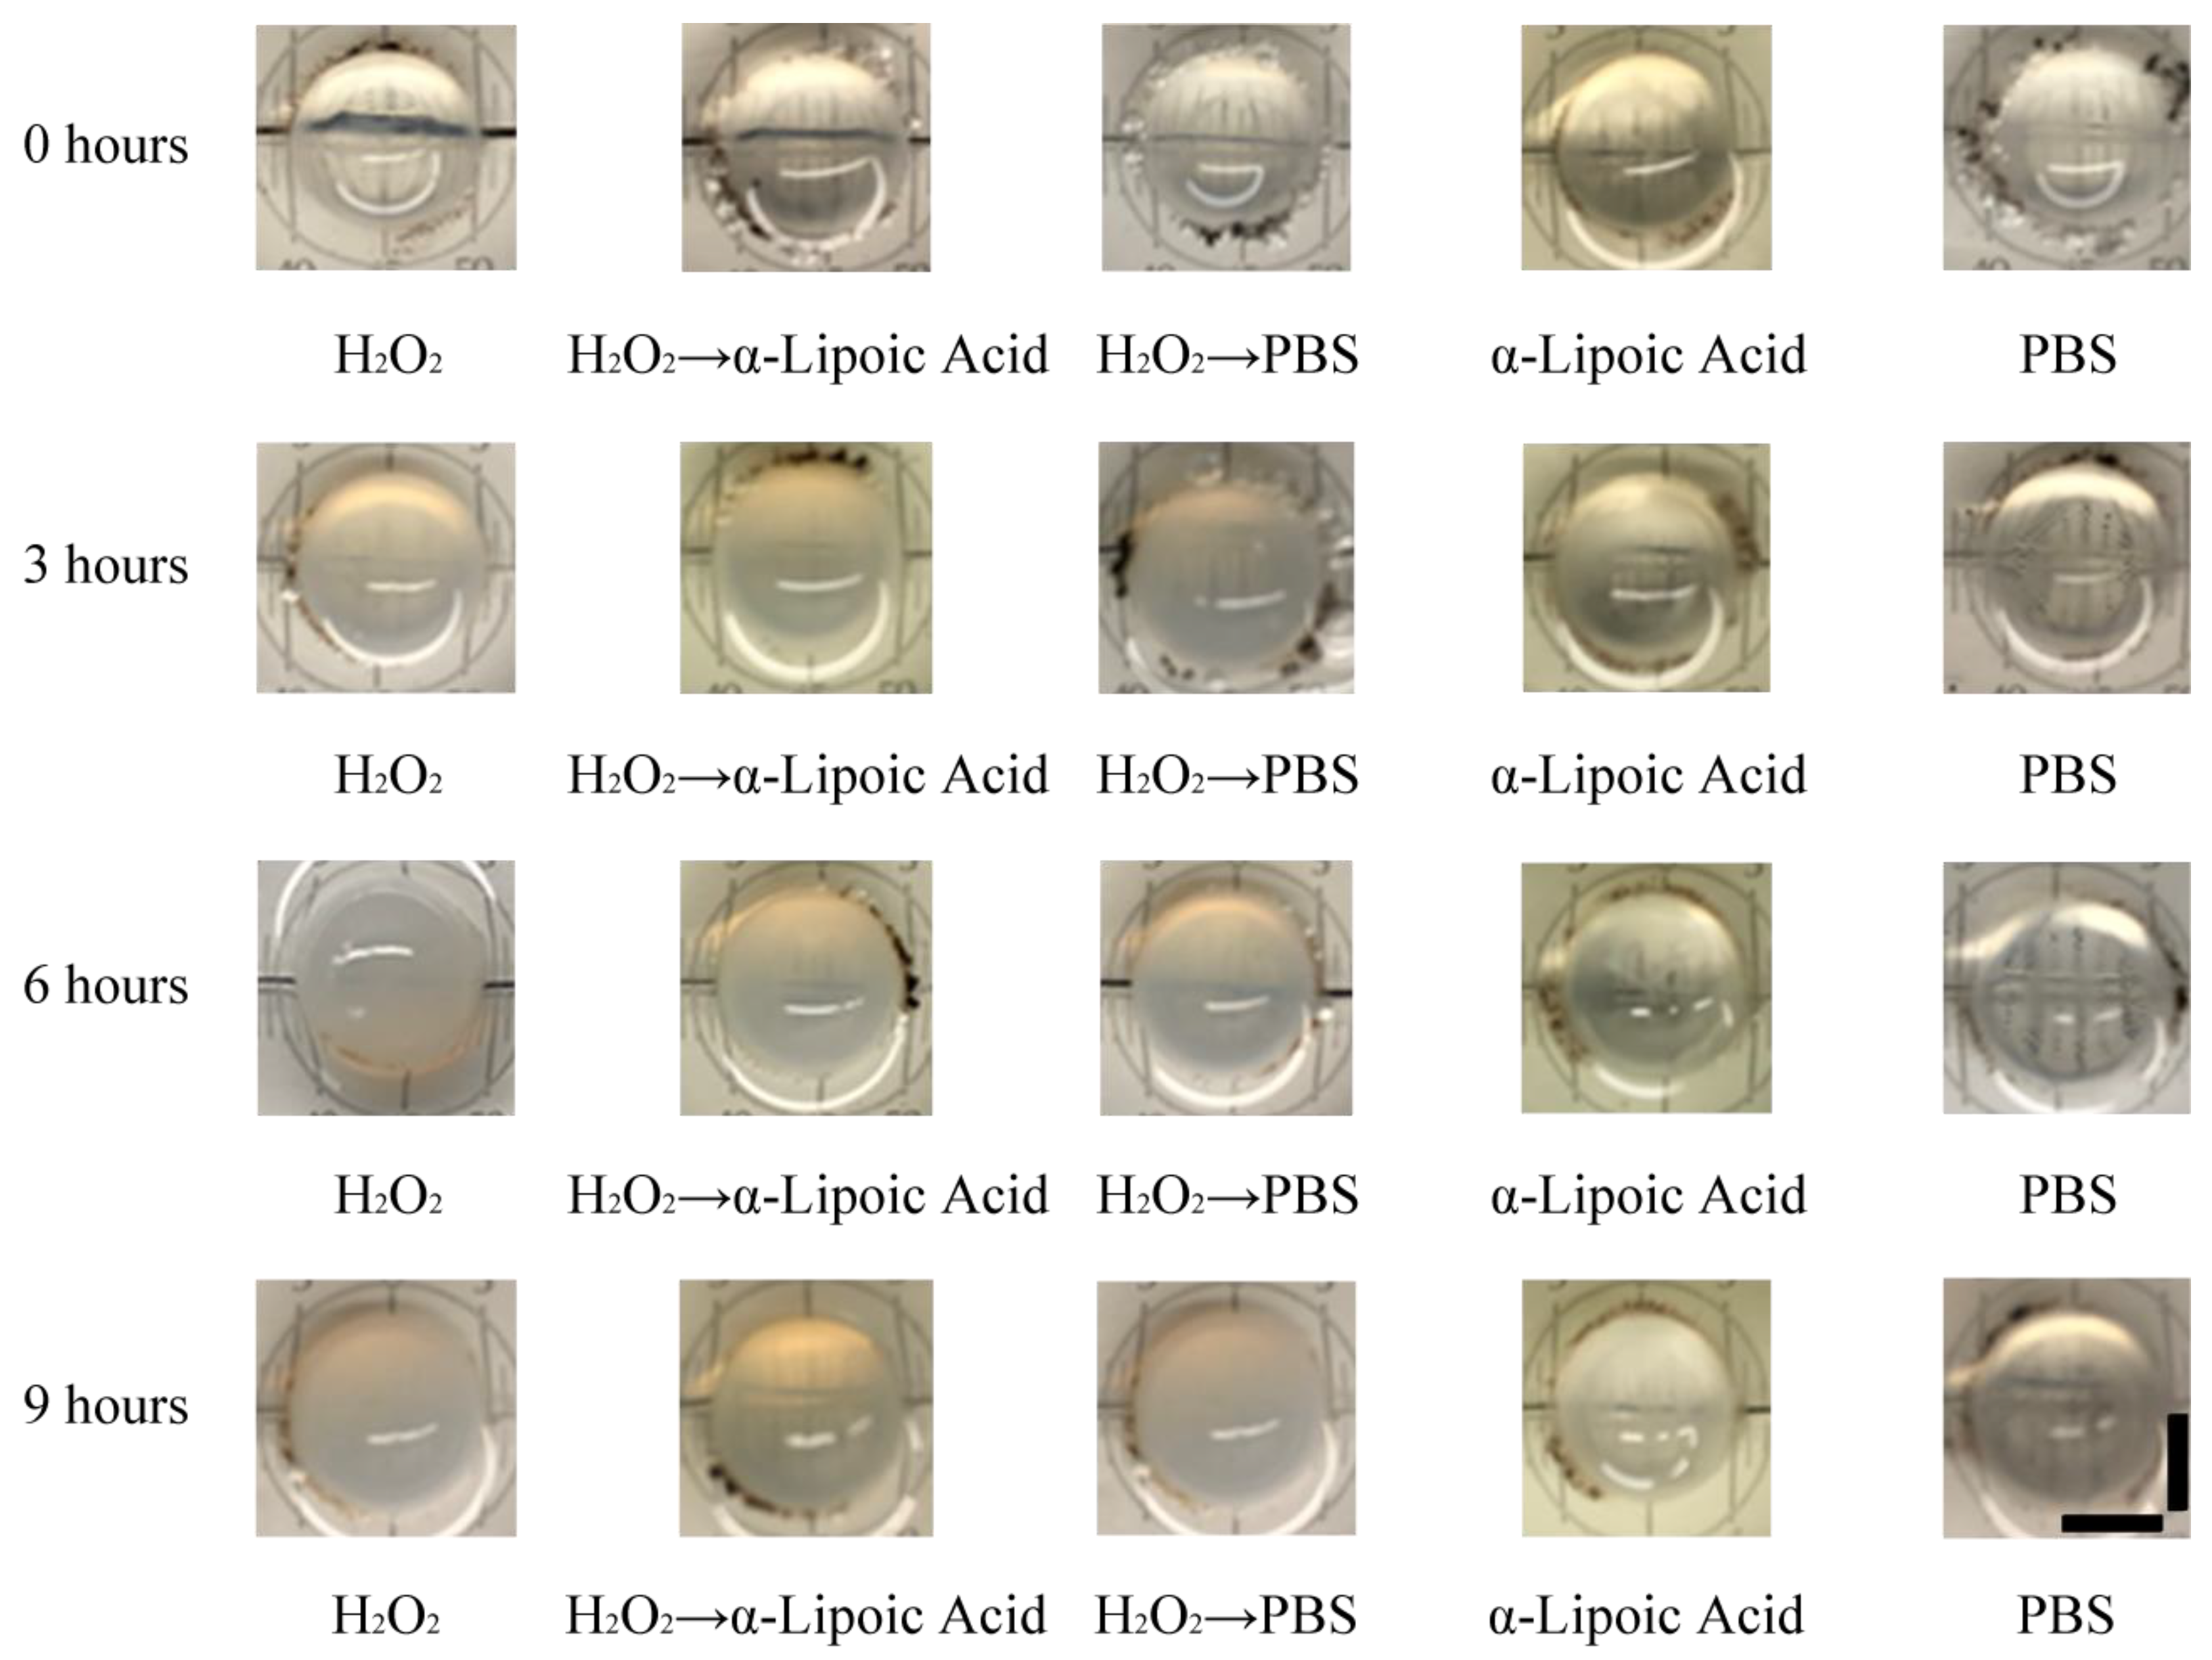
3.1. Lens Transparency Analysis

Figure 2 shows images taken by a standard dissection microscope (Stemi 508, Carl Zeiss Microscopy, LLC, Thornwood, NY, USA) of the lenses in different media. As shown in Figure 2, the lenses incubated in PBS and the ALA solution did not show any apparent changes in the transparency, even after 9 h. However, for the lenses incubated in the 500 mM hydrogen peroxide solution, the transparency was noticeably reduced. The most opaque lenses were the lenses incubated with H2O2 for 9 h, as expected. The lenses that were placed in PBS after 3 h incubation in H2O2 became more transparent at 6 h and 9 h. Moreover, lenses incubated with the ALA solution after 3 h incubation in the H2O2 solution became clearer after 6 h and 9 h than the lenses that were incubated in only PBS after incubation in the hydrogen peroxide solution, suggesting that ALA may be more effective in reversing the oxidative effects of H2O2 than PBS.
Figure 3 plots the results of quantitative analysis of the changes in optical transparency for all of the samples. As the opacity of the lenses seen in Figure 2 increased, the scattering in the OCT image increased, resulting in greater attenuation. Statistical testing by a one-way ANOVA showed that the attenuation was not significant as a function of time for the two H2O2-free groups and H2O2→PBS group (p > 0.05), but was significant for the H2O2-only (p = 0.005) and H2O2→ALA groups (p = 0.048). These results indicate that the H2O2→ALA media change helped the lenses recover their transparency, while the H2O2→PBS group did not recover its transparency. This is clear from Figure 3, where there H2O2→ALA group decreases its attenuation much more quickly than the H2O2→PBS after the media change at 3 h. At 9 h after incubation, there was a significant different in the attenuation of the H2O2-only (p = 0.004) and H2O2→PBS (p = 0.023) groups as compared to the PBS-only samples, but not in the H2O2→ALA (p = 0.34) and ALA-only (p = 0.65) groups as compared to the PBS-only samples.

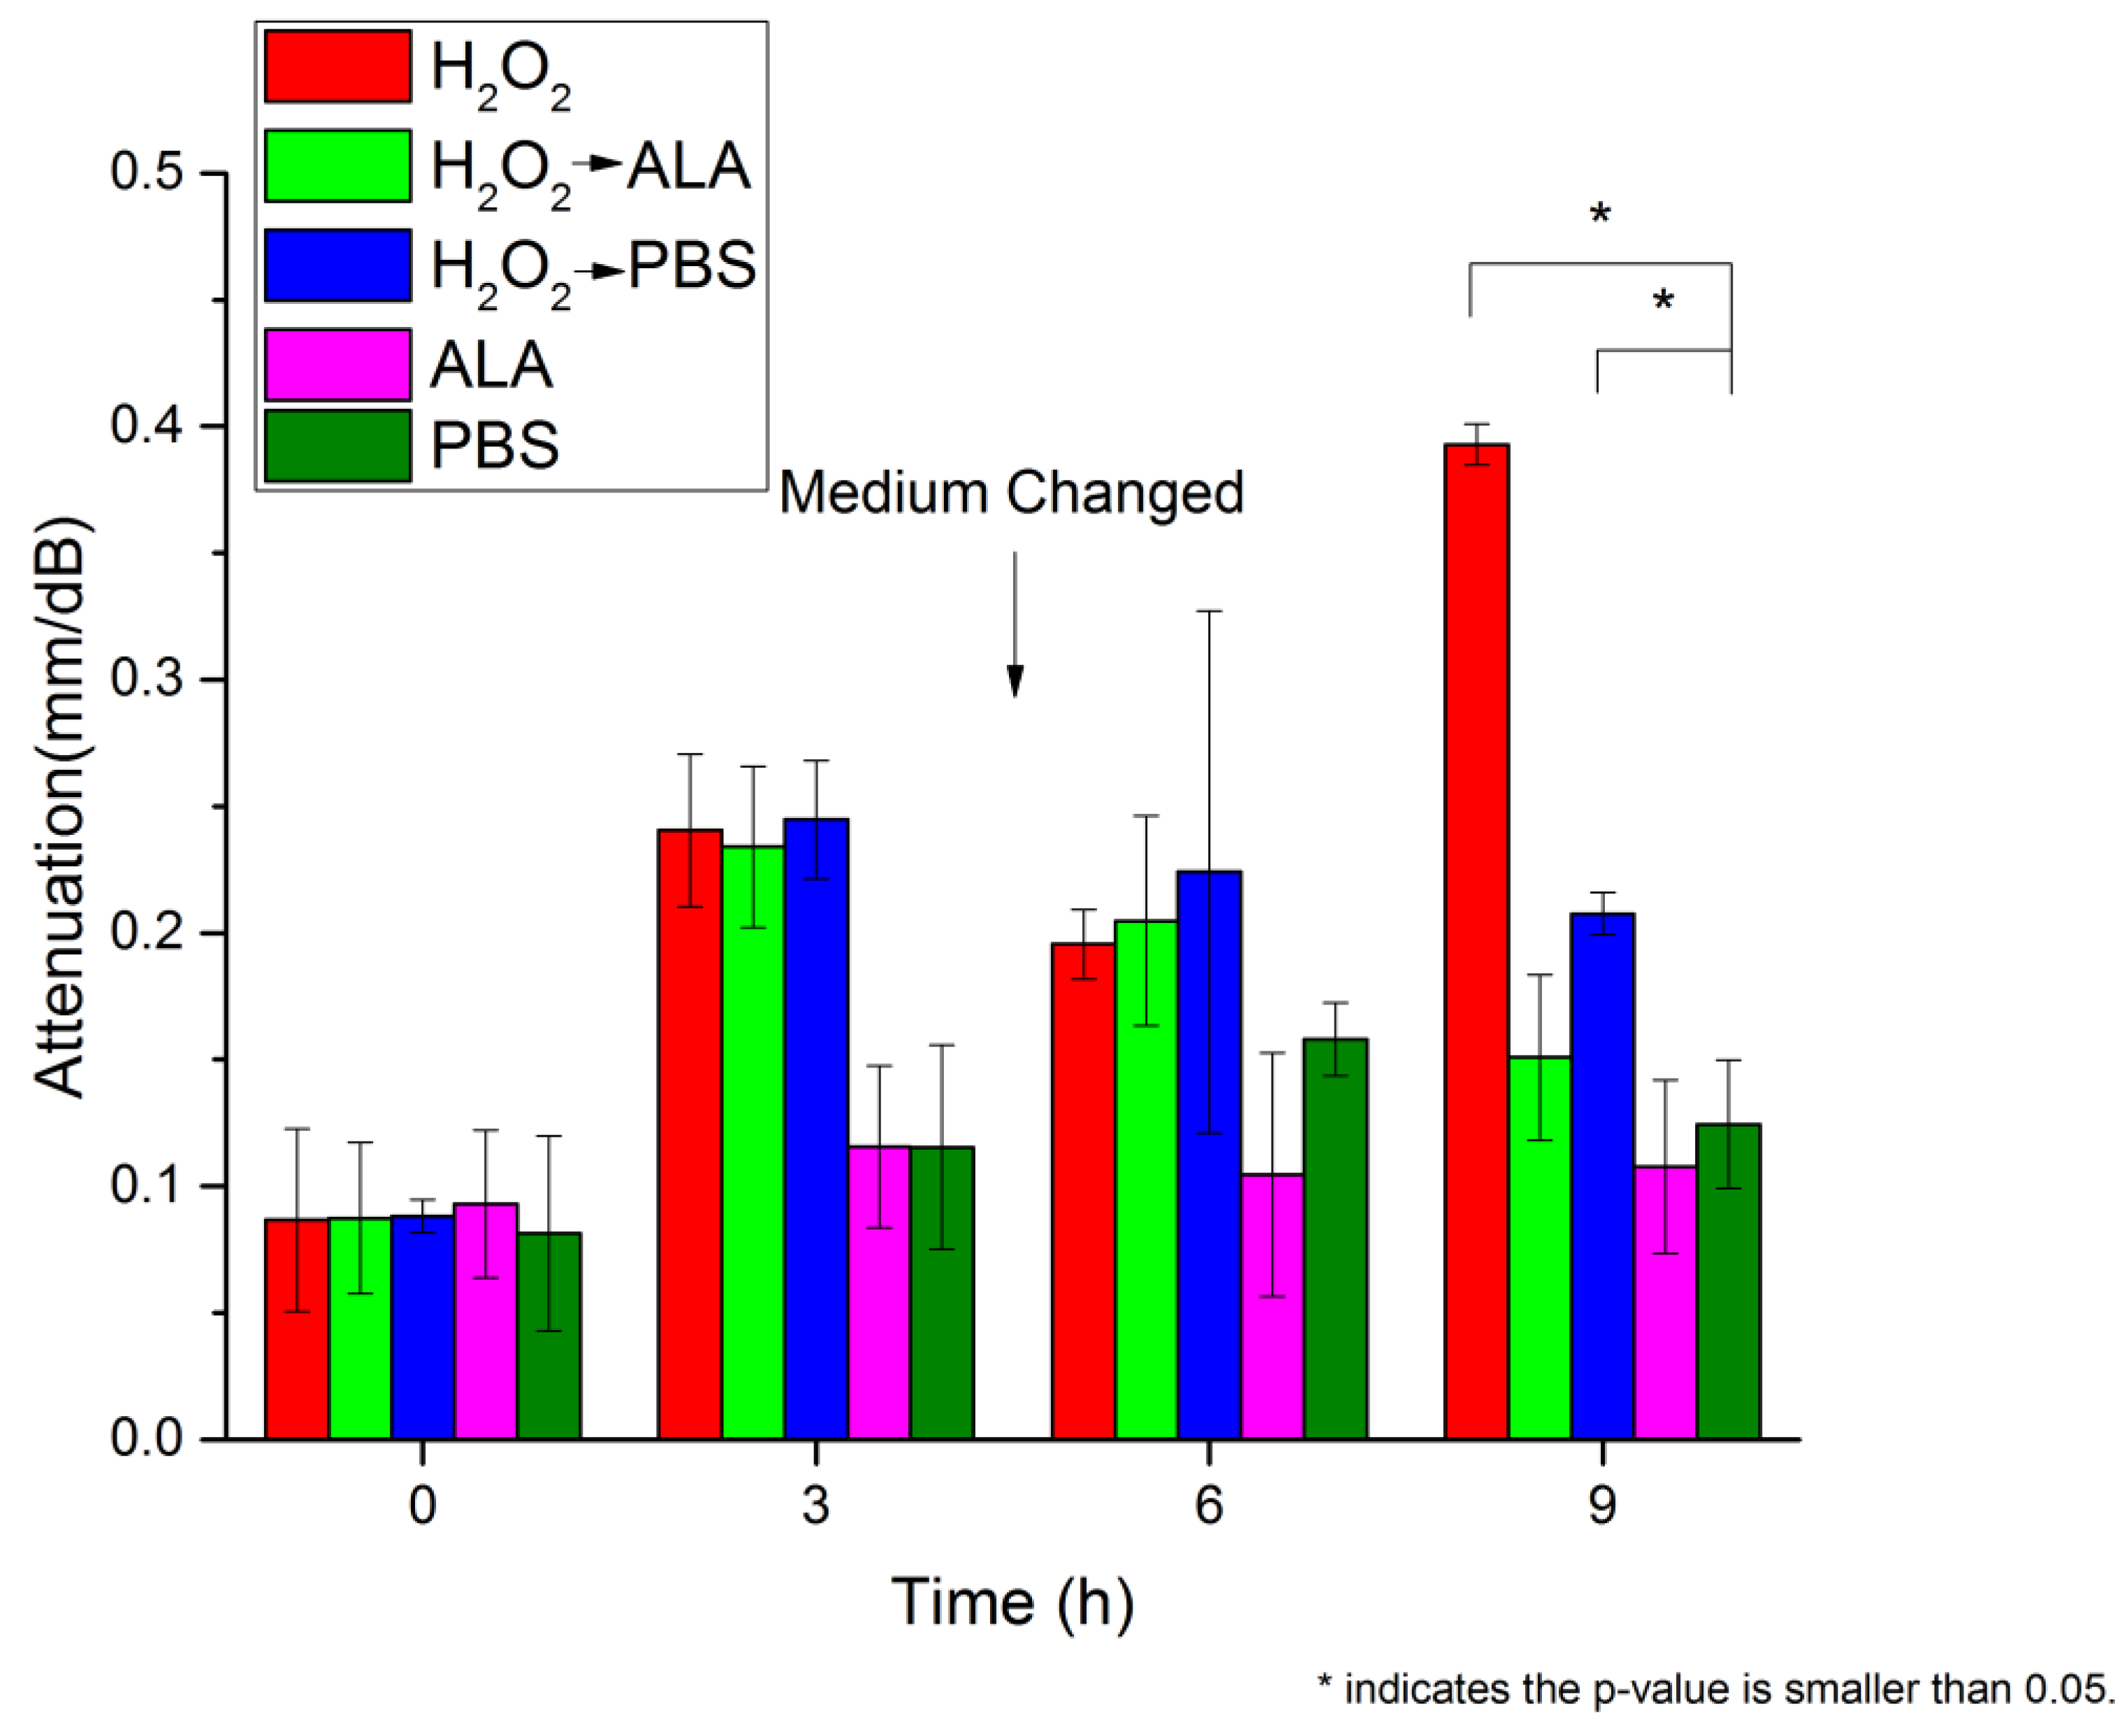
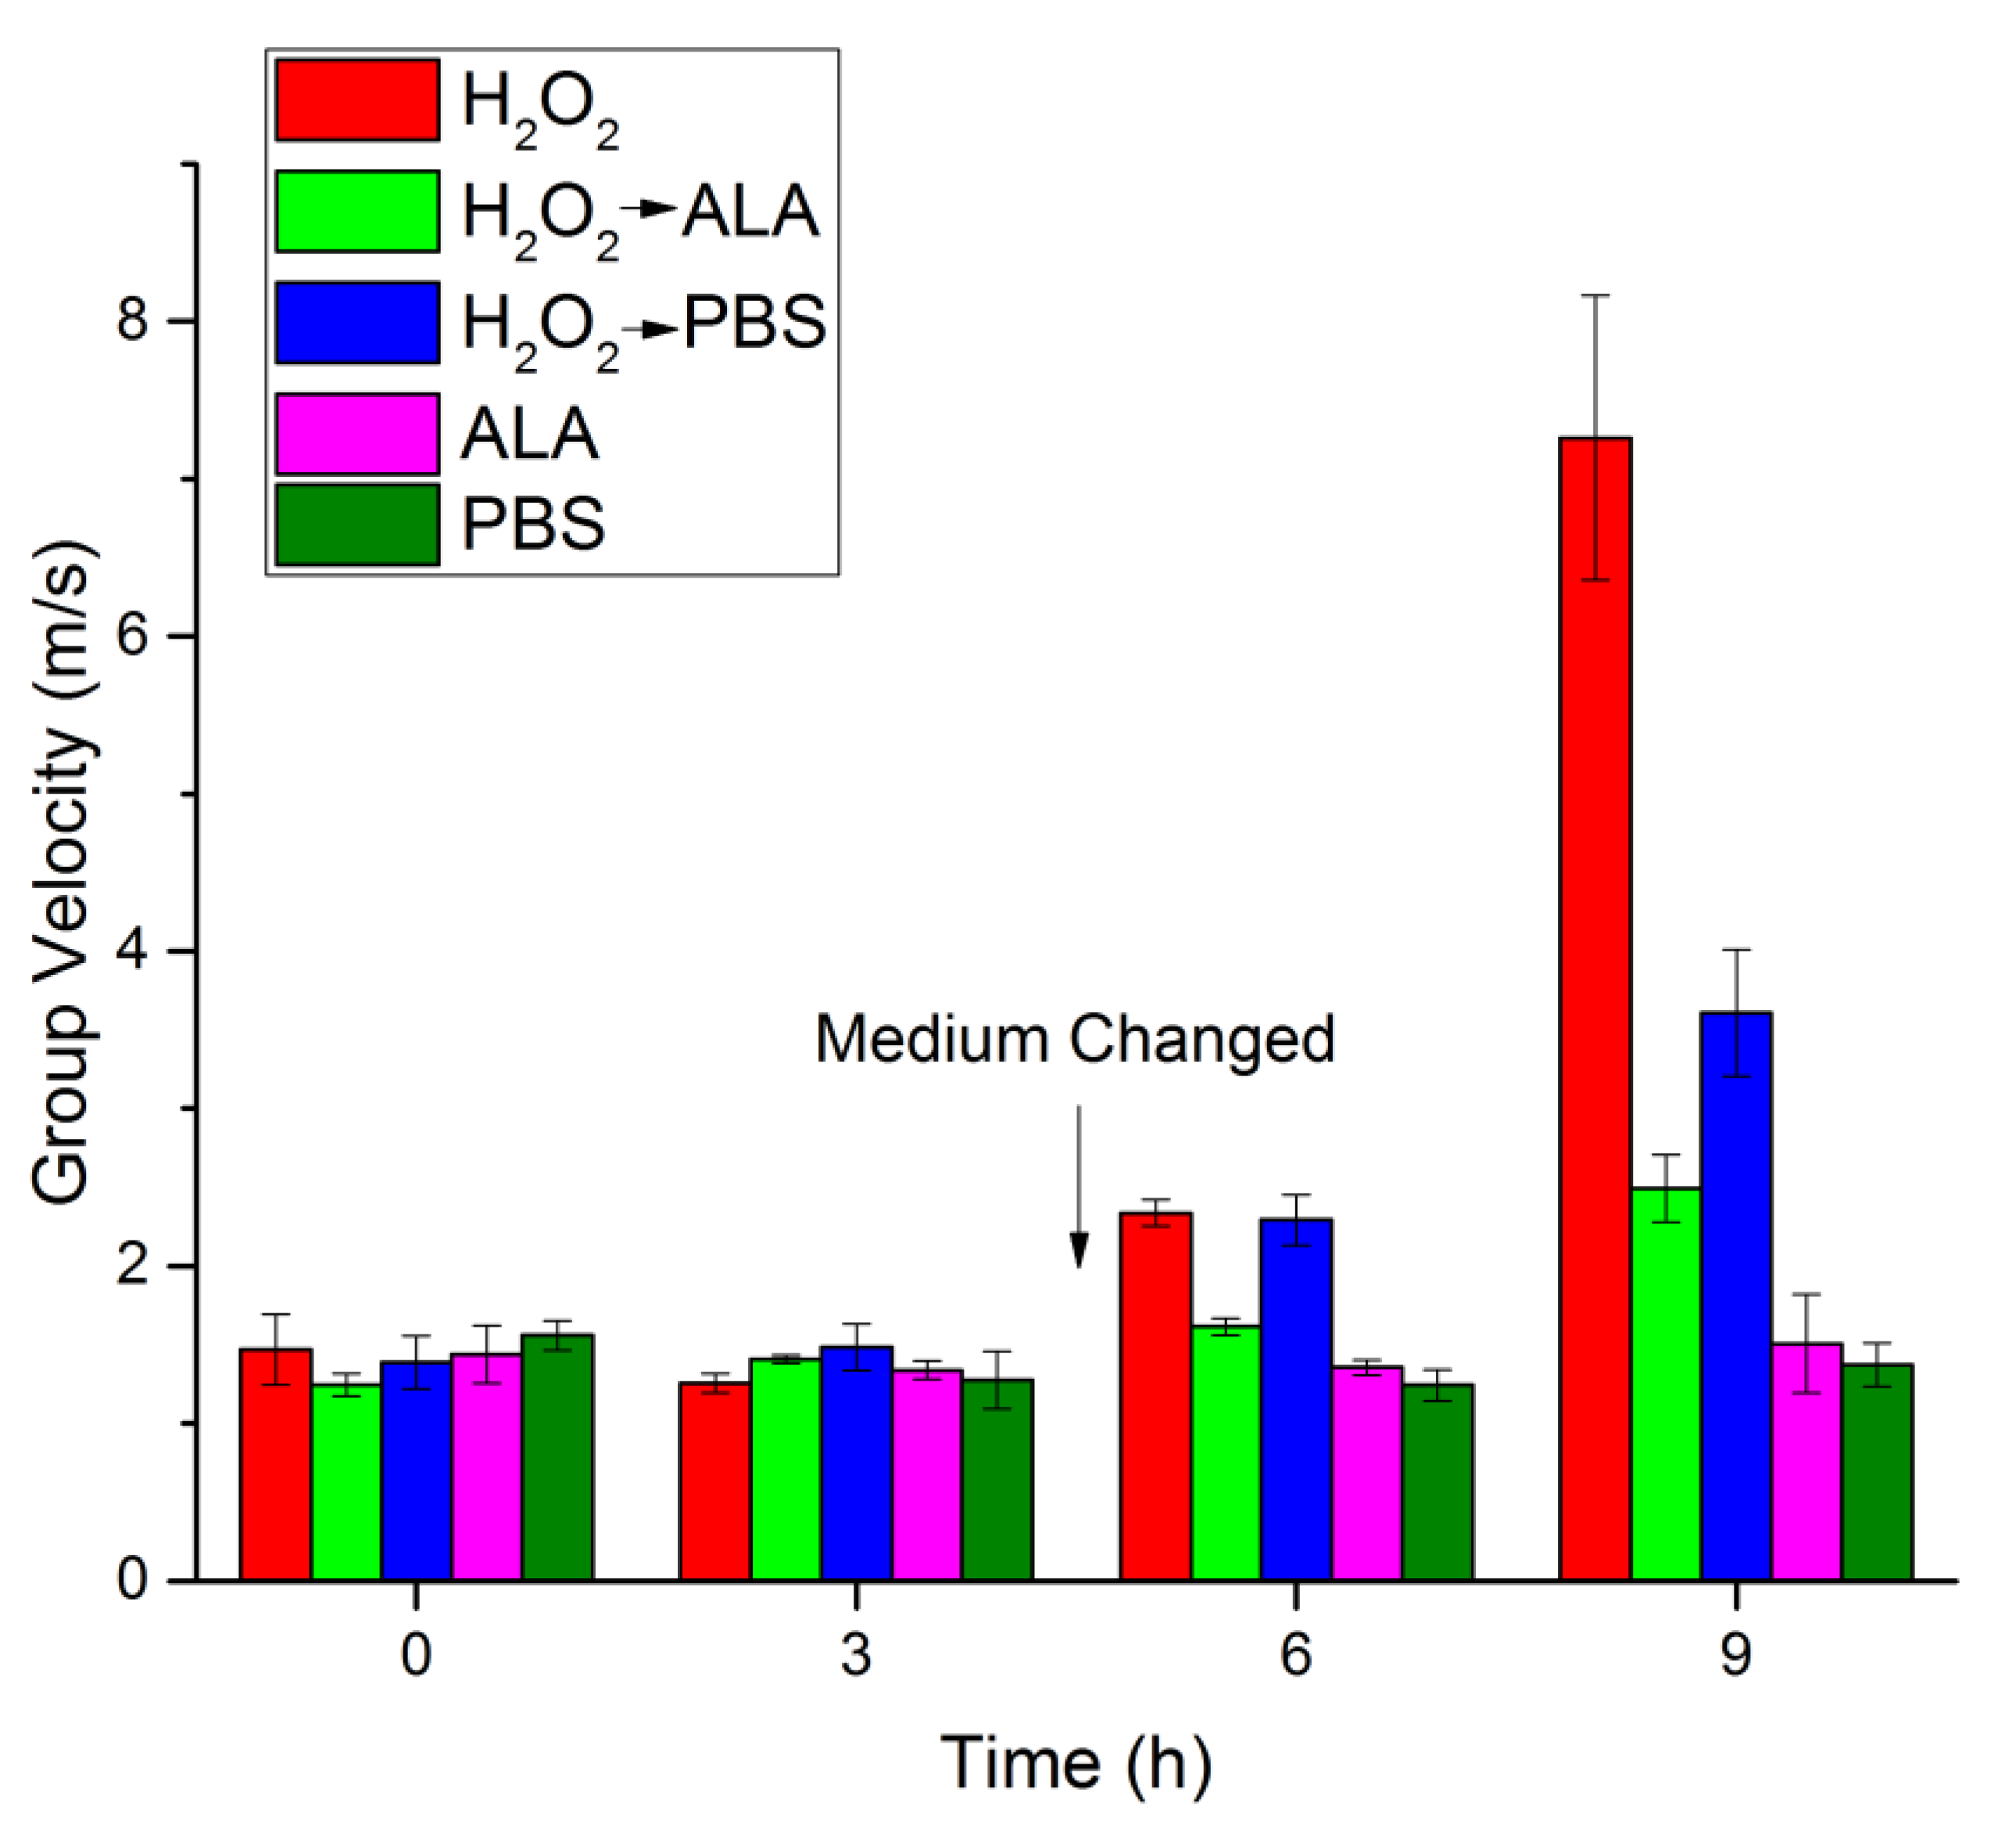
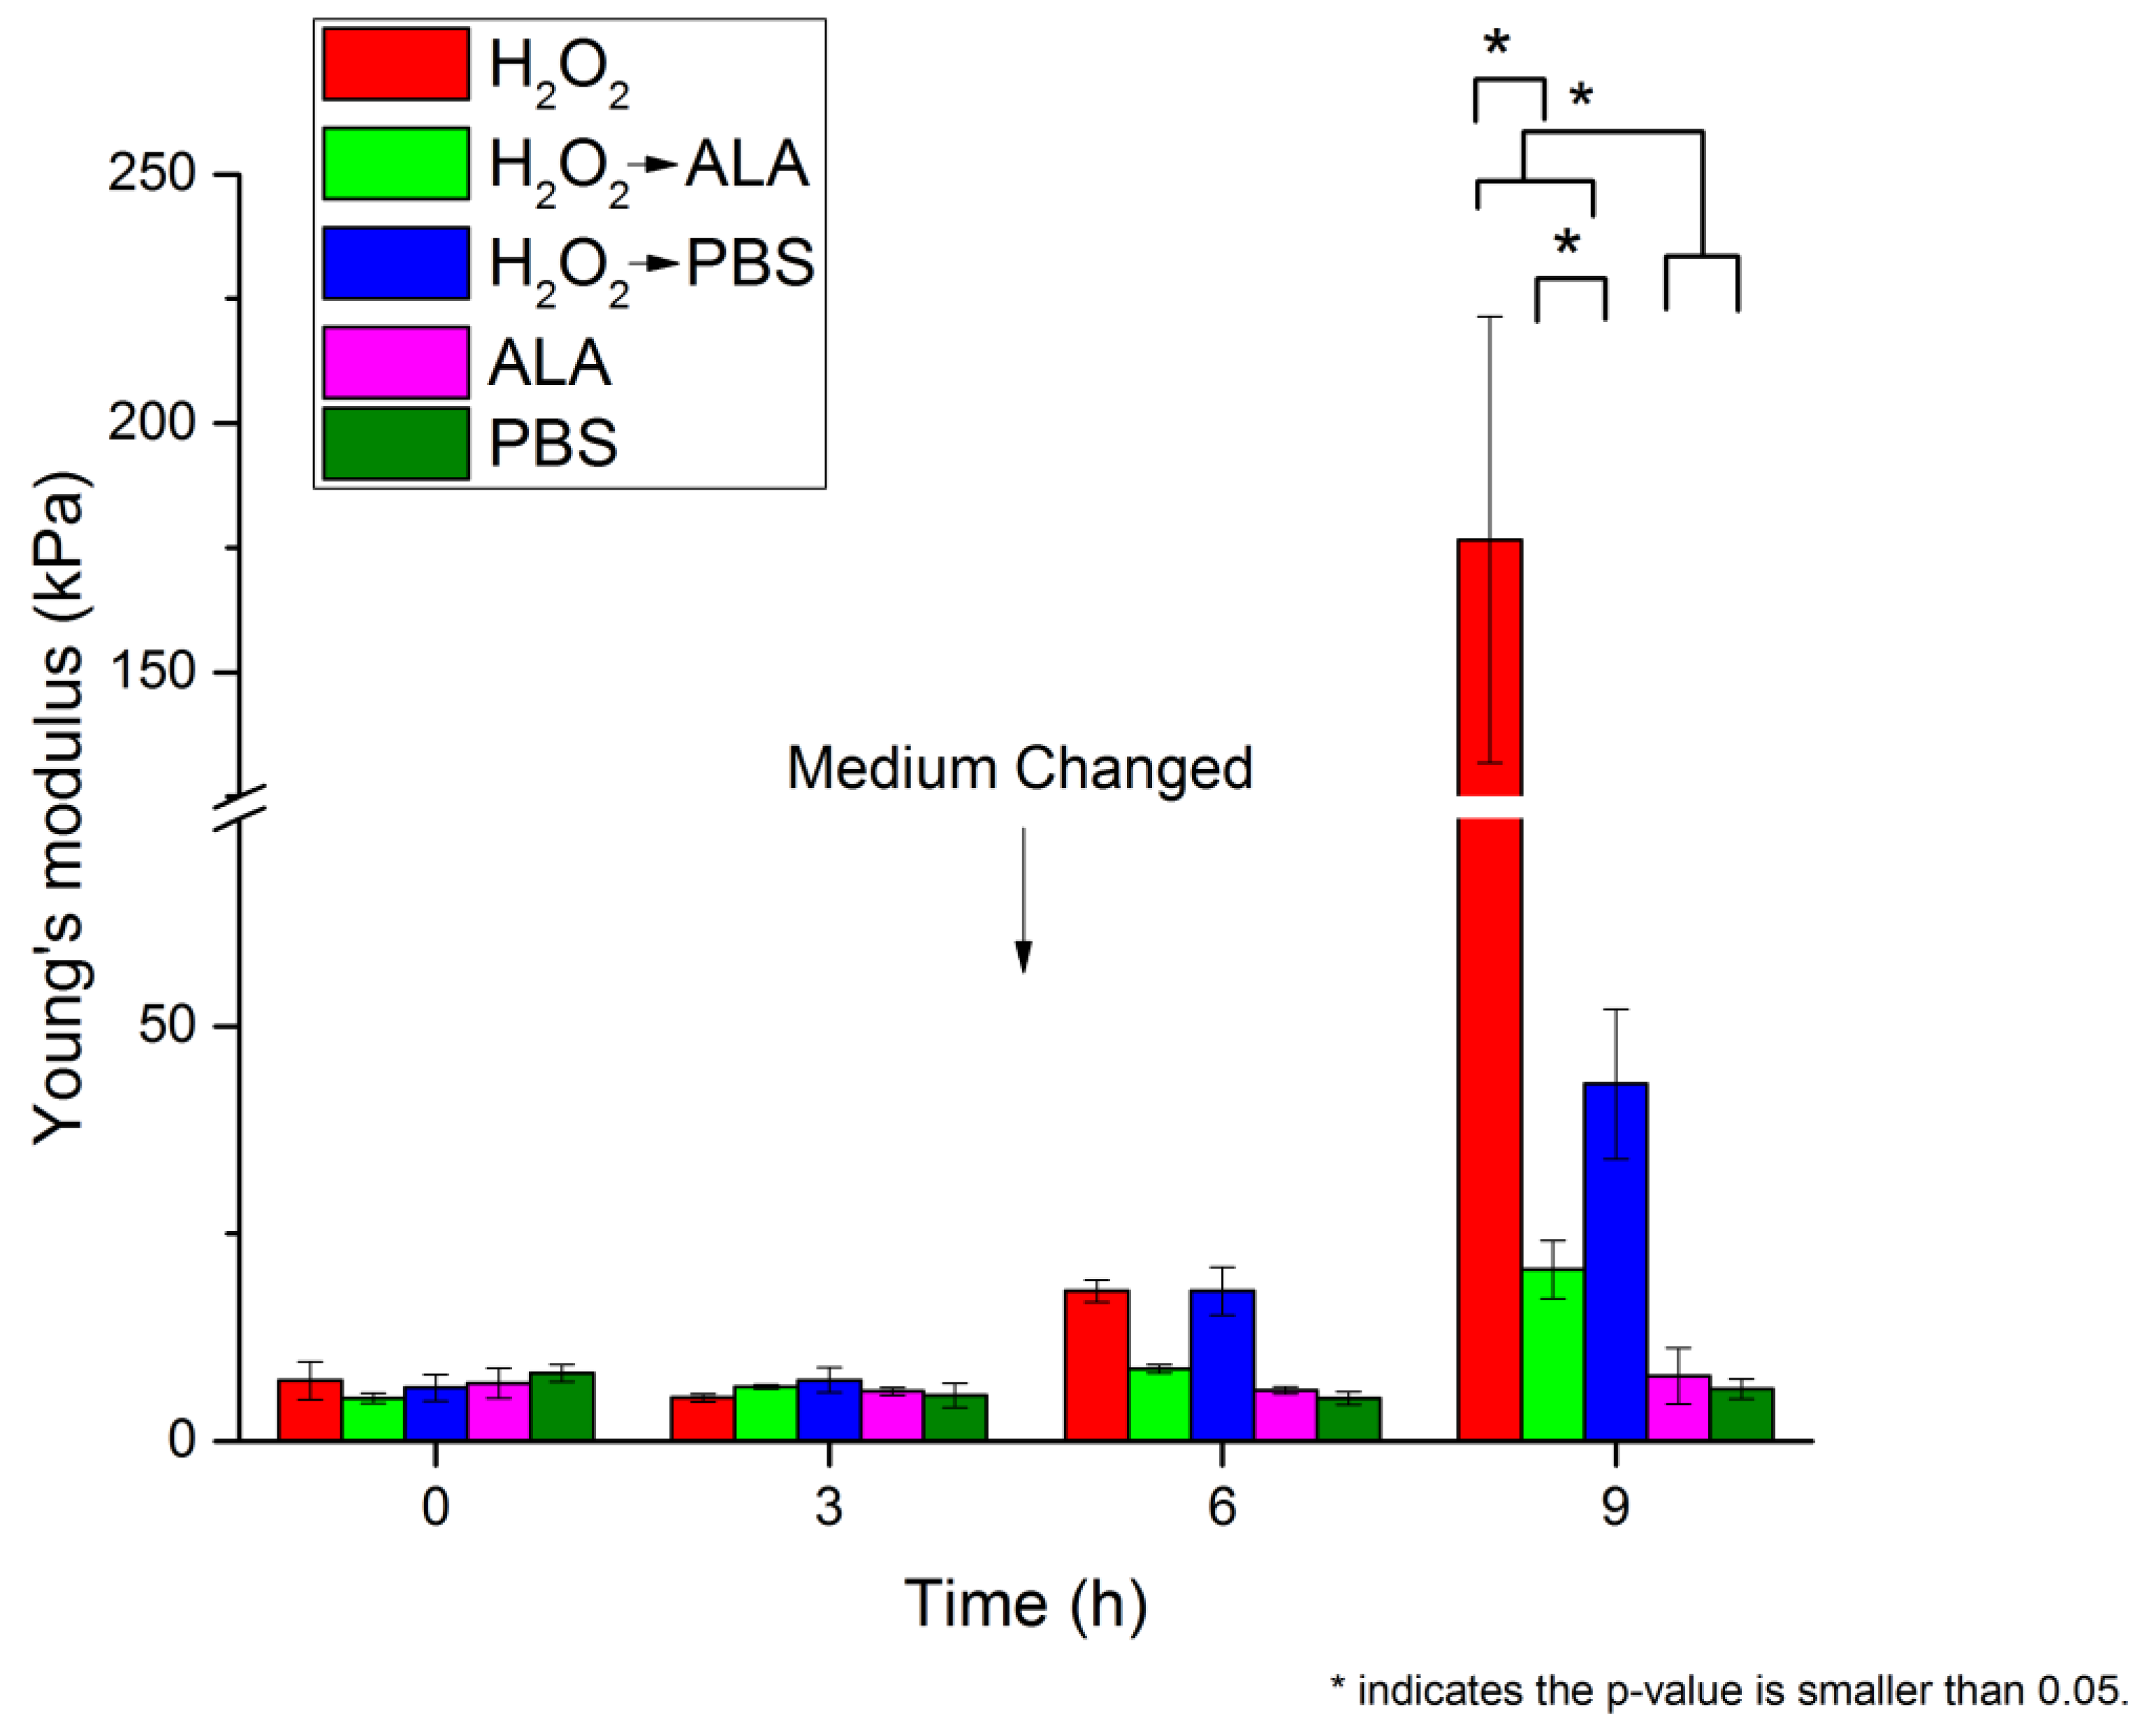
3.2. OCE Measurement of the Lenticular Biomechanical Properties

Figure 4 shows the space-time maps of two representative samples. Figure 4a was a sample from the H2O2→PBS group, and the elastic wave group velocity was 3.68 m/s. A space-time map of the elastic wave propagation in a sample from H2O2→ALA group is shown in Figure 4b, where the group velocity of the elastic wave was 2.32 m/s.
Figure 5 and Figure 6, as well as Table 1, show the OCE-measured group velocities and Young’s moduli estimated using Equation (1) for different storage media and times of incubation. The elastic wave group velocity of three H2O2 groups started increasing compared to the two other groups after 6 h of incubation. After 9 h, the elastic wave propagated much more quickly in the H2O2-only group and H2O2→PBS groups, and the wave speed was also greater, albeit less so, in the H2O2→ALA group as compared to the H2O2-free groups. The elastic wave group velocity did not change much. Those two H2O2-free groups (PBS group and ALA group) did not change their group velocities much during the 9-hour incubation. Because the Young’s moduli were calculated from group velocities. The major relationship among the Young’s moduli of the five groups were similar.
The Young’s modulus of the lenses incubated only in H2O2 solution for 9 h was significantly different from other groups (p < 0.001 by t-test). The Young’s modulus of the lenses incubated in H2O2 and then ALA solution increased significantly from 0 h to 9 h by one-way ANOVA test (p < 0.001). The lenses incubated in H2O2 and then PBS media also showed an increase in Young’s modulus at 0 h and at 9 h by one-way ANOVA test (p < 0.001). Meanwhile, Young’s moduli of the lenses that were incubated with PBS did not change significantly by one-way ANOVA test (p = 0.10) for 9 h. In addition, there was a statistically significant difference in Young’s modulus between the lenses stored in PBS and ALA solutions after incubation in H2O2 solution at the final 9-hour measurement by Student’s t-test (p = 0.04). Data for the wave velocities and Young’s moduli are summarized in Table 1.

4. Discussion

The oxidative cataract drastically alters not only the lenticular transparency but also biomechanical properties. OCE is well suited to investigate the changes in the crystalline lens associated with cataract onset, progression, and potential treatment. In this study, the surface wave velocity and Young’s modulus of the lens during oxidative cataractogenesis were measured, and a significant increase in the stiffness of the cataract lenses was observed. The most dramatic changes occurred between 6 and 9 h of incubation, even if the lenses were stored in the H2O2 medium for the first 3 h only. After more than 9 h of incubation in hydrogen peroxide, the lenses started to demonstrate some plastic behavior. The lenses are losing their elasticity and become very stiff. Although the relationship between lens stiffness and age is currently well known [27,28,29,30,31], studies on the influence of cataract formation on lens stiffness are still limited [30,56]. Based on our previous results and this study, both cold and oxidative cataracts cause the lens to become stiffer, and the changes in stiffness correlate with the changes in lens opacity [47].
As shown in Figure 2 and Figure 3, our results are in agreement with the literature, where the protective effect of ALA has been demonstrated [21,22,23,24,25,26]. The present study shows that the protective effect of ALA includes weakening of the stiffening caused by oxidative cataract. The results show a statistically significant difference between Young’s modulus of the lenses stored in PBS and ALA media after incubation in H2O2 solution for 3 h (43.03 ± 8.99 kPa versus 20.67 ± 3.51 kPa), which is in agreement with the work [15], where the decrease in the stiffness of the eight-month-old lenses after ALA treatment was shown in a mouse model. However, no statistically significant difference between control groups stored only in PBS and ALA media was observed in our results. This could be because the porcine lenses used in our study were obtained from relatively young animals, which did not have significant age-related changes in the biomechanical properties. Evaluating the effects of ALA on the aging-related biomechanical properties of the lens is the next step of our work.
Figure 2 and Figure 3 show how the optical changes of the lens started at the 3-hour point. However, Figure 5 and Figure 6 demonstrate that the mechanical changes of the lens started at 6 h after incubation in the media. Varma et al. applied a 2-hour interval and the reactive oxygen species starts to make sense after 2 h [57]. Because GSH is abundant in epithelium and the outer cortex, it needs some time to consume the inner reductant for ALA to show effects. Interestingly, after the treatment of ALA, the optical properties recovered, but the changes in lenticular stiffness persisted. Due to high concentration of H2O2, the changes in opacities were observed in a very short time (3 h). However, Spector et al. show that it took 72 h for 0.2 H2O2 mM alter the transparency of lenses [58], which was 2000 times less concentrated than the solution used in this work. A next step of our work is to assess the changes in attenuation and elasticity at various concentrations to more rigorously determine the link between oxidative induced damage effects on optical transparency and biomechanical properties of the lens.
While our measurements were made on extracted lenses, OCE could be successfully used for the measurement of lens elasticity in situ and in vivo. The values of the surface wave speed in this study are in agreement with our previous results obtained on both extracted lenses and in situ lenses, i.e., inside eye globe. To translate these values to Young’s modulus values, we used a model of surface wave in a homogeneous elastic medium. Such a model, however, has significant limitations. The elasticity distribution inside the lens is inhomogeneous, and the stiffness gradient is especially pronounced in aged lenses [28,31,33]. Therefore, the measurements on the lens surface are less sensitive to the mechanical properties of the nucleus, the central part of the lens. Moreover, different models gave different value of Young’s modulus in the previous research of some other groups. Hollman et al. has the results of 5-10 kPa [31]; Schachar et al. has the shear modulus of 6.2 Pa [59]; which means the Young’s modulus is about 20 Pa; and our previous result shows the Young’s Modulus is about 10 kPa [47]. However, since the trends are also important, we need to understand the absolute value based on our model to check the availability of our model. To overcome such limitations and quantify elasticity distribution in the lens, we have demonstrated the combination of dynamic OCE with Brillouin microscopy [36]. Another limitation in the model was that the effect of viscosity was not considered, but viscosity could play a significant role in the process of wave propagation. The measurement of the elastic wave dispersion in the lens, not only group velocity, along with the development of an appropriate wave propagation model that incorporates the geometry of the lens and specific boundary conditions, is the focus of our future work.

5. Conclusions

In this work, we first applied OCE to observe the elasticity of the lens during the oxidation process and mimic the oxidative cataract generation. Oxidative cataract was induced in ex vivo porcine lenses, and the lenticular stiffness was assessed using elastic wave-based OCE. The cataract lenses demonstrated a significant increase in stiffness and opaqueness. The results show that there is a relationship between the stiffness and transparency of the lenses, and α-lipoic acid may potentially preserve both stiffness and transparency of the lenses. Future work includes evaluating the effectiveness of α-lipoic acid in vivo using OCE.

Author Contributions

Conceptualization, H.Z., K.V.L. and S.R.A.; methodology, H.Z., M.S., and A.N.; software, M.S.; formal analysis, M.S. and H.Z.; investigation, H.Z., M.S. and A.N.; resources, K.V.L. and S.R.A.; writing—original draft preparation, H.Z. and S.R.A.; writing—review and editing, M.S., A.N. and K.V.L.; supervision, S.R.A. and K.V.L.; funding acquisition, S.R.A. and K.V.L. All authors have read and agreed to the published version of the manuscript.

Funding

This research was funded by the National Institutes of Health, grant numbers R01EY022362 and R01EY030063.

Institutional Review Board Statement

Not applicable.

Informed Consent Statement

Not applicable.

Data Availability Statement

Not applicable.

Conflicts of Interest

The authors declare no conflict of interest.

References

  1. Asbell, P.A.; Dualan, L.; Mindel, J.; Brocks, D.; Ahmad, M.; Epstein, S. Age-related cataract. Lancet 2005, 365, 599–609. [Google Scholar] [CrossRef]
  2. Pascolini, D.; Mariotti, S.P. Global estimates of visual impairment: 2010. Br. J. Ophthalmol. 2012, 96, 614–618. [Google Scholar] [CrossRef] [PubMed] [Green Version]
  3. Berendschot, T.T.; Broekmans, W.M.; Klopping-Ketelaars, I.A.; Kardinaal, A.F.; Van Poppel, G.; Van Norren, D. Lens aging in relation to nutritional determinants and possible risk factors for age-related cataract. Arch. Ophthalmol. 2002, 120, 1732–1737. [Google Scholar] [CrossRef] [Green Version]
  4. Singh, B.; Kumar, D.; Singh, R. Phytotherapeutics for management and prevention of cataract generation. Phytopharmacology 2012, 3, 93–110. [Google Scholar]
  5. Beebe, D.C.; Holekamp, N.M.; Shui, Y.-B. Oxidative damage and the prevention of age-related cataracts. Ophthalmic Res. 2010, 44, 155–165. [Google Scholar] [CrossRef] [PubMed] [Green Version]
  6. Cui, X.-L.; Lou, M. The effect and recovery of long-term H2O2 exposure on lens morphology and biochemestry. Exp. Eye Res. 1993, 57, 157–167. [Google Scholar] [CrossRef]
  7. McGinty, S.J.; Truscott, R.J.W. Presbyopia: The first stage of nuclear cataract? Ophthalmic Res. 2006, 38, 137–148. [Google Scholar] [CrossRef]
  8. Michael, R.; Bron, A.J. The ageing lens and cataract: A model of normal and pathological ageing. Philos. Trans. R. Soc. B 2011, 366, 1278–1292. [Google Scholar] [CrossRef] [PubMed] [Green Version]
  9. Taylor, A.; Davies, K.J.A. Protein oxidation and loss of protease activity may lead to cataract formation in the aged lens. Free Radic. Biol. Med. 1987, 3, 371–377. [Google Scholar] [CrossRef]
  10. Truscott, R.J. Age-related nuclear cataract—Oxidation is the key. Exp. Eye Res. 2005, 80, 709–725. [Google Scholar] [CrossRef]
  11. Dilley, K.J.; Pirie, A. Changes to the proteins of the human lens nucleus in cataract. Exp. Eye Res. 1974, 19, 59–72. [Google Scholar] [CrossRef]
  12. Kleiman, N.J.; Spector, A. DNA single-strand breaks in human lens epithelial-cells from patients with cataract. Curr. Eye Res. 1993, 12, 423–431. [Google Scholar] [CrossRef] [PubMed]
  13. Heruye, S.H.; Nkenyi, L.N.M.; Singh, N.U.; Yalzadeh, D.; Ngele, K.K.; Njie-Mbye, Y.-F.; Ohia, S.E.; Opere, C.A. Current trends in the pharmacotherapy of cataracts. Pharmaceuticals 2020, 13, 15. [Google Scholar] [CrossRef] [PubMed] [Green Version]
  14. Kamei, A. Glutathione levels of the human crystalline lens in aging and its antioxidant effect against the oxidation of lens proteins. Biol. Pharm. Bull. 1993, 16, 870–875. [Google Scholar] [CrossRef] [PubMed] [Green Version]
  15. Garner, W.H.; Garner, M.H. Protein disulfide levels and lens elasticity modulation: Applications for presbyopia. Invest. Ophthalmol. Vis. Sci. 2016, 57, 2851–2863. [Google Scholar] [CrossRef] [PubMed] [Green Version]
  16. Schulte, L.; Mao, J.; Reitz, J.; Sreeramulu, S.; Kudlinzki, D.; Hodirnau, V.V.; Meier-Credo, J.; Saxena, K.; Buhr, F.; Langer, J.D.; et al. Cysteine oxidation and disulfide formation in the ribosomal exit tunnel. Nat. Commun. 2020, 11, 5569. [Google Scholar] [CrossRef] [PubMed]
  17. Giblin, F.J.; Chakrapani, B.; Reddy, V.N. Glutathione and lens epithelial function. Invest. Ophthalmol. 1976, 15, 381–393. [Google Scholar] [PubMed]
  18. Giblin, F.J.; Mccready, J.P.; Reddan, J.R.; Dziedzic, D.C.; Reddy, V.N. Detoxification of H2O2 by cultured rabbit lens epithelial-cells—Participation of the glutathione redox cycle. Exp. Eye Res. 1985, 40, 827–840. [Google Scholar] [CrossRef]
  19. Williams, D.L. Oxidation, antioxidants and cataract formation: A literature review. Vet. Sci. 2006, 9, 292–298. [Google Scholar] [CrossRef]
  20. Packer, L.; Witt, E.H.; Tritschler, H.J. Alpha-lipoic acid as a biological antioxidant. Free Radic. Biol. Med. 1995, 19, 227–250. [Google Scholar] [CrossRef]
  21. Kan, E.; Kiliçkan, E.; Ayar, A.; Çolak, R. Effects of two antioxidants; a-lipoic acid and fisetin against diabetic cataract in mice. Int. Ophthalmol. 2015, 35, 115–120. [Google Scholar] [CrossRef] [PubMed]
  22. Khan, S.B.; Choudhary, R.; Vishwakarma, P.K.; Singh, A.; Shree, J.; Bodakhe, S.H. Protective effect of alpha-lipoic acid on progression of cataract formation in fructose-induced experimental cataract. Pharma. Nutr. 2017, 5, 127–132. [Google Scholar] [CrossRef]
  23. Kojima, M.; Sun, L.; Hata, I.; Sakamoto, Y.; Sasaki, H.; Sasaki, K. Efficacy of a-lipoic acid against diabetic cataract in rat. Jpn. J. Ophthalmol. 2007, 51, 10–13. [Google Scholar] [CrossRef]
  24. Li, Y.; Liu, Y.-Z.; Shi, J.-M.; Jia, S.-B. Alpha lipoic acid protects lens from H2O2-induced cataract by inhibiting apoptosis of lens epithelial cells and inducing activation of anti-oxidative enzymes. Asian Pac. J. Trop. Med. 2013, 6, 548–551. [Google Scholar] [CrossRef] [Green Version]
  25. Maitra, I.; Serbinova, E.; Trischler, H.; Packer, L. A-lipoic acid prevents buthionine sulfoximine-induced cataract formation in newborn rats. Free Radic. Biol. Med. 1995, 18, 823–829. [Google Scholar] [CrossRef]
  26. Williams, D.L. Effect of oral alpha lipoic acid in preventing the genesis of canine diabetic cataract: A preliminary study. Vet. Sci. 2017, 4, 18. [Google Scholar] [CrossRef] [PubMed] [Green Version]
  27. Krag, S.; Andreassen, T.T. Biomechanical measurements of the porcine lens capsule. Exp. Eye Res. 1996, 62, 253–260. [Google Scholar] [CrossRef] [PubMed]
  28. Weeber, H.A.; Eckert, G.; Pechhold, W.; van der Heijde, R.G. Stiffness gradient in the crystalline lens. Graefes Arch. Clin. Exp. Ophthalmol. 2007, 245, 1357–1366. [Google Scholar] [CrossRef] [Green Version]
  29. Weeber, H.A.; Eckert, G.; Soergel, F.; Meyer, C.H.; Pechhold, W.; van der Heijde, R.G. Dynamic mechanical properties of human lenses. Exp. Eye Res. 2005, 80, 425–434. [Google Scholar] [CrossRef] [PubMed]
  30. Heys, K.R.; Truscott, R.J.W. The stiffness of human cataract lenses is a function of both age and the type of cataract. Exp. Eye Res. 2008, 86, 701–703. [Google Scholar] [CrossRef]
  31. Hollman, K.W.; O’Donnell, M.; Erpelding, T.N. Mapping elasticity in human lenses using bubble-based acoustic radiation force. Exp. Eye Res. 2007, 85, 890–893. [Google Scholar] [CrossRef] [PubMed] [Green Version]
  32. Yoon, S.; Aglyamov, S.; Karpiouk, A.; Emelianov, S. A high pulse repetition frequency ultrasound system for the ex vivo measurement of mechanical properties of crystalline lenses with laser-induced microbubbles interrogated by acoustic radiation force. Phys. Med. Biol. 2012, 57, 4871–4884. [Google Scholar] [CrossRef] [PubMed] [Green Version]
  33. Yoon, S.; Aglyamov, S.; Karpiouk, A.; Emelianov, S. The mechanical properties of ex vivo bovine and porcine crystalline lenses: Age-related changes and location-dependent variations. Ultrasound Med. Biol. 2013, 39, 1120–1127. [Google Scholar] [CrossRef] [PubMed] [Green Version]
  34. Simsek, C.; Gokmen, O. The effects of vital dyes on mechanical properties of the human anterior lens capsule. Indian J. Ophthalmol. 2020, 68, 66–70. [Google Scholar]
  35. Scarcelli, G.; Kim, P.; Yun, S.H. In vivo measurement of age-related stiffening in the crystalline lens by brillouin optical microscopy. Biophys. J. 2011, 101, 1539–1545. [Google Scholar] [CrossRef] [PubMed] [Green Version]
  36. Ambekar, Y.S.; Singh, M.; Zhang, J.; Nair, A.; Aglyamov, S.R.; Scarcelli, G.; Larin, K.V. Multimodal quantitative optical elastography of the crystalline lens with optical coherence elastography and brillouin microscopy. Biomed. Opt. Express 2020, 11, 2041–2051. [Google Scholar] [CrossRef] [PubMed]
  37. Detorakis, E.T.; Drakonaki, E.E.; Ginis, H.; Karyotakis, N.; Pallikaris, I.G. Evaluation of iridociliary and lenticular elasticity using shear-wave elastography in rabbit eyes. Acta Med. 2014, 57, 9–14. [Google Scholar] [CrossRef] [PubMed] [Green Version]
  38. Park, S.; Yoon, H.; Larin, K.V.; Emelianov, S.Y.; Aglyamov, S.R. The impact of intraocular pressure on elastic wave velocity estimates in the crystalline lens. Phys. Med. Biol. 2016, 62, N45–N57. [Google Scholar] [CrossRef] [PubMed]
  39. Zhang, X.; Wang, Q.; Lyu, Z.; Gao, X.; Zhang, P.; Lin, H.; Guo, Y.; Wang, T.; Chen, S.; Chen, X. Noninvasive assessment of age-related stiffness of crystalline lenses in a rabbit model using ultrasound elastography. Biomed. Eng. Online 2018, 17, 1–11. [Google Scholar] [CrossRef] [Green Version]
  40. Zhou, H.Y.; Yan, H.; Yan, W.J.; Wang, X.C.; Li, Q.Y. Noninvasive stiffness assessment of the human lens nucleus in patients with anisometropia using an ultrasound elastography system. Int. J. Ophthalmol. 2020, 13, 399–405. [Google Scholar] [CrossRef] [PubMed]
  41. Li, Y.; Zhu, J.; Chen, J.J.; Yu, J.; Jin, Z.; Miao, Y.; Browne, A.W.; Zhou, Q.; Chen, Z. Simultaneously imaging and quantifying in vivo mechanical properties of crystalline lens and cornea using optical coherence elastography with acoustic radiation force excitation. APL Photonics 2019, 4, 1–10. [Google Scholar] [CrossRef] [Green Version]
  42. Li, Y.; Moon, S.; Chen, J.J.; Zhu, Z.K.; Chen, Z.P. Ultrahigh-sensitive optical coherence elastography. Light Sci. Appl. 2020, 9. [Google Scholar] [CrossRef] [PubMed] [Green Version]
  43. Wu, C.; Aglyamov, S.R.; Han, Z.L.; Singh, M.; Liu, C.H.; Larin, K.V. Assessing the biomechanical properties of the porcine crystalline lens as a function of intraocular pressure with optical coherence elastography. Biomed. Opt. Express 2018, 9, 6455–6466. [Google Scholar] [CrossRef] [PubMed]
  44. Wu, C.; Aglyamov, S.R.; Zhang, H.; Larin, K.V. Measuring the elastic wave velocity in the lens of the eye as a function of intraocular pressure using optical coherent elastography. Quantum Electron. 2019, 49, 20–24. [Google Scholar] [CrossRef]
  45. Larin, K.V.; Sampson, D.D. Optical coherence elastography—OCT at work in tissue biomechanics [invited]. Biomed. Opt. Express 2017, 8, 1172–1202. [Google Scholar] [CrossRef] [PubMed] [Green Version]
  46. Wu, C.; Han, Z.; Wang, S.; Li, J.; Singh, M.; Liu, C.H.; Aglyamov, S.; Emelianov, S.; Manns, F.; Larin, K.V. Assessing age-related changes in the biomechanical properties of rabbit lens using a coaligned ultrasound and optical coherence elastography system. Invest. Ophthalmol. Vis. Sci. 2015, 56, 1292–1300. [Google Scholar] [CrossRef] [PubMed] [Green Version]
  47. Zhang, H.; Wu, C.; Singh, M.; Nair, A.; Aglyamov, S.; Larin, K. Optical coherence elastography of cold cataract in porcine lens. J. Biomed. Opt. 2019, 24, 1–7. [Google Scholar] [CrossRef] [PubMed] [Green Version]
  48. McNamara, M.; Augusteyn, R.C. The effects of hydrogen peroxide on lens proteins: A possible model for nuclear cataract. Exp. Eye Res. 1984, 38, 45–56. [Google Scholar] [CrossRef]
  49. Carbajal, E.F.; Baranov, S.A.; Manne, V.G.; Young, E.D.; Lazar, A.J.; Lev, D.C.; Pollock, R.E.; Larin, K.V. Revealing retroperitoneal liposarcoma morphology using optical coherence tomography. J. Biomed. Opt. 2011, 16, 020502. [Google Scholar] [CrossRef]
  50. Wang, S.; Larin, K.V.; Li, J.S.; Vantipalli, S.; Manapuram, R.K.; Aglyamov, S.; Emelianov, S.; Twa, M.D. A focused air-pulse system for optical-coherence-tomography-based measurements of tissue elasticity. Laser Phys. Lett. 2013, 10, 10. [Google Scholar] [CrossRef] [PubMed]
  51. Song, S.; Huang, Z.; Wang, R.K. Tracking mechanical wave propagation within tissue using phase-sensitive optical coherence tomography: Motion artifact and its compensation. J. Biomed. Opt. 2013, 18, 121505. [Google Scholar] [CrossRef] [PubMed]
  52. Wang, S.; Liu, C.H.; Zakharov, V.P.; Lazar, A.J.; Pollock, R.E.; Larin, K.V. Three-dimensional computational analysis of optical coherence tomography images for the detection of soft tissue sarcomas. J. Biomed. Opt. 2014, 19. [Google Scholar] [CrossRef] [PubMed]
  53. Han, Z.; Li, J.; Singh, M.; Wu, C.; Liu, C.-h.; Wang, S.; Idugboe, R.; Raghunathan, R.; Sudheendran, N.; Aglyamov, S.R. Quantitative methods for reconstructing tissue biomechanical properties in optical coherence elastography: A comparison study. Phys. Med. Biol. 2015, 60, 3531. [Google Scholar] [CrossRef] [PubMed] [Green Version]
  54. Doyle, J.F. Wave propagation in structure: Spectral analysis using fast discrete Fourier transforms. In Mechanical Engineering Series; Springer-Verlag: New York, NY, USA, 1997. [Google Scholar]
  55. Vilupuru, A.S.; Glasser, A. Optical and biometric relationships of the isolated pig crystalline lens. Ophthalmic Physiol. Opt. 2001, 21, 296–311. [Google Scholar] [CrossRef] [Green Version]
  56. Ozgokce, M.; Batur, M.; Alpaslan, M.; Yavuz, A.; Batur, A.; Seven, E.; Arslan, H. A comparative evaluation of cataract classifications based on shear-wave elastography and b-mode ultrasound findings. J. Ultrasound 2019, 22, 447–452. [Google Scholar] [CrossRef] [PubMed]
  57. Varma, S.D.; Hegde, K.R.; Kovtun, S. Oxidative damage to lens in culture: Reversibility by pyruvate and ethyl pyruvate. Ophthalmologica 2006, 220, 52–57. [Google Scholar] [CrossRef] [PubMed]
  58. Spector, A.; Wang, G.M.; Wang, R.R.; Garner, W.H.; Moll, H. The prevention of cataract caused by oxidative stress in cultured rat lenses. I. H2O2 and photochemically induced cataract. Curr. Eye Res. 1993, 12, 163–179. [Google Scholar] [CrossRef] [PubMed]
  59. Schachar, R.A.; Chan, R.W.; Fu, M. Viscoelastic shear properties of the fresh porcine lens. Br. J. Ophthalmol. 2007, 91, 366–368. [Google Scholar] [CrossRef] [Green Version]
Figure 1. Schematic of the OCE system. (a) A micro-air pulse is co-aligned with an SD-OCT system to detect air pulse-induced elastic waves on the surface of the excised porcine lens and (b) the sample holder.
Photonics 08 00207 g001
Figure 2. Photos of the lenses as a function of time and incubation media. The lenses at (top row) 0 h, (second row) 3 h, (third row) 6 h, and (fourth row) 9 h incubation time in the noted media. The scale bar is 5 mm.
Photonics 08 00207 g002
Figure 3. The attenuation calculated from the OCT images of the lenses incubated with five different media. The data is presented at the intersample mean ± standard deviation (N = 3 for each group). The asterisks indicate statistical significance (p < 0.05) determined by Student’s t-test.
Photonics 08 00207 g003
Figure 4. Space-time maps of one (a) H2O2→PBS and (b) H2O2→ALA lens at nine hours. The elastic wave propagation velocity was (a) 3.68 m/s and (b) 2.32 m/s.
Photonics 08 00207 g004
Figure 5. The surface wave group velocities measured in the lenses incubated with five different media. The data is presented at the inter-sample mean ± standard deviation (N = 3 for each group).
Photonics 08 00207 g005
Figure 6. The OCE-estimated Young’s moduli for the lenses incubated with five different media. The data are presented at the intersample mean ± standard deviation (N = 3 for each group). The asterisks indicate statistical significance (p < 0.05) determined by Student’s t-test.
Photonics 08 00207 g006
Table 1. Surface wave group velocities and Young’s moduli of the lenses incubated in different storage media. The error is the intersample standard deviation.
0 h3 h6 h9 h
cg (m/s)E (kPa)cg (m/s)E (kPa)cg (m/s)E (kPa)cg (m/s)E (kPa)
H2O21.47 ± 0.227.28 ± 2.291.26 ± 0.065.21 ± 0.512.34 ± 0.0818.09 ± 1.337.26 ± 0.90176.62 ± 44.86
H2O2 → ALA1.25 ± 0.075.15 ± 0.601.41 ± 0.036.55 ± 0.251.62 ± 0.058.69 ± 0.552.49 ± 0.2120.67 ± 3.51
H2O2 → PBS1.39 ± 0.176.44 ± 1.611.49 ± 0.157.35 ± 1.512.29 ± 0.1618.08 ± 2.873.61 ± 0.4043.03 ± 8.99
ALA1.44 ± 0.186.95 ± 1.801.34 ± 0.065.98 ± 0.511.36 ± 0.056.12 ± 0.441.51 ± 0.317.82 ± 3.38
PBS1.56 ± 0.098.18 ± 1.061.28 ± 0.185.54 ± 1.471.25 ± 0.105.17 ± 0.781.37 ± 0.146.28 ± 1.21
Publisher’s Note: MDPI stays neutral with regard to jurisdictional claims in published maps and institutional affiliations.

