Article

Performance Evaluation of Underwater Wireless Optical Communication System by Varying the Environmental Parameters

1
Department of Electronics and Computer Engineering, National Taiwan University of Science and Technology, Taipei 106335, Taiwan
2
Graduate Institute of Electro-Optical Engineering, National Taiwan University of Science and Technology, Taipei 106335, Taiwan
3
Department of Photonics, Feng Chia University, Taichung 40724, Taiwan
*
Author to whom correspondence should be addressed.
Photonics 2021, 8(3), 74; https://doi.org/10.3390/photonics8030074
Submission received: 29 January 2021 / Revised: 9 March 2021 / Accepted: 10 March 2021 / Published: 11 March 2021
(This article belongs to the Special Issue Optical Network and Access Technologies)

Abstract

:
Underwater wireless optical communication (UWOC) has been considered a promising technology for high-speed underwater transmission. Some Gb/s level UWOC systems applying visible light have been demonstrated with a transmission distance of several meters or more. Many of the previous works focus on the advanced technologies to push the systems’ capacity–distance performance. However, practical environmental factors issue such as flow turbulence and temperature variation are seldom studied through specific statistical/theoretical models. In this paper, a UWOC system using a 450 nm blue light laser source was set up using a 1.5-m water tank with mirrors located on both sides for single or multiple reflections corresponding to different transmission distances. The blue laser was modulated by a 1.25 Gbps NRZ-OOK format with PRBS of 7, 24 or 31, respectively, for system performance comparison. The bit error rate (BER) values were measured in 1.5, 3.0 and 6 m, respectively, for system evaluation. At room temperature, the BER value was down to 10 × 10−8 for a 1.25 Gbps data rate in a 6 m transmission. Then, the UWOC transmission system experiment was carried out under several environmental parameters such as temperature, turbulence, artificial seawater by adding salt to simulate practical application in river or sea. When a submerged motor with an output of 1200 L/h was used as a water flow turbulence source, the impact to BER and transmission quality was negligible. For the temperature change issue, the experiment shows that around the original temperature of 25 °C had the best BER as compared to other temperature ranges from 10 to 50 °C. For artificial seawater issues by adding salt to simulate the real seawater environment. The transmission distance was only 3-m instead of 6 m, mainly due to particle scattering and water disturbance. With the motor pump on, the power penalty was 1 dB at 10 × 10−8 BER when compared to the motor pump off.

1. Introduction

In the past few years, wireless optical communication (WOC) has been extensively studied and practically applied in free space and/or underwater because the optical wave has a higher data rate, low power, and low cost when comparing with radiofrequency and microwave frequency. Most of the prior works studied the OWC in free space. For example, Khalighi et al. conducted a survey on free-space optical (FSO) communications in [1], Ghassemlooy’s group studied terrestrial free-space optical communications in [2], Zhu’s group dealt with the FSO through atmospheric turbulence channels in [3], Paul et al. studied jamming-mitigation and performance evaluation of FSO in [4], Gu et al. demonstrated FSO-based fronthaul networks in [5], Yeh et al. proposed an FSO access network that allows 25 km fiber transmission under different weather conditions in [6]. Moreover, Jung et al. investigate FSO links over strong turbulence combined with various pointing error conditions in [7]. On the contrary, underwater wireless optical communication is seldom studied because it is more difficult to set up, and the light source is limited in visible light.
Due to the abundant marine resources, many scholars have studied the underwater wireless optical communication system. UWOC is more challenging than other wireless optical communication systems. It can be used for real-time video transmission in oceanographic research, offshore oil exploration, seabed measurement, monitoring, etc. Zhu et al. reviewed recent progress in and perspectives of UWOC [8]. Duntley found that the attenuation of blue and green light in water is much smaller than that of red light in the wavelength range of 450–550 nm [9]. Gilbert proved that the attenuation of blue-green light in water is relatively small, which laid the foundation for the UWOC system [10]. These applications in the underwater medium environment are required to communicate with the outside world.
Oubei et al. demonstrated a high-speed UWOC link using TO-9 pigtailed 520 nm LD with data rates up to 23 Gbit/s over a 7 m distance using the OOK-NRZ modulation scheme [11]. Chao et al. demonstrated a high-speed UWOC link using 450 nm laser diode and an avalanche photodetector offering a data rate up to 2 Gbps over a 12-m long and 1.5 Gbps over a record 20-m long underwater channel [12]. Watson et al. proposed a UWOC system using InGaN-based laser 450 nm wavelength with 4.7 Gbit/s data rate NRZ-OOK signal under different water-types [13]. Chen et al. achieved 5.3 Gbps transmission without power-loading (PL) transmission and 5.5 Gbps PL transmission in 5 m air channel and 21 m underwater channel [14]. Li constructed an underwater OWC system in a 1.6 m water tank using blue and green laser sources for bidirectional transmission and successfully transmitted at a 100 Mbps transmission rate [15]. Li et al. proposed a wavelength division multiplexing (WDM), four-level pulse amplitude modulation (PAM4) methodology with a channel capacity of 100 Gb/s. They set up a 500 m free-space and 5 m UWOC system [16]. To sum up, most of the research works above focused on improving the distance and transmission speed of UWOC. The signal performance degradation affected by practical environmental factors such as flow turbulence and temperature variation has seldom been studied either by experiments or theory. Thus, the theoretical analyses may run the risk of overestimating the signal performance and ignore some critical factors for practical applications.
In this paper, the UWOC transmission system with a 450 nm blue laser source is designed and established in a 1.5-m water tank. Then, the UWOC 1.25 Gbps data rate digital transmission was carried out under 6-m transmission with a BER value better than 10 × 10−8 at room temperature. Several parameters such as temperature, turbulence, artificial seawater by adding salt to simulate practical application in a river or sea were studied and discussed.
The paper is organized as the following. Section 2 explains the system architecture. Calculation of transmission distance in the ideal state will be addressed in Section 3. The optical loss due to coupling, mirror reflection and water absorption will be discussed. In Section 4, the environmental factors were carried out under different parameters such as temperature, turbulence, water refractive index/quality variation will be discussed. Finally, Section 5 provides the conclusion. The paper’s results may be useful in facing a real UWOC system in the river or sea. It also provides useful references and suggestions for further research in UWOC.

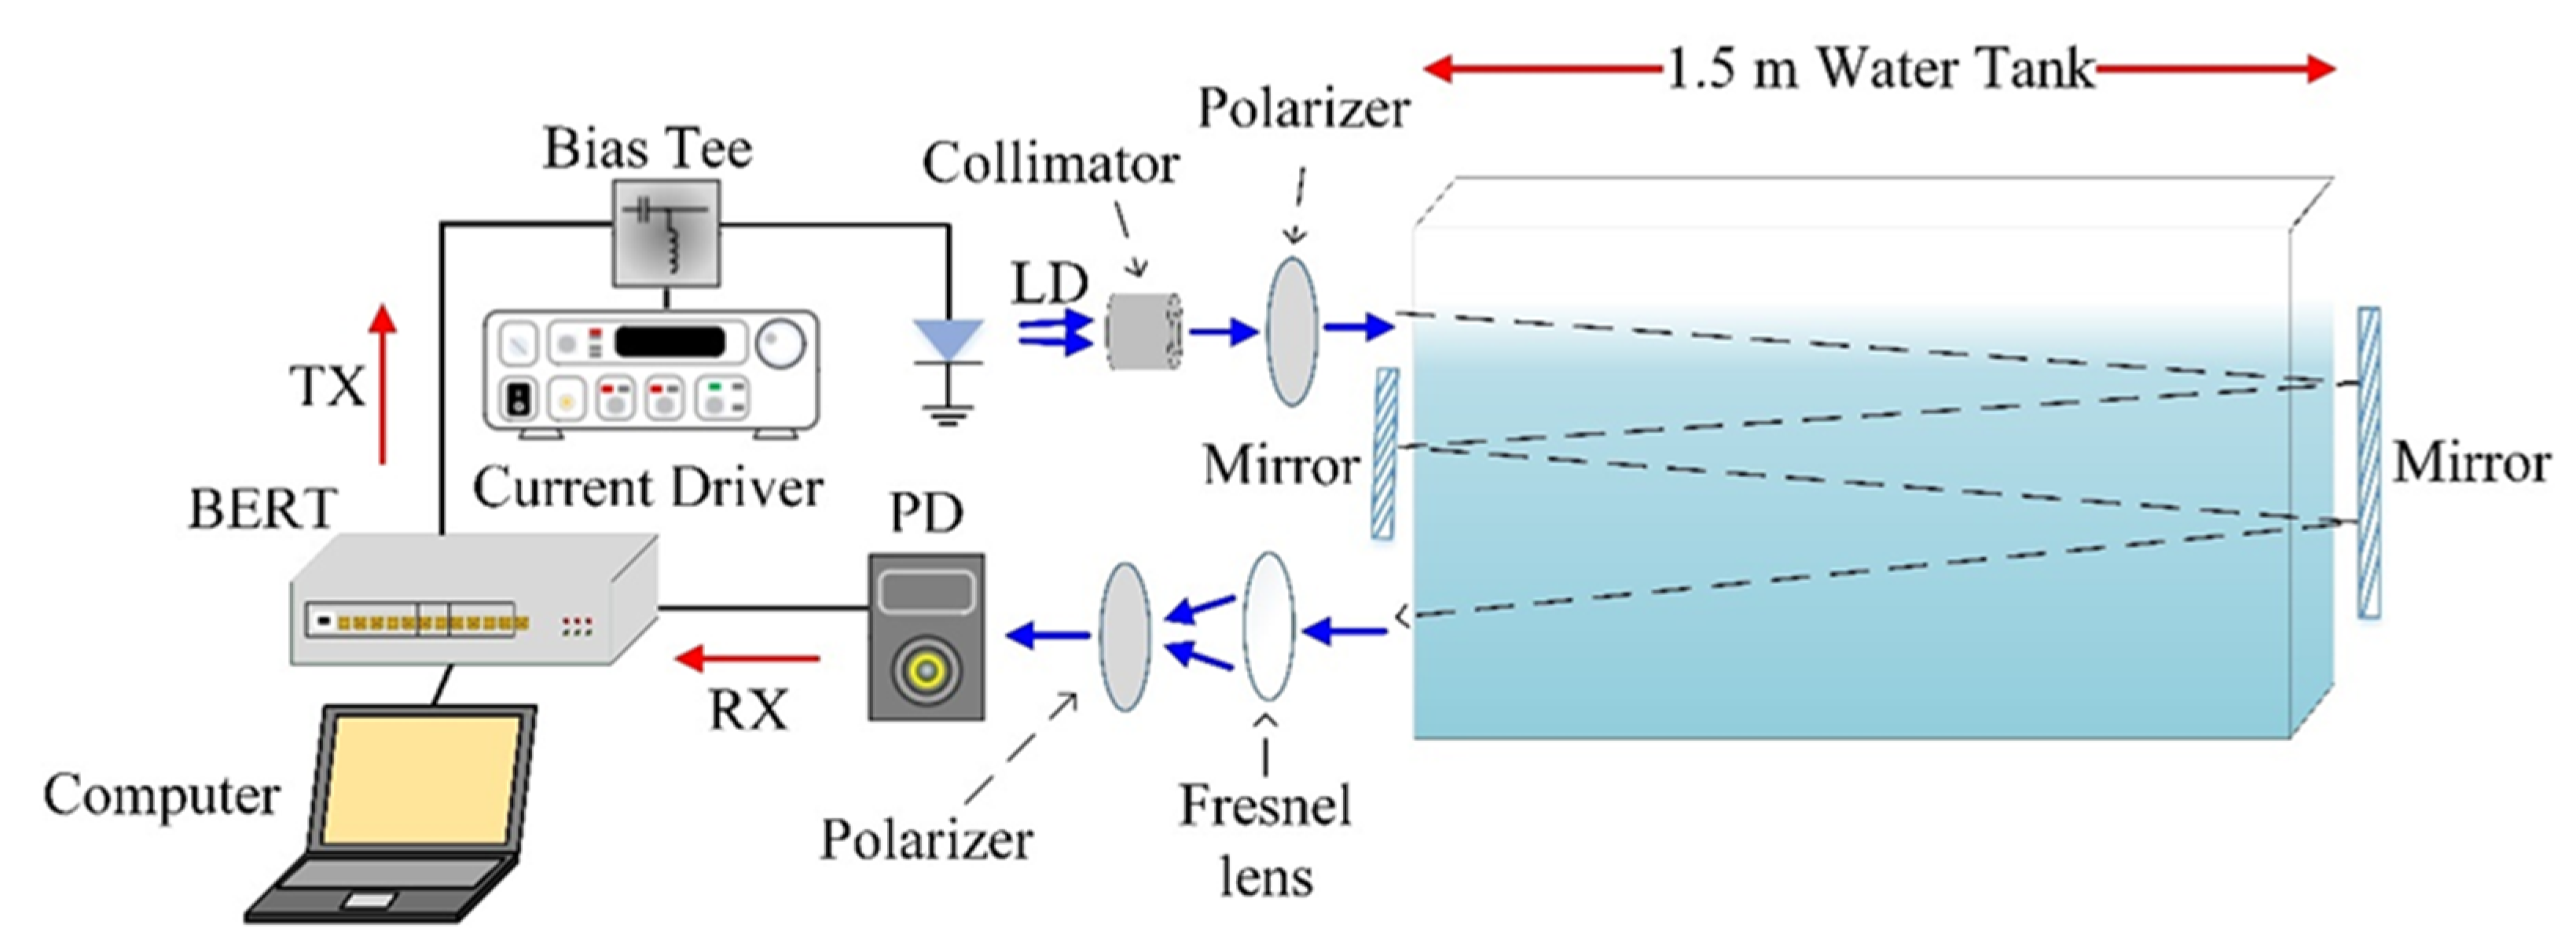
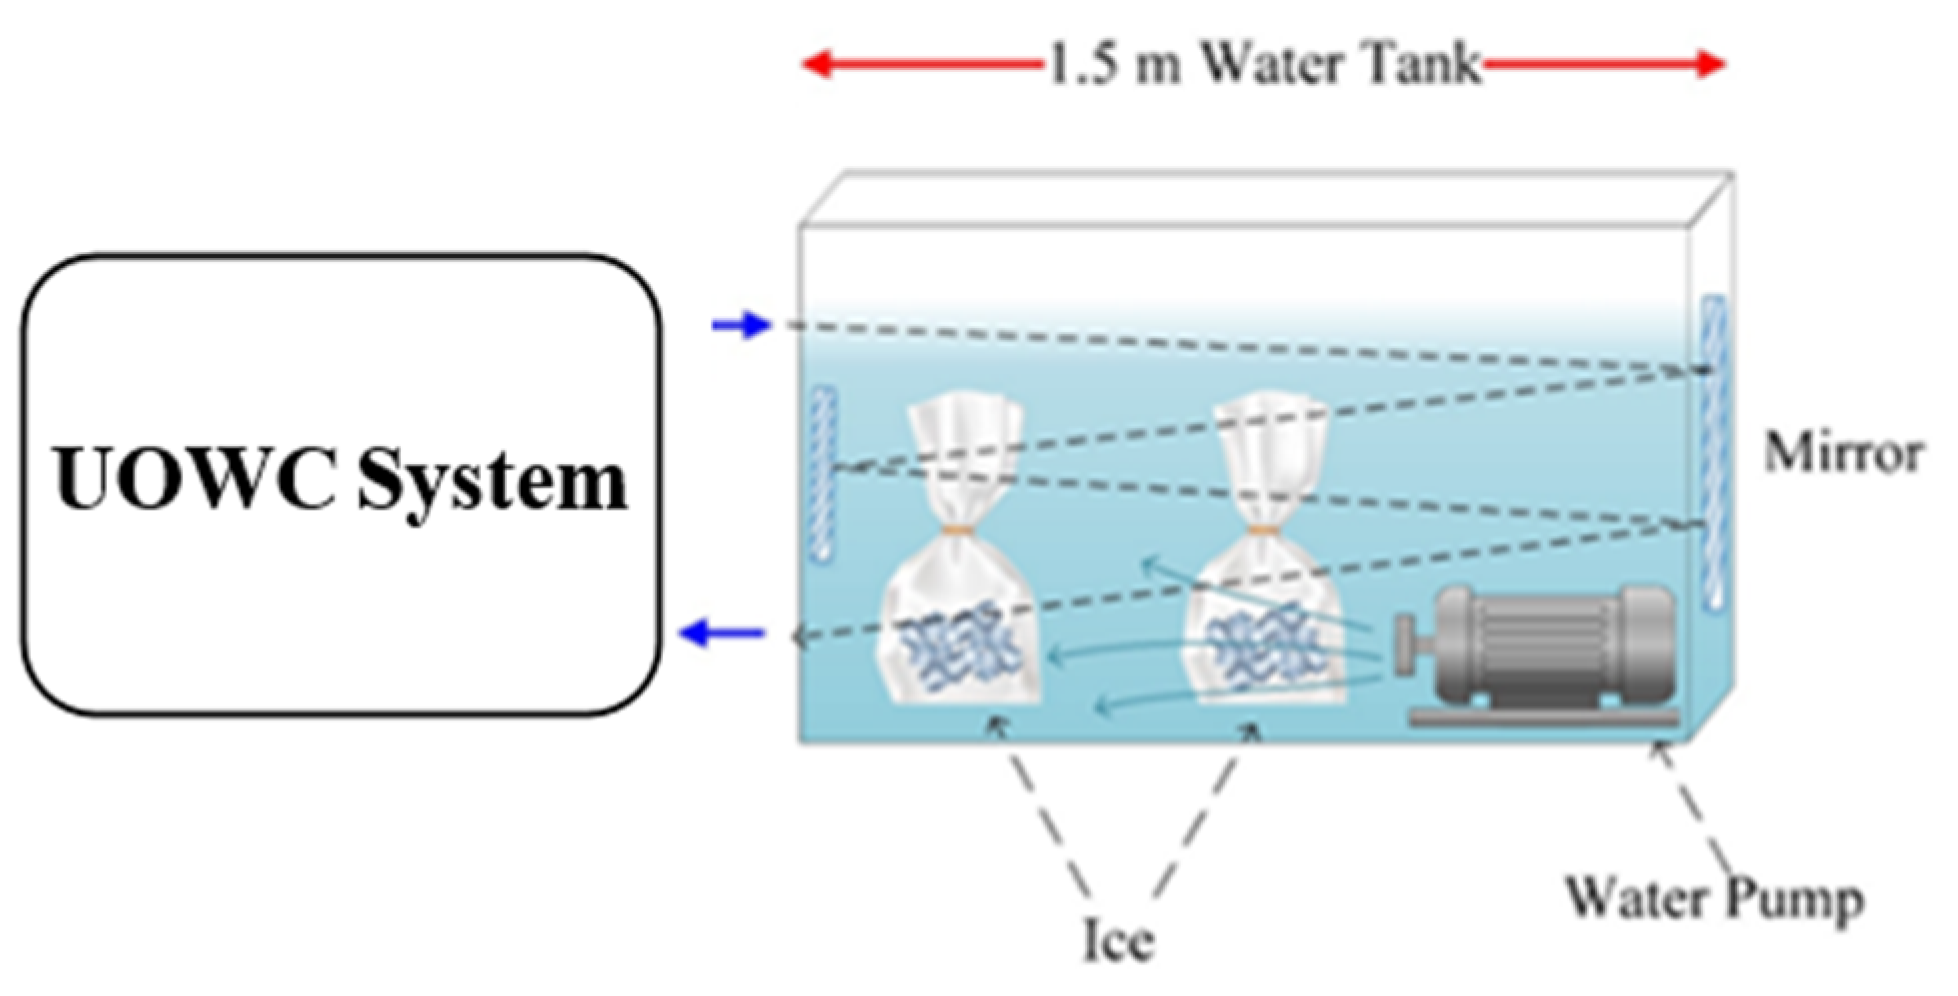
2. System Architecture

For this paper, we constructed the basic architecture of a UWOC system, as shown in Figure 1. At first, the bit error rate test set (BERT) (Anwayer V8, up to 1.5 Gbps data rate) was used to generate NRZ-OOK with PRBS of 7, 24, or 31 formats to measure the signal difference at lower speed and higher speed than 1.5 Gbps. Then, we modulated the 450 nm blue light laser (OSRAM, PL450B) via the Bias Tee (ZZX85-12G-S+). The laser had a peak output power of 80 mW and reached a peak wavelength of 450 nm at 25 °C. The current source (ILX Lightwave LDC3722) was operated at 80 mW to reach the optimal 450 nm blue light source. A collimating lens was used to focus the laser beam and then passed through the 1.5 m length water tank with a width of 0.3 m and a height of 0.3 m, respectively. A Fresnel lens was used to focus the beam, and polarizers were used to improve the system performance. A photodetector (Menlo, APD 210) with a high bandwidth up to 1000 MHz and responsivity of 5A/W at the central wavelength of 450 nm was used. Finally, the optically converted electronic signal was sent to the BERT for system performance evaluation. Mirrors were used to multiple reflect the laser to extend the total transmission length by made the laser light reflected back and forth in the water tank.

3. Calculation of Transmission Distance in the Ideal State

Based on the experimental architecture above, the transmission distance of 1.5 m, 3 m, and 6 m, respectively, was tested by adjusting the number of mirrors. The transmission losses of the three distances are shown in Table 1, and Equation (1) can be obtained:
P i n     P o u t     L =   L w a t e r
From the above equation, one can calculate the transmission loss per meter of signal light in water under different system architectures. Where P i n is the light power measured through the water tank glass after passing through the collimators and polarizers. P o u t is the received light power, L is the total loss caused by the signal light passing through the water tank glass and contacting the reflector. L w a t e r can be obtained by subtracting the initial light power from the receiving light power and then subtracting the loss caused by penetrating glass and reflected by the mirror. L w a t e r is the transmission loss of signal light in water. The transmission loss Y of signal light per meter can be obtained by dividing the total transmission distance, as shown in Equation (2).
Y = L w a t e r M
Table 1 shows optical power loss under different distances 1.5, 3 m, and 6 m. The input optical power is set as 4.32 dBm, and the received optical power of 2.94 dBm at 1.5 m distance and 0 dBm at 3 m and −4.32 dBm at 6 m were obtained by a photodetector. Before water was immersed in the tank, the optical power loss caused by the glass and air without water is measured at 0.70 dB for 1.5 m distance, 2.05 dB for 3 m distance, and 4.75 dB for 6 m distance. The optical power loss caused by the water can be obtained by calculating Equation (1). Hence, the optical power loss caused by the water is 0.68 dB, 1.67 dB, and 3.89 at 1.5 m, 3 m, and 6 m, respectively. Therefore, the experiment result for optical loss per meter is 0.45 dB/m, 0.56 dB/m, 0.65 dB/m for 1.5 m, 3 m, and 6 m, respectively. In summary, the data mentioned are shown in Table 1. In Table 1, the received power was measured at different transmission distances. A constant loss per meter of 0.45, 0.56, and 0.65 dB/m for 1.5, 3.0, and 6.0 m, respectively, were obtained. The loss values are not the same may be due to different reflection times per path by the mirror. It may also be due to the laser beam is increasing divergent after transmission longer distances. Hence, the increasing loss is not linear according to the increasing distance.
The initial transmission laser power is determined as the maximum optical power and can be received measured by the optical power meter used in this experiment, 16.99 dBm. The minimum power is −15.96 dBm for reference with the transmission rate of 1.25 Gbps, and the bit error rate should be no worse than   10 3 . The loss of signal light through the water tank glass is 0.35 dB. The mirror with 86% reflectivity reflects the signal light, and the loss is 0.65 dB. According to Table 1, the loss of signal light transmitting at 6 m in water is 0.65 dB per meter. The Fresnel lens reflection loss in case of different index glass–air is 4% according to Equation (3). X is the number of times the mirror reflects the signal light. The signal light’s total transmission distance can be calculated by X. The system architecture’s furthest transmission distance will be calculated as follows: The parameters in Table 2 can be expressed as follows:
R   =   ( n g l a s s     n a i r / ( n g l a s s     n a i r ) ] 2
  P i n     2   ×   L g l a s s + X   ×   L m i r r o r   +   1.5   ×   X + 1   ×   L w a t e r     +   R =   P m i n
where P i n is the input optical power. L g l a s s is the loss of light through the glass. Assuming that all the mirrors are placed in the water tank, the light source will only penetrate the water tank glass twice to minimize the loss caused by penetrating the water tank glass, and the total loss is 0.7 dB. L m i r r o r is the loss of signal light reflected once by a mirror. The X value is the number of mirrors that the laser source meets; Note that when the beam light is injected into the tank through the glass wall, there is Fresnel loss, which is given for normal incidence as a reflectivity (in power) R = 0.04 (~−14 dB) in case the refractive index associated with the glass is around 1.5. This amount of light is lost by reflection before entering the bottom polarizer and to the PD. Assuming the light beam is collimated, so there is no divergence in the transmission process, it perfectly converges on the focus at the receiving end and is received by the photodetector. Dtotal is the total transmission distance, so Equation (5) can be obtained:
D t o t a l =   1.5   +   X × 1.5   m
By substituting the values in Table 2 into Equation (4), X’s value is 19, meaning that up to 19 mirrors can be used in this architecture. The system’s maximum transmission distance can be up to 30 m in ideal condition by taking the X value into Equation (5). However, this is the calculation result in the ideal state. In the actual state, the increase of the propagation distance will result in laser beam diameter increase and received optical power decrease to shorten the effective propagation distance. A laser beam collimator may be applied to reduce beam divergence on the UWOC system. In Table 2, a minimum received power for a PD to obtain 10 × 10−3 BER under 1.25 Gbps blue laser transmission was provided. Because there is optical loss induced by the glass and/or mirror, the values and factors need to be considered and included.

4. Environmental Parameters Measurement and Discussion of Results

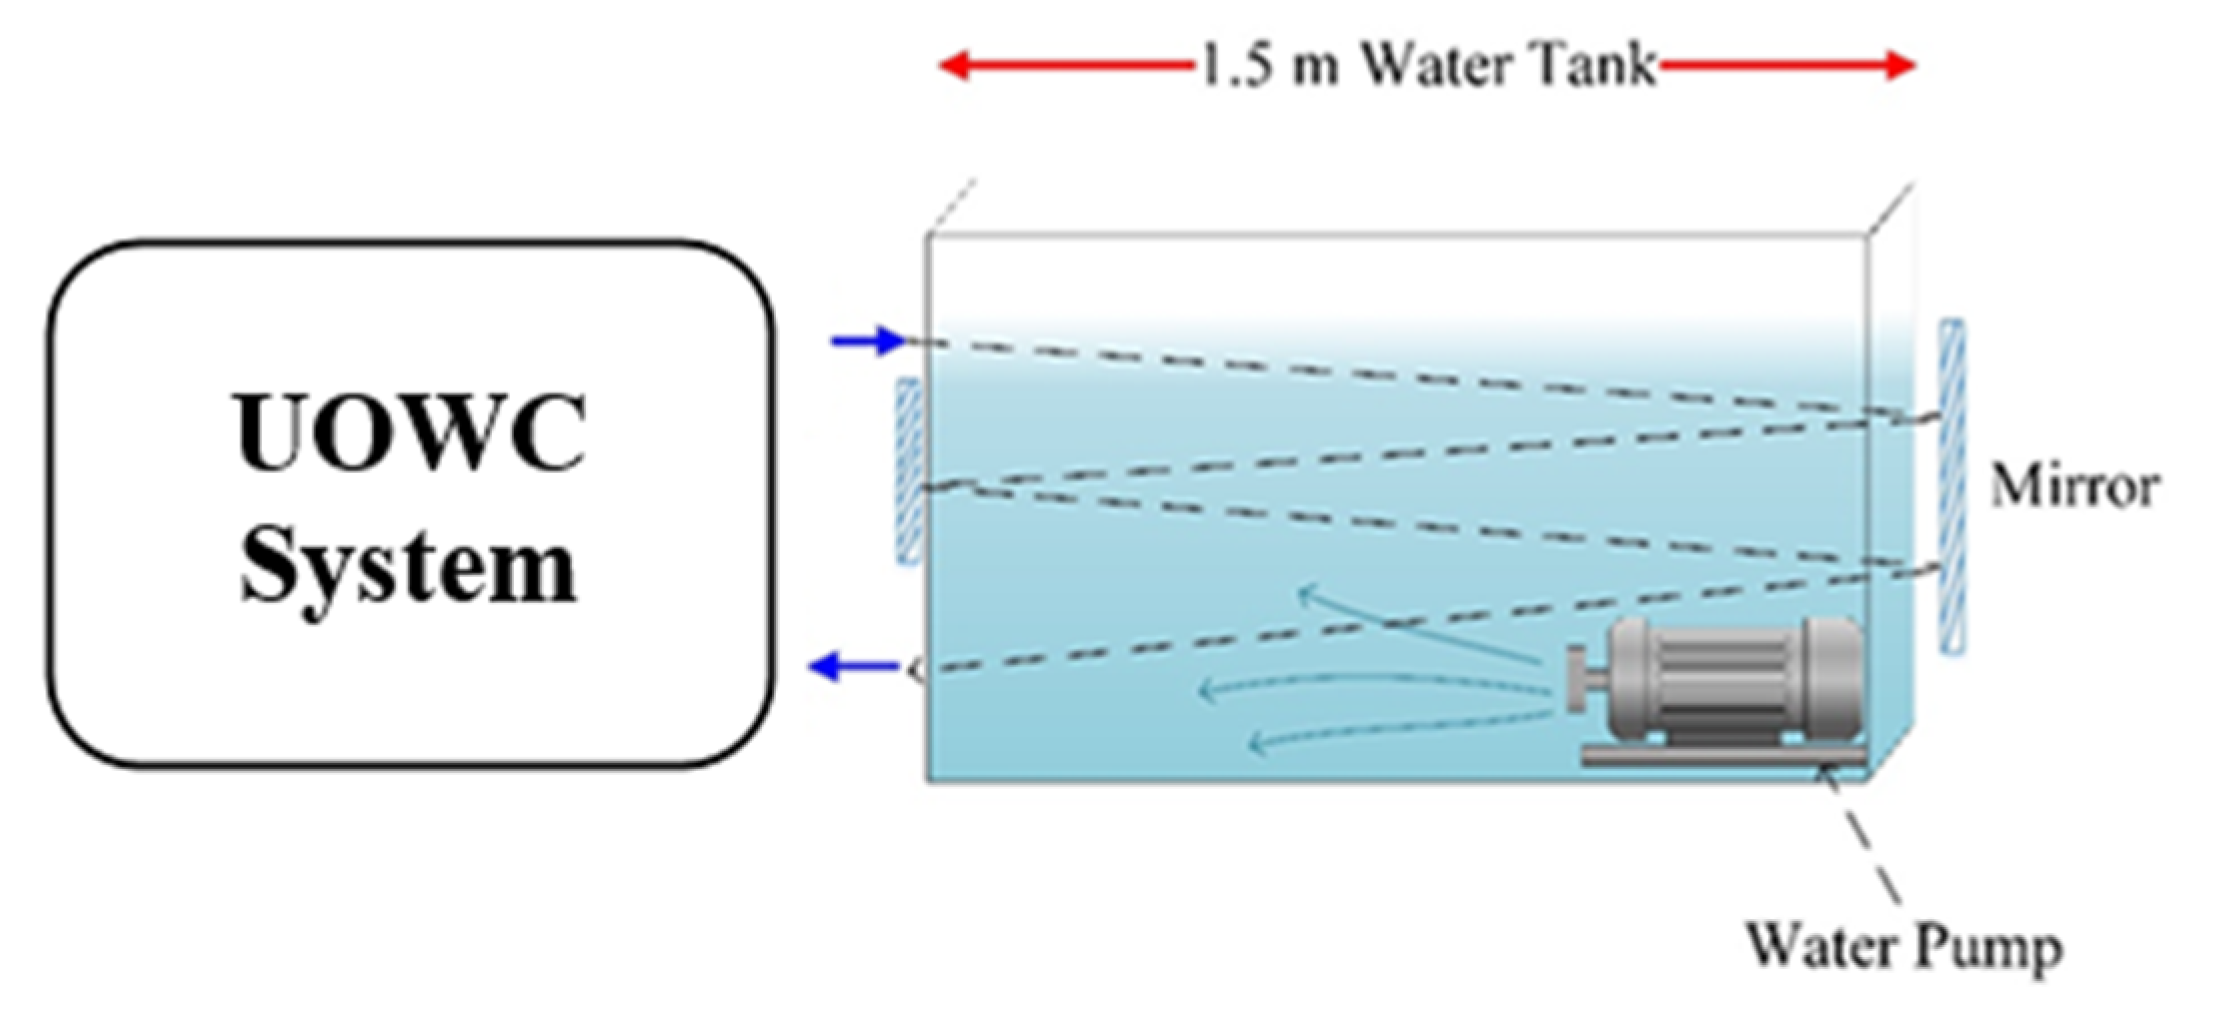
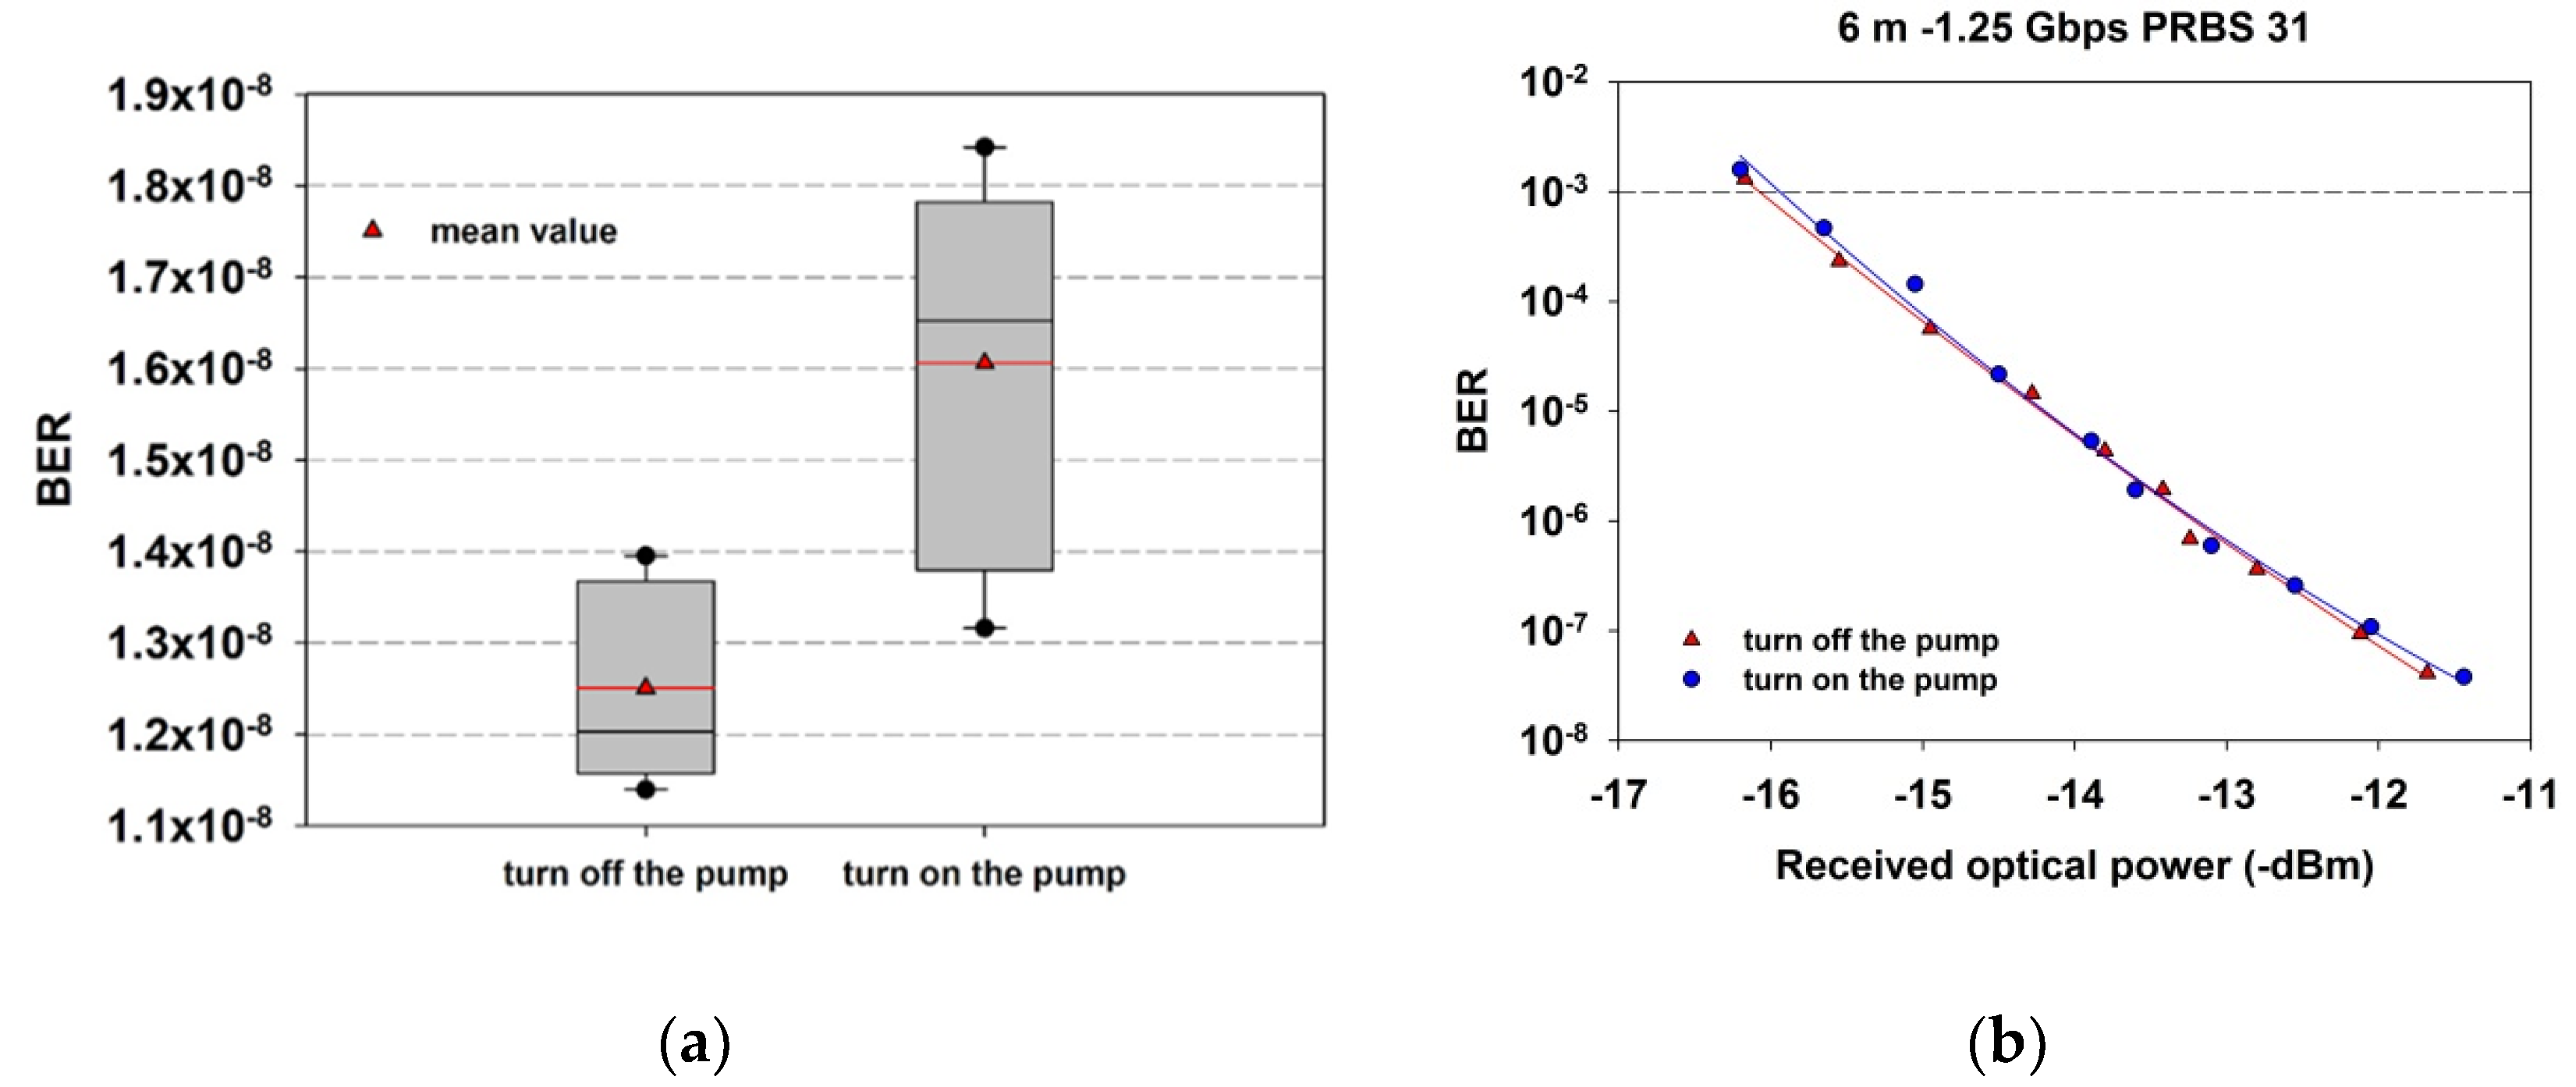
4.1. Impact of Turbulence Factor on UWOC

UWOC systems usually mean river or sea where there is flowing water. Therefore, the submerged motor is used to simulate the water flow (turbulence). The maximum water output is set up to 1200 L per hour. The output water flow can be stabilized to simulate water flow, as shown in Figure 2.
The medium used in this experiment is clear tap water, but the tap water is not pure. When the signal light is transmitted in the water tank, it can be seen that there are some suspended particles in the light path. When the motor is turned on, these impurities will quickly float in the water in the whole tank, and more particles can be seen on the signal light path while the floating speed is faster. The optical power of the signal light before entering the water tank is 3.516 dBm. After three reflections of blue light in the water tank, the total transmission distance is 6 m, and the received optical power is −4.604 dBm. The water pump is turned on with 1200 L per hour. In 6-m transmission, the BER values varied to some extend due to water flow, as is shown in Figure 3a.
Therefore, water-flow-induced turbulence has little effect on light power for the clear tap water. As shown in Figure 3b, the result distribution range of the bit error rate is larger when the motor is turned on than when it is turned off. Nevertheless, it can be seen that there is a negative relationship between the disturbance of particles in water and the BER. It may be due to the fact that there is no significant amount of bubbles to block/reflect the modulated light source.

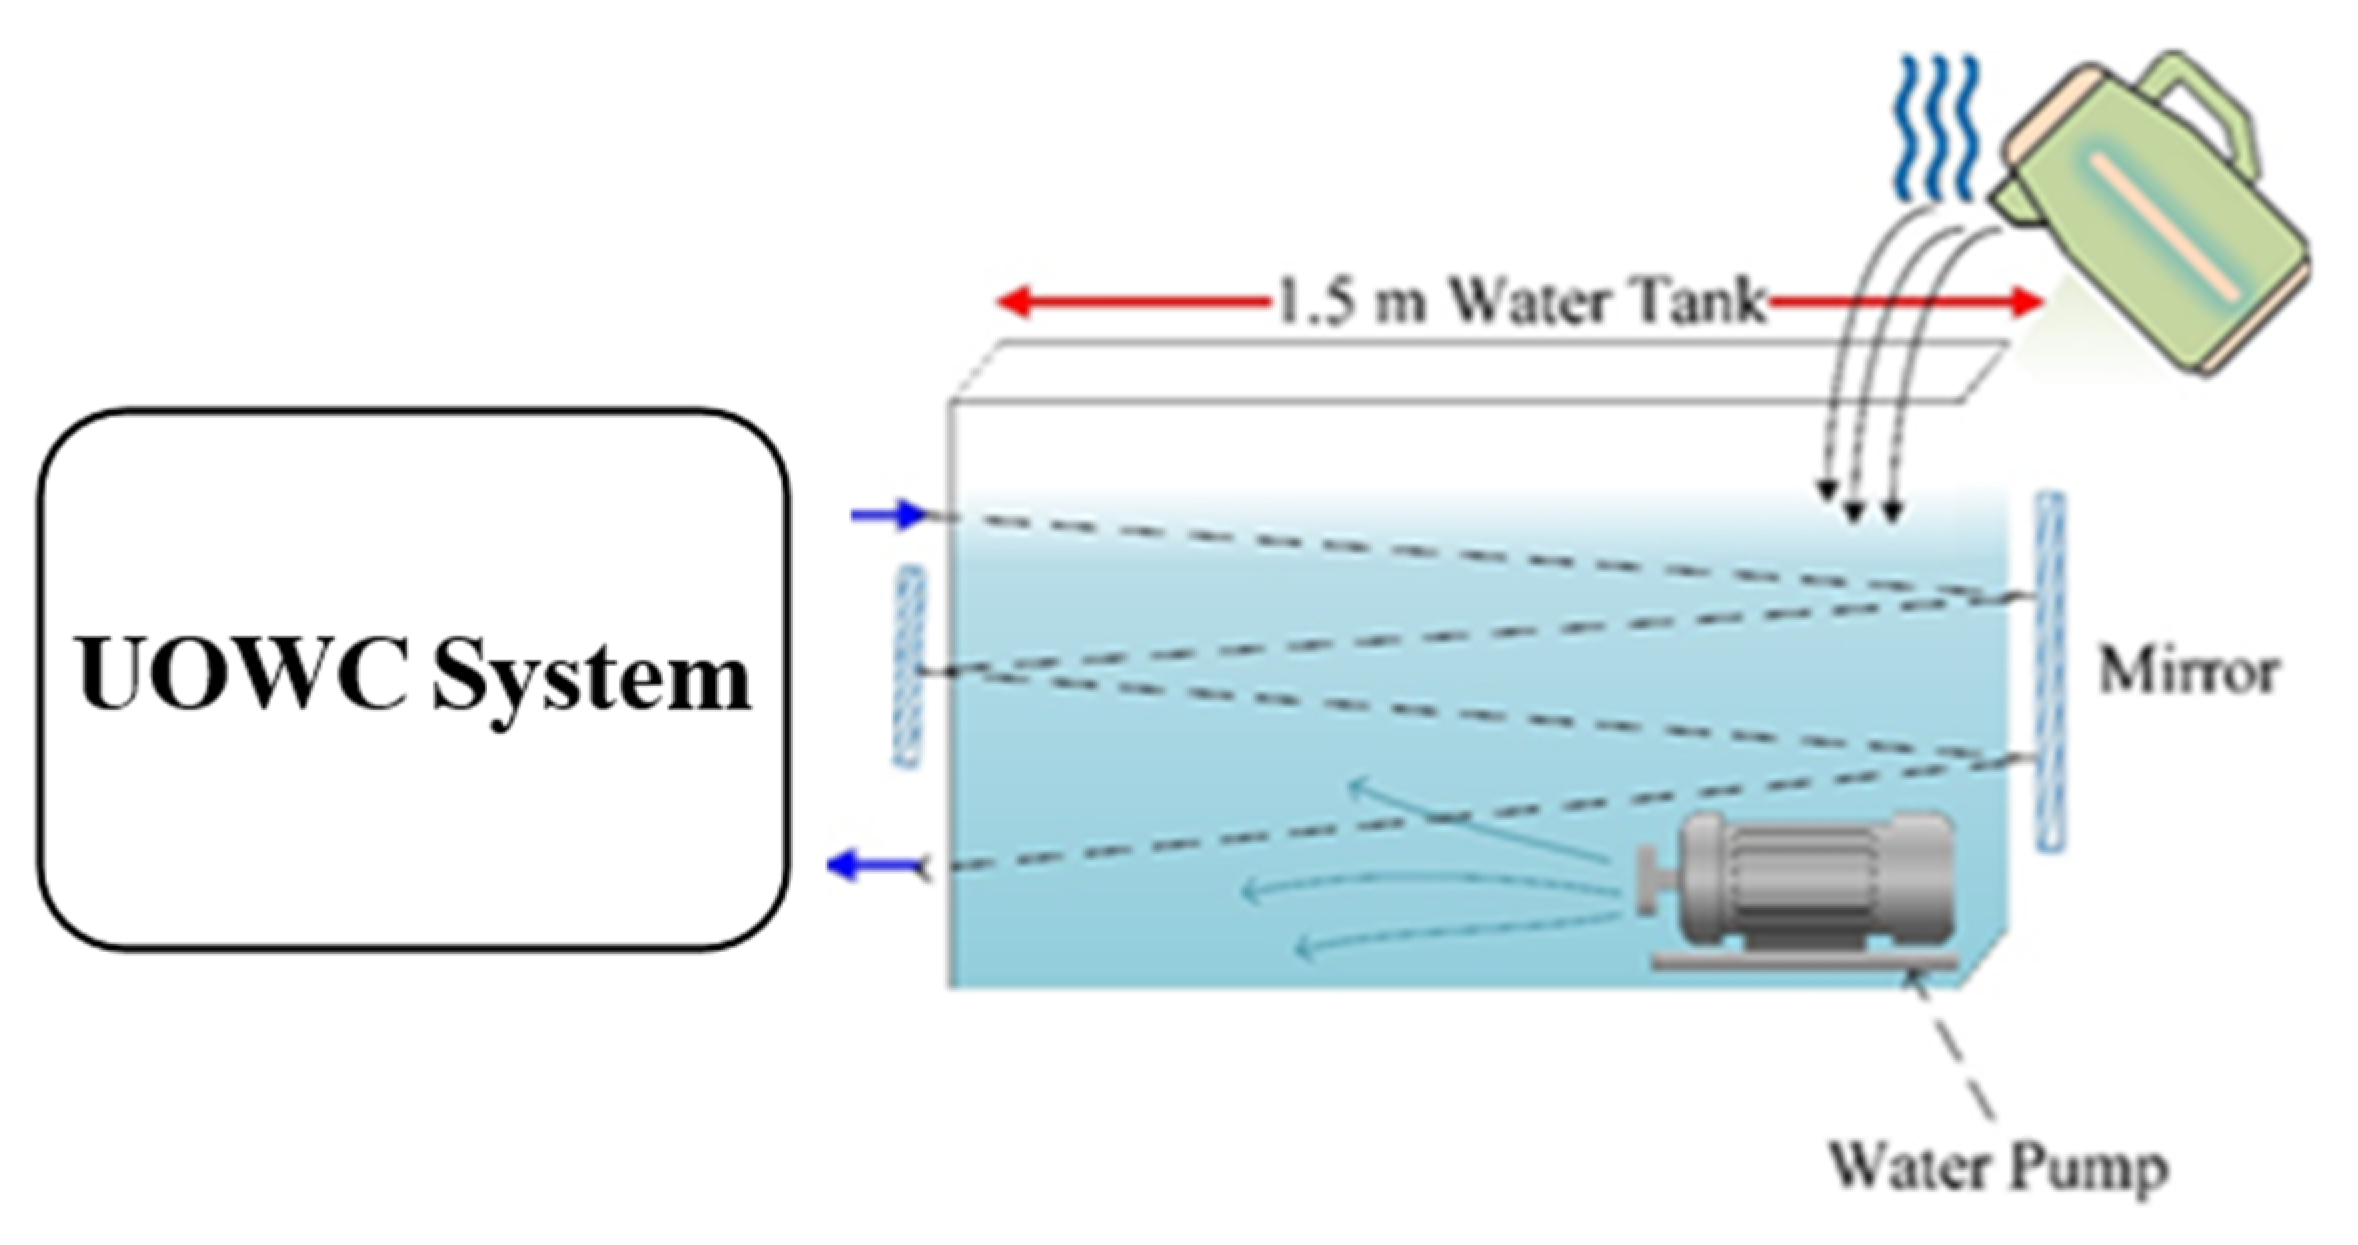
4.2. Impact of Both Turbulence and Thermal Factors on UWOC

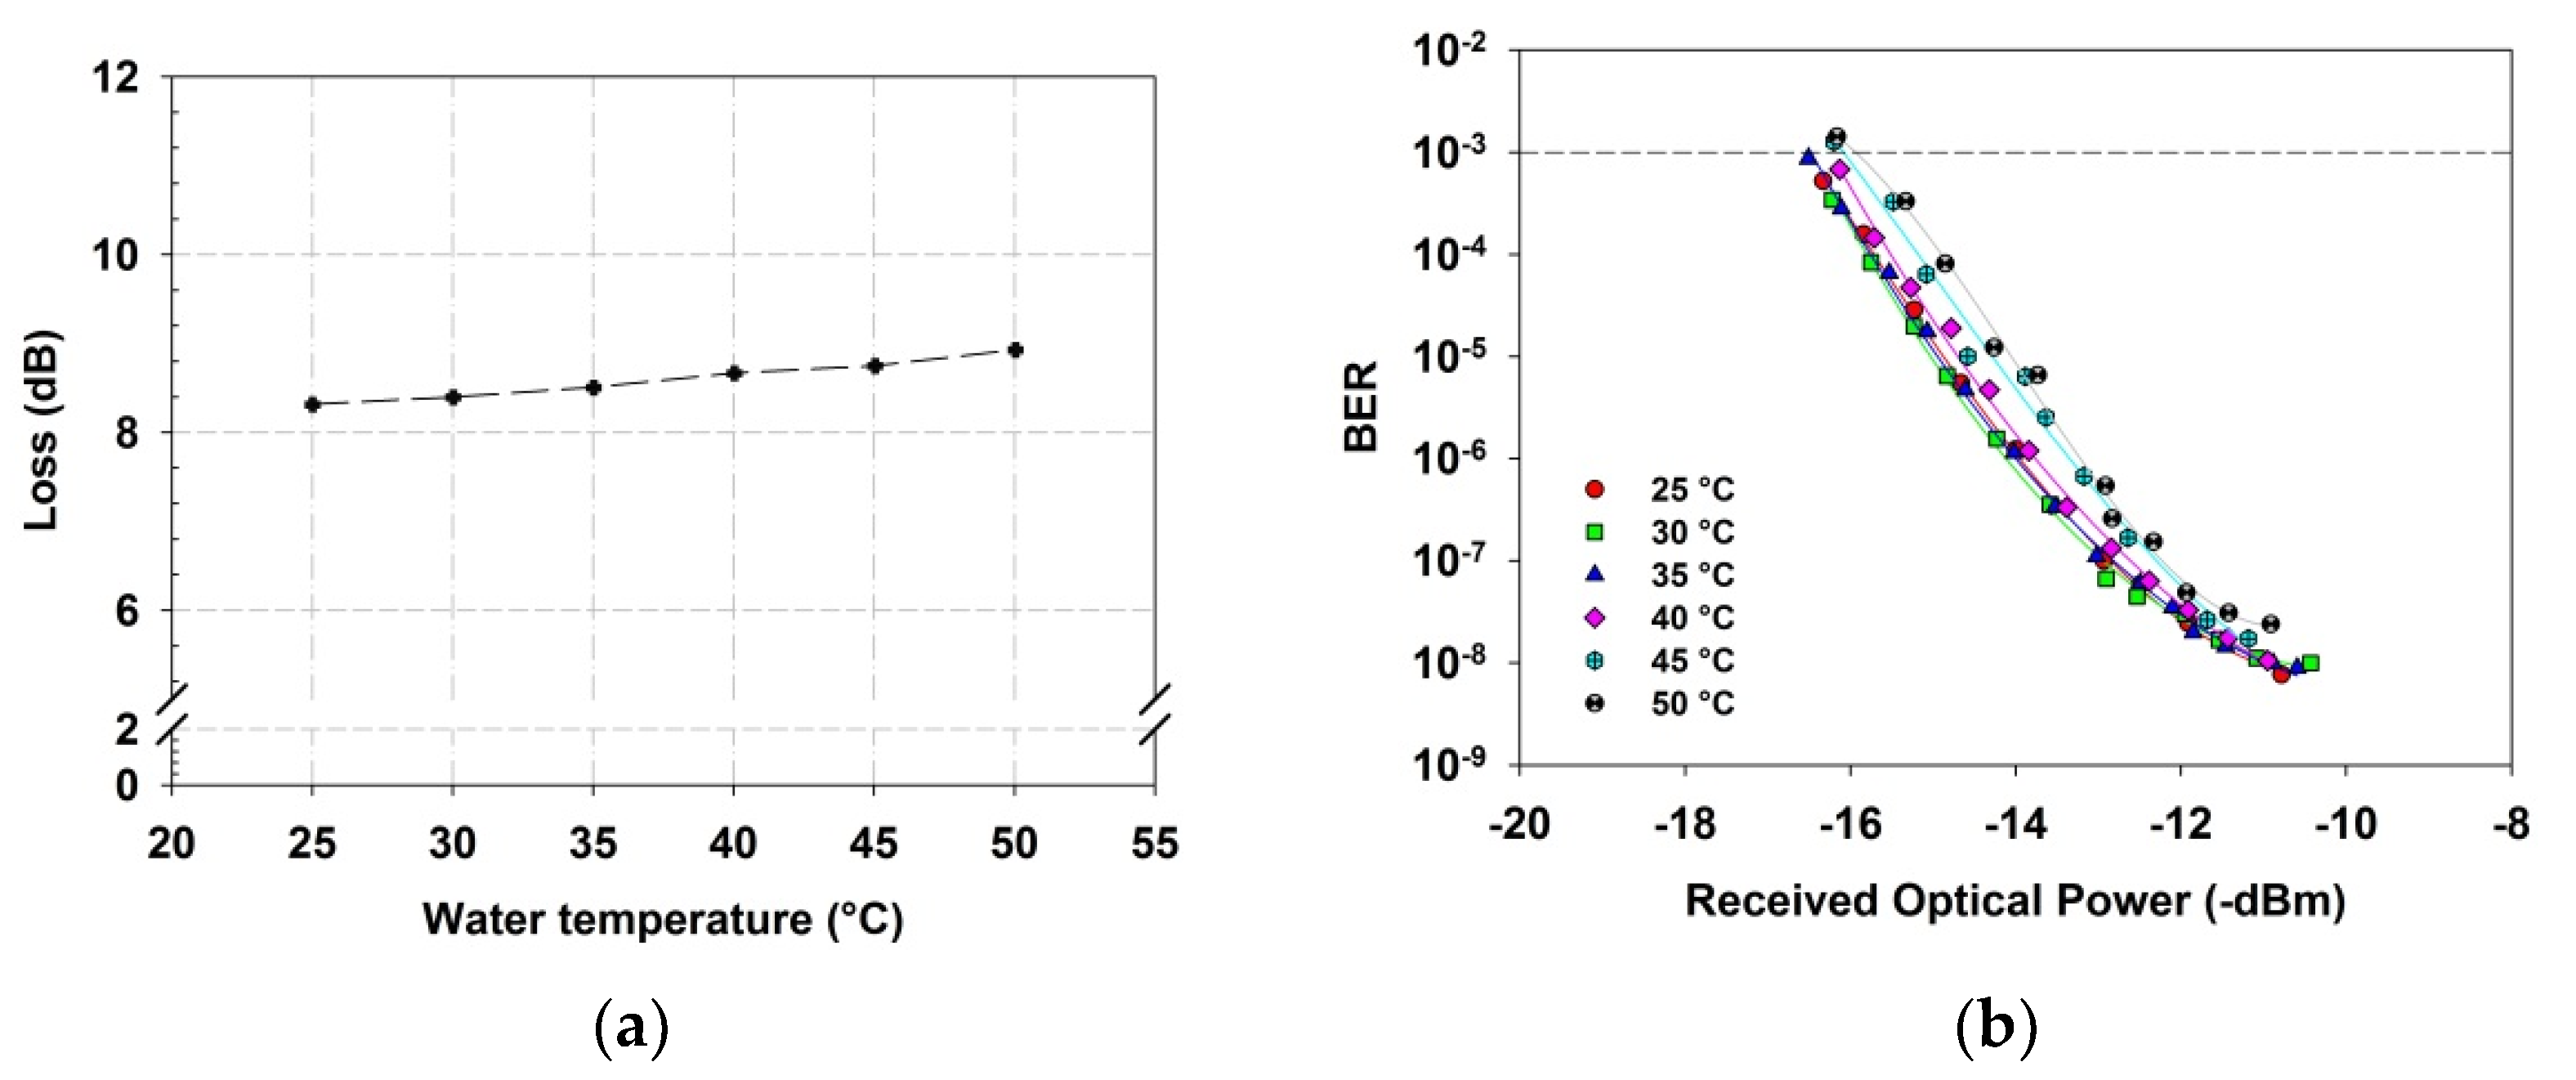
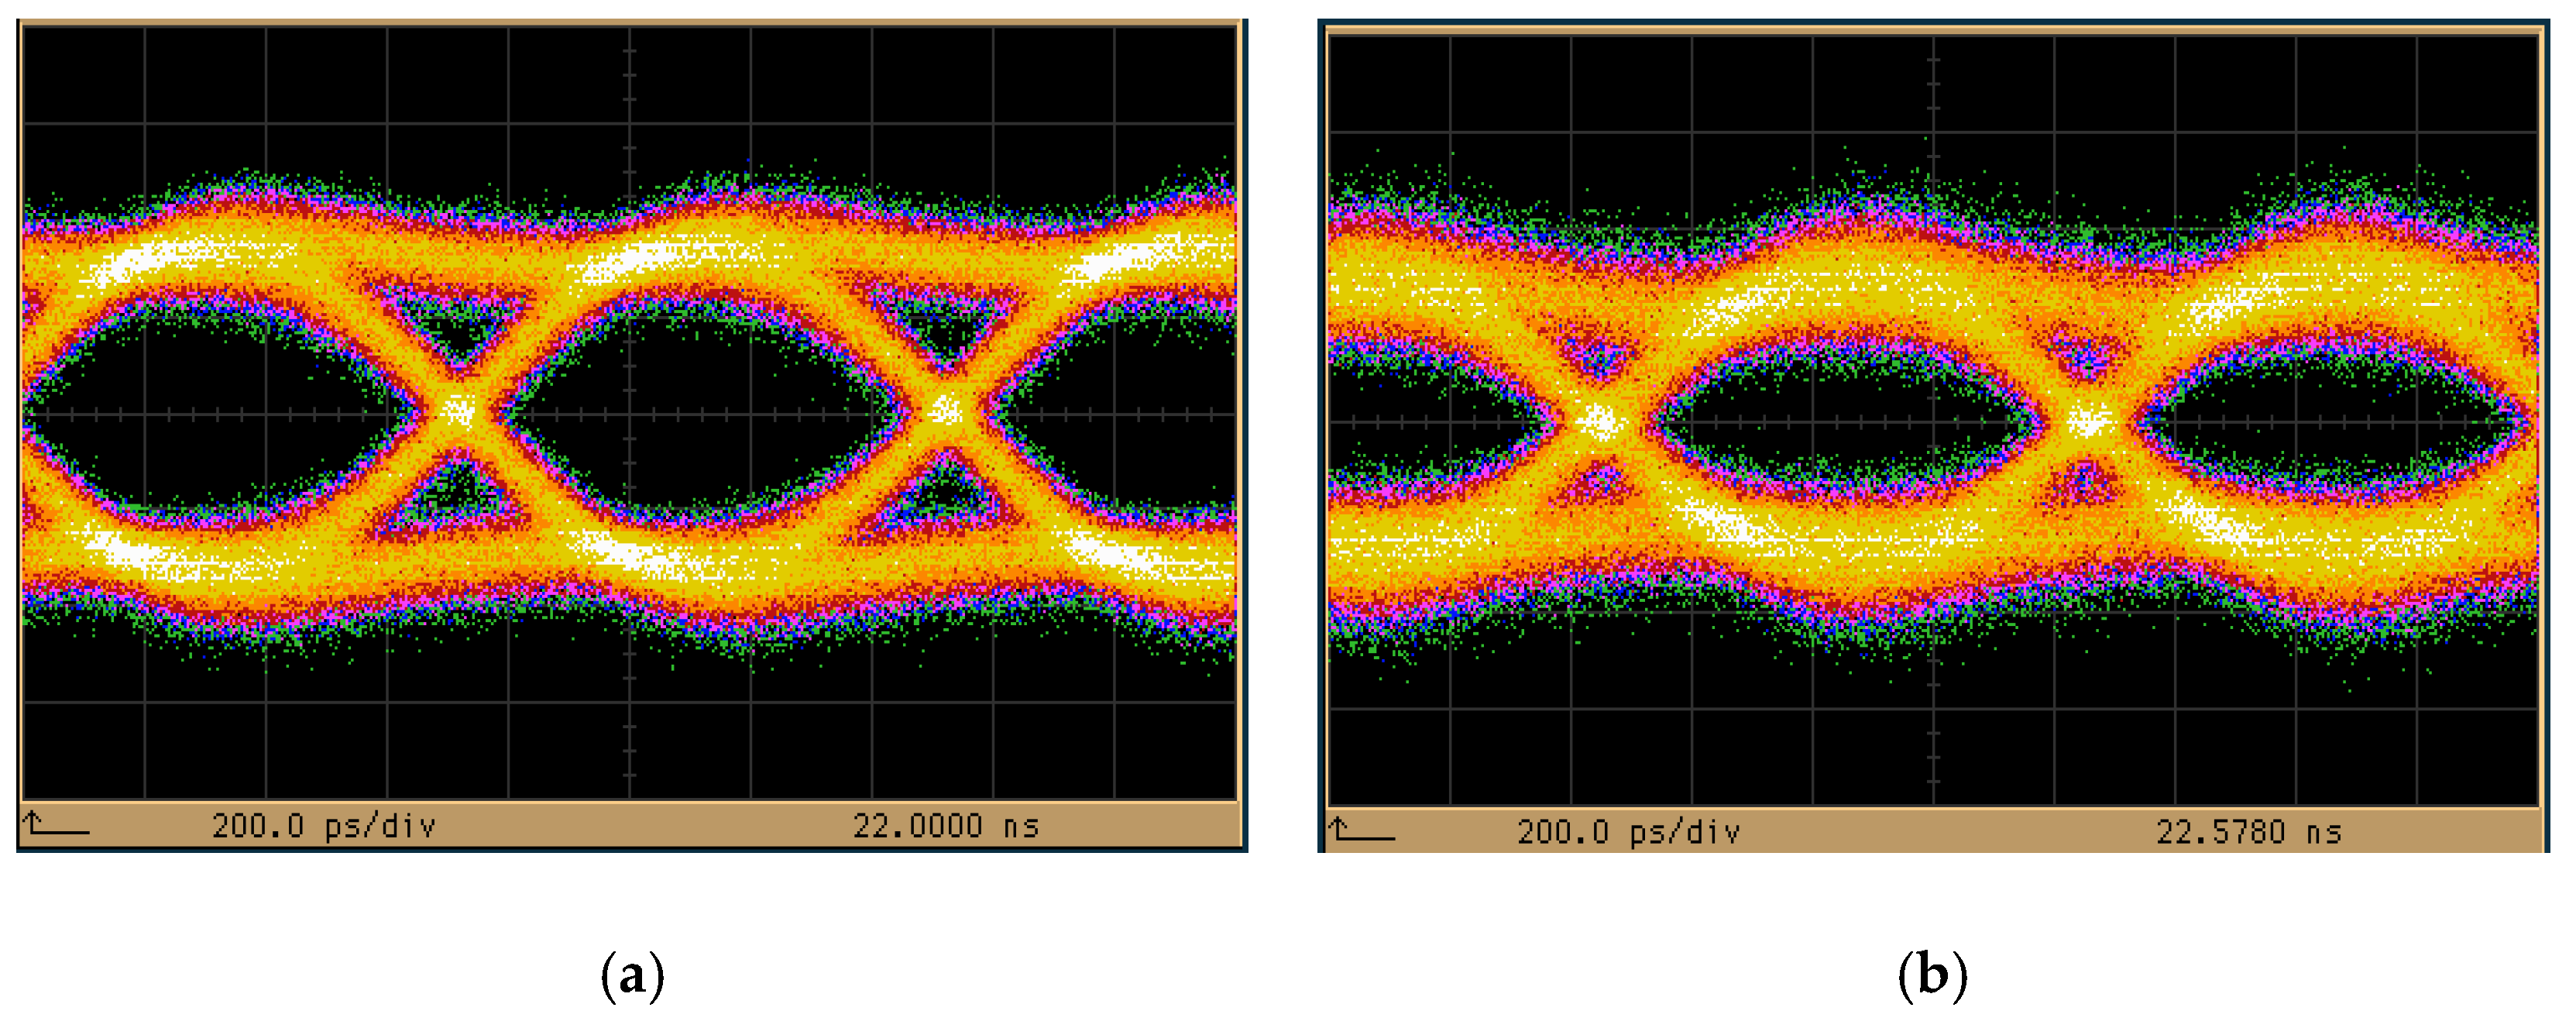
4.2.1. Temperature Rise Experiment

The annual average temperature of seawater in every area is different [17]. When the water temperature changes, the refractive water index also changes, which leads to the laser beam propagation path shift and will affect the optical signal reception. In this experiment, the UWOC system performance is tested when the temperature rises or falls. The architecture is shown in Figure 4.
In this experiment, the water was heated from room temperature 25 °C, 35 °C, 40 °C, 45 °C and 50 °C, and the water temperature was kept constant. The received optical power was measured by the optical power measurement. The results of water temperature and optical loss are shown in Figure 5a. The total loss of signal light increases with the increase of water temperature after 6 m of transmission. The transmission loss is 5.18 dB at 35 °C. When the water temperature is 50 °C, the total transmission loss is 8.93 dB. The difference in optical signal loss is 0.42 dB when the temperature rises to 15 °C. Therefore, when the water temperature rises, the optical transmission loss is more significant than at room temperature. Next, the PD is used to receive the signal and measure the bit error rate, as shown in Figure 5b. It can be seen that the fluctuation of BER is more severe with the increase of water temperature up to 50 °C compared with 25 °C. The reasons may be attributed to the water molecules being more active at a higher temperature. In addition, the temperature distribution is nonuniform in the water tank and the optical propagation path. Prior work [18] demonstrated, lower scintillation index, higher signal-to-noise ratio, and lower BER at 25 °C water temperature. Simultaneously, the eye diagrams shown in Figure 6a,b indicates that the system has better performance at 25 °C water temperature compared to 50 °C, with larger eye-opening and less time jitter. Nevertheless, the power penalty is little. It means that water temperature variation has little influence on UWOC performance.

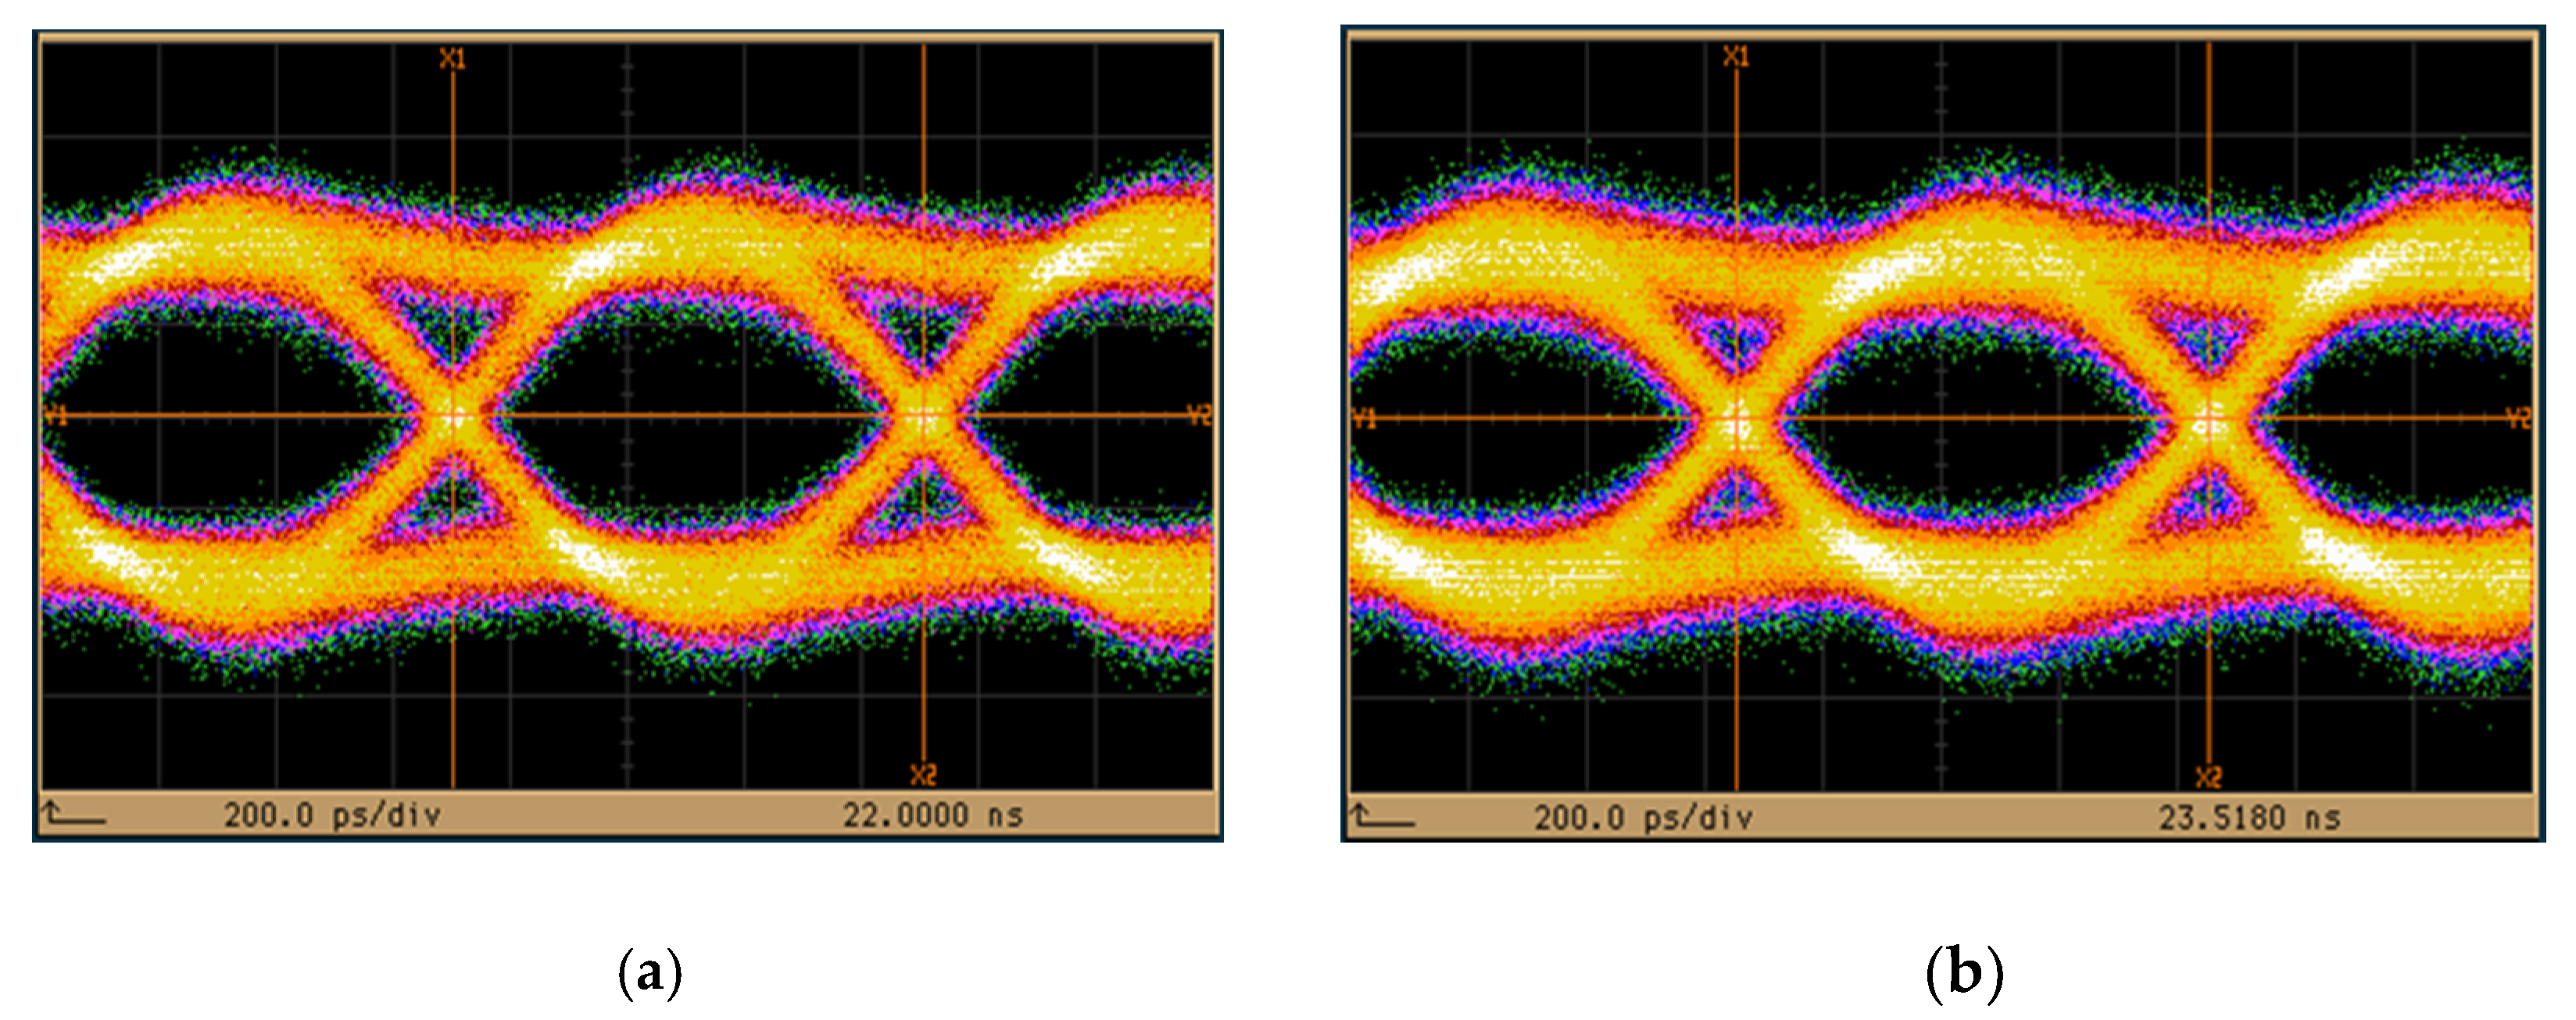
4.2.2. Cooling Experiment

Because the average annual temperature of the earth is below 20 °C in high latitude areas, this experiment tests the communication quality of the UWOC system under the condition of low water temperature. The structure of this experiment is shown in Figure 7. The ice is wrapped in a sealed bag and put into the water to reduce the water temperature. Then, transmission loss and bit error rate are measured when the water temperature drops to 10 °C, 15 °C, and 20 °C.
To ensure the accuracy of transmission loss measurement in this experiment, all the experiments above start with a 4.32 dBm input power. This experiment measures the optical transmission loss at low temperatures, as shown in Figure 8a.Based on the results, it is shown that the optical transmission loss increases as the temperature increase from 25 °C. Note at the original temperature is et at 25 °C. The BER values under different temperatures are shown in Figure 8b. At the same BER, the power penalty is 1 dB when the light power at a low temperature of 10 °C as compared to 25 °C at room temperature. Comparing the eye diagram at 25 °C and 10 °C shown in Figure 9a,b, the also shows the same result that 25 °C has better performance. Therefore, the low temperature on the UWOC systems has more significant changes than the high temperature.

4.3. Impact of Artificial Seawater Factor on UWOC

In addition to the variation of water temperature, this experiment also studies the influence of seawater in UWOC by putting an amount of salt into the water tank. The actual seawater was simulated by adding artificial seawater into the water tank. In this experiment, the artificial seawater was poured into the water tank in portions. The seawater density of 1.03 g/cm3 is used as a standard value to ensure the similarity between the lab saltwater and the actual seawater. First, the prepared seawater is rest for a while so that the impurities in the water are sunk to the bottom of the water tank, then the BER against BER was measured. After the measurement, the submerged motor is turned on to measure the optical power and BER values again.
The results of transmission loss measured in this experiment are shown in Table 3, from which it was found that the transmission loss is more significant than that in tap water. Using 450 nm laser diode for the BER performance test, the optical loss of 1.5 m in simulated seawater is close to 6 m in tap water. When the transmission distance is 4.5 m, the transmission loss is as high as 23.23 dB. The optical loss after 4.5 m transmission is huge, so the BER performance is not detectable. Thus, the seawater simulation experiment for the BER test is only 3 m, and the results are shown in Figure 10. The optical power loss may be even huge if the experiment is conducted in the open sea under the sun. It is because, in the daytime, there is background light to interfere with transmitted light [19]. It can be seen from Figure 10 that the bit error rate performance after turning on the submerged motor is worse than that after precipitating impurities in the water. When the submerged motor is turned on, the light loss increases by about 1.5 dB compared to when the motor is not turned on. Comparing the eye diagram of seawater after precipitation with those of seawater during the disturbance, one may see that precipitating impurities in seawater dramatically influence the light-wave transmission quality, as is shown in Figure 11.
Therefore, it can be seen that the transmission effect of the underwater OWC system in seawater is worse than that in tap water. The reason is that there are many minerals in seawater, and the water quality becomes turbid after artificial seawater is added. Therefore, the loss of signal light in the transmission process increases, and the BER performance decreases. Besides Equations (1)–(4), the BER is also affected by the power level of SNR in digital optical communications. The BER value decreases with the increase of SNR, as is shown in Equation (6).
BER   =   Q 1 σ   =   Q s q r t SNR
where Q is the Q function, and sqrt is the square root function.

5. Conclusions

In this paper, a UWOC system based on a 450 nm blue laser is proposed, studied and discussed. For system performance evaluation, the blue light could be transmitted up to 6 m at a 1.25 Gbps data rate in the tap water. Overall, BER values of better than 10 × 10−8 could be obtained. Several data rates and distances were also done in experiments and comparisons.
Next, the underwater environmental factors, which were seldom studied in previous works, such as water environmental factors of water turbulence, temperature variation and artificial seawater by adding salt. When a submerged motor with an output of 1200 L/h is used as an underwater flow turbulence source, the system and BER performance has little effect on the underwater communication. For the temperature variation factor study, the temperature was changed from 10 °C to 50 °C with a 5–10 °C step for each. It is found that the original temperature of 25 °C has the best performance than lower or higher temperature cases. For artificial seawater experiments by adding salt into the tap water was done to observe the seawater environment. The BER values between the precipitated seawater and the seawater combined with water turbulence were compared. It was found that the transmission distance was limited to 3 m because the salt induces a power penalty to the UWOC system. This may be due to the salt acts as particles to scatter the blue light. Moreover, due to the water flow, the seawater’s impurities were raised from the bottom of the water tank so as even more degrade the BER values.
In summary, these experimental results obtained in this paper are useful to verify the transmission quality of UWOC in practical application. However, there are still some challenges in the UWOC systems. Theoretically, the blue light system could transmit a 30 m distance if environmental factors can be appropriated solved and/or reduced.

Author Contributions

Conceptualization, C.-C.C. and S.-K.L.; Data curation, D.-C.L., C.-C.C. and S.A.; Formal analysis, D.-C.L. and C.-C.C.; Methodology, D.-C.L., C.-C.C. and S.-K.L.; Project administration, S.-K.L.; Writing—original draft, D.-C.L. and S.-K.L.; Writing—review & editing, D.-C.L., S.-K.L., S.A., J.-Y.S. and C.-H.Y. All authors have read and agreed to the published version of the manuscript.

Funding

This research received no external funding.

Institutional Review Board Statement

The study did not involve humans or animal studies.

Informed Consent Statement

The study did not involve humans or animal studies.

Data Availability Statement

The study did not report any data.

Conflicts of Interest

The authors declare no conflict of interest.

References

  1. Khalighi, M.A.; Uysal, M. Survey on Free Space Optical Communication: A Communication Theory Perspective. IEEE Commun. Surv. Tutor. 2014, 16, 2231–2258. [Google Scholar] [CrossRef]
  2. Ghassemlooy, Z.; Popoola, W.O. Terrestrial Free-Space Optical Communications. 2010. Available online: https://books.google.com.hk/books?hl=en&lr=&id=huecDwAAQBAJ&oi=fnd&pg=PA355&ots=udGbviR6aX&sig=QCvK82gtw14ICGlsWAI15kBQh-Q&redir_esc=y#v=onepage&q&f=false (accessed on 8 February 2021).
  3. Zhu, X.; Kahn, J.M. Free-space optical communication through atmospheric turbulence channels. IEEE Trans. Commun. 2002, 50, 1293–1300. [Google Scholar]
  4. Paul, P.; Bhatnagar, P.P.M.R.; Jaiswal, A. Jamming in Free Space Optical Systems: Mitigation and Performance Evaluation. IEEE Trans. Commun. 2019, 68, 1631–1647. [Google Scholar] [CrossRef]
  5. Gu, Z.; Zhang, J.; Sun, X.; Ji, Y. Optimizing Networked Flying Platform Deployment and Access Point Association in FSO-Based Fronthaul Networks. IEEE Wirel. Commun. Lett. 2020, 9, 1221–1225. [Google Scholar] [CrossRef]
  6. Yeh, C.-H.; Xie, Y.-R.; Luo, C.-M.; Chow, C.-W. Integration of FSO Traffic in Ring-Topology Bidirectional Fiber Access Network with Fault Protection. IEEE Commun. Lett. 2020, 24, 589–592. [Google Scholar] [CrossRef]
  7. Jung, K.-J.; Nam, S.S.; Alouini, M.-S.; Ko, Y.-C. Unified Finite Series Approximation of FSO Performance Over Strong Turbulence Combined With Various Pointing Error Conditions. IEEE Trans. Commun. 2020, 68, 6413–6425. [Google Scholar] [CrossRef]
  8. Zhu, S.; Chen, X.; Liu, X.; Zhang, G.; Tian, P. Recent progress in and perspectives of underwater wireless optical communication. Prog. Quantum Electron. 2020, 73, 100274. [Google Scholar] [CrossRef]
  9. Doubilet, D. Light in the Sea. World Lit. Today 2013, 87, 94–97. [Google Scholar] [CrossRef]
  10. Gilbert, G.D.; Stoner, T.R.; Jernigan, J.L. Underwater experiments on the polarization, coherence and scattering properties of a Pulsed Blue-Green Laser. Underw. Photo Opt. I 1966, 0007, 8–14. [Google Scholar]
  11. Oubei, H.M.; Li, C.; Park, K.-H.; Ng, T.K.; Alouini, M.-S.; Ooi, B.S. 23 Gbit/s underwater wireless optical communications using directly modulated 520 nm laser diode. Opt. Express 2015, 23, 20743–20748. [Google Scholar] [CrossRef] [PubMed]
  12. Chao, S.; Guo, Y.J.; Oubei, H.M.; Ng, T.K.; Liu, G.Y.; Park, K.H.; Ho, K.T.; Alouini, M.S.; Boon, S. 20-meter underwater wireless optical communication link with 15 Gbps data rate. Opt. Express 2016, 24, 25502. [Google Scholar]
  13. Watson, S.; Viola, S.; Giuliano, G.; Najda, S.P.; Perlin, P.; Suski, T.; Marona, L.; Leszczyński, M.; Wisniewski, P.; Czernecki, R.; et al. High speed visible light communication using blue GaN laser diodes. Adv. Free-Space Opt. Commun. Tech. Appl. II 2016, 9991, 99910A. [Google Scholar]
  14. Chen, Y.; Kong, M.; Ali, T.; Wang, J.; Sarwar, R.; Han, J.; Guo, C.; Sun, B.; Deng, N.; Xu, J. 26 m/55 Gbps air-water optical wireless communication based on an OFDM-modulated 520-nm laser diode. Opt. Express 2017, 25, 14760–14765. [Google Scholar] [CrossRef] [PubMed]
  15. Li, Y.; Yin, H.; Ji, X.; Wu, B. Design and implementation of underwater wireless optical communication system with high-speed and full-duplex using blue/green Light. In Proceedings of the 2018 10th International Conference on Communication Software and Networks (ICCSN), Chengdu, China, 6–9 July 2018; pp. 99–103. [Google Scholar]
  16. Li, C.-Y.; Huang, X.-H.; Lu, H.-H.; Huang, Y.-C.; Huang, Q.-P.; Tu, S.-C. A WDM PAM4 FSO–UWOC Integrated System with a Channel Capacity of 100 Gb/s. J. Light. Technol. 2019, 38, 1766–1776. [Google Scholar] [CrossRef]
  17. Akbari, E.; Alavipanah, S.K.; Jeihouni, M.; Hajeb, M.; Haase, D.; Alavipanah, S. A Review of Ocean/Sea Subsurface Water Temperature Studies from Remote Sensing and Non-Remote Sensing Methods. Water 2017, 9, 936. [Google Scholar] [CrossRef] [Green Version]
  18. Weng, Y.; Guo, Y.; Alkhazragi, O.; Ng, T.K.; Guo, J.-H.; Ooi, B.S. Impact of Turbulent-Flow-Induced Scintillation on Deep-Ocean Wireless Optical Communication. J. Light. Technol. 2019, 37, 5083–5090. [Google Scholar] [CrossRef]
  19. Cossu, G.; Sturniolo, A.; Messa, A.; Grechi, S.; Costa, D.; Bartolini, A.; Scaradozzi, D.; Caiti, A.; Ciaramella, E. Sea-Trial of Optical Ethernet Modems for Underwater Wireless Communications. J. Light. Technol. 2018, 36, 5371–5380. [Google Scholar] [CrossRef]
Figure 1. 6 m unidirectional UWOC system.
Photonics 08 00074 g001
Figure 2. Water-flow-induced experiment architecture.
Photonics 08 00074 g002
Figure 3. Transmission distance of 6 m (a) bit error rate box plot of the motor pump is on/off, and (b) bit error rate against received power when the motor pump is on/off.
Photonics 08 00074 g003
Figure 4. The experimental heating setup of underwater wireless optical communication (UWOC).
Photonics 08 00074 g004
Figure 5. Transmission distance of 6 m (a) water versus optical loss, and (b) received power against the bit error rate under different temperatures.
Photonics 08 00074 g005
Figure 6. Eye diagram for a transmission distance of 6 m at (a) water temperature of 25 °C, and (b) water temperature 50 °C.
Photonics 08 00074 g006
Figure 7. The experimental water-cooling setup of UWOC.
Photonics 08 00074 g007
Figure 8. Transmission distance of 6 m (a) low-temperature optical transmission loss (b) measurement diagram of bit error rate when the temperature drops.
Photonics 08 00074 g008
Figure 9. Eye diagram for a transmission distance of 6 m (a) water temperature 25 °C (b) water temperature 10 °C.
Photonics 08 00074 g009
Figure 10. Bit error rate results of 3 m transmission in artificial seawater.
Photonics 08 00074 g010
Figure 11. Eye diagram for transmitting 3 m (a) after seawater sedimentation (b) flow disturbance in seawater.
Photonics 08 00074 g011
Table 1. The optical loss at different transmission distances.
Transmission Distance M (m)1.536
Input optical power   P in   (dBm)4.324.324.32
Received optical power   P o u t   (dBm)2.940.60−4.32
Total loss caused by glass and reflector   L   (dB)0.702.054.75
Optical power loss in water   L w a t e r   (dB)0.681.673.89
Optical loss per meter of light transmitted in water Y (dB/m)0.450.560.65
Table 2. Experimental design parameters.
P i n (dBm)Input Optical Power16.99
P m i n (dBm)Minimum received optical power (BER = 10 3 )−15.96
L g l a s s (dB)Optical loss through the glass0.35
L m i r r o r (dB)Reflection loss of mirrors0.65
L w a t e r (dB/m)Optical power loss in water0.65
RFresnel lens reflection4%
Table 3. The transmission loss of artificial seawater.
Optical Transmission Distance (m)After Seawater Sedimentation (dB)Turn on the Submerged Motor (dB)
1.55.666.60
311.5613.70
4.520.6421.91
Publisher’s Note: MDPI stays neutral with regard to jurisdictional claims in published maps and institutional affiliations.

