Enhanced Pulse Compression within Sign-Alternating Dispersion Waveguides


Laser Physics and Nonlinear Optics Group, Department Science & Technology, MESA+ Research Institute for Nanotechnology, University of Twente, 7500 AE Enschede, The Netherlands
Photonics 2021, 8(2), 50; https://doi.org/10.3390/photonics8020050
Submission received: 31 December 2020
/
Revised: 23 January 2021
/
Accepted: 10 February 2021
/
Published: 13 February 2021
(This article belongs to the Section Lasers, Light Sources and Sensors)
Abstract
:We show theoretically and numerically how to optimize sign-alternating dispersion waveguides for maximum nonlinear pulse compression, while leveraging the substantial increase in bandwidth-to-input peak power advantage of these structures. We find that the spectral phase can converge to a parabolic profile independent of uncompensated higher-order dispersion. The combination of an easy to compress phase spectrum, with low input power requirements, then makes sign-alternating dispersion a scheme for high-quality nonlinear pulse compression that does not require high powered lasers, which is beneficial for instance in integrated photonic circuits. We also show a new nonlinear compression regime and soliton shaping dynamic only seen in sign-alternating dispersion waveguides. Through an example SiN-based integrated waveguide, we show that the dynamic enables the attainment of compression to two optical cycles at a pulse energy of 100 pJ which surpasses the compression achieved using similar parameters for a current state-of-the-art SiN system.
1. Introduction
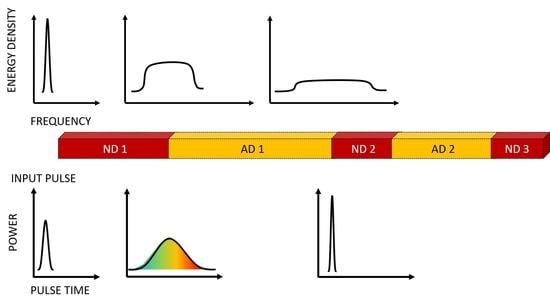
Supercontinuum generation (SCG) in Kerr nonlinear waveguides is central in numerous applications such as in the generation of sub-cycle pulses [1,2,3,4,5,6], metrology using optical frequency combs [7,8,9,10,11], optical coherence tomography [12,13,14] and as a wide-bandwidth source for ranging and sensing applications [15,16]. We have recently introduced the concept of repeatedly sign-alternating dispersion along the propagation direction as a means of overcoming stagnation of spectral bandwidth growth across SCG waveguides [17]. Sign-alternating the dispersion maintains spectral bandwidth generation (i.e., an increase in the pulses’ 1/e bandwidth) in normal dispersion segments (ND) by countering the bandwidth stagnation that occurs by the loss of peak power and duration increase. The stagnation is overcome by temporally compressing the pulse in anomalous dispersion segments (AD). Spectral generation is also kept ongoing in AD segments by the nonlinear temporal compression of the chirped pulse input from the previous ND segments, and avoiding bandwidth-stagnant solitons. The pulse spectral and temporal dynamics are shown in the illustrative example of Figure 1.
While our concept of overcoming spectral stagnation enhances the bandwidth generation-to-peak power efficiency significantly [17], we would like to extend the work to explore the impact of sign-alternating dispersion for nonlinear pulse compression, both theoretically and numerically. The motivation is that nonlinear compression could now take place at much less input peak powers because of the more efficient bandwidth generation in the alternating structures compared to conventional anomalous dispersion and dispersion varying SCG [18,19,20,21,22] or concatenated anomalous dispersion SCG [23] where spectral stagnation is still intrinsically present in the methodology [17]. Lasers that otherwise have too low of a peak power, such as high-repetition sources, integrated chip lasers, or fiber oscillators, could directly be used to generate ultrashort pulses without the need for multiple amplification stages. In addition, material damage accumulated with high powered lasers would not be present; thus, a more extensive range of waveguide geometries and materials became accessible when considering sign-alternating dispersion waveguides for nonlinear pulse compression.
Of primary concern when considering sign-alternation for pulse compression is the impact of a complex spectral phase (i.e., the pulse phase function associated with the frequency spectrum) that could develop in ND and AD segments. If this phase is present, it can limit temporal compression in the AD segments, limiting the total bandwidth generation and the overall achieved temporal compression.
When only considering second-order dispersion, the SCG spectral phase can converge to a parabolic profile, yielding the potential for high pulse compression in sign-alternating dispersion waveguides. The convergence to a parabolic phase spectrum, under the presence of only second-order dispersion has been confirmed in numerous studies of the last few decades, emerging from the interaction of dispersion and self-phase modulation (SPM). A significant example of SCG convergence to a parabolic spectral phase profile is the optical wave-breaking effect of normal dispersion SCG for Gaussian input pulses [24]. A parabolic convergence of the SC phase spectrum is also due to the self-similar nonlinear evolution that occurs from the very specific case of highly chirped parabolic input pulses (named similaritons) [25,26,27,28].
However, the literature does not rigorously address the impact of the interaction of higher than second-order dispersion and SPM on the spectral SC phase for normal dispersion and for a general Gaussian pulse input. Since uncompensated higher-order dispersion is iteratively cascaded in sign-alternating dispersion waveguides, a complex spectral phase profile may emerge, despite the parabolic convergence demonstrated previously.
In this paper, the impact of uncompensated higher than second-order dispersion and self-phase modulation in the ND and AD segments is related to the spectral phase development of the SCG pulse. Here, we additionally find that SPM reduces higher-order spectral phase coefficients so that the phase remains near parabolic despite significant uncompensated higher than second-order dispersion.
Given this phase effect, we then show that, under certain conditions, the specific shape of the ND group-velocity dispersion (GVD) profile does not play a significant role in determining the higher-order spectral phase. Thus, a wide choice of ND segments becomes possible for high-quality pulse compression in the alternating structures. Of fundamental interest is that this newly discovered phase effect explains more rigorously why, in general, ND SCG has a near parabolic spectral profile found in various experiments in the last decade [29,30,31,32,33].
Ultimately, we use the found spectral phase to obtain the ideal AD segment’s GVD profiles needed to make sign-alternation feasible as a method for nonlinear pulse compression. We then focus on another regime of SCG, namely when dispersion dominates, to obtain the ideal AD GVD profiles for this regime as well.
Lastly, we demonstrate optimum pulse compression within the integrated photonics platform, where both AD and ND segments contribute substantially to spectral generation. We simulate an example structure on the silicon nitride platform to demonstrate our approach in obtaining compression to two optical cycle pulses. We describe how new soliton nonlinear compression dynamics emerge in sign-alternated dispersion structures that could significantly reduce the compressed duration over conventional AD SCG and overcomes the fundamental soliton duration limitation in soliton-effect pulse compression. These dynamics are substantially different from conventional nonlinear compression schemes, or even from how solitons are generally managed in periodic waveguides [1,34].
2. Concept of Alternating Dispersion Waveguides and Methods
2.1. Concept of Alternating Dispersion Waveguides
The goals of sign-alternation are to maximize bandwidth generation in the ND and/or AD segments and temporal compression in the AD segments. Across the sign-alternating dispersion waveguide, the spectrum increases after every segment, while the pulse duration decreases at the end of every AD segment in comparison to the duration at the previous AD segment, because of additional bandwidth generation. The AD segments ideally should compress the pulse to a near transform-limited power profile. To maintain bandwidth generation and temporal compression in the AD segments, the AD segment length is limited to the length of maximal temporal compression (in most cases this is the soliton length [1]).
The AD length limitation is in contrast to, for example, dispersion alternating waveguides used to reduce parasitic nonlinearity in long distance fiber telecommunications [35,36]. Here, the length of the AD segment is largely extended past where temporal compression occurs, such that the spectral bandwidth narrows, to compensate for the increase that occurs through SPM in other elements in the waveguide and to maintain the pulse duration at a desired average value matching the input duration.
2.2. Methods
We solve the generalized 1-D nonlinear Schrödinger equation (GNLSE), across an example ND waveguide in Section 3.1 and sign-alternating dispersion SiN integrated waveguide in Section 3.3, with dispersion terms up to the 20th order to demonstrate the spectral phase development numerically. We assume that only a single-spatial mode propagates in the waveguide structure, as is the case for the bandwidth range of the single-mode fiber and integrated waveguide we consider in this paper. The GNLSE under the slowly-varying envelope approximation [1,37], is given in Equation (1) as
where is the complex field envelope, are the Taylor series coefficients of the expansion of the frequency-dependent wave number about . is the time coordinate, co-moving in the frame of reference of the group velocity (). is the characteristic timescale of self-steepening.
For input, in Section 3.1, a transform-limited Gaussian pulse (1/e power duration, , of ), with a pulse energy of is used. The peak power and duration of this input pulse renders that SCG here is in the SPM-dominated regime of the ND fiber. We find that the typical characteristic spectral phase evolution of the SCG pulse in the SPM-dominated regime is shown with these parameters.
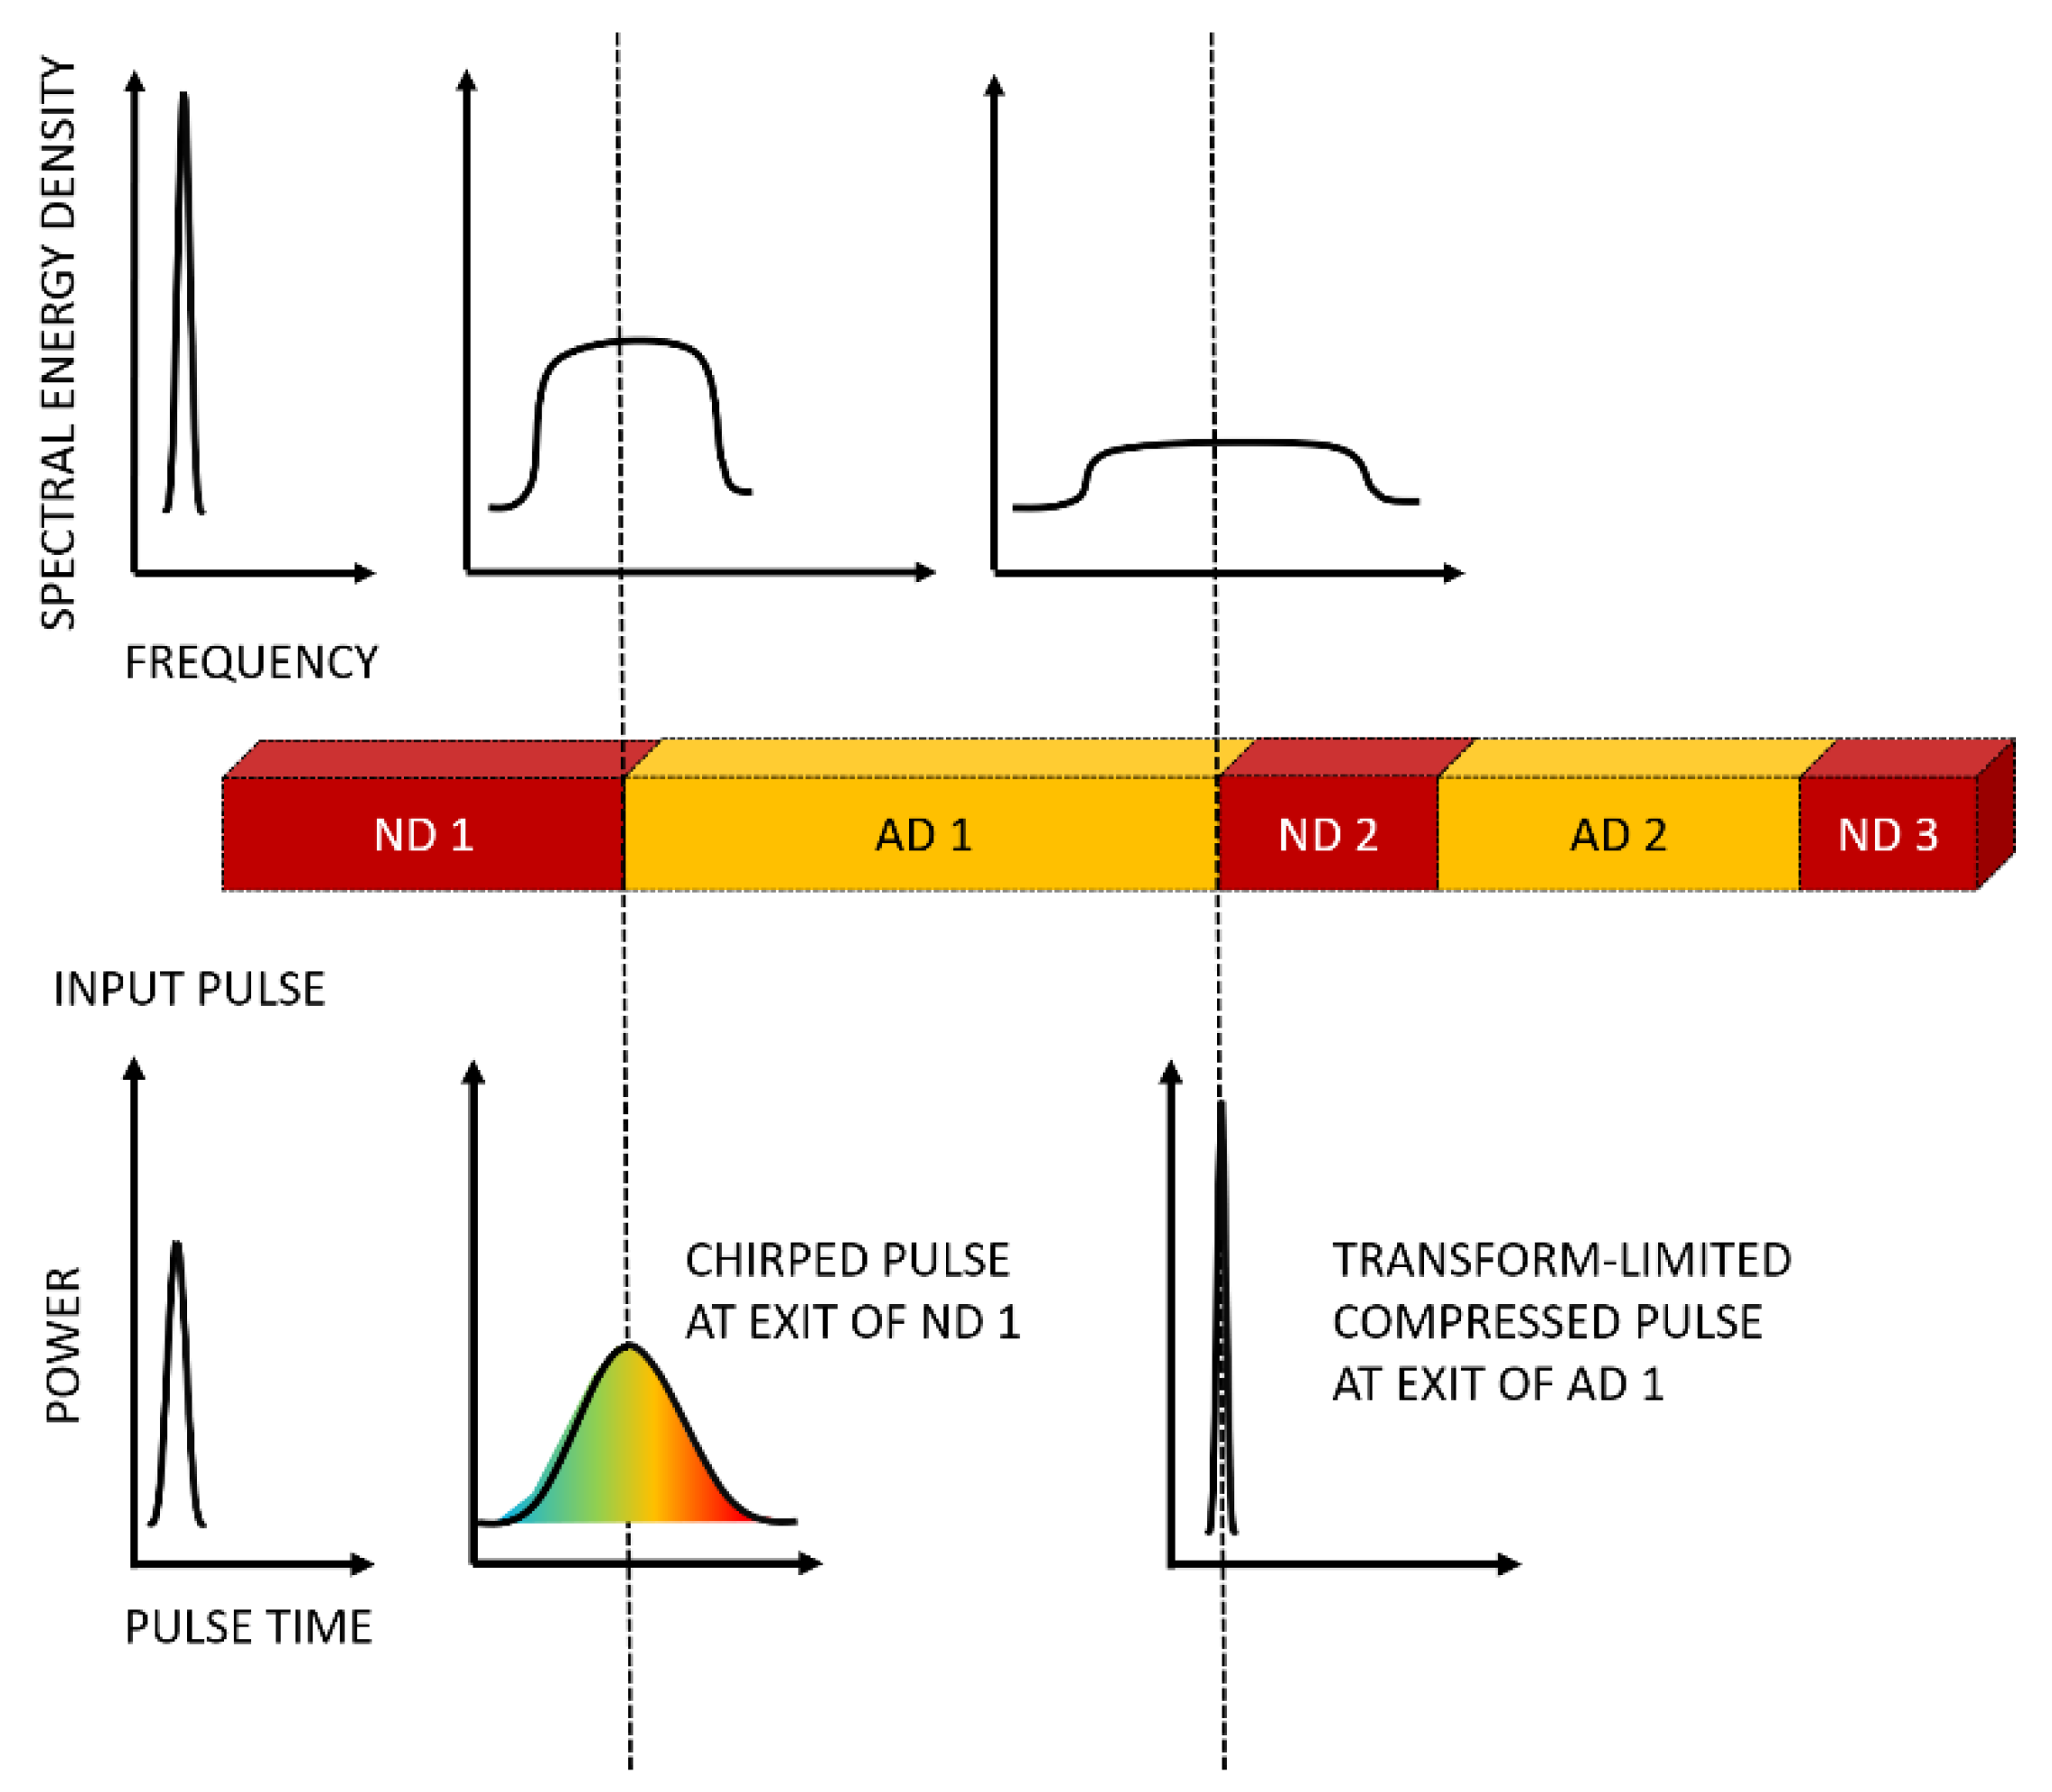
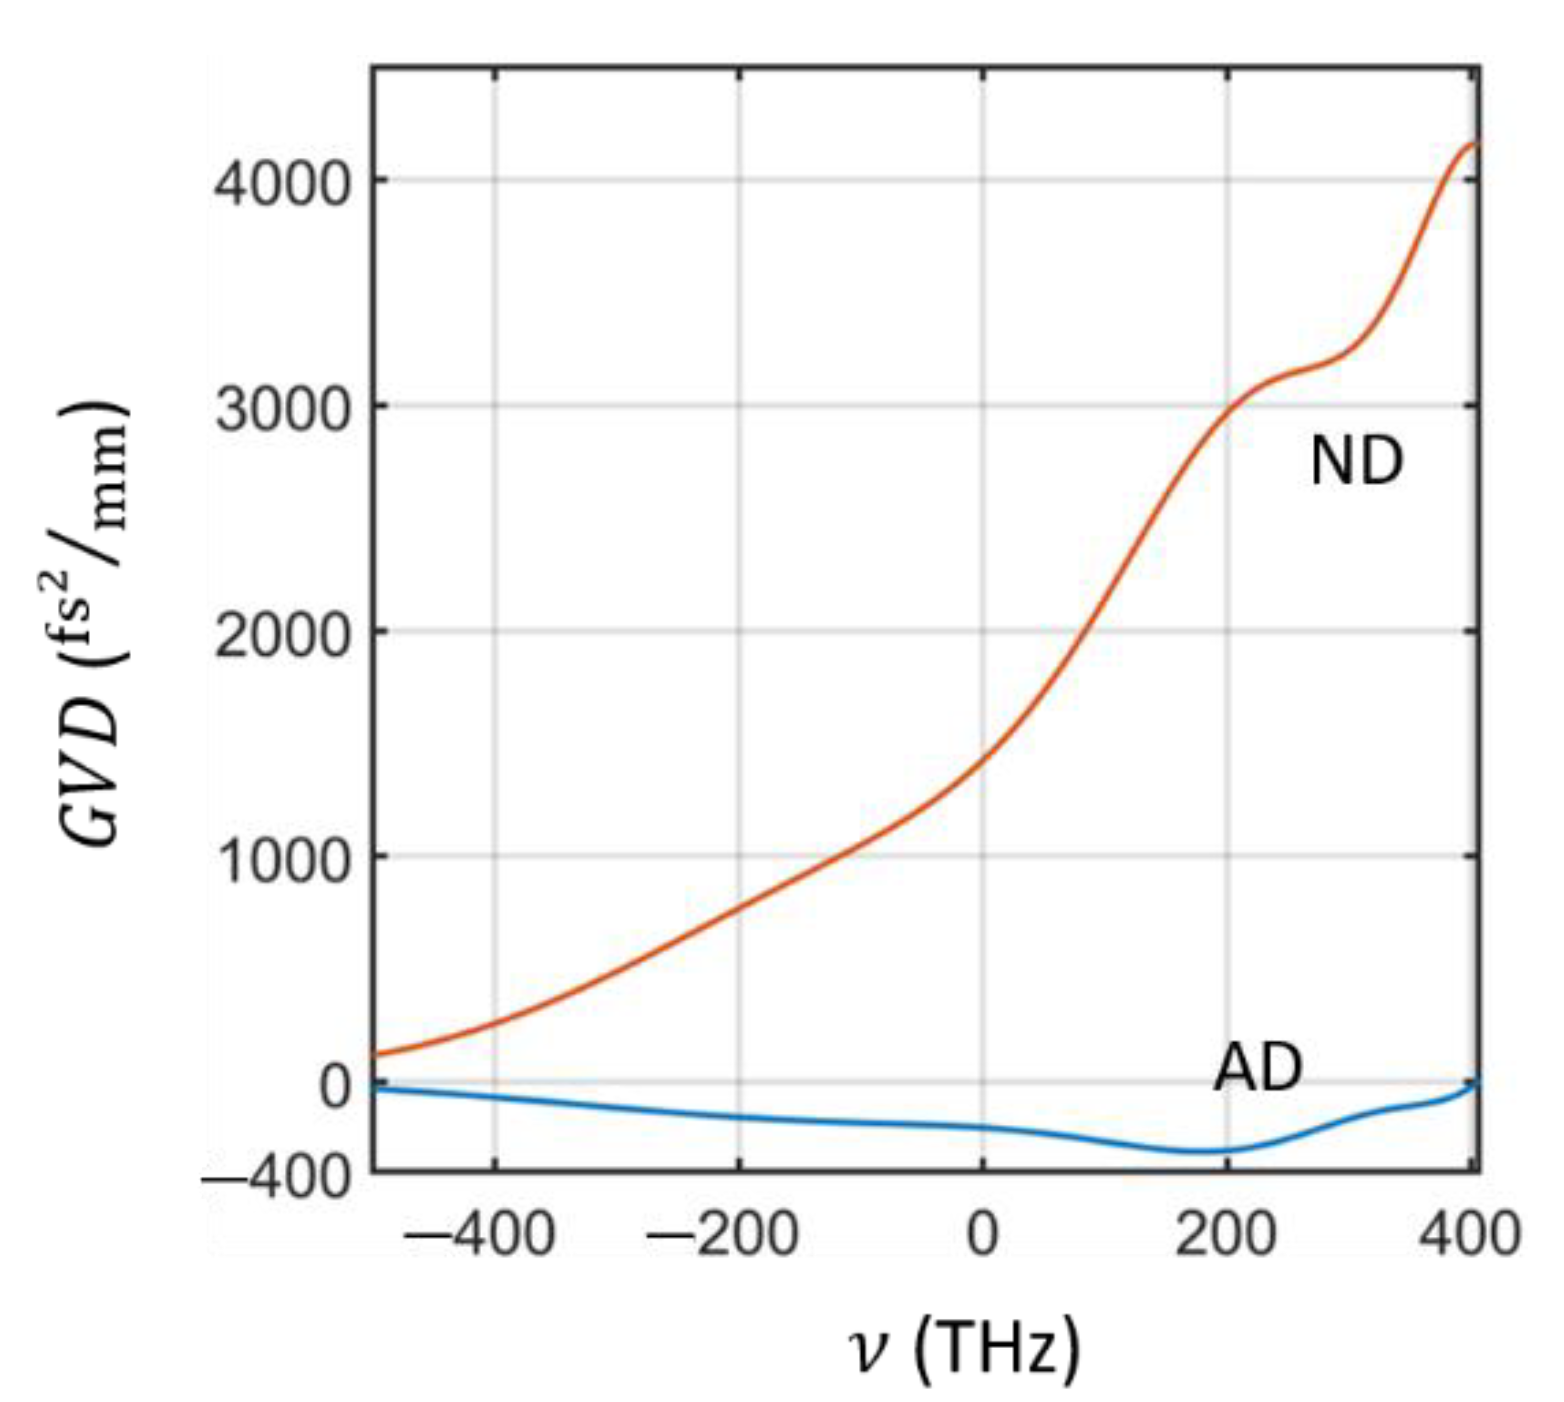
In this numerical model, for Section 3.1 we input the ND segment GVD profile of a normal dispersion fiber (Corning Hi1060flex [17]) with substantial negative third-order dispersion (TOD). We specifically choose a dispersive system where third-order dispersion cannot be neglected and would contribute significantly to the temporal and spectral phase dynamics of the pulse if nonlinear effects were not considered.
We show the GVD of this fiber in Figure 2, plotted along the envelope angular frequency range of interest. The carrier angular frequency () corresponds to the zero of the envelope frequencies in this example, corresponding to a pulse input wavelength of . Typical loss, including entrance splice loss, for this fiber is across the used length.
We note that self-steepening and Raman contributions are omitted to focus on the SPM–dispersion interaction. When enabling these effects, we find negligible impact; this is shown in Supplementary Materials I.
The pulse parameters and group velocity dispersion of the alternating integrated waveguide are listed in the corresponding Section 3.3. Losses for the integrated case are mostly propagation losses (roughly ). Losses caused by the transitions between different segment types are negligible since the transition occurs adiabatically.
3. Results
3.1. Convergence to Near Parabolic Spectral Phase in the SPM-Dominated Regime
We begin by analyzing the spectral phase dynamics when substantial spectral generation occurs only in the ND segments (e.g., of the waveguide in Figure 1), such that the AD segments only serve to temporally compress the pulse, to near transform-limit duration, as it propagates along the sign-alternating dispersion waveguide. This case is particularly beneficial for pulse compression, as normal dispersion supercontinuum generation contains fewer spectral modulations, higher-order spectral phase through the well-known wave-breaking effect [24,30] and negligible modulation instability.
Furthermore, we show that the specific dispersion profile in the ND segment does not play a significant role in determining the spectral phase, when the effects of SPM dominate SCG in the ND segment. In quantitative terms, the invariance to ND dispersion occurs when the nonlinear length, , (), being the input peak power, is shorter than the dispersion length, , ( is the intensity 1/e half duration of the pulse entering a segment, is the second-order GVD coefficient), within the segment, or the inverse soliton ratio, [1,24].
In the SPM-dominated regime, when , the normalized rate of the 1/e spectral energy density bandwidth increase, across the propagation coordinate, , given as is much higher than the rate of duration increase, given as , for a large part of bandwidth generation, i.e., before the overall duration increase reduces the rate of bandwidth increase such that bandwidth stagnation occurs. labels the 1/e bandwidth, is the initial bandwidth, labels the 1/e power duration with being the original duration.
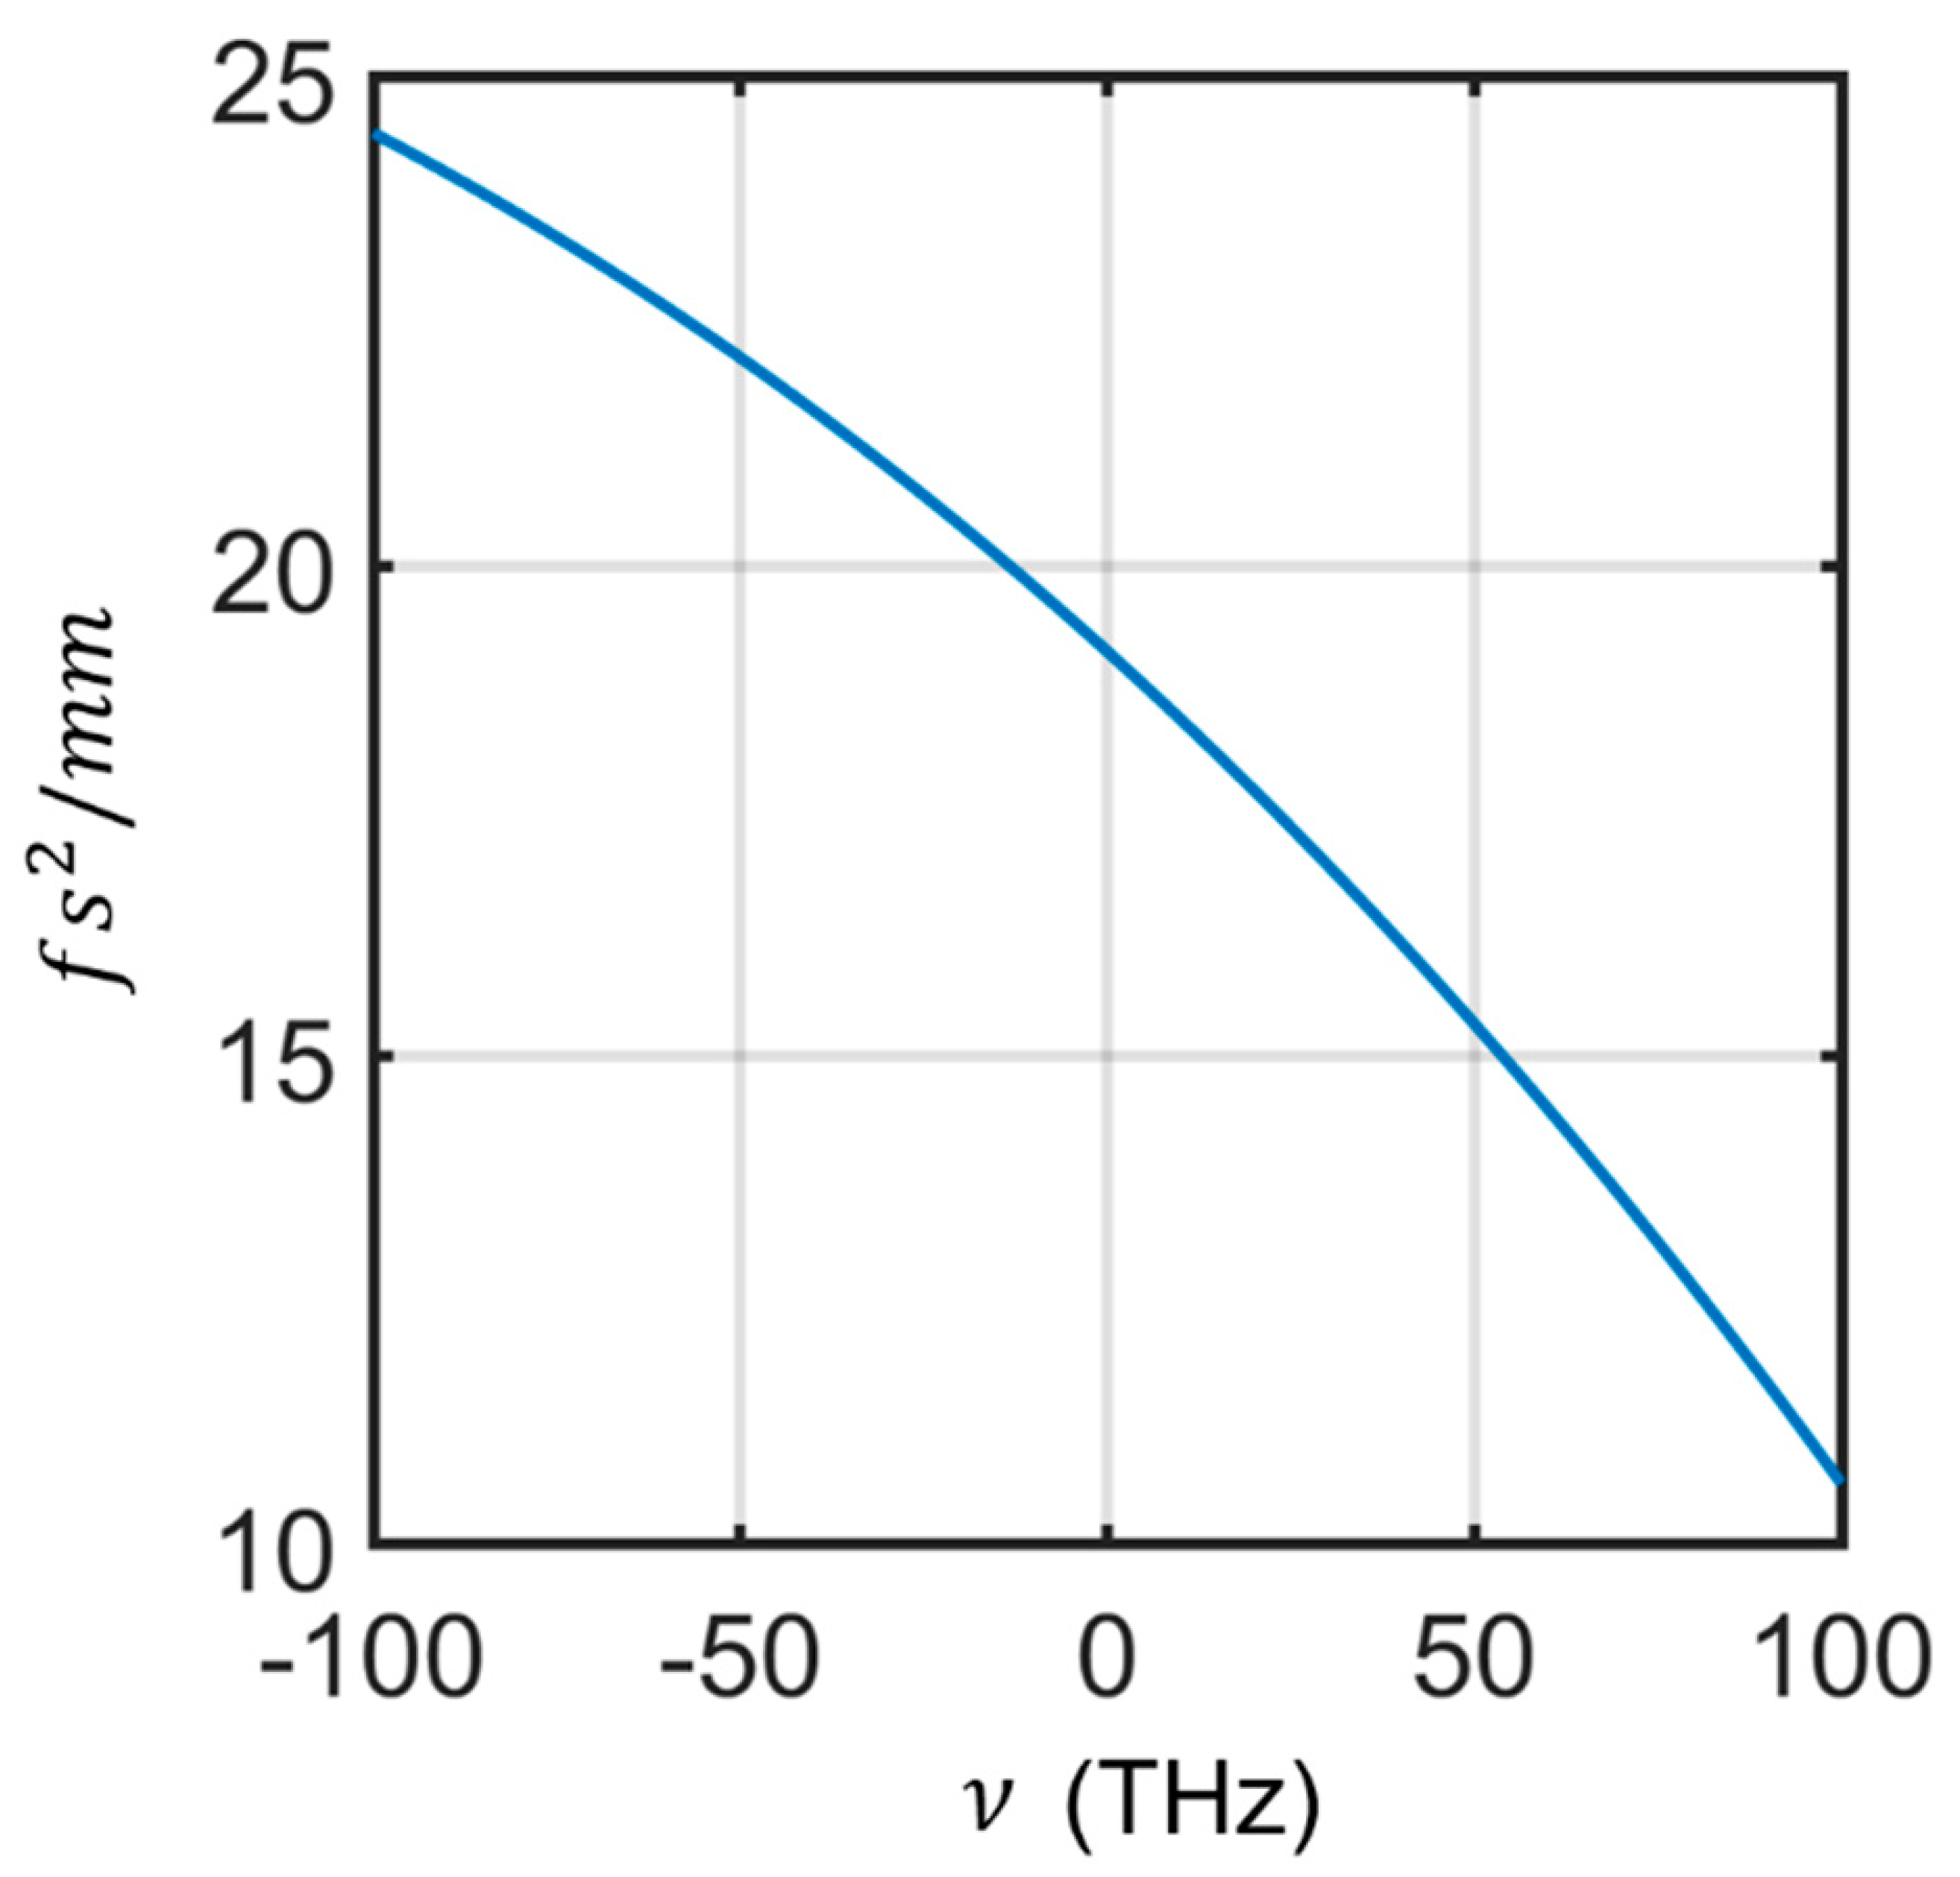
This steeper increase in bandwidth compared to duration results in the spectral phase, , profile being stretched over a larger bandwidth without correspondingly increasing its values to maintain its shape (see illustration in Figure 3), resulting in a decrease in its curvature and thus phase Taylor coefficients. Figure 3 is an illustrative example of a pulse travelling in the SCG-dominated regime, where the pulse duration remains approximately the same between two propagation locations. This results in the phase order coefficients exponentially lowering with the order number, i.e., with variables as defined in Figure 3, the phase coefficients at the latter propagation location in the illustration are given by Equation (2) with derivation in Supplementary Materials II,
The progressive reduction in higher-order derivatives results in a dominant parabolic spectral phase profile to emerge, independent of higher-order dispersion in the waveguide. In ND waveguides, this spectral phase scaling effect, combined with the wave-breaking effect, produces the near parabolic spectral phase profile. Equation (2) of the illustrative case extends to the general SPM ND SCG-dominated case (described above), as will be shown in Section 3.1.1, Section 3.1.2, Section 3.1.3 and Section 3.1.4.
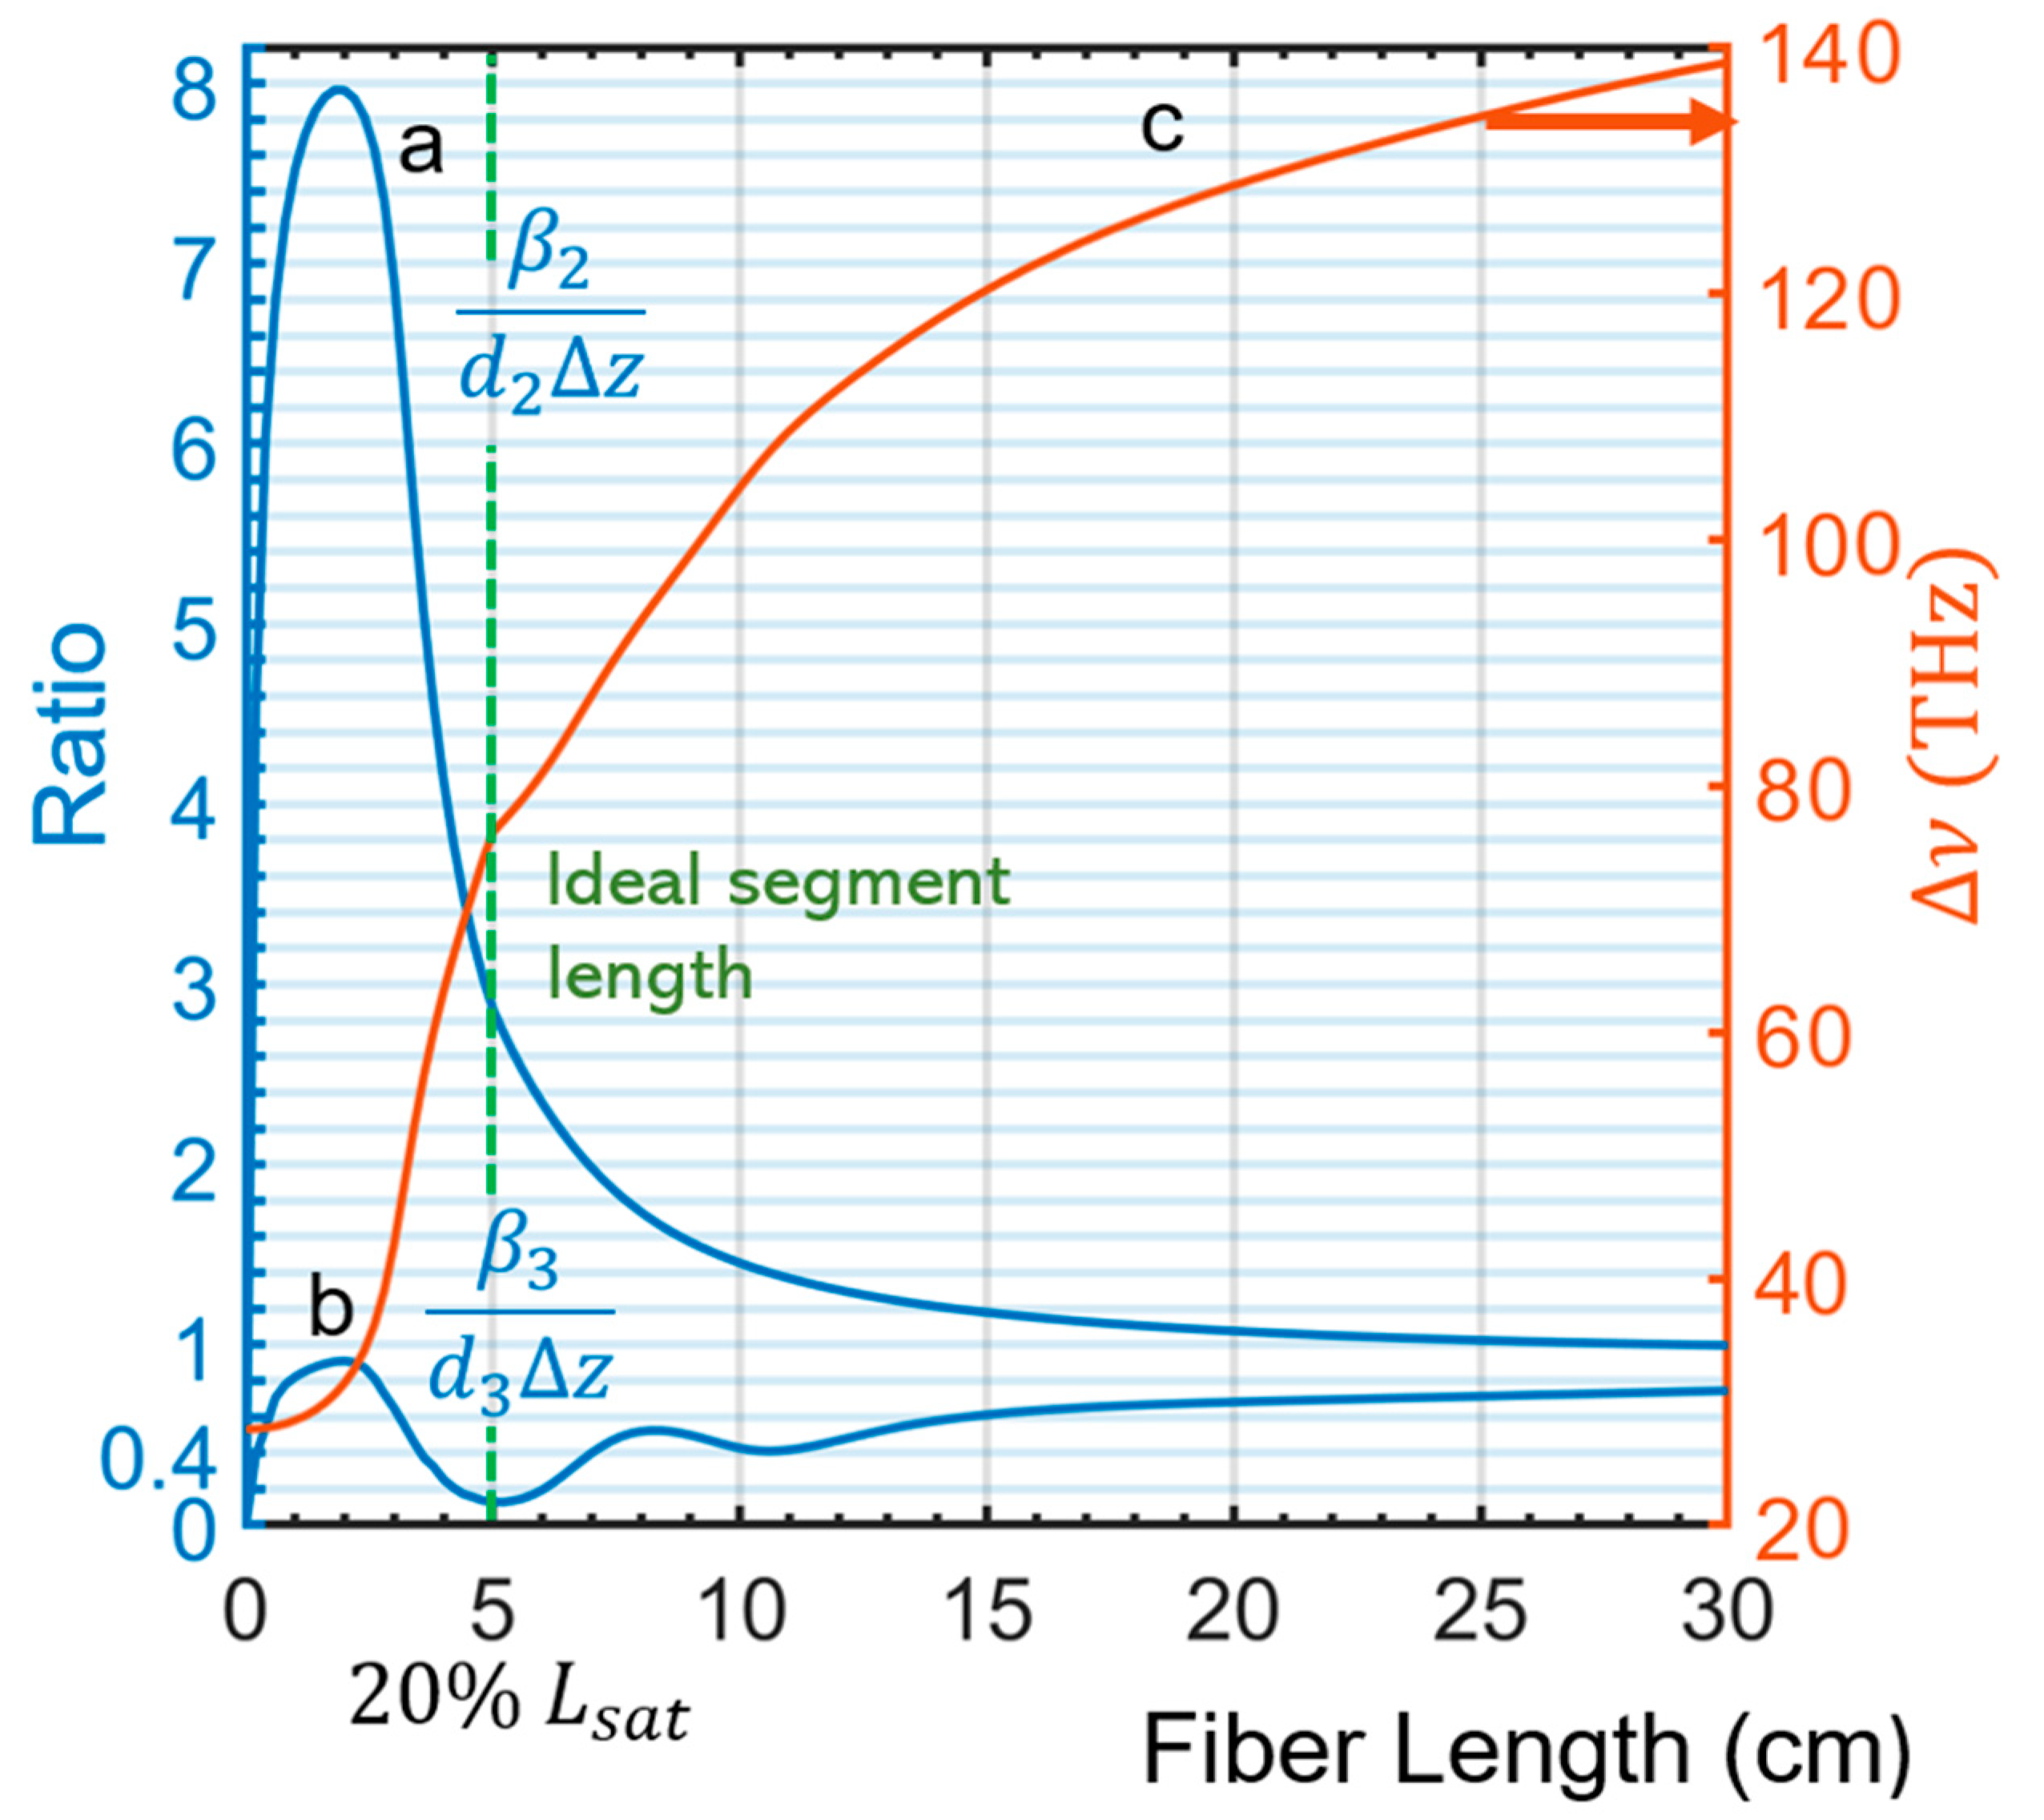
To show the spectral phase reduction in more detail numerically and analytically, we first start by plotting the 1/e angular frequency bandwidth of the spectral energy density, , against the propagation distance, , within the ND fiber in Figure 4, curve c; to obtain the bandwidth increase dynamics for the example ND waveguide segment. The resulting saturation curve is characteristic of spectral bandwidth development in ND SCG within the SPM-dominated regime. The bandwidth increases due to SPM which is dependent on pulse power and duration. We show the propagation up to , which is approximately the saturation length, , of the bandwidth development.
3.1.1. SPM Effects on Second-Order Spectral Phase
We start our analysis of the Taylor coefficient development of the spectral phase with the second-order contribution (). We plot the ratio of with SPM to the (labeled as ) without SPM, versus propagation in Figure 4, curve a, obtained from the GNLSE numerical simulation. is equal to , is the waveguide GVD coefficient (taken about ).
Here we see qualitatively the expected trend as described above, i.e., a decrease in past a certain propagation distance (when the pulse obtains a specific bandwidth value). Then when spectral development ceases, close to the saturation length, the reductive effect of SPM on stops and asymptotically approaches i.e., the ratio plotted in Figure 4, curve a, approaches one.
However, at the beginning of the pulse propagation, there is an increase in to a peak value at approx. before its subsequent decrease. While the peak of can be attributed to parabolic phase additions of SPM, within the beginning region of propagation, the subsequent decrease in is due to the reductive effect of SPM on the spectral phase coefficients, as explained at the start of Section 3.1. More details of how the peak emerges can be found in supplementary information.
For further pulse propagation past the peak of the second-order spectral phase coefficient, it is shown in Supplementary Materials III that the maximal value of scales as shown in Equation (3),
when factoring in higher-order phase contributions.
Going back to Figure 4 curve a, , for most of its development, is higher than , and only decreases to 96% the value of . A stronger reduction in below can be achieved, for example, with input pulses at shorter pulse durations where the peak power is raised such that the ratio is conserved.
However, what is more critical for high-quality pulse compression is to maintain a parabolic profile despite higher-order uncompensated dispersion. Given this sufficiency, the criterion simply becomes that, regardless of the value of , the total second-order spectral phase contribution, .
3.1.2. SPM Effects on Third-Order and Higher Spectral Phase
The criterion for a parabolic phase profile is achieved via a higher reductive effect of SPM on . It is derived in Supplementary Materials IV that scales at most with the bandwidth as indicated in Equation (4),
Thus, ’s dependency, , on SPM bandwidth generation scales much higher than that of (). The higher dependence of on the bandwidth contributes to the peak magnitude of being less than that of and the decrease in going to a lower value versus propagation.
To verify the above, we plot the ratio of , to along the fiber length, in Figure 4, curve b, obtained from the GNLSE numerical simulation. The figure shows that indeed the peak reduction and a larger decrease in occurs, in comparison to the propagation dynamics of the second-order coefficient. The ratio of to grows at first, to about 90 percent and then descends to a minimum of 13% at about 20% (5 cm). In the region where bandwidth saturation starts to occur, the ratio then grows again and eventually approaches one slowly, in the asymptotical limit, for the same reasons given for the second-order coefficient case.
However, even at the saturation length, the ratio is substantially below unity, and across the full propagation remains below one. SPM substantially reduces the third-order spectral phase coefficient below the value found by only considering dispersion without SPM everywhere in the ND fiber.
The larger decrease in versus with respect to frequency, leads to the ratio of approximately scaling as , showing analytically the phase convergence to a near parabolic profile even with substantial higher-order dispersion. A similar method to the third-order coefficient derivation is used to extend the analysis to higher-orders, where, maximally, , showing that in the general case of SPM-dominated ND SCG, the conclusion of Figure 3, that the reductive effect of SPM on phase coefficients increases with order exponentially with the frequency bandwidth holds.
3.1.3. SPM Leads to a Parabolic Spectral Phase Convergence
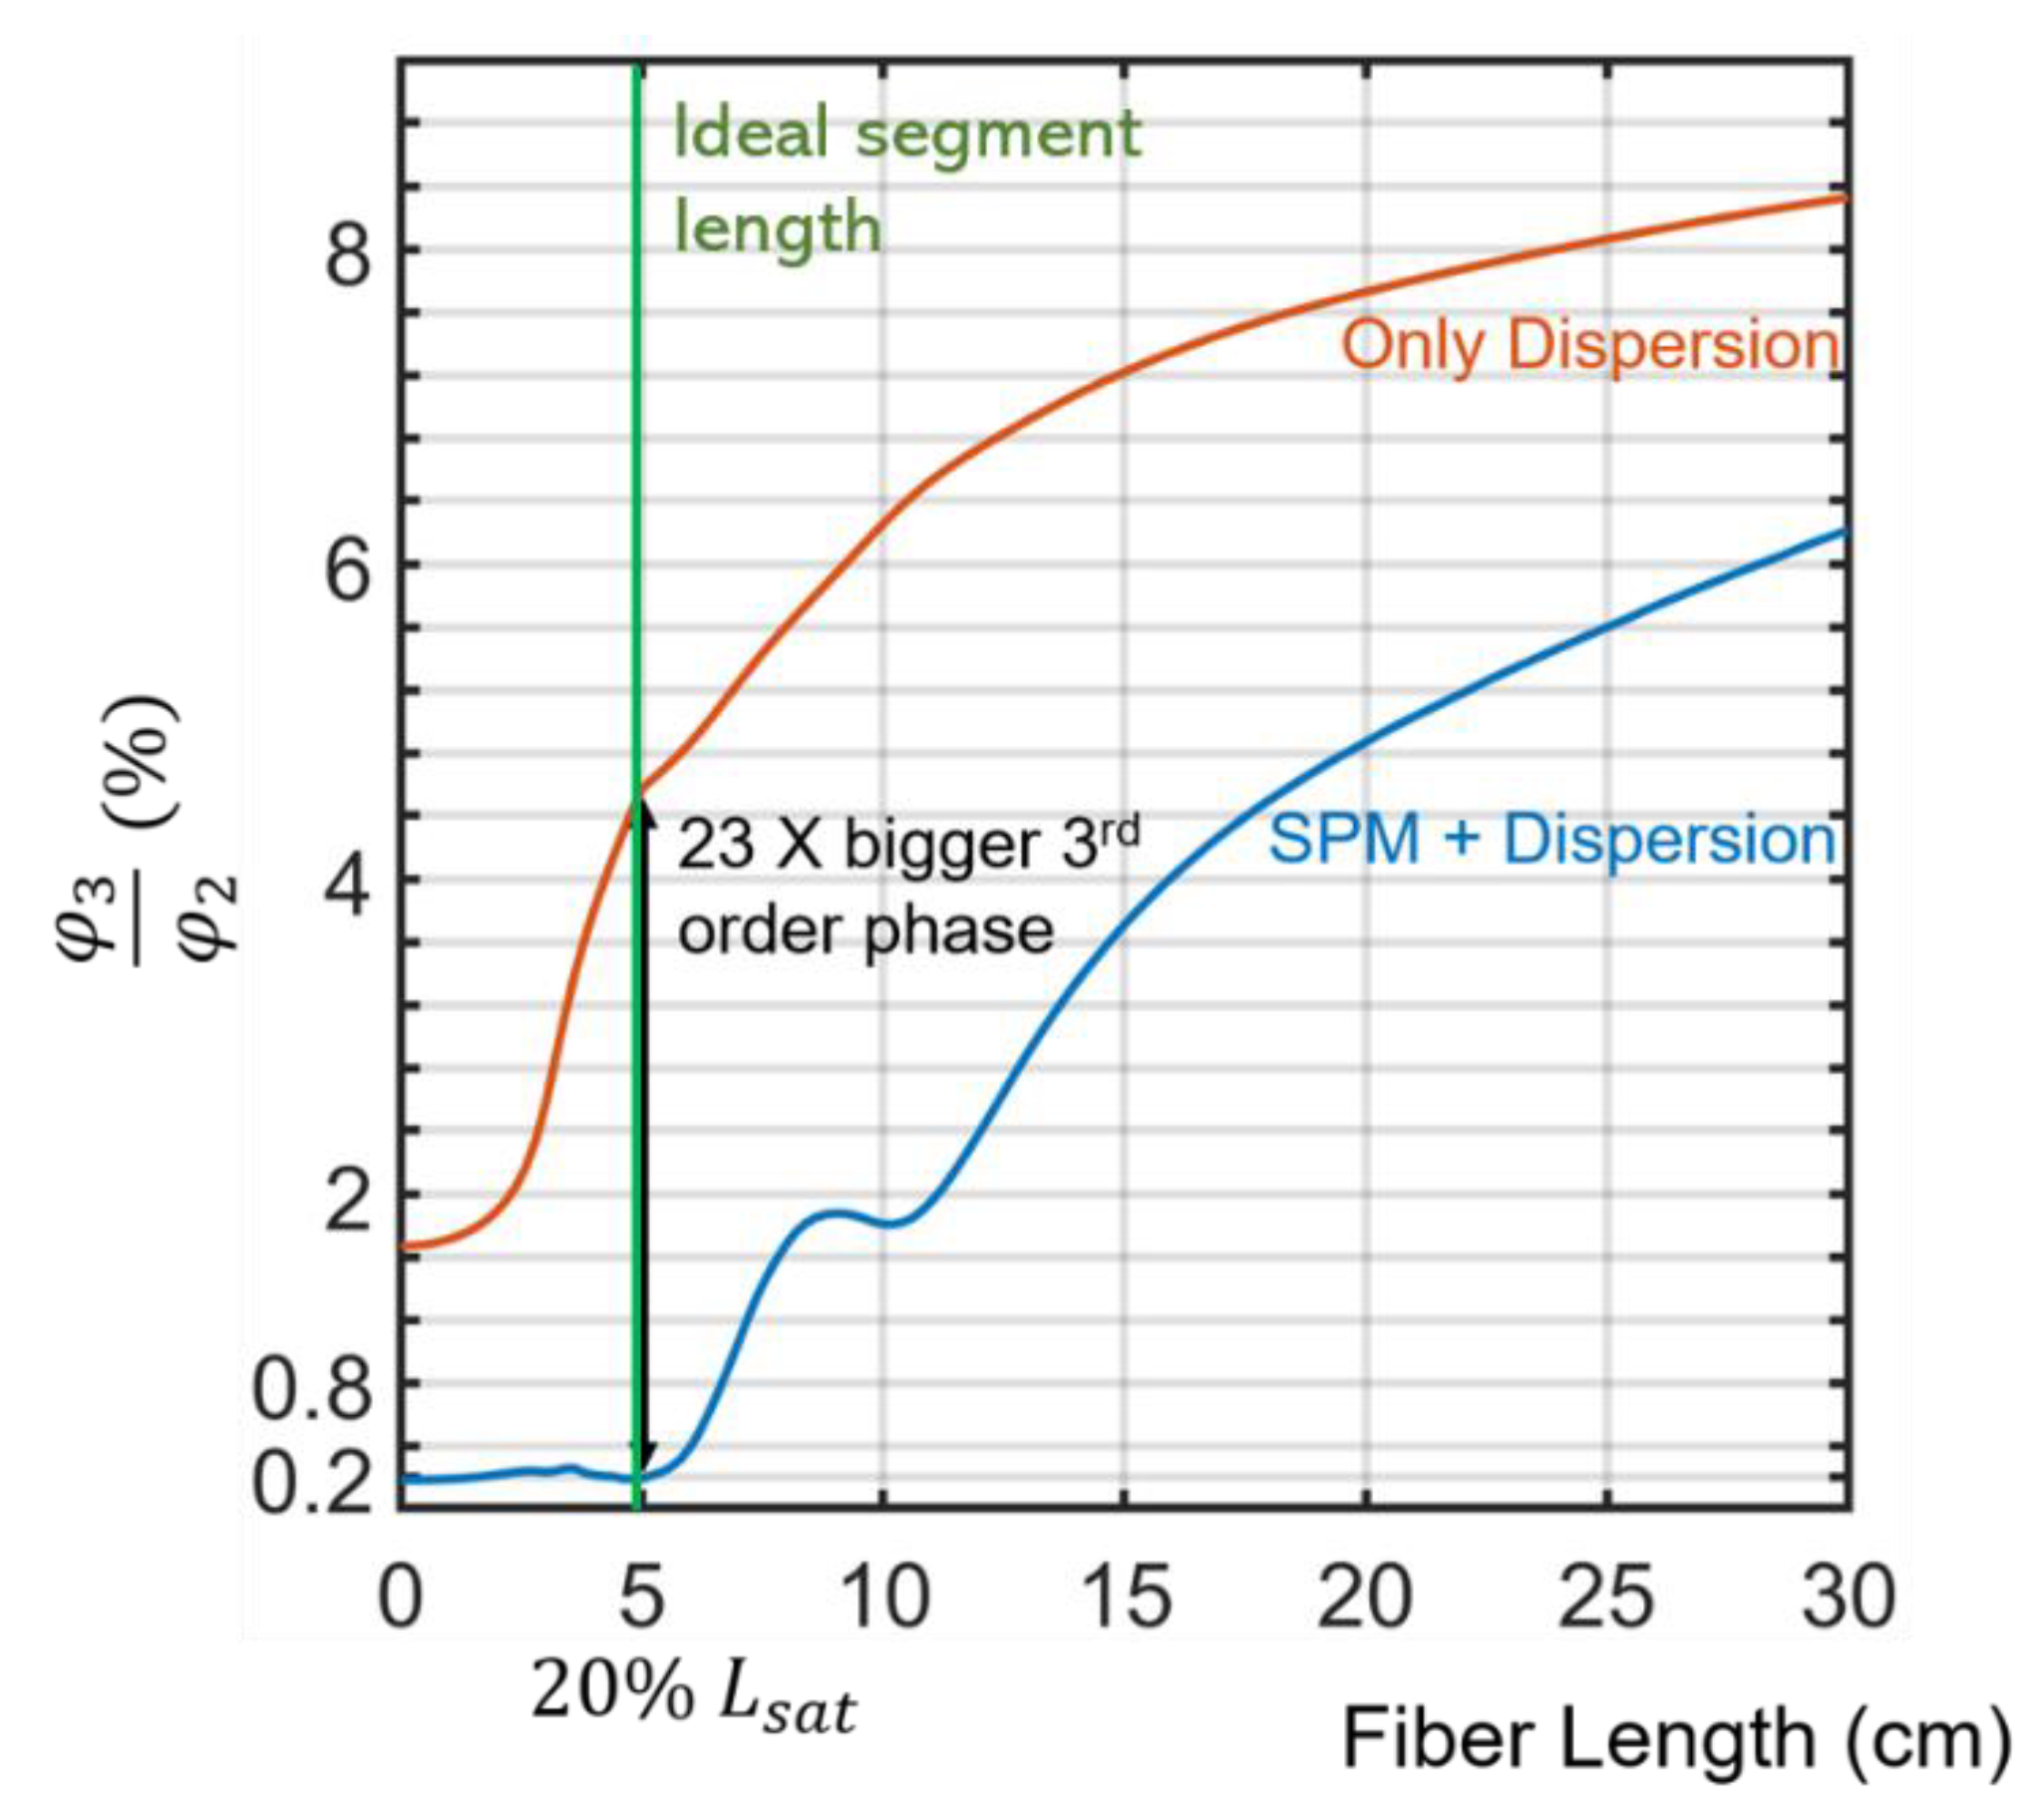
The exponential reduction in phase coefficients naturally leads to the overall phase function being parabolic as shown from the results of the GNLSE simulation, shown in Figure 5. Figure 5 is the plot of the percentage of third-order spectral phase contribution to second-order contribution at the 1/e bandwidth frequency value versus propagation distance in the fiber. The percentage value is at a maximum at the 1/e bandwidth frequency, representing the maximal deviation from a parabolic phase profile.
The lower curve of Figure 5 corresponds to the percentage of third-order spectral phase contribution to second-order at the 1/e bandwidth of the pulse (i.e., ) with SPM and dispersion, while the top curve corresponds to only when dispersion is present (i.e., ).
The ratio with SPM contributions stays well below the same ratio where no SPM is present. This ratio dips to a factor of 23 less than the linear case (0.2%), indicating a strong convergence to a parabolic profile at 20% the spectral saturation length (5 cm—also where shows its minimum in Figure 4, curve b).
3.1.4. Impact of SPM Induced Phase Coefficient Reduction in the Design and Context of Alternating Dispersion Waveguides
Turning to the dispersion profile of the subsequent AD segment needed to compress the pulse coming from the ND segment, we find that the AD GVD profile must satisfy for close to transform-limited pulse compression [38]. The AD GVD profile must then be close to a flat profile in the SPM-dominated regime of SCG and is not strongly dependent on the ND GVD profile, through the above-demonstrated invariance of the ND SCG spectral phase to it.
In a practical alternating dispersion waveguide setup, the optimum ND segment length should be chosen such that the magnitude ratio of output spectral phase coefficients, e.g., to , obtained from numerical simulations like the ones shown above, should be close to the corresponding ratios found from dispersion at the end of the AD segments, so that compression is close to the transform limit in the AD waveguide segments. The optimal ND length is usually where the phase is the most parabolic since this reduces the complexity of the AD GVD profiles and enables high subsequent pulse compression. Simultaneously, the chosen ND length must also yield a high enough bandwidth increasement factor (output bandwidth to input bandwidth—usually ) at that ND segment, so that losses are minimized across the structure (since less segments then are needed).
In our example, the optimal ND segment length is shown as the vertical dotted line in Figure 4 and Figure 5 at . Interestingly, the ratio of and does not minimize when reaches a peak but minimizes when is minimized. At this ND length, the bandwidth increasement factor at the end of the segment is 2.5, which is considered large for segments in sign-alternating dispersion waveguides.
A non-ideal AD GVD profile in the SPM-dominated regime of SCG may not be a problematic criterion since the waveguide consists of subsequent periods of ND–AD segments. After the pulse emerges from this (non-ideal) AD segment, it would still go into a subsequent ND segment, where the nonlinear generation there would reduce the higher-order spectral phase coefficients of the entering pulse.
In the context of the sign-alternating dispersion waveguides, the bandwidth entering subsequent ND segments continually increases, resulting in a more considerable decrease in higher-order spectral phase coefficients (e.g., as seen in Equation (4)). This more considerable decrease would, in turn, result in a higher convergence to a parabolic spectral phase profile versus a uniform ND SCG waveguide across the sign-alternating dispersion structure for segments where SCG is in the SPM-dominated regime. The advantage of sign-alternating dispersion waveguides for pulse compression then lies both in spectral bandwidth versus input peak power efficiency and in the obtained spectral phase profile for pulse compression applications.
For example, this reduction in the input phase explains the experimental result described in the results section of [17], that specifically, the maximum third order phase contribution, occurring at the endpoints of 1/e bandwidth of the SCG pulse, is a factor of three less than the linear case at the output. The factor of three reduction is despite uncompensated higher-order dispersion in the AD segments.
3.2. AD GVD in the Dispersion-Dominated Regime
Having obtained that a flat AD GVD profile is ideal for the SPM-dominated regime, we turn our attention to when dispersion dominates over the pulse’s propagation in the supercontinuum generation (e.g., in the ND segments where ). The dispersion-dominated regime is always present in sign-alternating dispersion waveguides after many alternations or with exceedingly low input powers. In general, the AD GVD profiles would have to transition from that for the beginning SPM SCG regime to those belonging to a transition regime and then to the ideal profile for the last dispersion regime across the alternating structure.
The Supplementary Materials V contains a general method for making the ideal AD GVD profiles that compensate for a general spectral phase from the ND segment. The method constructs the AD segment from sub-segments, each of which solves for a particular dispersion coefficient.
The AD GVD profiles become more critical for the dispersion-dominated regime as there is no substantial SPM phase effect present anymore. The AD GVD profiles would converge to a scaled reflection of the previous ND segment GVD curve about the frequency axis, with the scaling factor determining the AD segment’s length, i.e., what would be expected in linear pulse compression, as shown in Equation (5)
and the AD segment length is the previous ND segment length divided by .
From Equation (5), for a constant ND segment length, the AD segments converge to a constant length (provided the same AD and ND waveguides are used throughout the alternating structure). Then, periodic waveguides can be constructed, where the spectrum linearly increases across the waveguide’s ND segments [17], provided losses are negligible. Ultimately, this allows for sign-alternation to be used in a resonator or pulse circulator configuration, e.g., in a similar scheme as [39,40].
The dynamics within the dispersion-dominated regime provide another option for the design of AD segment dispersion. Instead of maximal pulse compression within a few segments, where the AD segment profiles become hard to engineer and are changing, one can use a simple periodic arrangement of highly dispersive unchanging segments. This simple arrangement would achieve the same spectral frequency bandwidth, so also the temporal compression ratio, albeit with many more segments.
The increased number of segments makes it critical to minimize and to understand how losses affect bandwidth generation. The results of [17] for the dispersion-dominated regime is extended to incorporate the effects of losses, i.e., the total bandwidth increase as a function of the amount of bandwidth generating segments, , with losses is given in Equation (6) as,
where, is the segment-specific loss and ( being the pulse energy) is the bandwidth increase in one segment. Equation (6) becomes a linearly increasing function versus if losses are negated.
The dispersion-dominated regime has been explored in a sign-alternating dispersion silica fiber waveguide [41], although not stated as such in that publication. The authors manage to extend the spectral generation to obtain a moderate compression factor by use of this regime across all six segments except for the first two. While the experimental results in [41] do not significantly differ from [17], the potential for using the dispersive SCG regime for pulse compression is shown.
3.3. Sign-Alternating Dispersion in Integrated Photonics
A valid concern on pulse compression would be the impact of spectral generation in AD waveguide segments in a practical setting. For example, if the input pulse energy exceeds the fundamental soliton energy [1], in the AD segments, where is the 1/e duration of the pulse entering the segment, substantial spectral generation can take place in these segments even with low nonlinear coefficient compared to that of the ND segments. To address AD segment nonlinear compression, we simulate the pulse evolution in a sign-alternating dispersion Silicon Nitride waveguide where both segment types have high nonlinear coefficients (ND: , AD: ). The GVD profiles versus pulse envelope angular frequency for both segment types are given in Figure 6.
The waveguide input pulse has a 1/e duration of with a Gaussian profile centered at . The input pulse energy of is substantially higher than the soliton energy in the first AD segment (approx. ). Thus, generation is carried out in both ND and AD segment types.
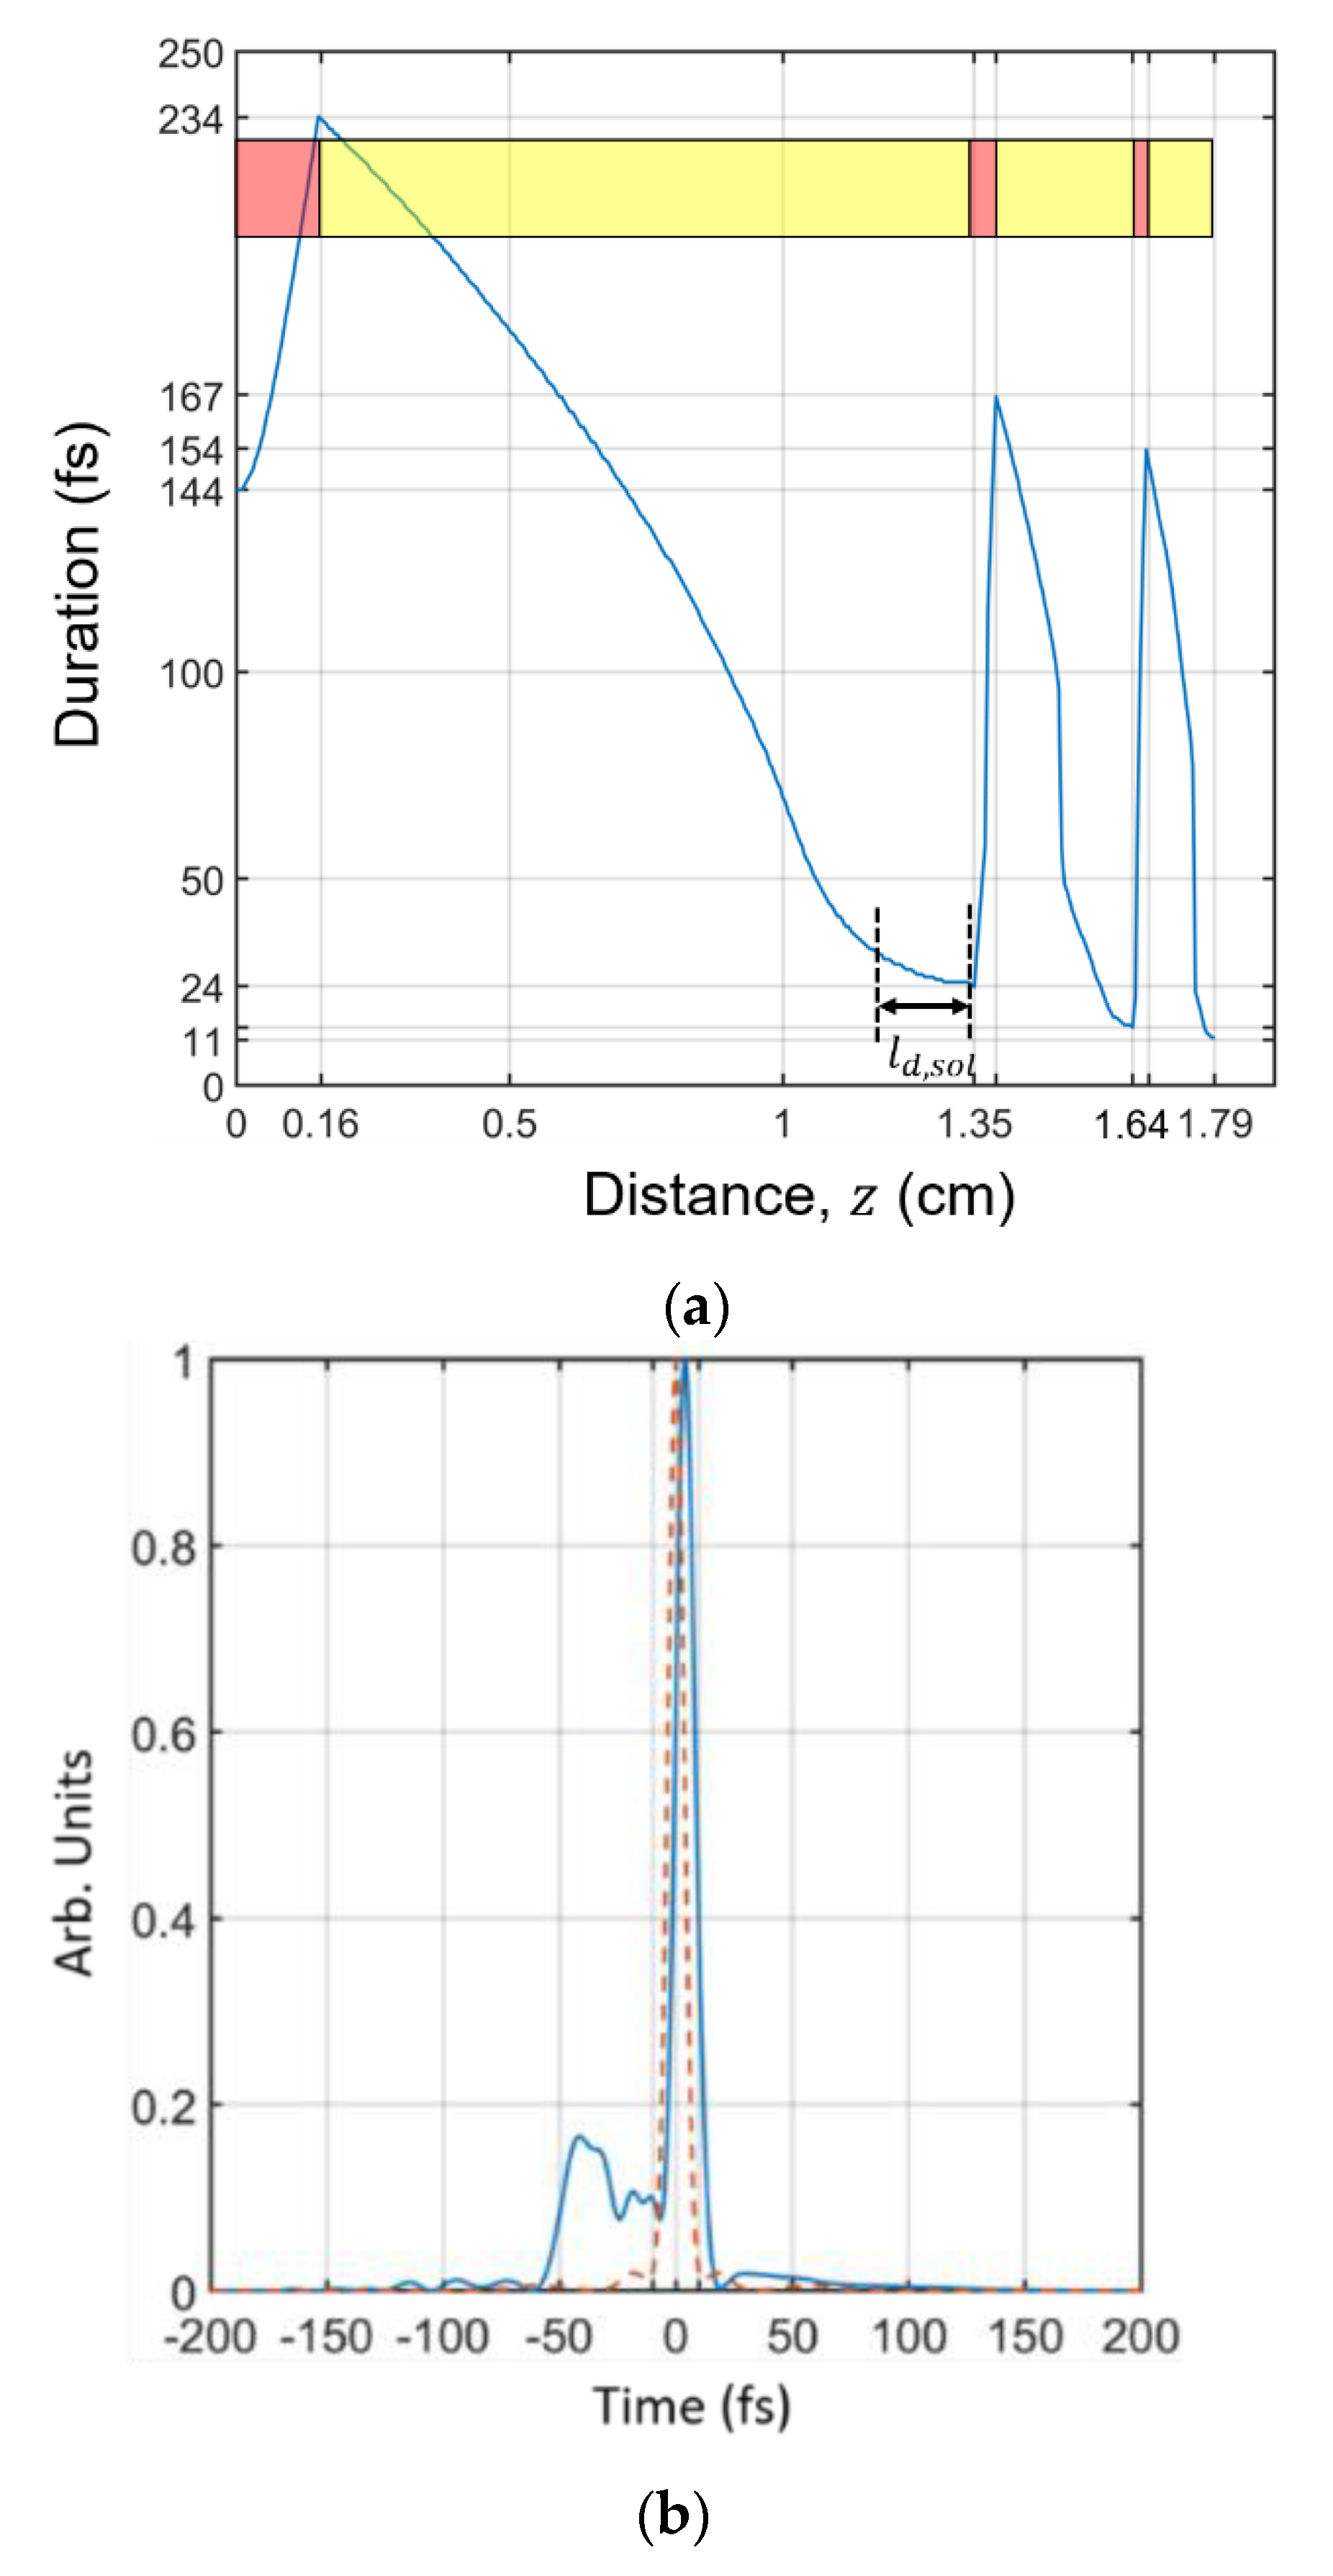
The constructed sign-alternating waveguide’s temporal development is indicated in Figure 7a, where a final 1/e pulse duration of approximately is obtained (approx. two optical cycles), giving a temporal compression factor of 12. Additionally, indicated in the figure are the waveguide segments’ lengths, where red indicates an ND segment and yellow an AD segment.
Figure 7b compares the simulated pulse power profile versus pulse time, normalized to the peak power of both the transform-limited profile and the output profile from the sign-alternating structure. However, the output pulse exhibits more features below the 20 percent level of the peak power than the transform-limited profile, of duration , due to the uncompensated phase from AD SCG. The pulse energy contained in these features are approx. 30% of the total pulse energy. Thus, 70% of the pulse energy lies in the main peak, which still may be adequate for further frequency generation experiments.
4. Discussion
To put the performance of the sign-alternating dispersion SiN waveguide into context, we compare it to the current state-of-the-art SiN waveguide system with comparable input pulses [18]. We find that this example’s compressed duration and overall compression ratio is substantially less than those of [18] at lower power requirement. The work of [18] obtains a 1/e duration of with two-segment concatenated AD SiN waveguides, with a compression ratio of 5, using a pulse energy of . The concatenated system has more than a factor of two pulse energy required with more than a factor of two less compression ratio than our concept. The increased power efficiency with larger compression ratio, found by sign-alternating the dispersion, compared to conventional methodologies, is then demonstrated.
New soliton and pulse compression dynamics can explain the substantially higher performance of sign-alternation than the state-of-the-art soliton effect pulse compression that these structures possess. Two factors limit current AD pulse compression:
- The minimal compressed duration is the duration of the fundamental soliton allowed with a given pulse energy because spectral generation terminates once a soliton is formed, and the fundamental soliton is the shortest allowed.
- The final pulse duration may not reach the lower limit duration described in 1., since formation of a higher-order soliton, at a narrower bandwidth stops nonlinear compression to the fundamental. The higher-order soliton forms first because its generation length is shorter by a factor of the soliton number than that of the fundamental soliton [1,40].
Both limitations are bypassed in the sign-alternating dispersion waveguide. To address limitation 1: Spectral generation in the ND segments, partnered with access to a new regime of spectral generation—named chirped-pulse temporal compression—in the AD segments removes the fundamental soliton limitation, as these processes do not depend on the dynamics of soliton formation.
The chirped-pulse temporal compression arises when the chirped-pulse from the first ND segment enters the next AD segment, where the pulse temporally compresses. In this region, the pulse exhibits a positive second-order spectral phase and a stretched duration from its input profile, which are reduced as the pulse propagates. This reduction increases the pulse’s bandwidth through SPM. Notably, this chirped-pulse region is shorter than the linear case since bandwidth generation continually reduces the pulse’s dispersion length.
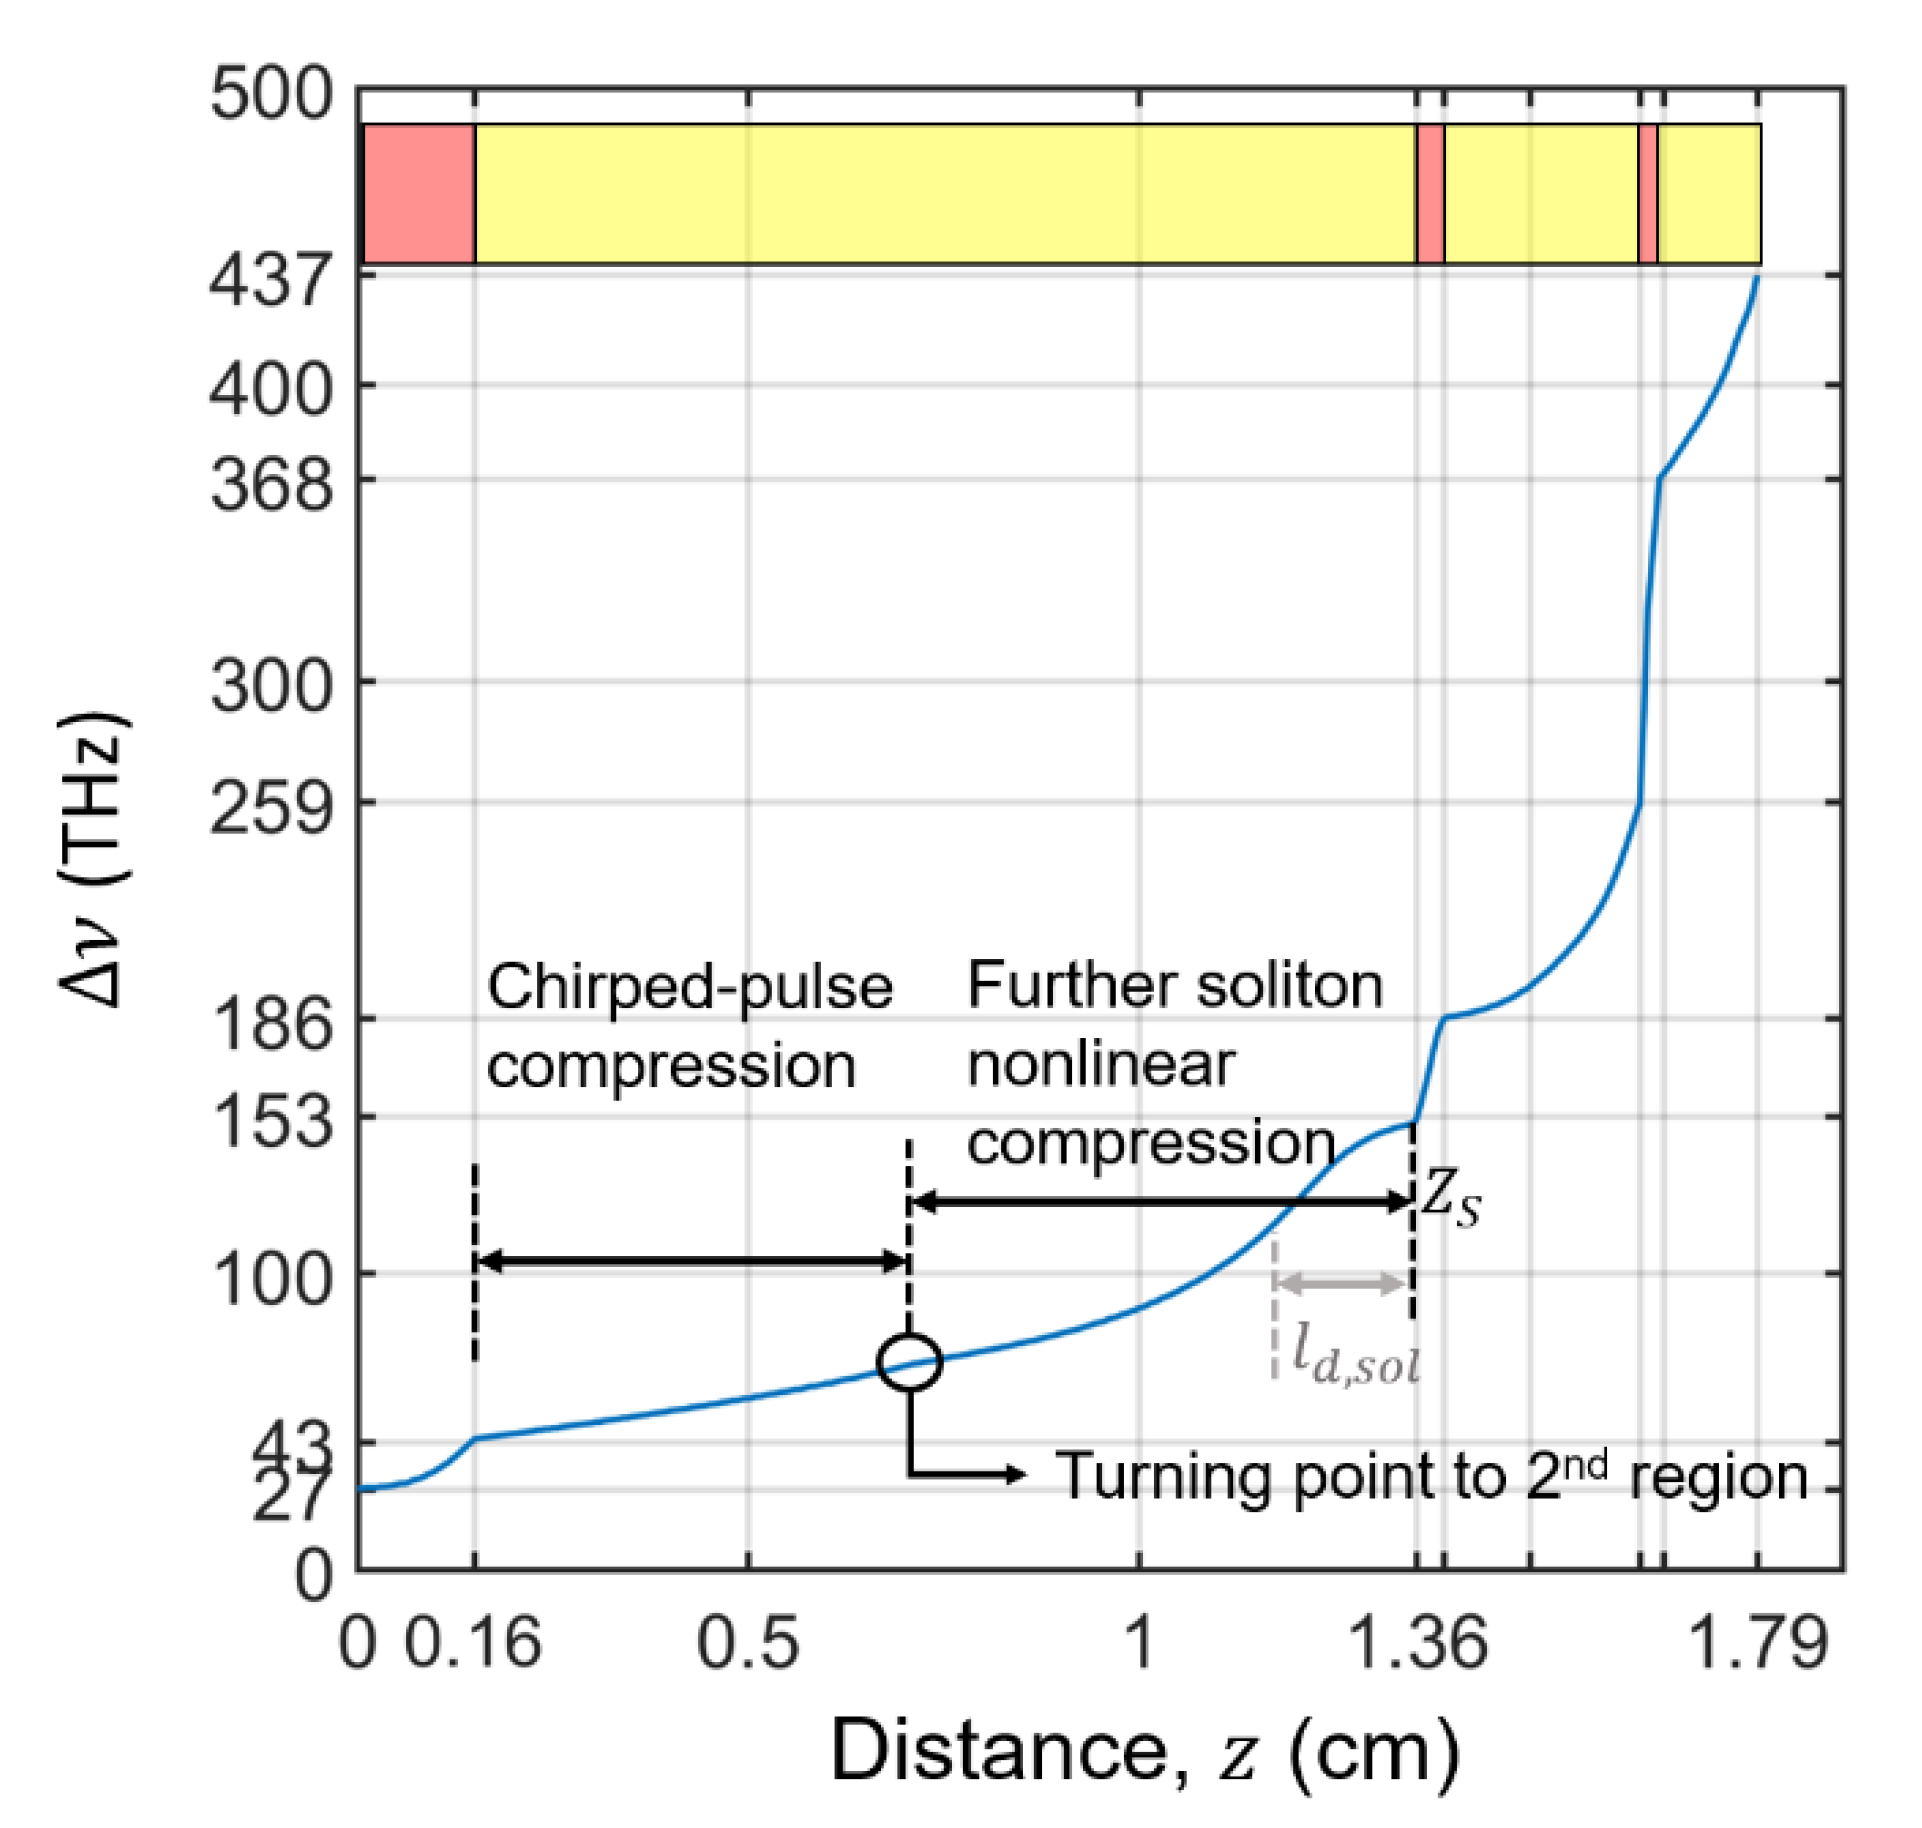
When the pulse’s spectral phase profile has zero second-order phase, nonlinear pulse compression to a soliton extends the spectral generation further. The extended pulse compression is the second region of propagation named “further soliton nonlinear compression.” Within this region, the second-order phase remains zero, and the typical AD SCG dynamics of nonlinear pulse compression to the soliton fission propagation point, [1] occur. Both regions are depicted in the first AD segment shown in Figure 8, which shows the waveguide’s spectral development.
Having defined the two central regions of AD nonlinear compression in the alternating waveguide, we turn back to how the fundamental soliton limitation in conventional soliton-effect compression is surpassed. Once the pulse bandwidth at the exit of the “chirped-pulse compression region” is equal to the fundamental soliton 1/e bandwidth of a given AD segment, namely, , soliton effect compression cannot occur, and the “further soliton nonlinear compression” region is not present.
However, once the fundamental soliton bandwidth is reached, spectral development still occurs in the ND and AD segments since ND SCG and the “chirped-pulse compression” region are still present (as seen in Figure 8). Therefore, further nonlinear pulse compression occurs past the fundamental soliton duration.
Turning to an example, for our simulation, the fundamental soliton bandwidth associated with the pulse energy is , which is surpassed in the first AD segment. The output bandwidth of 153 THz in the first segment is slightly higher than the soliton bandwidth. This is attributed to higher order dispersion in the AD segment that reduces the GVD from the central value (as seen in Figure 6) and thus enhances SPM bandwidth generation. In contrast, the bandwidth predicted from the idealized soliton conditions only assume a flat GVD. Because the soliton bandwidth is surpassed in the first segment, for all proceeding segments, soliton effect compression cannot take place. Nevertheless, by the remaining spectral generation mechanisms in the ND and AD segments, the total spectral development of 437 THz, and the corresponding temporal compression ratio are substantially above the fundamental soliton limitation in conventional soliton-effect compression (i.e., approx. a factor of three larger).
We expect that in the limit of many segments, for both segment types, spectral generation would converge to what is indicated in Equation (6) in later dispersion-dominated segments. Therefore, the bandwidth increase will converge to a linear increase, provided the AD GVD profile satisfies Equation (5) for latter segments, and losses are managed. For our example, within the output pulse bandwidth, the AD GVD profile satisfies Equation (5) with , contributing to the high pulse compression factor obtained. The continual spectral increase then removes any minimal duration limitation present in current AD nonlinear compression schemes.
To address limitation 2: Before the fundamental soliton bandwidth can be reached, the pulse may stop its duration decrease due to it forming a higher-order soliton. However, this limitation is completely bypassed in sign-alternating the dispersion. Again, the additional mechanisms of spectral increase in the ND and AD segments, e.g., the AD chirped-pulse region, disrupts formation to a higher-order soliton, allowing access to the full fundamental soliton bandwidth and then beyond by the mechanisms described in addressing limitation 1.
To show how a higher-order soliton is disrupted, we start with the conventional non-alternated AD SCG nonlinear compression dynamic. In the conventional case, the pulse typically shapes into the highest higher-order soliton possible, where the soliton order, , and 1/e duration, , satisfy Equation (7) [1],
such that is less than the input pulse duration. Subsequently, the pulse then undergoes soliton fission into solitons of approximately the same duration as the higher-order soliton, with no further temporal compression. Since, for higher-order solitons, , is higher than that of the fundamental soliton allowed by the waveguide. This effect particularly limits the compression ratio scaling with energy of AD nonlinear pulse compression [1,42,43].
In contrast to the conventional case, once the higher-order soliton is reached in an AD segment, there is still bandwidth generation in the next ND segment and the subsequent AD segment’s chirped pulse compression region. This bandwidth generation reduces the duration found at the start of the next AD segment’s further nonlinear soliton compression region, labeled , compared to the duration at the end of the previous AD segment (the end duration is close to the segment’s higher-order soliton duration, ), i.e., . The new obtained at the end of the AD segment, is, therefore, smaller than or equal to . From Equation (7), the new must correspond to a smaller , i.e., soliton order, than in the previous AD segment. In this fashion, the reduction in soliton order for subsequent AD segments happens until the fundamental soliton bandwidth condition is reached, i.e., when .
In sum, the reduction in soliton order combined with further bandwidth generation beyond the fundamental soliton bandwidth, allowed with sign-alternation, lowers the obtained pulse durations at a given input pulse energy over conventional AD SCG which are limited to the duration and spectrum of the first higher-order soliton reached.
5. Conclusions
We found that ND SCG is robust to higher-order dispersion through a newly shown horizontal scaling of the spectral phase. Therefore, ND segments do not have to be chosen for a specific dispersion profile shape in sign-alternating dispersion waveguides used for nonlinear pulse compression. This robustness is increased within our sign-alternating structures, rendering that our waveguide concept combines a near parabolic spectral phase profile with an increased input power to bandwidth efficiency. Thus, we foresee that our scheme has the potential for few-cycle pulse compression without the onus of high peak power drive lasers, rendering accessible new laser sources (e.g., high repetition rate lasers, integrated photonics laser sources) for pulse compression.
Furthermore, conditions that lead to the AD and ND segment lengths to converge to a constant are explored, along with the needed corresponding segment dispersion profiles. The convergence enables the use of a sign-alternation dispersion waveguide SCG in resonator configurations.
Results of nonlinear pulse compression in the integrated photonics setting were shown. The final compressed pulse had a duration of , being two-optical cycles. This duration was a factor of three less than the duration obtained by conventional soliton dynamics. We then described new soliton dynamics that emerge within the alternated structure that can significantly enhance pulse compression.
Supplementary Materials
The following are available online at https://www.mdpi.com/2304-6732/8/2/50/s1, Supplementary Materials Section I (containing Figure S1: Comparison of simulation results with Raman and self-steepening) through to Section V (containing Figure S2: AD sub-segment scheme).
Funding
The authors would like to acknowledge funding from the MESA+ Institute of Nanotechnology within the grant “Ultrafast switching of higher-dimensional information in silicon nanostructures”. The authors would also like to acknowledge funding from the Netherlands Organisation for Scientific Research (NWO) Demonstrator grant, No. 18562.
Institutional Review Board Statement
Not applicable.
Informed Consent Statement
Not applicable.
Data Availability Statement
Data and code available upon reasonable request from the author.
Acknowledgments
The authors would like to thank Klaus-Jochen Boller for useful discussions and input. Portions of this work were presented at the High-brightness Sources and Light-driven Interactions Congress in 2020.
Conflicts of Interest
The funders had no role in the design of the study; in the collection, analyses, or interpretation of data; in the writing of the manuscript, or in the decision to publish the results.
References
- Dudley, J.M.; Genty, G.; Coen, S. Supercontinuum generation in photonic crystal fiber. Rev. Mod. Phys. 2006, 78, 1135–1184. [Google Scholar] [CrossRef]
- Heidt, A.M.; Feehan, J.S.; Price, J.H.V.; Feurer, T. Limits of coherent supercontinuum generation in normal dispersion fibers. J. Opt. Soc. Am. B 2017, 34, 764–775. [Google Scholar] [CrossRef] [Green Version]
- Manzoni, C.; Mücke, O.D.; Cirmi, G.; Fang, S.; Moses, J.; Huang, S.-W.; Hong, K.-H.; Cerullo, G.; Kärtner, F.X. Coherent pulse synthesis: Towards sub-cycle optical waveforms. Laser Photonics Rev. 2015, 9, 129–171. [Google Scholar] [CrossRef] [Green Version]
- Hassan, M.T.; Luu, T.T.; Moulet, A.; Raskazovskaya, O.; Zhokhov, P.; Garg, M.; Karpowicz, N.; Zheltikov, A.M.; Pervak, V.; Krausz, F.; et al. Optical attosecond pulses and tracking the nonlinear response of bound electrons. Nature 2016, 530, 66–70. [Google Scholar] [CrossRef] [PubMed]
- Hemmer, M.; Baudisch, M.; Thai, A.; Couairon, A.; Biegert, J. Self-compression to sub-3-cycle duration of mid-infrared optical pulses in dielectrics. Opt. Express 2013, 21, 28095–28102. [Google Scholar] [CrossRef] [Green Version]
- Chen, H.-W.; Zia, H.; Lim, J.K.; Xu, S.; Yang, Z.; Kärtner, F.X.; Chang, G. 3 GHz, Yb-fiber laser-based, few-cycle ultrafast source at the Ti: Sapphire laser wavelength. Opt. Lett. 2013, 38, 4927–4930. [Google Scholar] [CrossRef]
- Yu, M.; Okawachi, Y.; Griffith, A.G.; Picqué, N.; Lipson, M.; Gaeta, A.L. Silicon-chip-based mid-infrared dual-comb spectroscopy. Nat. Commun. 2018, 9, 1–6. [Google Scholar] [CrossRef] [Green Version]
- Luke, K.; Okawachi, Y.; Lamont, M.R.E.; Gaeta, A.L.; Lipson, M. Broadband mid-infrared frequency comb generation in a Si3N4 microresonator. Opt. Lett. 2015, 40, 4823. [Google Scholar] [CrossRef]
- Schliesser, A.; Picqué, N.; Hänsch, T.W. Mid-infrared frequency combs. Nat. Photonics 2012, 6, 40–449. [Google Scholar] [CrossRef] [Green Version]
- Rieker, G.B.; Giorgetta, F.R.; Swann, W.C.; Kofler, J.; Zolot, A.M.; Sinclair, L.C.; Baumann, E.; Cromer, C.; Petron, G.; Sweeney, C.; et al. Frequency-comb-based remote sensing of greenhouse gases over kilometer air paths. Optica 2014, 1, 290. [Google Scholar] [CrossRef] [Green Version]
- Holzwarth, R. Optical frequency metrology. Nat. Rev. 2002, 416, 1–5. [Google Scholar]
- Humbert, G.; Wadsworth, W.J.; Leon-Saval, S.G.; Knight, J.C.; Birks, T.A.; Russell, P.S.J.; Lederer, M.J.; Kopf, D.; Wiesauer, K.; Breuer, E.I.; et al. Supercontinuum generation system for optical coherence tomography based on tapered photonic crystal fibre. Opt. Express 2006, 14, 1596. [Google Scholar] [CrossRef]
- Unterhuber, A.; Považay, B.; Bizheva, K.; Hermann, B.; Sattmann, H.; Stingl, A.; Le, T.; Seefeld, M.; Menzel, R.; Preusser, M. Advances in broad bandwidth light sources for ultrahigh resolution optical coherence tomography. Phys. Med. Biol. 2004, 49, 1235–1246. [Google Scholar] [CrossRef]
- Israelsen, N.M.; Petersen, C.R.; Barh, A.; Jain, D.; Jensen, M.; Hannesschlaeger, G.; Tidemand-Lichtenberg, P.; Pedersen, C.; Podoleanu, A.; Bang, O.L. Real-time high-resolution mid-infrared optical coherence tomography. Light Sci. Appl. 2019, 8, 1–13. [Google Scholar] [CrossRef] [Green Version]
- Du, Q.; Luo, Z.; Zhong, H.; Zhang, Y.; Huang, Y.; Du, T.; Zhang, W.; Gu, T.; Hu, J. Chip-scale broadband spectroscopic chemical sensing using an integrated supercontinuum source in a chalcogenide glass waveguide. Photonics Res. 2018, 6, 506–510. [Google Scholar] [CrossRef]
- Kaminski, C.F.; Watt, R.S.; Elder, A.D.; Frank, J.H.; Hult, J. Supercontinuum radiation for applications in chemical sensing and microscopy. Appl. Phys. B 2008, 92, 367–378. [Google Scholar] [CrossRef]
- Zia, H.; Lüpken, N.M.; Hellwig, T.; Fallnich, C.; Boller, K.-J. Supercontinuum Generation in Media with Sign-Alternated Dispersion. Laser Photonics Rev. 2020, 6, 2000031. [Google Scholar] [CrossRef]
- Carlson, D.R.; Hutchison, P.; Hickstein, D.D.; Papp, S.B. Generating few-cycle pulses with integrated nonlinear photonics. Opt. Express 2019, 27, 37374–37382. [Google Scholar] [CrossRef] [PubMed] [Green Version]
- Foster, M.A.; Gaeta, A.L.; Cao, Q.; Trebino, R. Soliton-effect compression of supercontinuum to few-cycle durations in photonic nanowires. Opt. Express 2005, 13, 6848–6855. [Google Scholar] [CrossRef] [PubMed]
- Singh, N.; Vermulen, D.; Ruocco, A.; Li, N.; Ippen, E.; Kärtner, F.X.; Watts, M.R. Supercontinuum generation in varying dispersion and birefringent silicon waveguide. Opt. Express 2019, 27, 31698–31712. [Google Scholar] [CrossRef] [Green Version]
- Ciret, C.; Gorza, S.P. Generation of ultra-broadband coherent supercontinua in tapered and dispersion-managed silicon nanophotonic waveguides. JOSA B 2017, 34, 1156–1162. [Google Scholar] [CrossRef] [Green Version]
- Hu, H.; Zhang, X.; Li, W.; Dutta, N.K. Simulation of octave spanning mid-infrared supercontinuum generation in dispersion-varying planar waveguides. Appl. Opt. 2015, 54, 3448–3454. [Google Scholar] [CrossRef]
- Travers, J.C.; Popov, S.V.; Taylor, J.R. Extended blue supercontinuum generation in cascaded holey fibers. Opt. Lett. 2005, 30, 3132–3134. [Google Scholar] [CrossRef]
- Alfano, R.R. The Supercontinuum Laser Source: The Ultimate White Light; Springer: New York, NY, USA, 2016. [Google Scholar]
- Zeytunyan, A.; Yesayan, G.; Mouradian, L.; Kockaert, P.; Emplit, P.; Louradour, F.; Barthélémy, A. Nonlinear-dispersive similariton of passive fiber. J. Eur. Opt. Soc. Rapid Publ. 2009, 4. [Google Scholar] [CrossRef] [Green Version]
- Finot, C.; Millot, G.; Dudley, J.M. Asymptotic characteristics of parabolic similariton pulses in optical fiber amplifiers. Opt. Lett. 2004, 29, 2533–2535. [Google Scholar] [CrossRef]
- Finot, C.; Parmigiani, F.; Petropoulos, P.; Richardson, D.J. Parabolic pulse evolution in normally dispersive fiber amplifiers preceding the similariton formation regime. Opt. Express 2006, 14, 3161–3170. [Google Scholar] [CrossRef] [PubMed]
- Finot, C. Dispersion managed self-similar parabolic pulses. J. Opt. 2008, 10, 085101. [Google Scholar] [CrossRef] [Green Version]
- Hori, T.; Takayanagi, J.; Nishizawa, N.; Goto, T. Flatly broadened, wideband and low noise supercontinuum generation in highly nonlinear hybrid fiber. Opt. Express 2004, 12, 317–324. [Google Scholar] [CrossRef]
- Heidt, A.M.; Rothhardt, J.; Hartung, A.; Bartelt, H.; Rohwer, E.G.; Limpert, J.; Tünnermann, A. High quality sub-two cycle pulses from compression of supercontinuum generated in all-normal dispersion photonic crystal fiber. Opt. Express 2011, 19, 13873–13879. [Google Scholar] [CrossRef]
- Demmler, S.; Rothhardt, J.; Heidt, A.M.; Hartung, A.; Rohwer, E.G.; Bartelt, H.; Limpert, J.; Tünnermann, A. Generation of high quality, 1.3 cycle pulses by active phase control of an octave spanning supercontinuum. Opt. Express 2011, 19, 20151–20158. [Google Scholar] [CrossRef]
- Sukhoivanov, I.A.; Iakushev, S.O.; Shulika, O.V.; Andrade-Lucio, J.A.; Díez, A.; Andrés, M. Supercontinuum generation at 800 nm in all-normal dispersion photonic crystal fiber. Opt. Express 2014, 22, 30234–30250. [Google Scholar] [CrossRef]
- Xing, S.; Kharitonov, S.; Hu, J.; Brès, C.S. Linearly chirped mid-infrared supercontinuum in all-normal-dispersion chalcogenide photonic crystal fibers. Opt. Express 2018, 26, 19627–19636. [Google Scholar] [CrossRef] [PubMed]
- Malomed, B.A. Soliton Management in Periodic Systems; Springer: New York, NY, USA, 2006. [Google Scholar]
- Essiambre, R.J.; Raybon, G.; Mikkelsen, B. Optical Fiber Telecommunications IV B; Academic Press: New York, NY, USA, 2002; pp. 253–275. [Google Scholar]
- Zitelli, M.; Matera, F.; Settembre, M. 40-Gbit/s transmission in dispersion managed links with step-index fiber and linear compensation. Opt. Lett. 1999, 24, 1169–1171. [Google Scholar] [CrossRef] [PubMed]
- Hult, J. A fourth-order Runge–Kutta in the interaction picture method for simulating supercontinuum generation in optical fibers. J. Light. Technol. 2007, 25, 3770–3775. [Google Scholar] [CrossRef]
- Paschotta, R. Field Guide to Optical Fiber Technology; SPIE: Bellingham, WA, USA, 2010. [Google Scholar]
- Dong, X.; Yang, Q.; Spiess, C.; Bucklew, V.G.; Renninger, W.H. Stretched-pulse soliton Kerr resonators. Phys. Rev. Lett. 2020, 125, 033902. [Google Scholar] [CrossRef]
- Yang, Q.; Spiess, C.; Bucklew, V.G.; Renninger, W.H. Stretched-Pulse Solitons in Driven Fiber Resonators. In Proceedings of the CLEO: Science and Innovations, San Jose, CA, USA, 5–10 May 2019; Optical Society of America: Washington, DC, USA, 2019; p. SF1L-3. [Google Scholar]
- Lüpken, N.M.; Fallnich, C. Bandwidth-limited few-cycle pulses by nonlinear compression in a dispersion-alternating fiber. Appl. Phys. B 2020, 126, 1–7. [Google Scholar] [CrossRef]
- Travers, J.C.; Grigorova, T.F.; Brahms, C.; Belli, F. High-energy pulse self-compression and ultraviolet generation through soliton dynamics in hollow capillary fibres. Nat. Photonics 2019, 13, 547–554. [Google Scholar] [CrossRef] [Green Version]
- Zia, H. Enhanced Nonlinear Pulse Compression Sign-Alternating Dispersion Waveguides at Low Input Peak Powers. In Proceedings of the Mid-Infrared Coherent Sources, Washington, DC, USA, 16–20 November 2020; Optical Society of America: Washington, DC, USA, 2020; p. MM1C-4. [Google Scholar]
Figure 1.
An illustrative example of spectrum and power dynamics of pulse across the first two segments in the sign-alternating dispersion waveguide structure for supercontinuum generation SCG and nonlinear pulse compression. The broadening and compression dynamics repeat (albeit with different values) for every cycle of normal dispersion (ND)—anomalous dispersion (AD) segments across the structure. The duration of the pulse decreases at the exit of every additional AD segment due to the ongoing bandwidth generation.

Figure 2.
Group velocity dispersion in fs2/mm plotted with respect to envelope angular frequencies, across the bandwidth range of interest in an example normal dispersion fiber (Corning hi1060flex).
Figure 2.
Group velocity dispersion in fs2/mm plotted with respect to envelope angular frequencies, across the bandwidth range of interest in an example normal dispersion fiber (Corning hi1060flex).

Figure 3.
(a) Illustration of pulse power versus time of a pulse that undergoes substantial SPM bandwidth broadening while maintaining only a small increase in pulse duration. The power profiles at two positions of propagation are shown, the blue spectrum being at position , while the yellow profile is when the pulse is at a later position . (b) Illustration sketch of the spectral phase function (irrelevant terms to the analysis are omitted) of the pulse shown in (a). The phase spectra at the same two positions of propagation are shown. At the latter location, the phase spectrum is scaled by the ratio of bandwidths in the directions of the arrows. The dotted blue curve shows the extension of the spectral phase function for the pulse at over the bandwidth range of the pulse at to highlight the relative flattening of the phase.

Figure 4.
GNLSE simulation results. Curve a is the 1/e angular frequency bandwidth of the spectral energy density (in THz) versus propagation distance up to the normal dispersion fiber’s saturation length. Curve b is the plot of the ratio of the second-order spectral phase coefficient, , of the SCG pulse to that when there is no nonlinear effect (, versus propagation in the normal dispersion fiber. Curve c is the plot of the ratio of the third-order spectral phase coefficient, , of the SCG pulse to the third-order spectral phase coefficient in the absence of any nonlinear effect () versus the propagation in the normal dispersion fiber.

Figure 5.
Plot of the percentage of third-order spectral phase contribution to second-order contribution at the 1/e bandwidth of the supercontinuum pulse versus propagation distance in fiber. Results are obtained from the GNLSE simulation. Red (top curve) corresponds to the case where only dispersion is present, blue (lower curve) corresponds to the case with both SPM and dispersion.

Figure 6.
Group velocity dispersion versus angular frequency of the pulse envelope for both the ND segments (red) and AD segments (blue) of the Silicon Nitride sign-alternating dispersion waveguide. The zero frequency is the reference frequency of .
Figure 6.
Group velocity dispersion versus angular frequency of the pulse envelope for both the ND segments (red) and AD segments (blue) of the Silicon Nitride sign-alternating dispersion waveguide. The zero frequency is the reference frequency of .

Figure 7.
Numerical results. (a) The temporal 1/e duration as a function of propagation distance within the sign-alternating waveguide. An output duration of is reached, yielding a compression factor of 12. Indicated is the dispersion length of the soliton, i.e., in the first AD segment. (b) The output pulse power profile normalized to the peak power of both the transform-limited pulse (red dotted curve) associated with the spectrum and the obtained pulse from the simulation (blue curve). The power profiles are plotted against envelope time. A transform-limited duration of is obtained. The chip segments are shown at the top (red for ND segments, yellow for AD segments).

Figure 8.
Numerical results using same parameters as for Figure 7. Spectral bandwidth development plotted against propagation distance within the sign-alternating dispersion waveguide. The two regions of spectral generation are shown for the first AD segment. An output bandwidth of 437 THz is obtained. The chip segments are shown at the top (red for ND segments, yellow for AD segments).

Publisher’s Note: MDPI stays neutral with regard to jurisdictional claims in published maps and institutional affiliations. |
© 2021 by the author. Licensee MDPI, Basel, Switzerland. This article is an open access article distributed under the terms and conditions of the Creative Commons Attribution (CC BY) license (http://creativecommons.org/licenses/by/4.0/).
Share and Cite
MDPI and ACS Style
Zia, H. Enhanced Pulse Compression within Sign-Alternating Dispersion Waveguides. Photonics 2021, 8, 50. https://doi.org/10.3390/photonics8020050
AMA Style
Zia H. Enhanced Pulse Compression within Sign-Alternating Dispersion Waveguides. Photonics. 2021; 8(2):50. https://doi.org/10.3390/photonics8020050
Chicago/Turabian StyleZia, Haider. 2021. "Enhanced Pulse Compression within Sign-Alternating Dispersion Waveguides" Photonics 8, no. 2: 50. https://doi.org/10.3390/photonics8020050
Note that from the first issue of 2016, this journal uses article numbers instead of page numbers. See further details here.