Article

Step Surface Profile Measurement Based on Fringe Projection Phase-Shifting Using Selective Sampling

Key Laboratory of Advanced Manufacturing Technology, Ministry of Education, Guizhou University, Guiyang 550025, China
*
Author to whom correspondence should be addressed.
Photonics 2021, 8(12), 592; https://doi.org/10.3390/photonics8120592
Submission received: 1 November 2021 / Revised: 16 December 2021 / Accepted: 17 December 2021 / Published: 20 December 2021

Abstract

:
Fringe projection is a non-contact optical method that is widely used in the optical precision measurement of complex stepped surfaces. However, the accuracy of the fringe phase extraction employed has a direct impact on the measurement precision of the surface shape. Where phase-shifting measurement is used, the classical equal step phase extraction algorithm can only be used to measure simple and smooth surfaces, and leads to measurement errors on complex stepped surfaces, which affects the accuracy of the phase extraction. In addition, the iterative process lasts for a long time, resulting in a low efficiency. This paper proposes a step-by-step phase-shifting extraction algorithm based on selective sampling to measure the contour of the stepped surface. Firstly, the fringe pattern is sampled at equal intervals to reduce the iterative calculation time. Finally, the accurate measurement phase is calculated by the alternating iteration method. The phase extraction accuracy and iteration times are compared in experimental measurements between classical iterative algorithms such as four-step phase-shifting algorithms and the variable phase shift phase interpolation algorithm based on selective sampling. It is shown that the variable frequency phase-shifting extraction algorithm based on selective sampling has a shorter operation time, smaller error, and higher accuracy than the traditional iterative algorithm in fringe projection measuring complex stepped surfaces.

1. Introduction

Structured light projection is the most popular surface shape measurement technology [1]. In particular, the combination of fringe projection profile measurement and phase extraction can provide a high-quality morphology measurement of an object surface because it has the advantages of noncontact and high precision [2,3,4]. Phase-shifting profilometry and Fourier-transform profilometry are typical and popular methods to realize fringe pattern profilometry (FPP). Fourier-transform profilometry only uses one fringe pattern to measure an object’s surface [5], making it more suitable for the measurement of a moving object’s morphology. On the other hand, phase-shifting profile measurements require multiple fringe patterns (usually at least three) to measure the morphological profile of an object [6]. Due to the use of multiple fringe patterns with phase shifting, this method has a high accuracy and robustness. This method cannot only withstand the influence of environmental and reflectivity changes, but also achieves high-precision morphology measurement results.
Measuring the surface shape of mechanical workpieces with a high accuracy has been a topic of study since the 1980s. In 1985, Cheng et al. [7] proposed a measurement method using phase shifting, which became one of the main methods of optical surface shape measurement during that time. The initially proposed method has errors in phase calculation. To overcome this limitation, Lai et al. [6] proposed a generalized phase-shifting extraction method. This method’s reference phase is calculated directly each time the fringe pattern is read, and the accurate phase is obtained from the linear fringe using the Fourier-transform. However, with the continuous progression of hardware and software technology, researchers have proposed many phase extraction algorithms for fringe projection contour measurement; for example, the two-step phase fringe projection measurement proposed by Quan et al. [8]. This method is used for the three-dimensional shape measurement of small objects. Peisen et al. proposed a new three-step phase-shifting algorithm, which is much faster than the traditional three-step phase-shifting algorithm [9]. In addition, to optimize the phase resolution, Christian et al. [10] also proposed a phase denoising method. Since fringe projection technology does not use image intensity but instead uses phases for topography measurement, the phase algorithm becomes particularly important. Zuo et al. [11] made a detailed comparison of various phase-shifting algorithms, which are suitable for high-speed applications. The algorithm is summarized by Xu et al. [12].
The functional performance of the workpiece is significantly affected by its surface morphology (including surface shape and surface texture) [13]. Surface morphology has important traces in its manufacturing process, from traditional manufacturing (such as cutting, grinding, and polishing) to advanced manufacturing technologies (such as magnetorheological polishing and additive manufacturing) [14]. Obtaining high-precision workpiece surface measurements is very important for quality control, design improvement, and final product acceptance [15]. Surface metrology is the basis of and an indispensable part of precision manufacturing. Surface metrology is widely used in various fields, such as optics, precision engineering, and tribology. Because modern science and technology put forward higher requirements for high-tech parts with complex shapes and high precision [16], the need for effective measurements and evaluations of surface morphology in the precision manufacturing process has become more important than ever before. Among them, frequency conversion phase-shifting algorithms have become the trend for modern phase-shifting algorithms [17]. Although principal component analysis (PCA) and advanced iterative algorithms (AIAs) can be used to effectively recover phase information from many phase-shifting fringe patterns [18], there are a series of issues, such as sources of error and the complexity of measuring the surface in the actual measurement process [19]. The traditional phase-shifting algorithm has some disadvantages, such as the influence of noise and phase-shifting error on the phase extraction accuracy of the random phase-shifting algorithm, the influence of the background intensity and modulation system on the phase-shifting algorithm, a slow running speed, and low-accuracy results.
In this paper, the iterative algorithm is used to address and improve the phase. A highly efficient and accurate phase extraction algorithm is proposed, which differs from the traditional method in the study of phase extraction with random sampling to simplify the operation and improve the accuracy. In the measurement process, the algorithm selectively samples the original fringe image, which ensures that all pixel points of the iterative operation are valid, thus lessening the amount of data. In addition, in the case of unknown phase shifting and phases, the algorithm can determine the phase shifting and phase simultaneously through constant iterative computing and achieve higher accuracy in measuring complex step surface profiles due to the insensitivity to the phase-shifting error. The reliability of the algorithm is verified through experimental data.

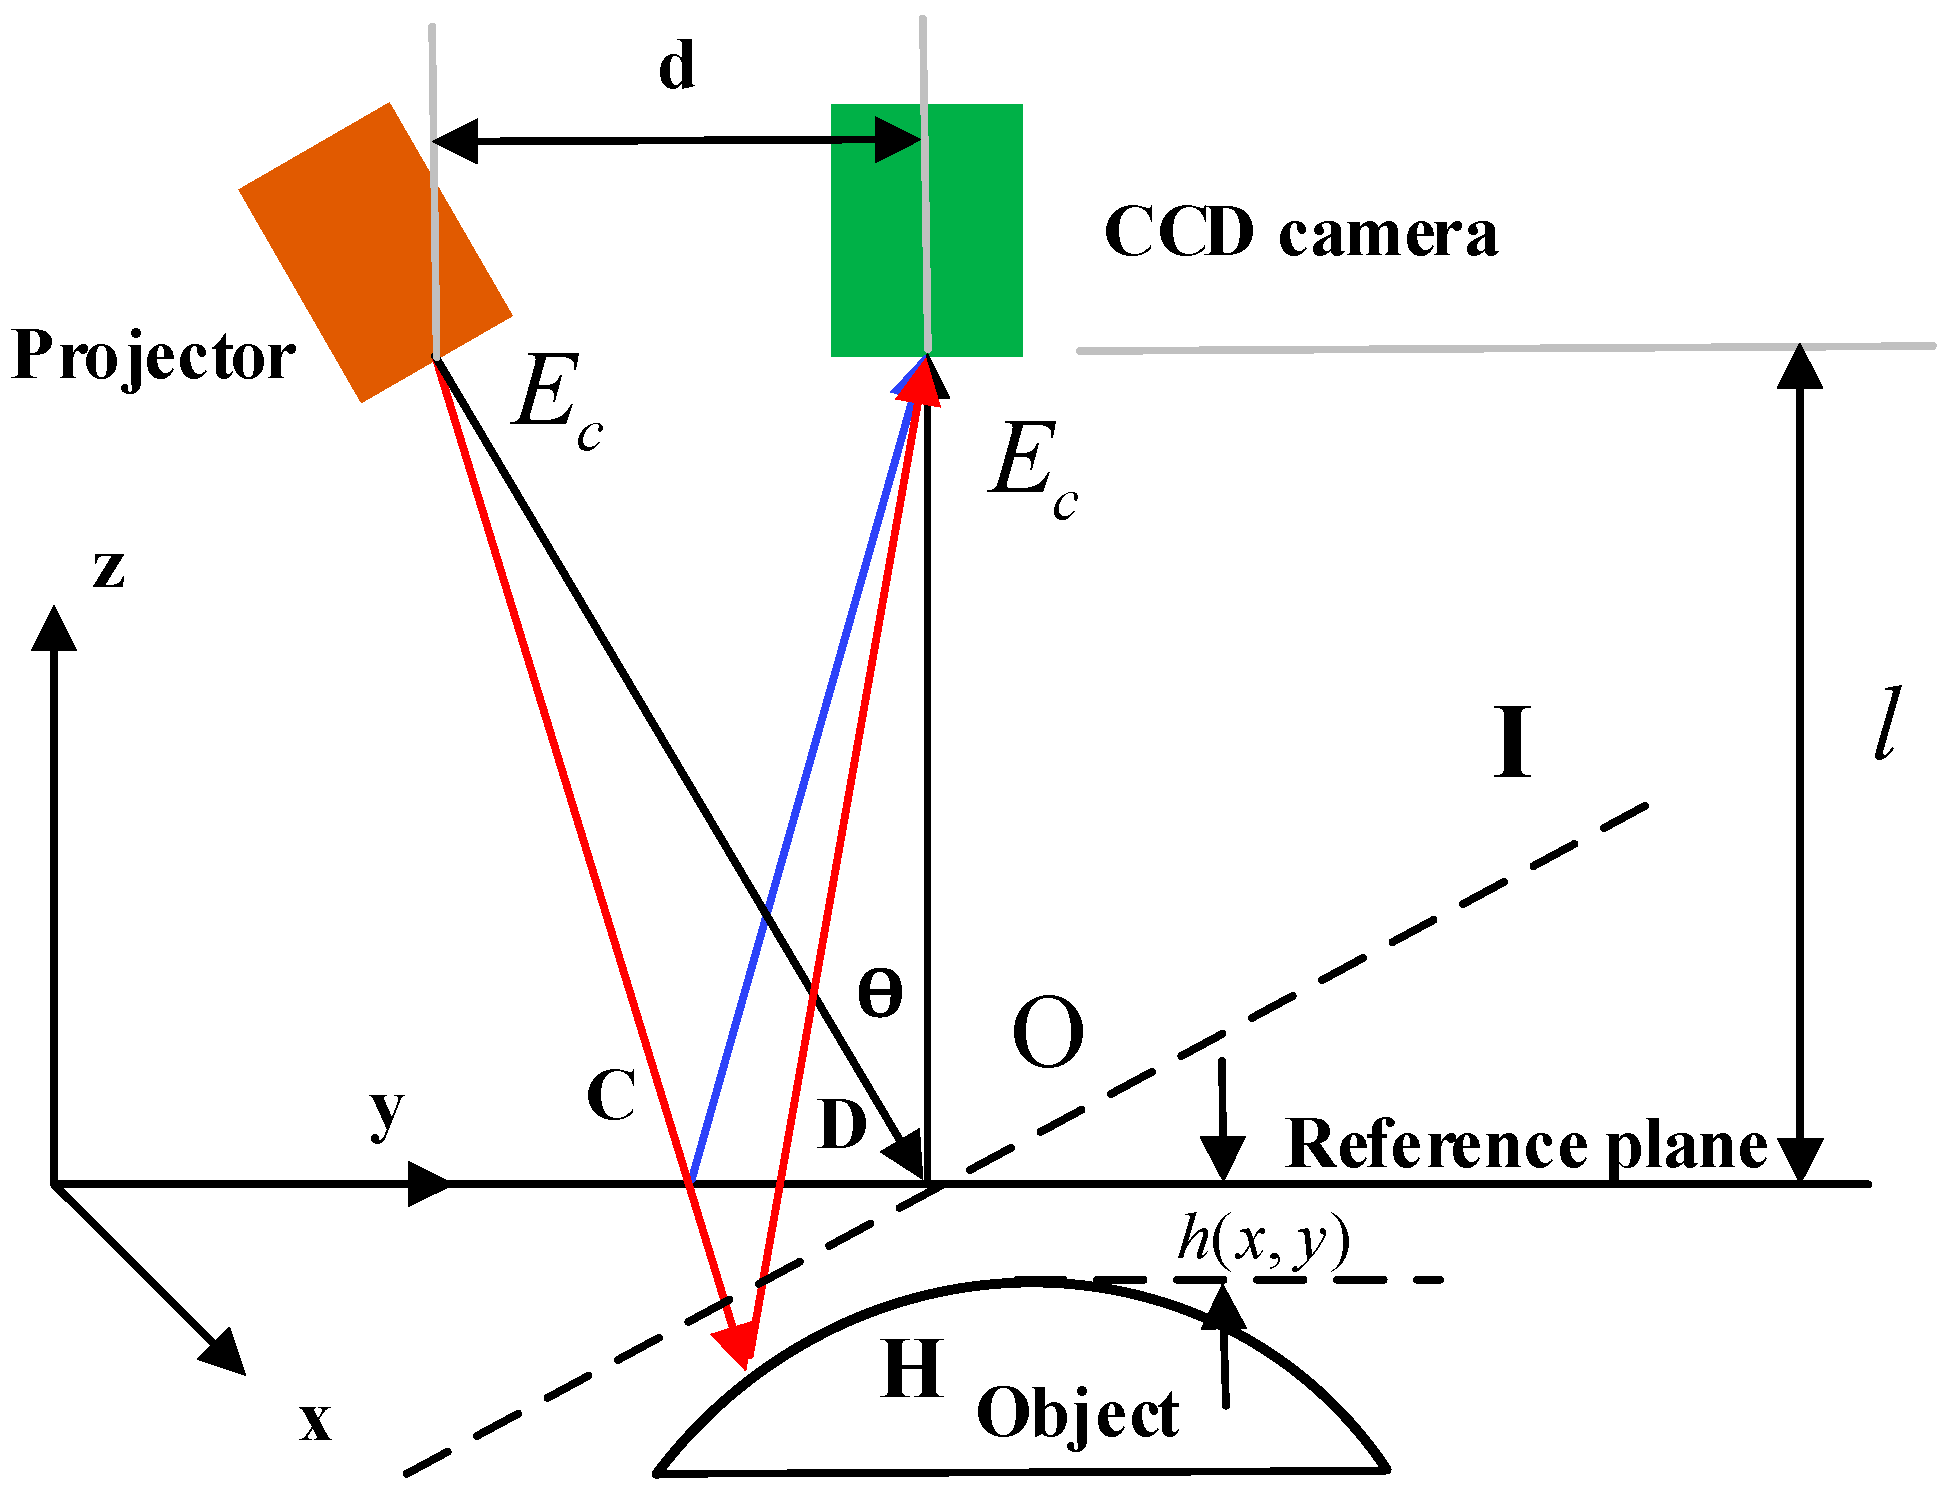
2. Phase-Shifting Concept

2.1. Basic Principle of Frequency Conversion Phase Shifting

Fringe projection for shape measurement has been widely used in 3D scanning modeling, image restoration, and accurate measurements. In actual measurements, the accuracy of the phase results has a great impact on that of the subsequent phase to be worked out. The fact that the accurate calibration of phase-shifting is difficult to accomplish inevitably leads to phase-shifting errors, thus affecting the measurement accuracy.
In frequency conversion phase-shifting, the assumption is that the background light is I 0 ( x , y ) , γ 0 ( x , y ) is the modulation, and the light intensity expression of the t-step phase-shifting is [20]
I t ( x , y ) = I o ( x , y ) { 1 + γ o ( x , y ) cos [ 4 π h ( x , y ) λ t ] }
where λ t = λ 0 + t Δ λ represents the test wavelength value corresponding to the t-step phase-shifting [21], λ 0 is the wavelength-tunable semiconductor laser starting output wavelength (that is, the center wavelength), Δλ is the wavelength phase-shifting step, and (1) can be approximated to the following [22]:
I t ( x , y ) = I o ( x , y ) { 1 + γ o ( x , y ) cos [ 4 π h ( x , y ) λ t 4 π h ( x , y ) λ o 2 × t × Δ λ ] }
φ i j = 4 π h ( x , y ) λ t is the measured phase and δ k = 4 π h ( x , y ) λ 0 2 × t × Δ λ is the amount of phase shifting in step t.
Equation (2) shows that in variable-frequency phase shifting, the phase shifting of the phases in step t is determined by the joint length and the wavelength step. In the measurement, to make the phase-shifting amount a specific value under different cavity lengths, phase calibration must be performed [23]. When the iterative algorithm is used to solve the measured phase, it can be determined by continuous iteration when the phase-shifting amount and phase are unknown, and the phase-shifting amount and the measured phase can be determined at the same time.

2.2. Frequency-Shifted Phase Shifting Extraction Algorithm Based on Selection Sampling

In the phase shift, if the phase shift δ k can be determined, then the K-phase-shifted fringe image can be expressed as [24]
I k ( i , j ) = a ( i , j ) + γ o ( i , j ) cos [ Φ ( i , j ) + δ k ] k = 0 , 1 , 2 k 1 ;
In Equation (3), K is the total number of phase shifts; ( i , j ) is the pixel coordinates; I k ( i , j ) is the intensity distribution of the fringe pattern; a ( i , j ) is the background intensity; γ 0 ( i , j ) indicates the degree of modulation; Φ ( i , j ) is the phase value to be solved; and δ k is the amount of phase shifting per time, where δ 0 = 0 . In Formula (3), I k ( i , j ) is a known quantity, but a ( i , j ) , γ 0 ( i , j ) , and Φ ( i , j ) are unknown quantities [25].
Expanding Equation (3) can take the following form:
I k ( i , j ) = C 0 ( i , j ) + C 1 ( i , j ) + C 0 ( i , j ) cos δ k + C 2 ( i , j ) sin Φ ( i , j )
In this form, C 0 ( i , j ) = a ( i , j ) ;   C 1 ( i , j ) = γ 0 ( i , j ) cos Φ ( i , j ) ; and C 2 ( i , j ) = γ 0 ( i , j ) sin   Φ ( i , j ) . According to the principle of least squares, the residual function is obtained by using Formula (4) [26]:
E k ( i , j ) = I k ( i , j ) [ C 0 ( i , j ) + C 1 ( i , j ) cos δ k + C 2 ( i , j ) sin δ k ]
In the least-squares principle, the vector c ( i , j ) = [ C 0 ( i , j ) , C 1 ( i , j ) , C 2 ( i , j ) ] T for each pixel can be estimated by minimizing the sum of the square E k ( i , j ) . In addition, differentiating k = 0 k 1 [ E k ( i , j ) ] 2 concerning C 0 ( i , j ) , C 1 ( i , j ) and C 2 ( i , j ) , then setting the resulting expression to zero, we can finally obtain the normal equation system:
P c ( i , j ) = q ( i , j )
where
P = [ p 1 p 2 p 3 p 2 p 4 p 5 p 3 p 5 p 6 ] = [ K k = 0 K 1 cos δ k k = 0 K 1 sin δ k k = 0 K 1 cos δ k k = 0 K 1 cos 2 δ k k = 0 K 1 cos δ k sin δ k k = 0 K 1 sin δ k k = 0 K 1 cos δ k sin δ k k = 0 K 1 sin 2 δ k ]
and,
q ( i , j ) = [ q 0 ( i , j ) q 1 ( i , j ) q 2 ( i , j ) ] = [ k = 0 K 1 I k ( i , j ) k = 0 K 1 I k ( i , j ) cos δ k k = 0 K 1 I k ( i , j ) sin δ k ]
The determinant of P is expressed as det P and the reciprocal of P is given by the following:
R = [ r 1 r 2 r 3 r 2 r 4 r 5 r 3 r 5 r 6 ] = P 1 = 1 det P [ p 4 p 6 p 5 2 p 3 p 5 p 2 p 6 p 2 p 5 p 3 p 4 p 3 p 5 p 2 p 6 p 1 p 6 p 3 2 p 2 p 3 p 1 p 5 p 2 p 5 p 3 p 4 p 2 p 3 p 1 p 5 p 1 p 4 p 2 2 ]
Using Equation (9), the vector C ( i , j ) can be directly calculated with
C ( i , j ) = R q ( i , j )
To solve the optimal estimate of C 0 ( i , j ) , C 1 ( i , j ) , and C 2 ( i , j ) , we need to obtain the square sum of Equation (10) and take the minimum value. Further acquisition of the phase value to be measured is given by [27]
Φ ( i , j ) = arctan C 2 ( i , j ) C 1 ( i , j )
where C 1 ( i , j ) = b ( i , j ) cos ϕ ( i , j ) and, removing the case, C 1 ( i , j ) is equal to zero.
The true phase-shifting amount during phase-shifting can be expressed as the nominal phase-shifting plus the phase-shifting error value. The first iteration can make the initial phase-shifting error zero [28].
δ k = δ k + ε k
The real fringe image intensity distribution is as follows:
I k ( i , j ) = C 0 ( i , j ) + C 1 ( i , j ) cos ( δ k + ε k ) + C 2 ( i , j ) sin ( δ k + ε k )
According to the above algorithm, a new C ( i , j ) = [ C 0 ( i , j ) , C 1 ( i , j ) , C 2 ( i , j ) ] T can be obtained. Substituting the phase-shifting amount and the phase-shifting error into the formula, the residual function is as follows:
E k ( i , j ) = I k ( i , j ) [ C 0 ( i , j ) + C 1 ( i , j ) × cos δ k + C 2 ( i , j ) × sin δ k ]
The phase-shifting error value in the formula is an unknown quantity [29]. Similarly, the phase-shifting error value can be solved by the least-squares method. A partial derivative is obtained for each phase-shifting error amount ε k , and the result is zero. The phase-shifting error value ε k can be obtained by solving the equation. At this time, the phase-shifting amount δ k = δ k + ε k is updated to perform the next iteration operation. The threshold condition T is set according to the phase-shifting error value ε k , and the iteration is terminated when the ε k change amount is less than T. At this point, an accurate phase-shifting amount can be obtained [30].

3. Experiment Based on Selective Sampling

This paper uses four fringe patterns with a pixel resolution of 450 pix × 450 pix. The contrast of a region in the fringe image is reduced, the low reflectance sample region in the actual measurement is simulated, and noise with a density of 0.002 and Gaussian noise with a standard deviation of 15 are added to the entire image to simulate the fringe image noise.
If a sinusoidal fringe pattern is projected onto the surface of the object and light is reflected at a point on the surface of the object, the captured fringe pattern I n ( x , y ) can be expressed as
I n ( x , y ) = I b ( x , y ) + I m ( x , y ) cos [ ϕ ( x , y ) + ( n 1 ) π 2 ] n = 1 , 2 , 3 , 4
where I b ( x , y ) is the background intensity, I m ( x , y ) is the fringe modulation, and ϕ ( x , y ) is the phase value at coordinates ( x , y ) . I b ( x , y ) , I m ( x , y ) , and ϕ ( x , y ) are three unknown variables in Equation (15). The fringe diagram is shown in Figure 1.
To obtain the phase distribution of the deformed image, by solving the four equations of the four fringe images, the phase distribution of the reference model can be calculated as
ϕ 0 ( x , y ) = tan 1 ( I 03 ( x , y ) I 01 ( x , y ) I 00 ( x , y ) I 02 ( x , y ) )
The true values of the phase shifting between the simulated fringe images are [0°, 101°, 191°, 301°]. [0°, 100°, 195°, 300°] was calculated as the initial phase-shifting amount. The root mean square error (RMSE) between the result and the true phase-shifting value is used as a criterion for determining the iterative error value.
R M S E = i = 1 4 ( X o b j , i X t r u e , i ) 2 4
The original image is first sampled at every d pixel point. Then, the sampled points are brought into the iterative algorithm, the four-step phase-shifting algorithm, and the improved algorithm for iterative calculation [11]. The images after equal interval sampling are filtered out at low-quality points, and a reasonable threshold T is selected to divide the four fringe images. In the fringe image, the point where the maximum value of the gray value of the pixel at the same position is smaller than the threshold T is filtered, and the pixel whose image value is always low in the image [31]. The threshold T = 80 is determined according to the pixel value of the dark fringe. At this time, the filtering ratio is 20%, indicating that most of the sampling pixels still participate in the iterative operation after filtering, and the relationship between the sampling interval and the running time and the sampling interval and the error value is shown in Figure 2.
It can be seen from the experimental results that the iteration time of the equally spaced samples of the three algorithms is gradually reduced as the sampling interval increases, whereas the iteration time spent by the improved algorithm during the same sampling interval is the shortest. At the same time, the error values of the iterative algorithm and the four-step phase-shift algorithm vary greatly with the sampling interval, and the error value is also large, while the variation of the error value of the improved algorithm is relatively stable and the error value is small. Comprehensively, the improved algorithm can effectively reduce the time of iterative calculation and can maintain the accuracy of an algorithm to a high degree.

4. Experimental Methods

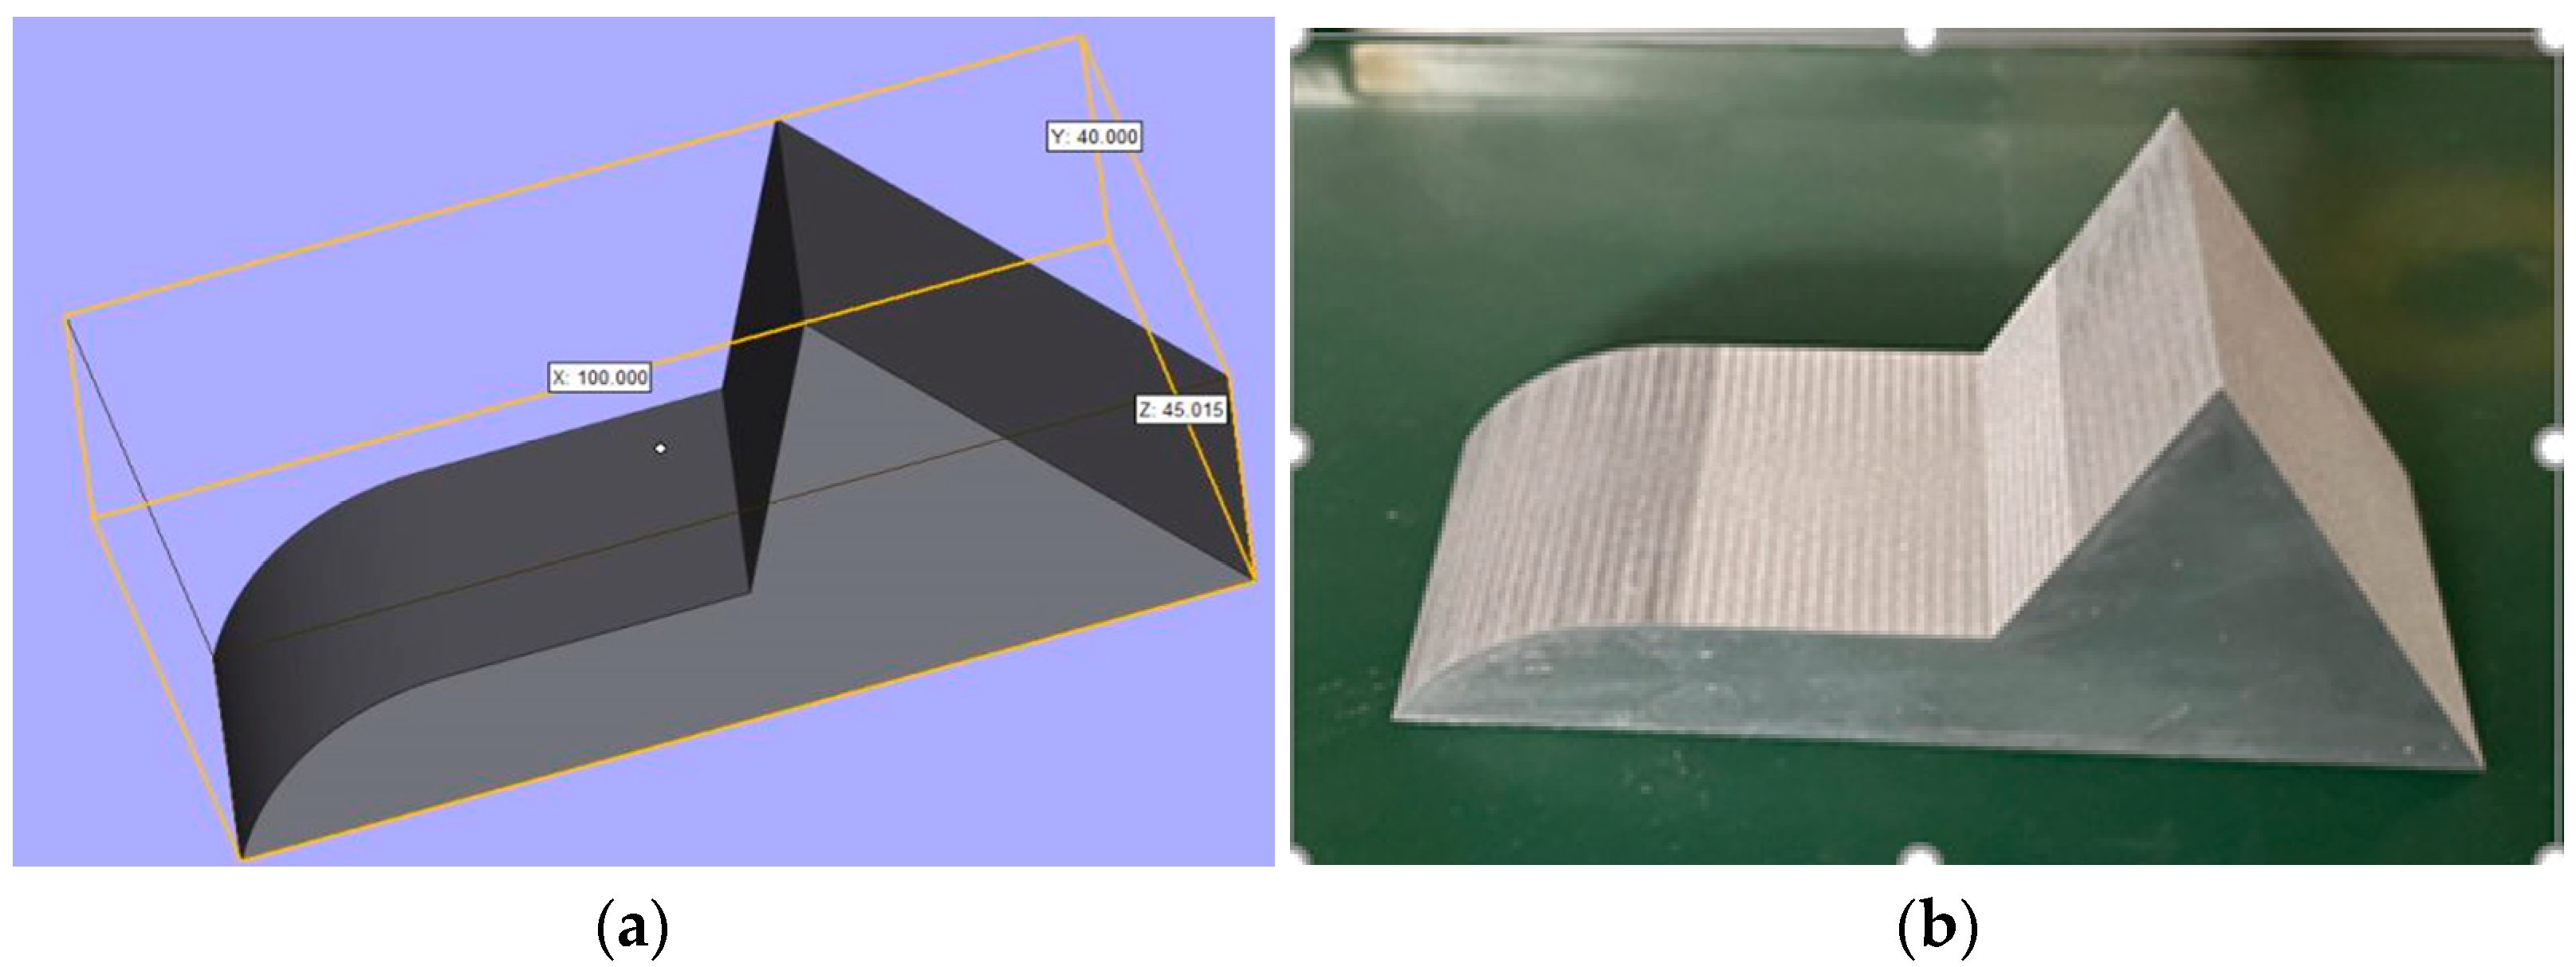
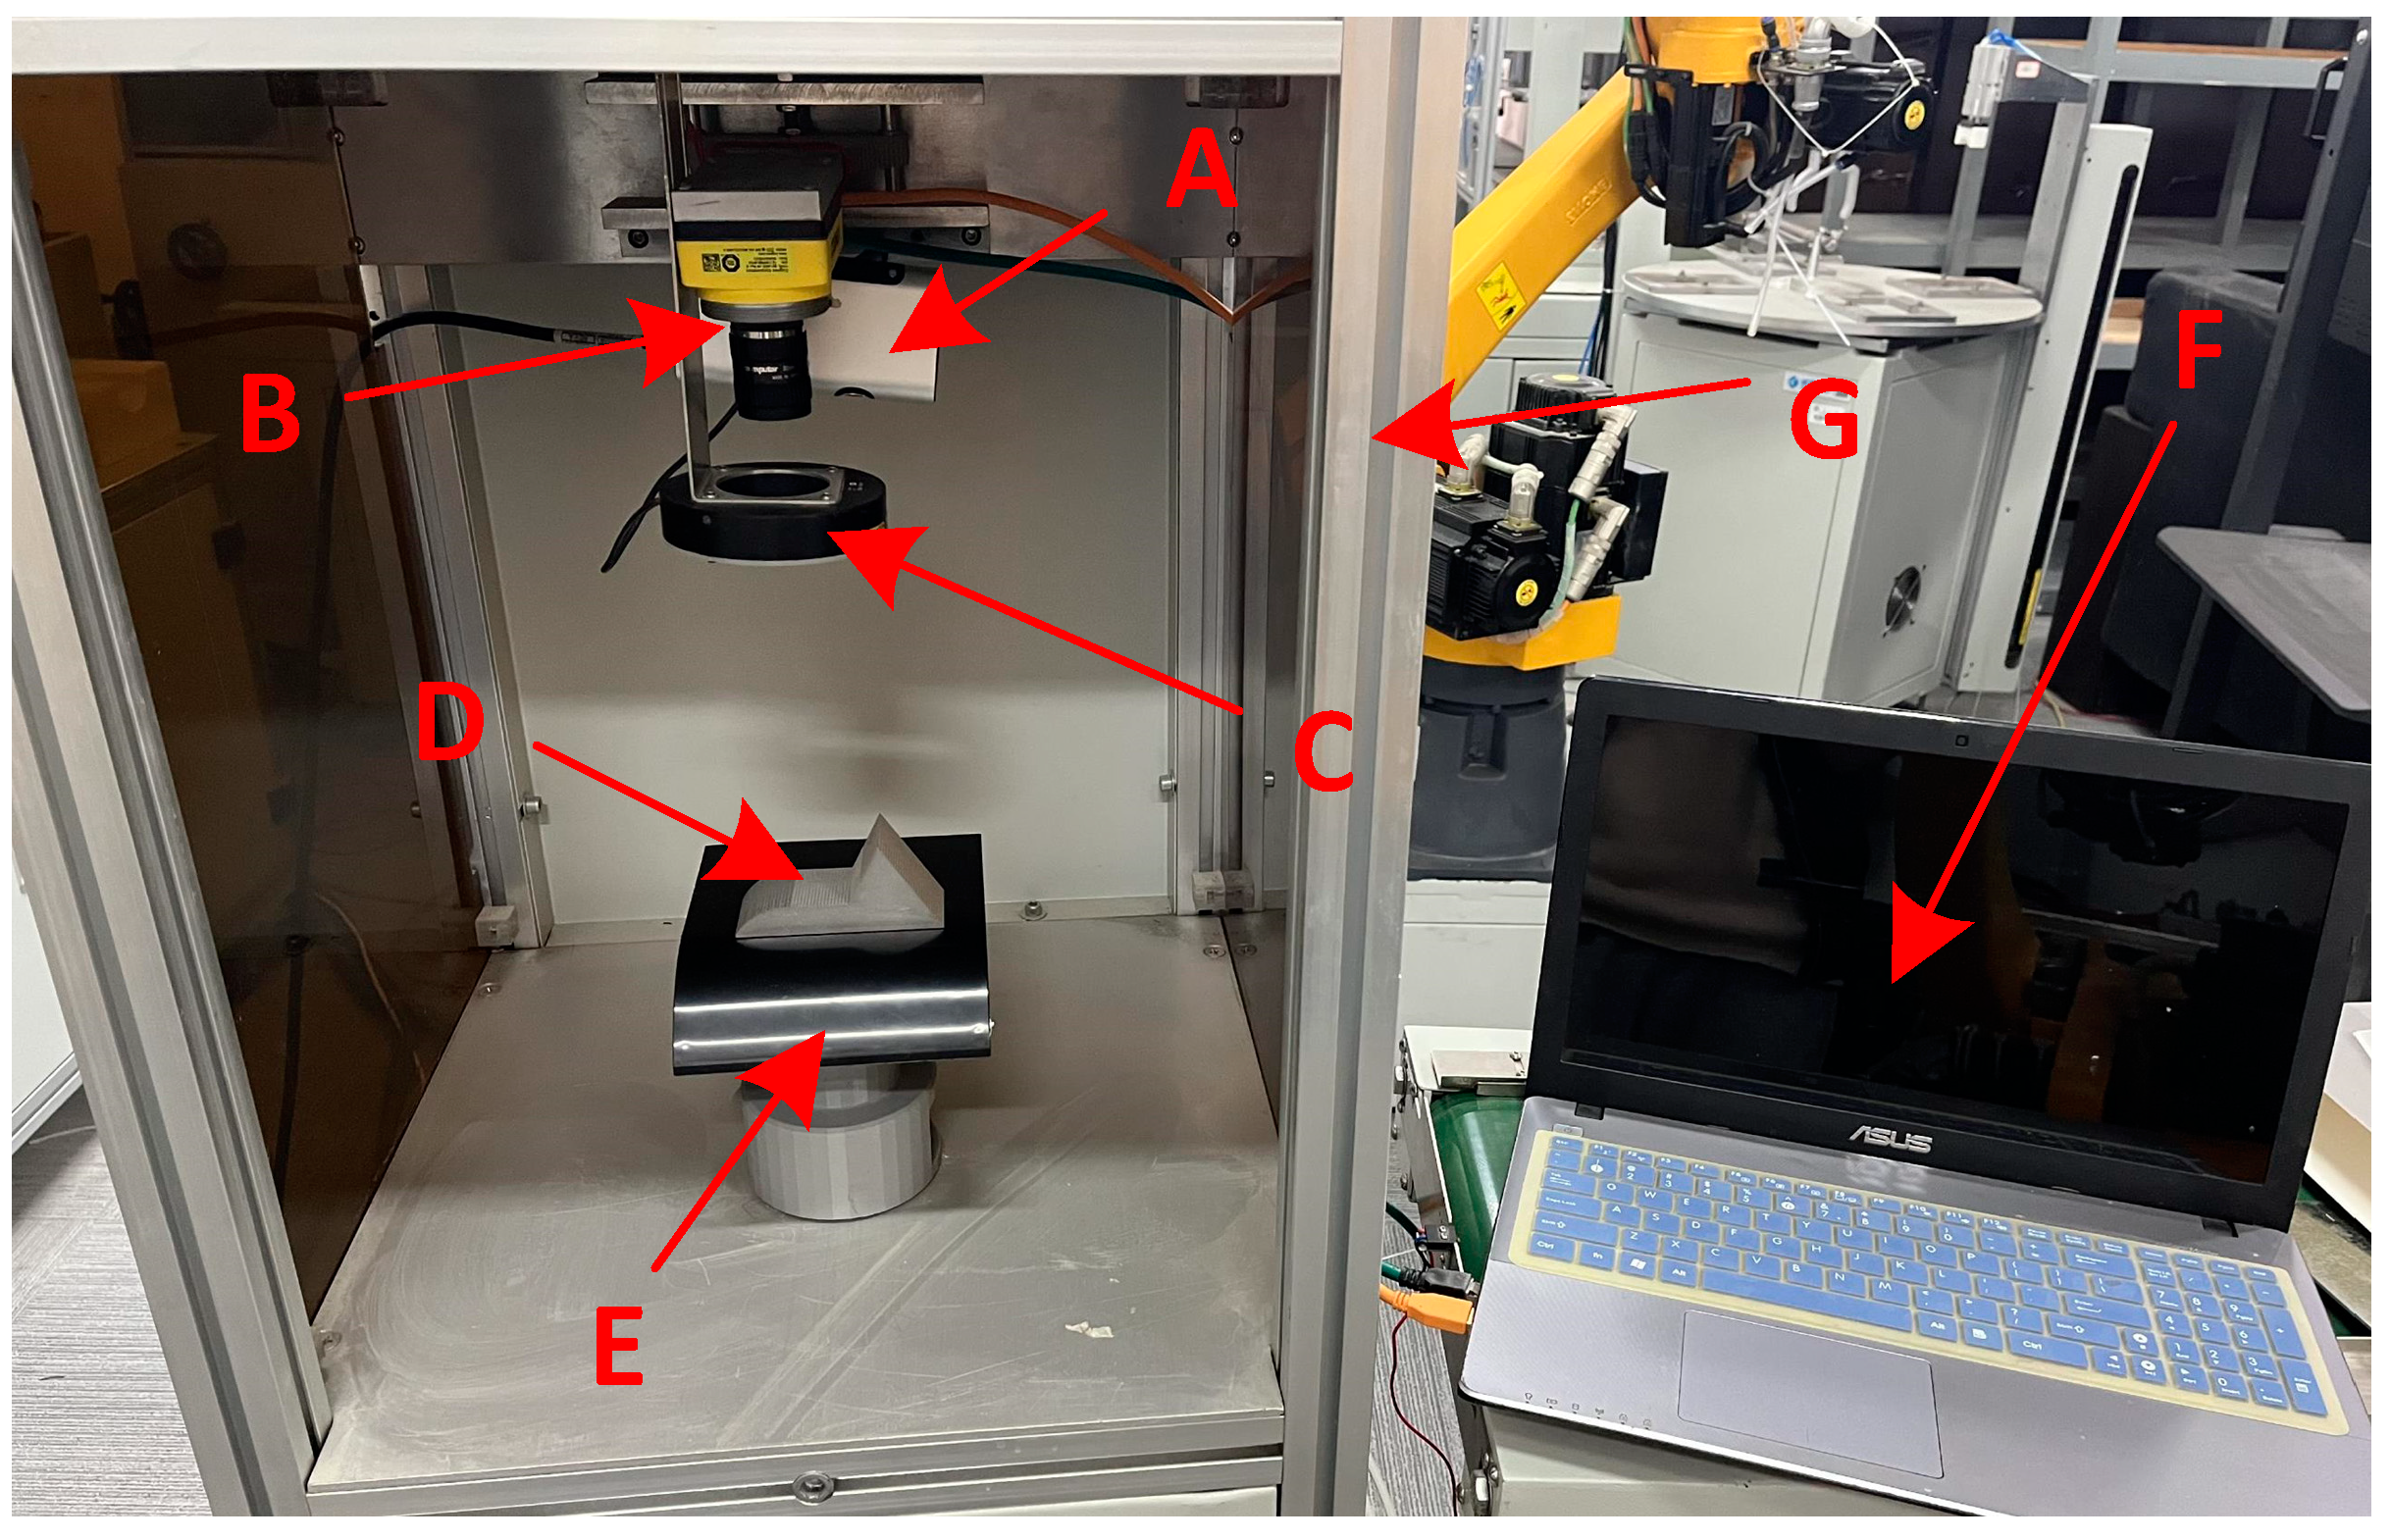
4.1. Measured Part and Experimental Setup for Fringe Projection

The measured surface shape of the experiment uses a complex measured surface whose front end is a stepped surface with a smooth curved back end; the dimensions of the mechanical parts and the 3D model are shown in Figure 3. Due to the special use of the measured object, the surface of the measured object seems to have a roughness composed of linear stripes in the manufacturing process, but the surface of the object is smooth. These linear striations will be excluded during the measurement and will not affect the measurement. The measurement results in Section 5 are caused by the accuracy of the algorithm, and there is also a very small influence caused by the noise of the step surface, which cannot be ruled out.
In this way, we compare the variable frequency phase-shifting extraction algorithm based on selective sampling with other algorithms. To see whether it is more accurate when measuring the step surface, the experiment includes the following steps:
(1)
The phase-shifted fringe image with different phase shifts is obtained from the measured surface, and both have a random error with a mean of 0 and a variance of 0.01.
(2)
Solving the measured phase by using an iterative algorithm, a four-step phase-shift algorithm, and a variable frequency phase-shifting extraction algorithm based on selective sampling.
(3)
The package phase was unwrapped to obtain the measured surface for experimental analysis.
The optical geometry of the phase measuring techniques is shown in Figure 4. There is a virtual plane I that is perpendicular to the optical axis of the projector and is the exit pupil of the projector lens and the entrance pupil of the camera lens, respectively. E p and E c are the light exit of the projector and the light entrance of the CCD camera, respectively. They are all on the same plane, and d represents the distance between E p and E c , while l is the height of the camera and CCD from the reference plane and θ is the angle between E p and E c . The projector projects the sinusoidal pattern onto the reference plane and the object surface, and the reflected information is captured by the camera and further processed.
Due to the height of the object, the stripe pattern on the object will be distorted compared to the stripe pattern on the reference plane. The height information can be retrieved from the phase difference between the object and the reference plane. The height h ( x , y ) of the object at a point ( x , y ) is geometrically related to the object phase. With the use of similar triangles Δ E p H E c and Δ C H D , h ( x , y ) is shown below.
h ( x , y ) = l Δ Φ ( x , y ) Δ Φ ( x , y ) 2 π f 0 d
If the fringe period of the projected pattern is a constant, the equation can be simplified as below.
h ( x , y ) = k Δ Φ ( x , y )
where k is the phase-to-height conversion factor.
The experimental device for the measurement system we used is shown in Figure 5. The system consists of a projector, an area array camera, a lens, a moving displacement platform, and a computer. The image resolution of the camera is 768 × 576 pixels, and the actual size of the object corresponding to the width of the captured image is 100 mm. A multiline laser projector is used to generate sinusoidal fringe patterns. By adjusting the distance between the lens and the projector, the scattered light field projected by the projector is projected through the lens and projected onto the object to be tested in parallel, and the projection angle of incidence is 30° [32]. The CCD camera is used to take a picture above the reference plane to obtain the surface contour of the object. Information and sync are connected to the side of the PC [33].
In the experiment, to adapt to the shape of the measured object, the projector was placed in the irradiation direction of 30° above the side of the measured object, as shown in Figure 5. The experiment uses a ring light source to provide different illumination angles and is conducted in a professional detection box, which can better highlight the three-dimensional information of the object, avoiding shadows on high slopes or reducing measurement sensitivity.

4.2. Measurement System Calibration

The calibration process of the system during the experiment is shown in Figure 6.
The steps of the experimental calibration are as follows:
i.
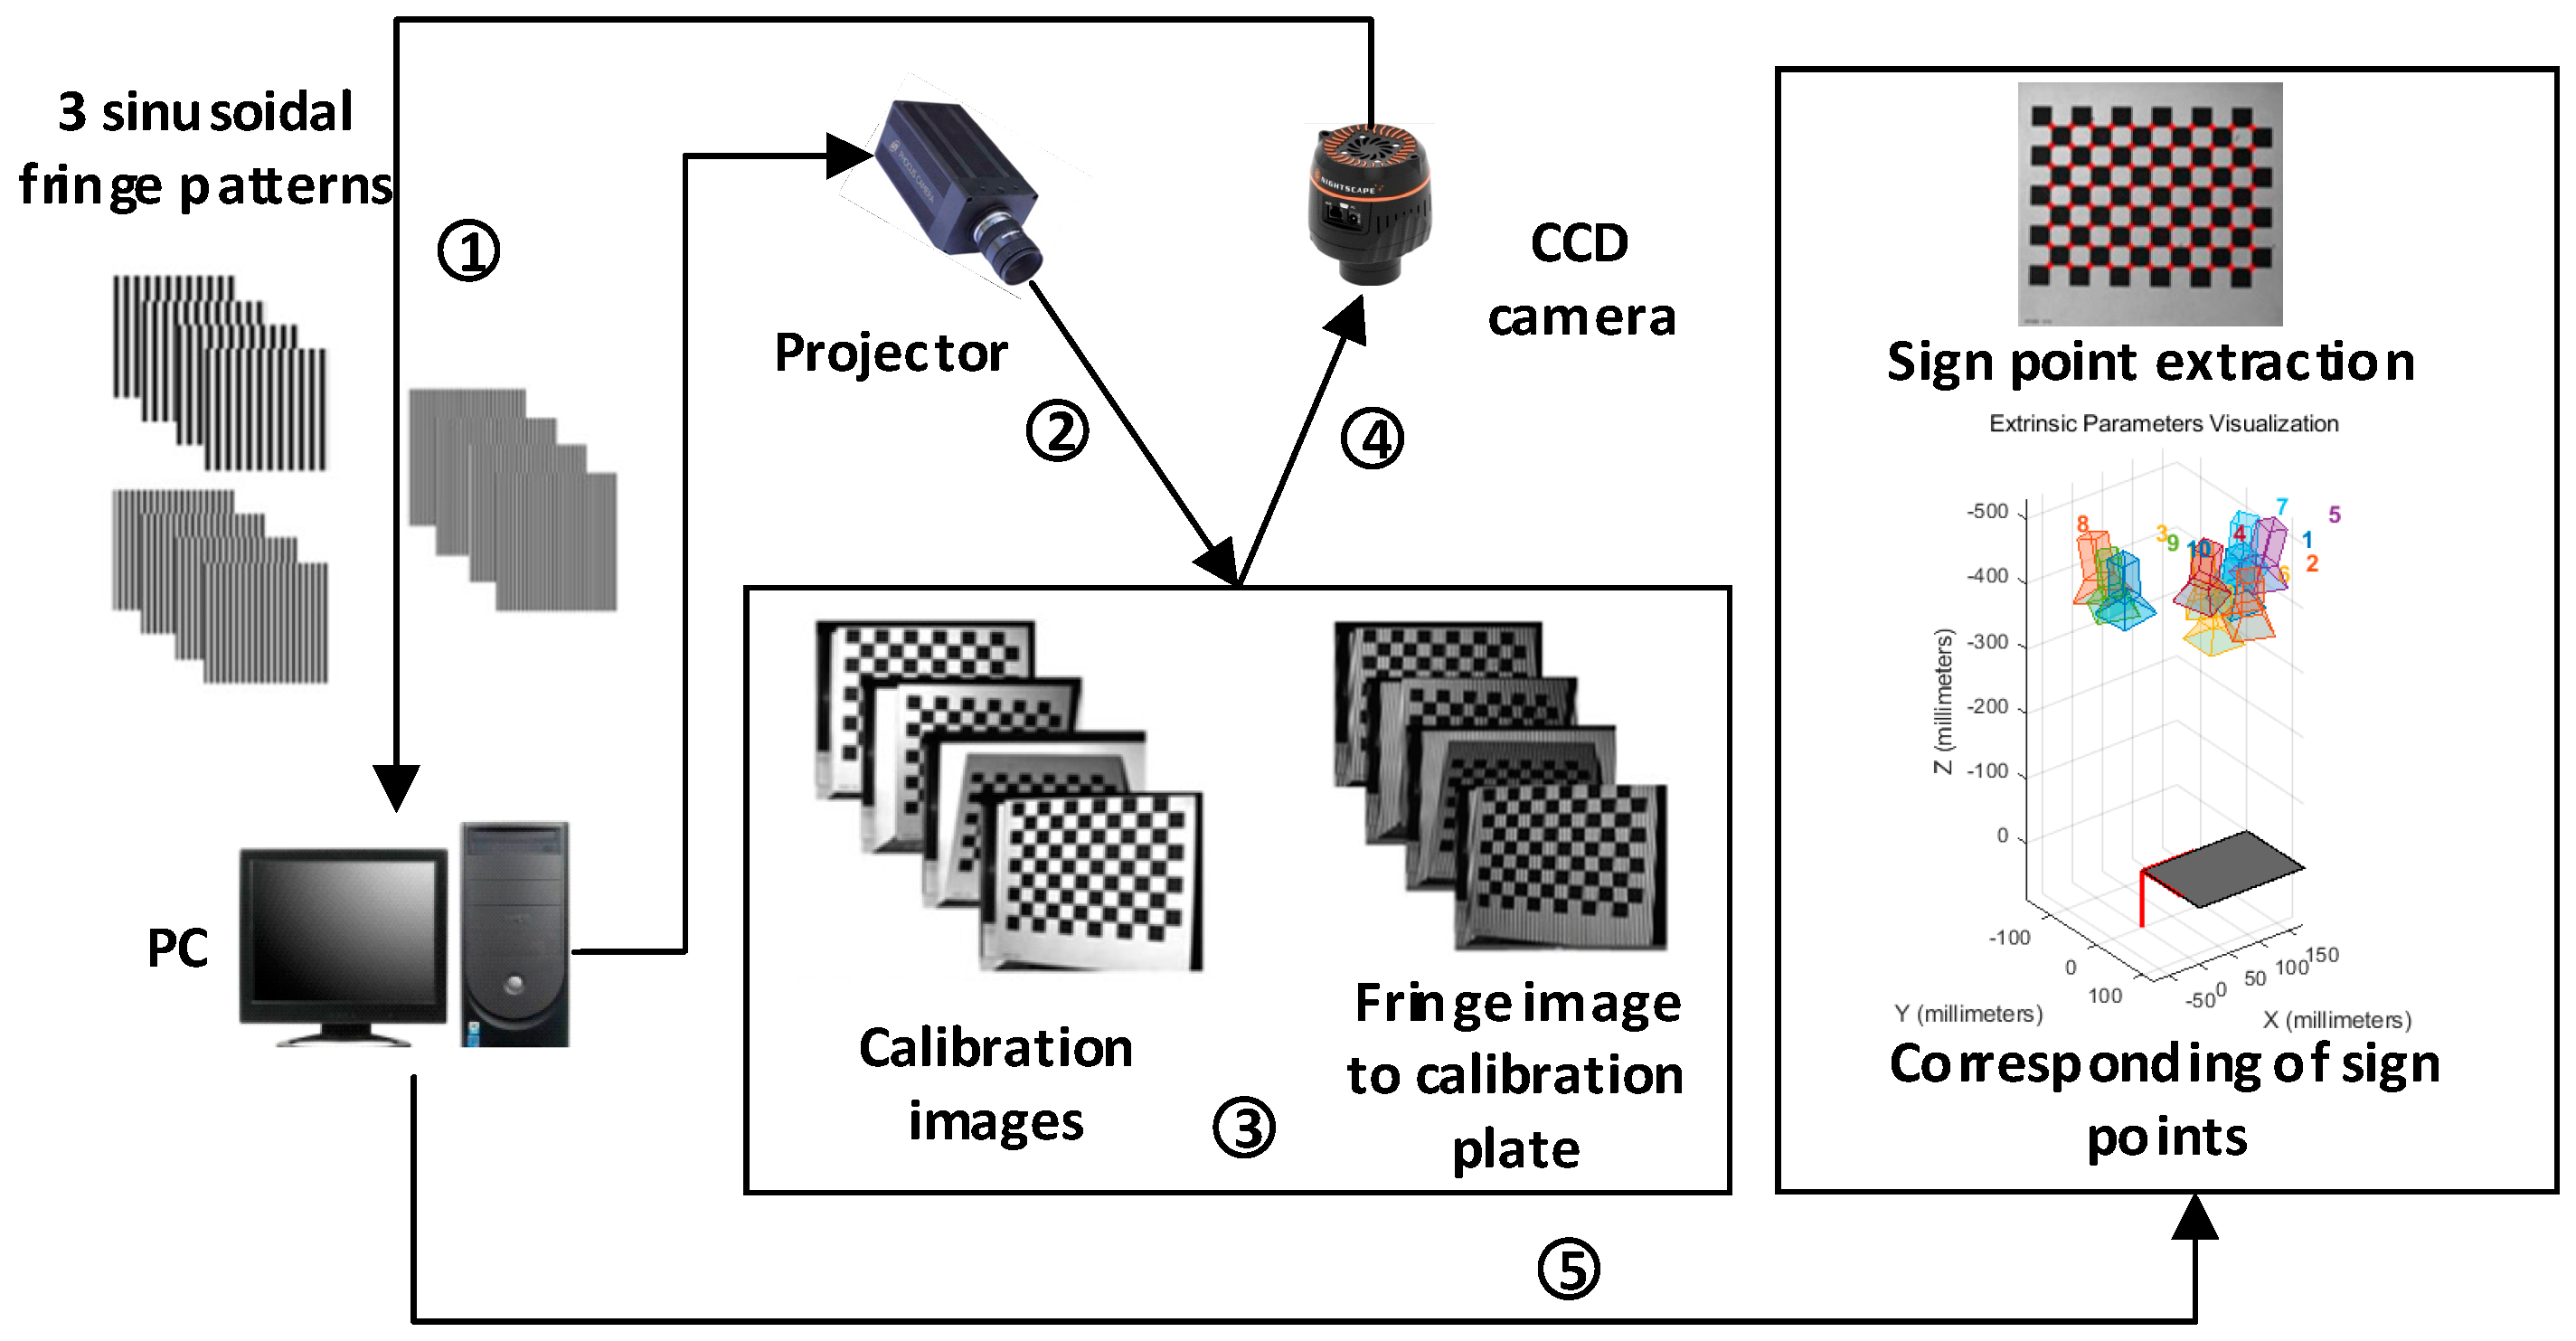
This experiment uses a multifrequency heterodyne method [34] for system calibration. Three types of sinusoidal fringe input projectors with fringe frequencies meeting the requirements of multifrequency heterodynes are designed by the PC, and the sinusoidal fringe frequencies are 1/70, 1/64, and 1/59. The phase-shifting method is four-step phase-shifting, and a total of 12 sinusoidal fringe patterns are used, as shown in ① in Figure 6.
ii.
Before the experiment, the stripe pattern is loaded into the projector. The calibration plate is placed within the field of view of the camera and the projector, the position of the calibration plate remains unchanged, and the image of the calibration plate and the striped image after continuously projecting 12 stripe patterns is taken, as shown in ② in Figure 6.
iii.
The position of the calibration plate and repeat step is changed (2) until enough calibration images are obtained, as shown in ③ and ④ in Figure 6. At least three groups of data are needed to complete the calibration process. Generally, 10–20 groups of calibration patterns can achieve a high calibration accuracy and meet the calibration requirements. To obtain more accurate experimental results, 18 groups of calibration images are used for calibration in this paper.
iv.
The collected images are input into the computer, the image processing operations such as filtering and denoising are performed, the checkerboard calibration board feature points are extracted from the image at each position [35], the phase value is extracted from the feature points, as shown in ⑤ in Figure 6, and the 3D image corresponding to the feature points is extracted after the camera coordinates and other operations are calibrated. According to the camera calibration results, the depth coordinate z corresponding to each feature point is obtained, and the camera calibration adopts the calibration method proposed by Liu [36].
v.
Obtain the pixel coordinates ( u , v ) , the absolute phase value ϕ , and the depth coordinate z . Perform least-squares nonlinear parameter fitting, obtain the required parameters for system calibration, and complete the system calibration.

5. Experimental Results

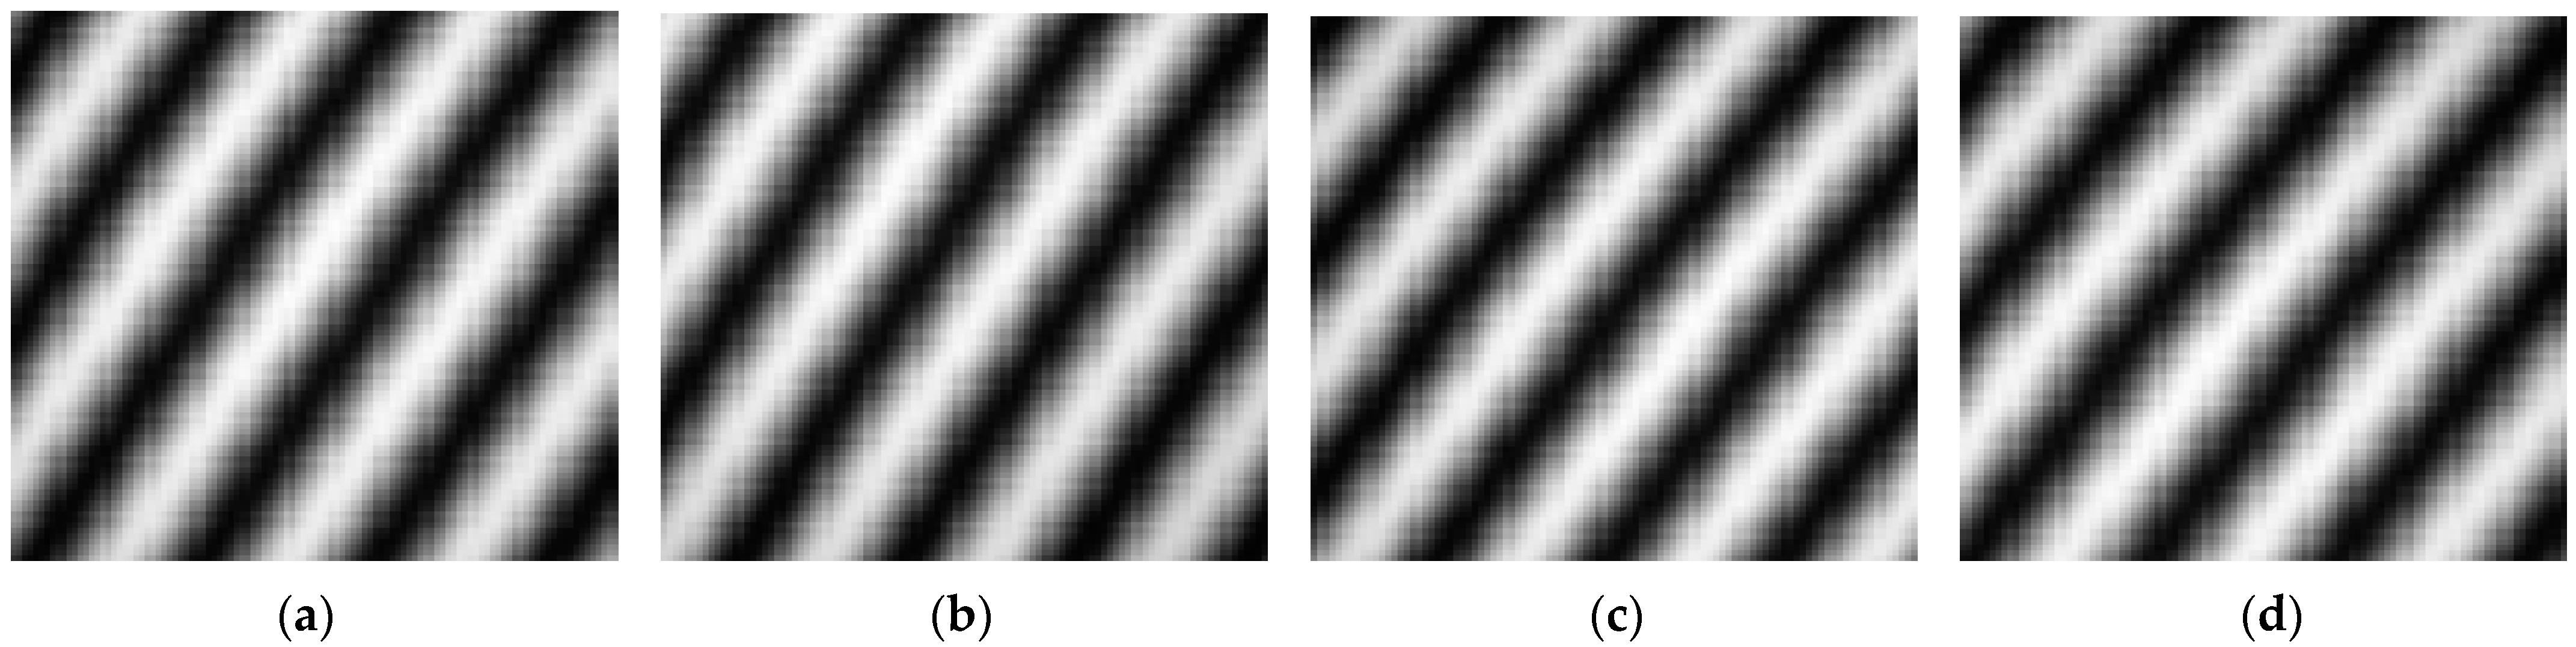
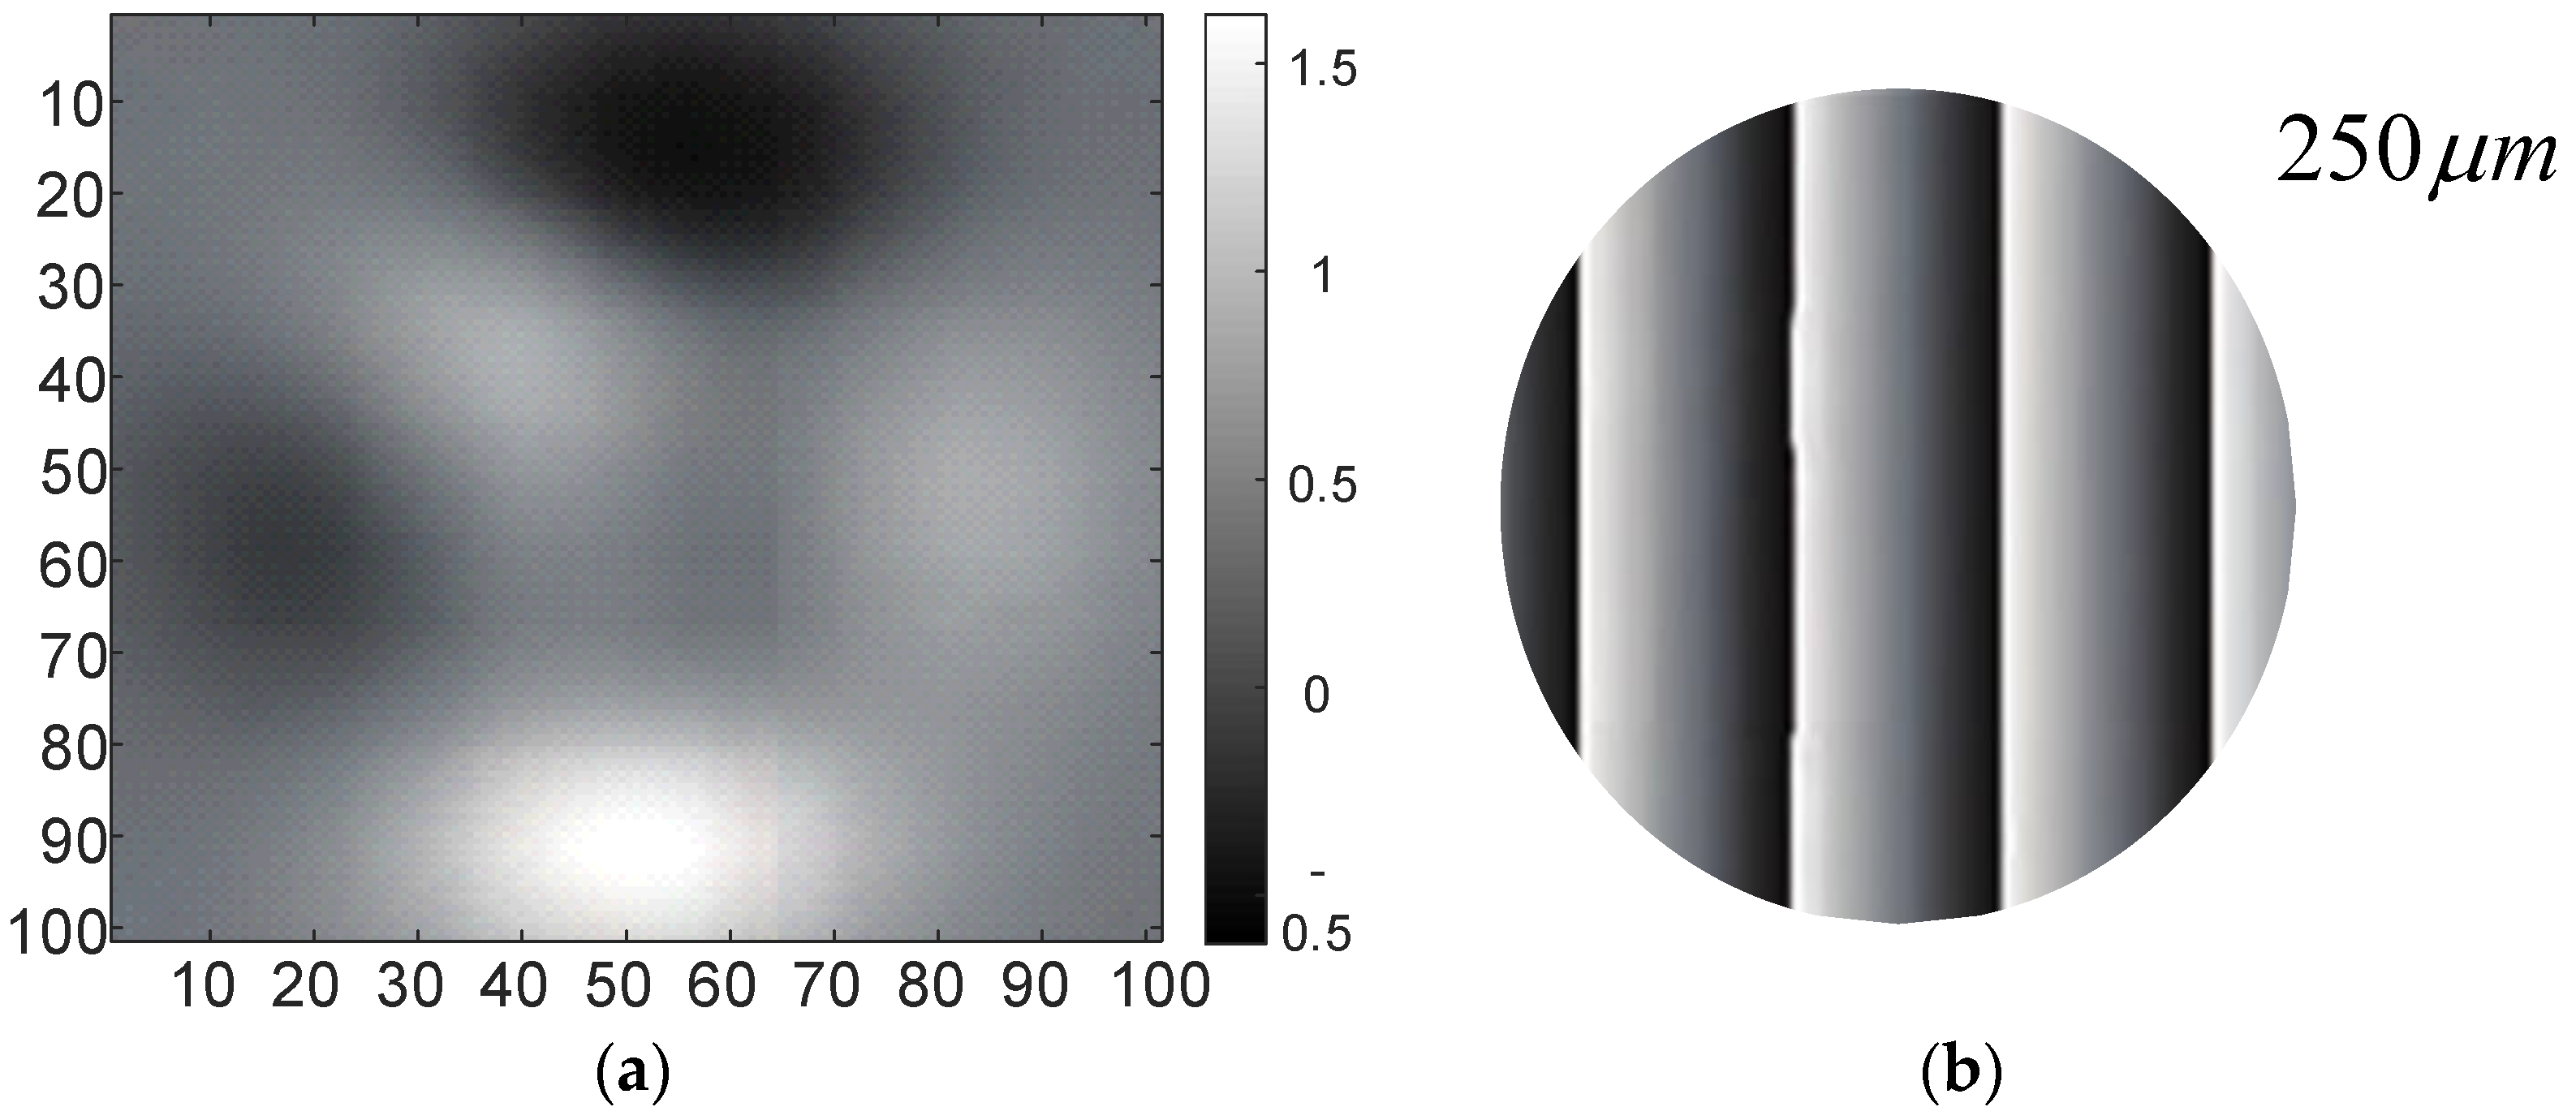
5.1. Fringe Pattern with an Arbitrary Value of Phase Shifting

Let the phase-shifting step be an arbitrary value. The phase-shifting amount and the theoretical phase-shifting amount obtained by the above iterative method are shown in Table 1, and the number of iterations is 65.
From the above results, the simulated wavefront diagram of Figure 7a and the phase diagram of the envelope of Figure 7b are obtained. The phase-shifting magnitude obtained by the iterative method is compared with the theoretical phase-shifting magnitude, and the error is 10 5 . The order of magnitude indicates that the iterative algorithm is used to solve the phase-shifting problem with a high precision, which can reduce the measurement error introduced by the step error during the fringe image [37].

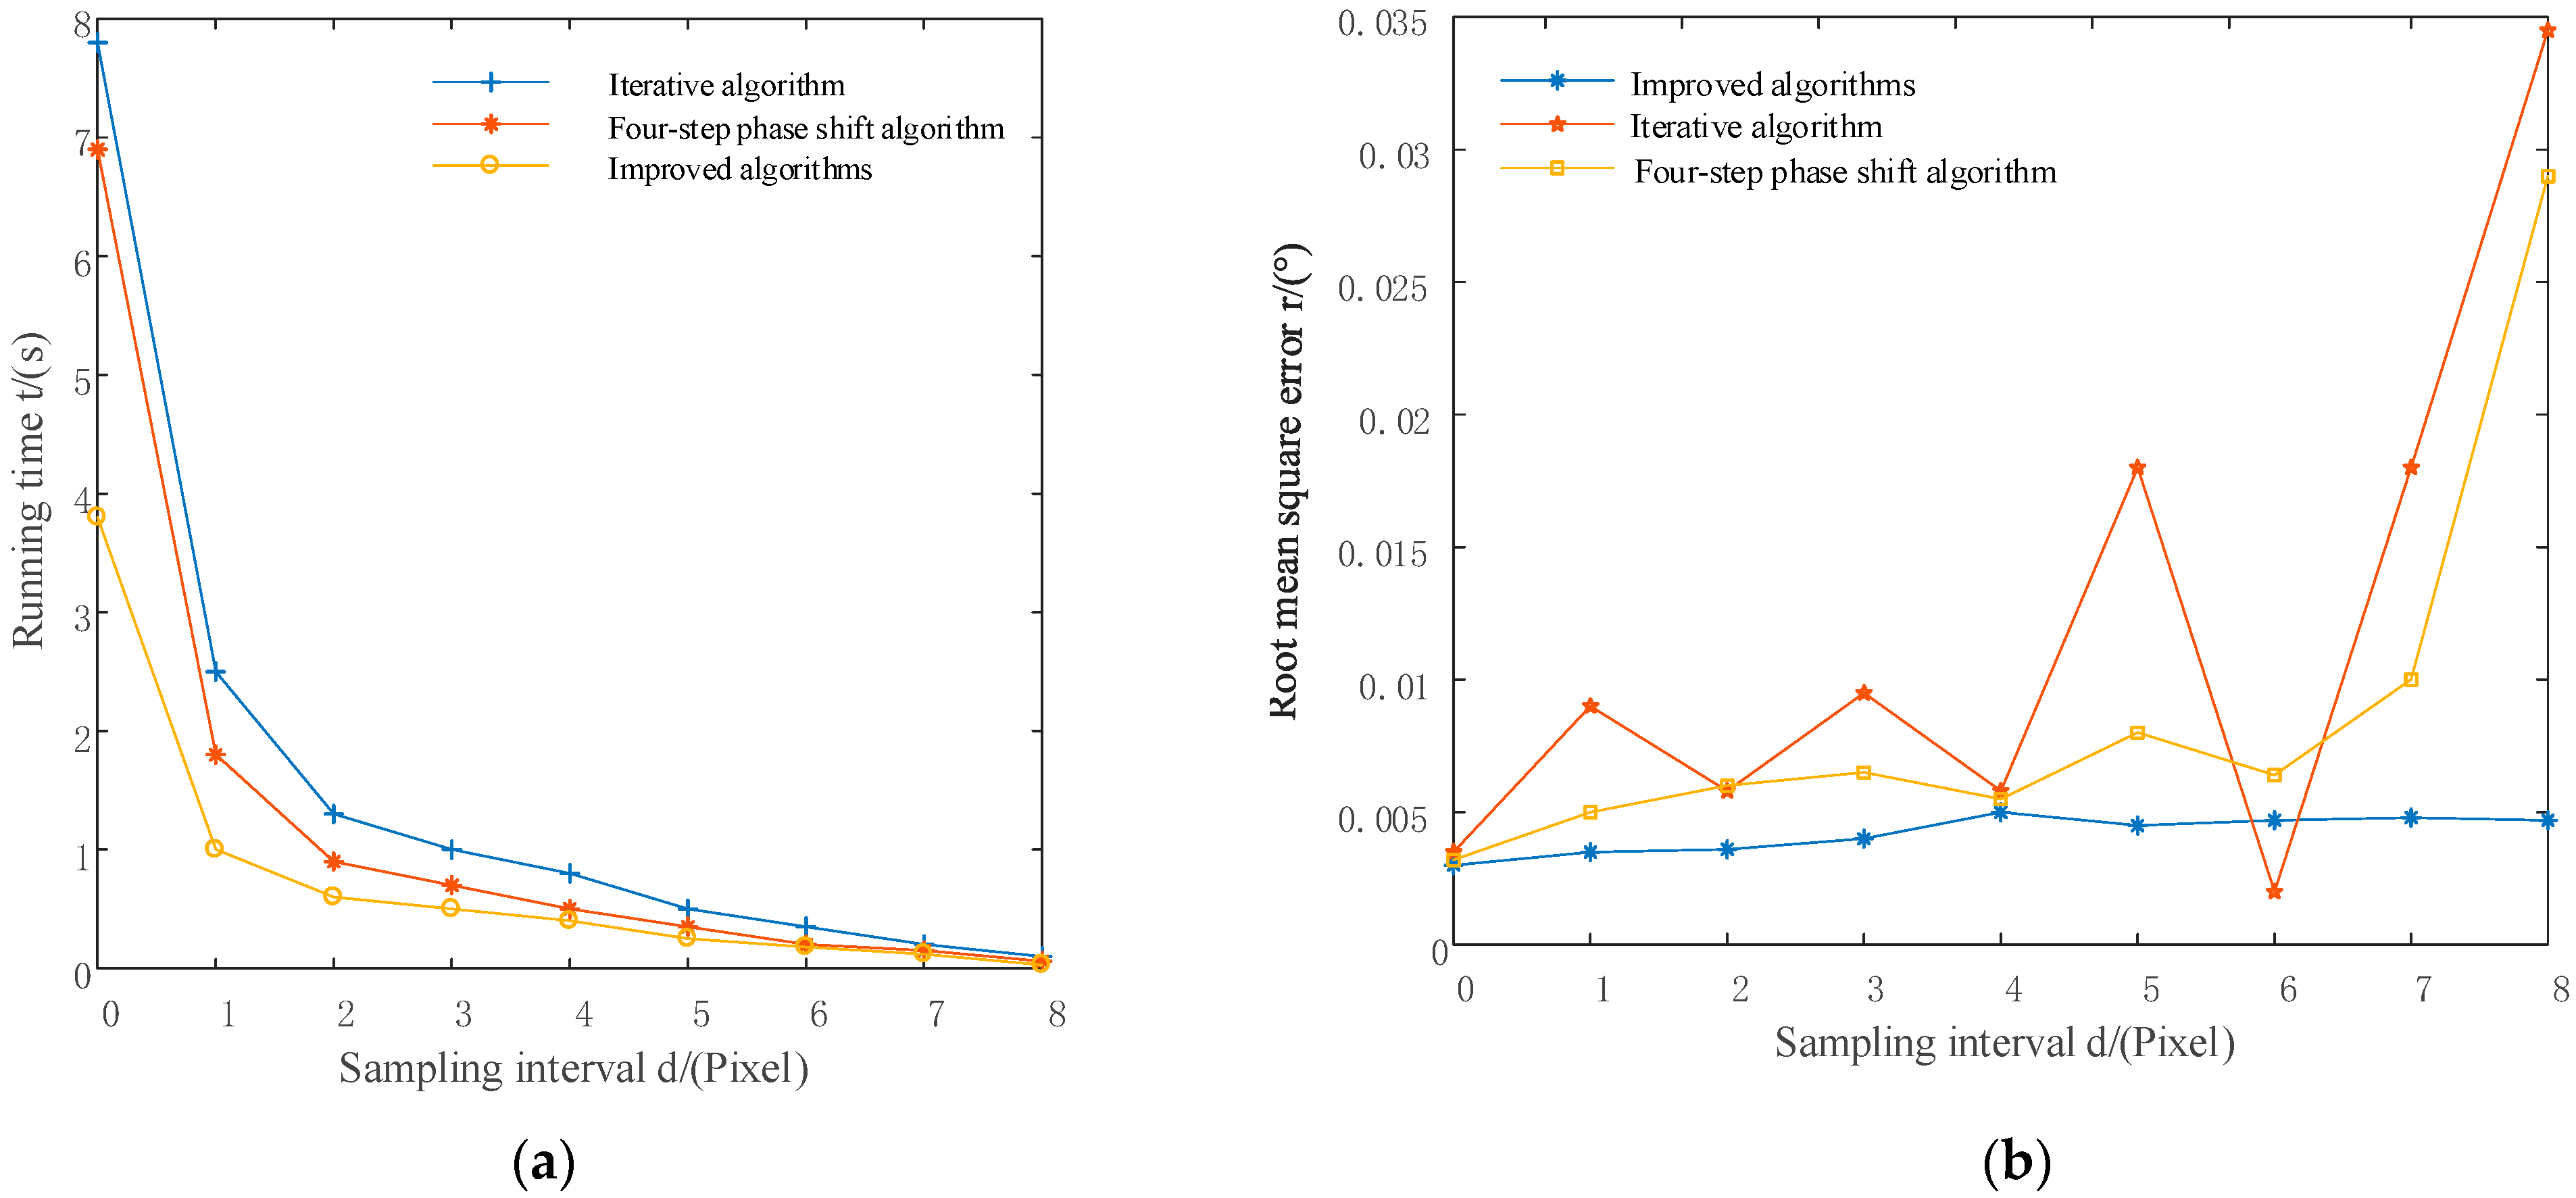
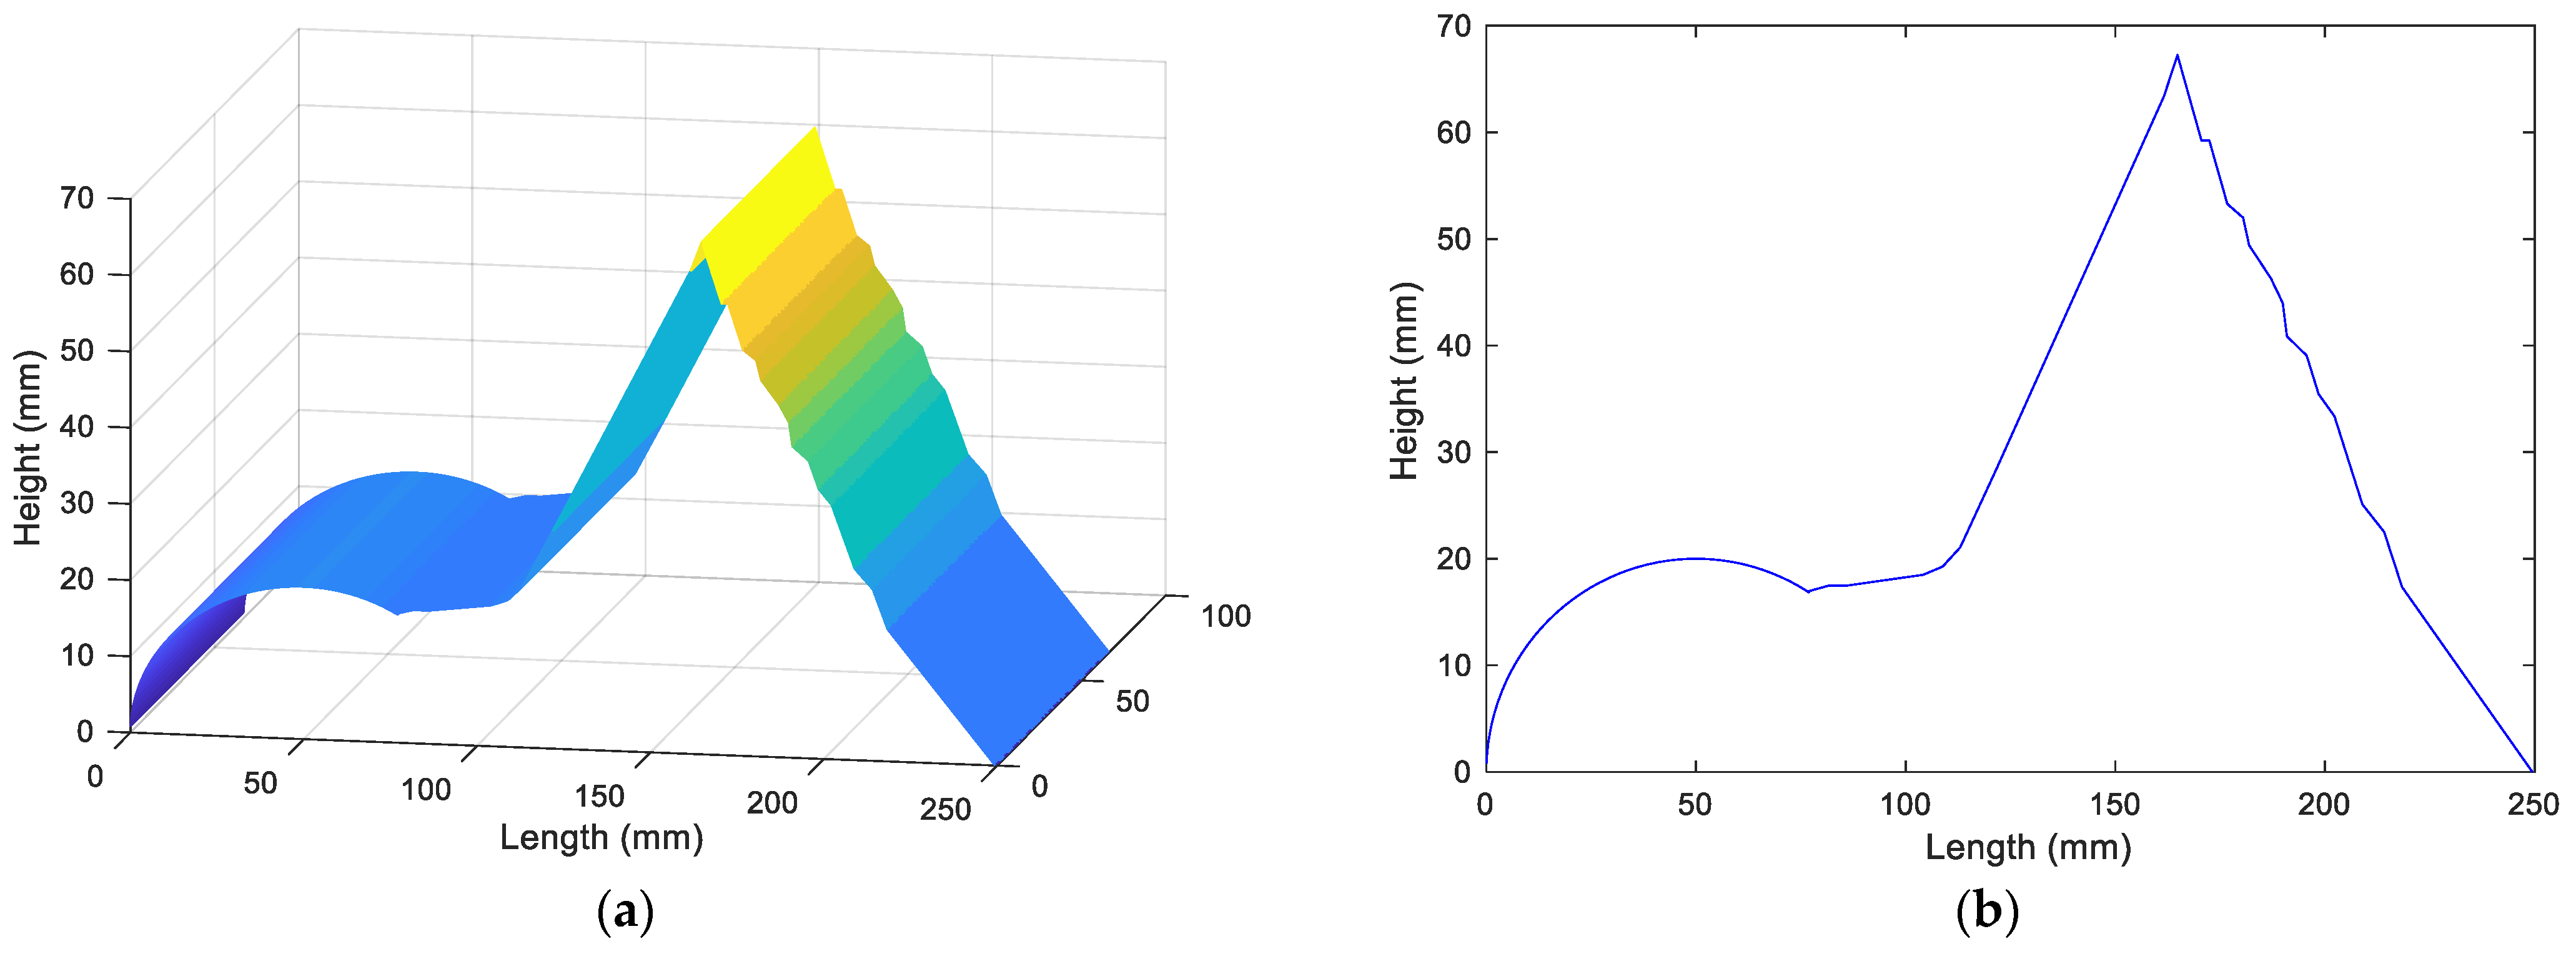
5.2. Iterative Algorithm with a Phase-Shifting of π/2

An iterative algorithm is used to solve the measured surface, and the actual and theoretical phase shifting are shown in Table 2. The number of iterations is 37.
The shape of the surface to be measured obtained after unwrapping and fitting is shown in Figure 8a,b as the surface cross-section of the surface to be measured.

5.3. Four-Step Phase-Shifting Algorithm with a Phase-Shifting of π/2

Using a four-step phase-shift algorithm (four steps of phase-shifting, each phase-shifting is π/2), four phase-shiftings with phase-shifting steps of π/2 rad are acquired, and the four-step phase-shift algorithm is used to test the phase solution formula φ = arctan ( 1 4 1 2 I 1 I 3 ) . The phase-shifting amount and theoretical phase-shifting amount are shown in Table 3, and the number of iterations is 37.
The shape of the surface to be measured obtained after unwrapping and fitting is shown in Figure 9a,b as the surface cross-section of the surface to be measured.

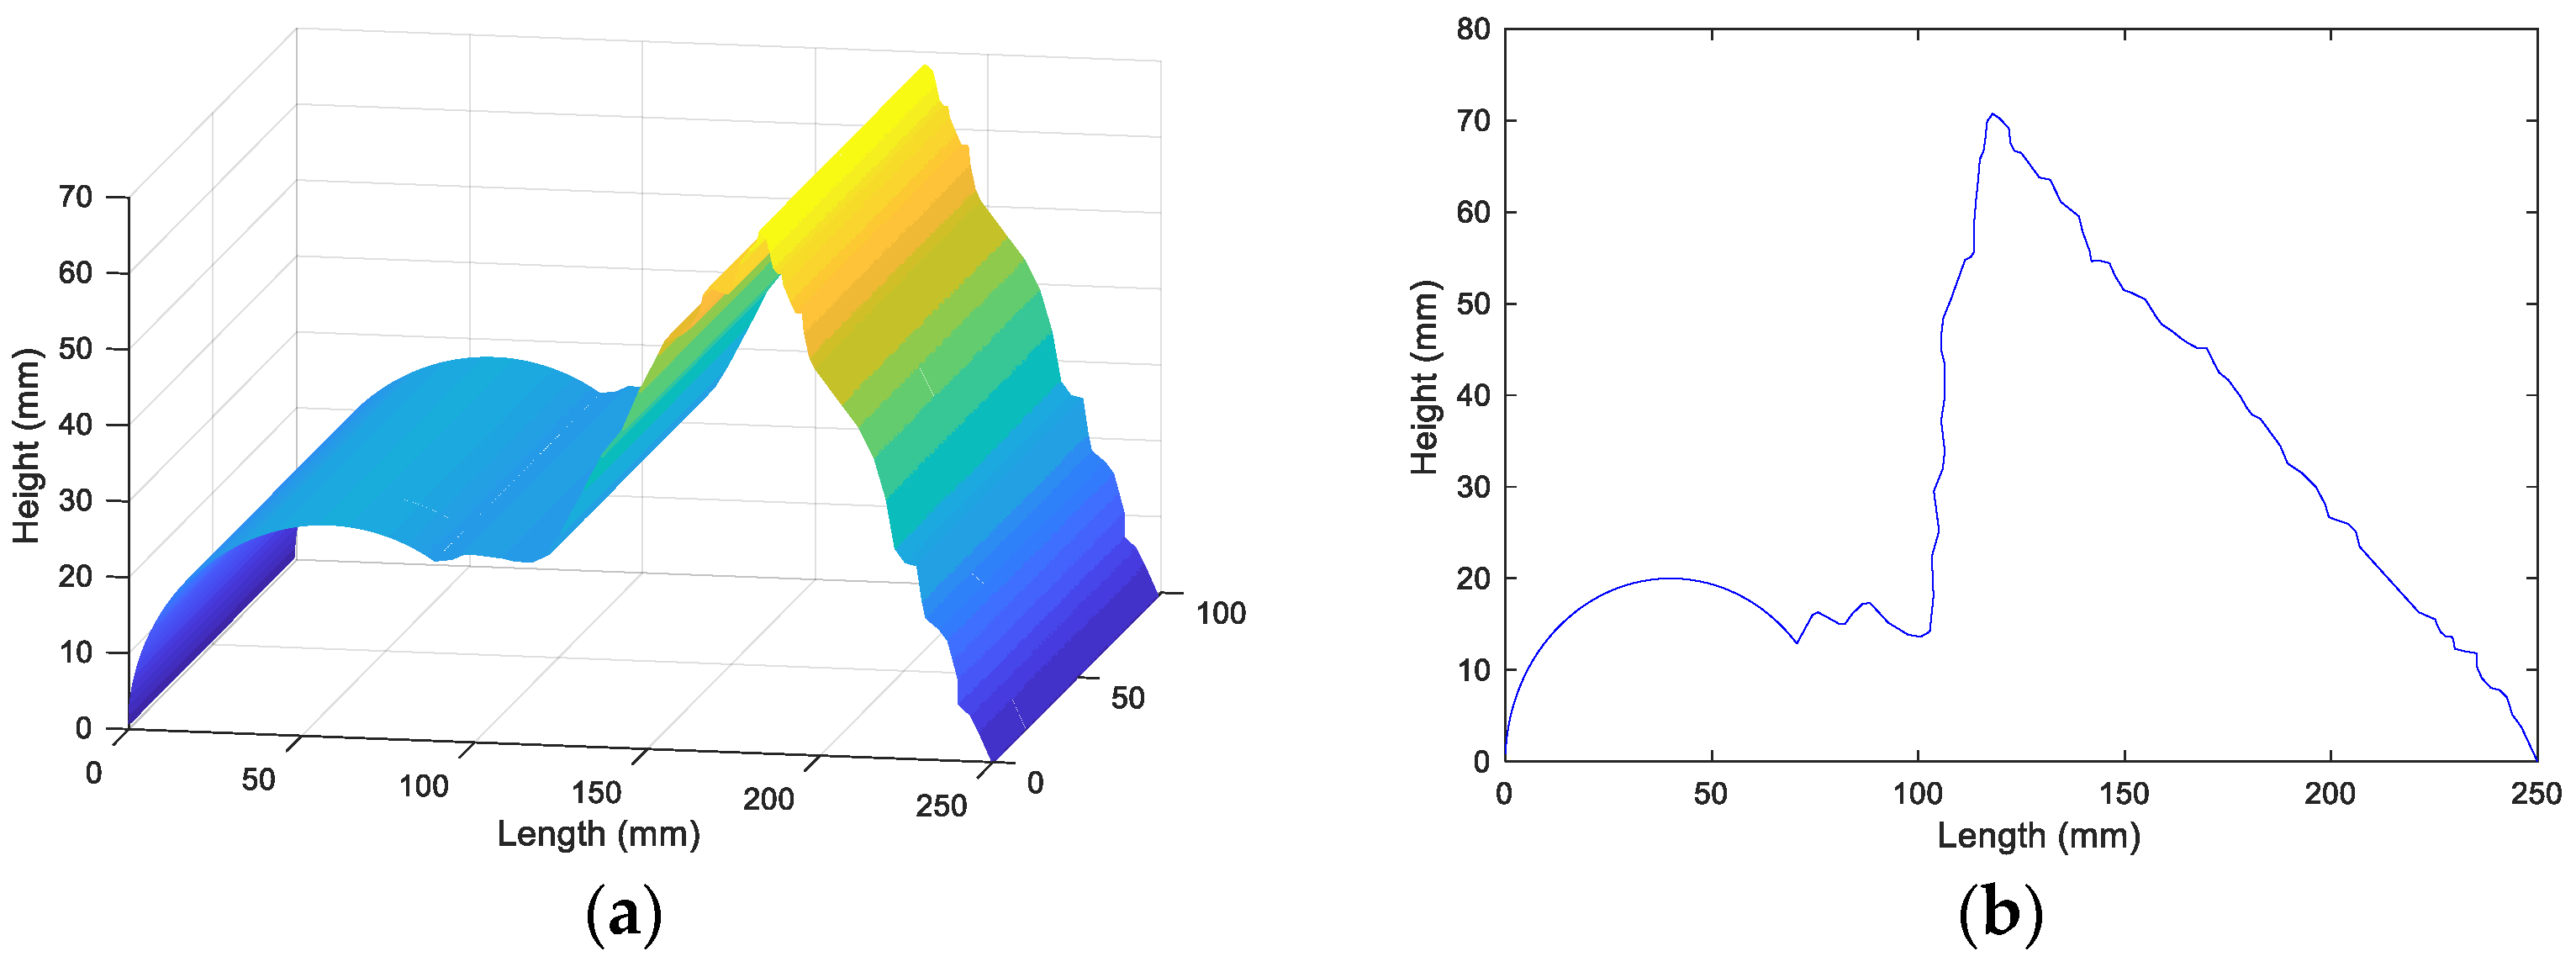
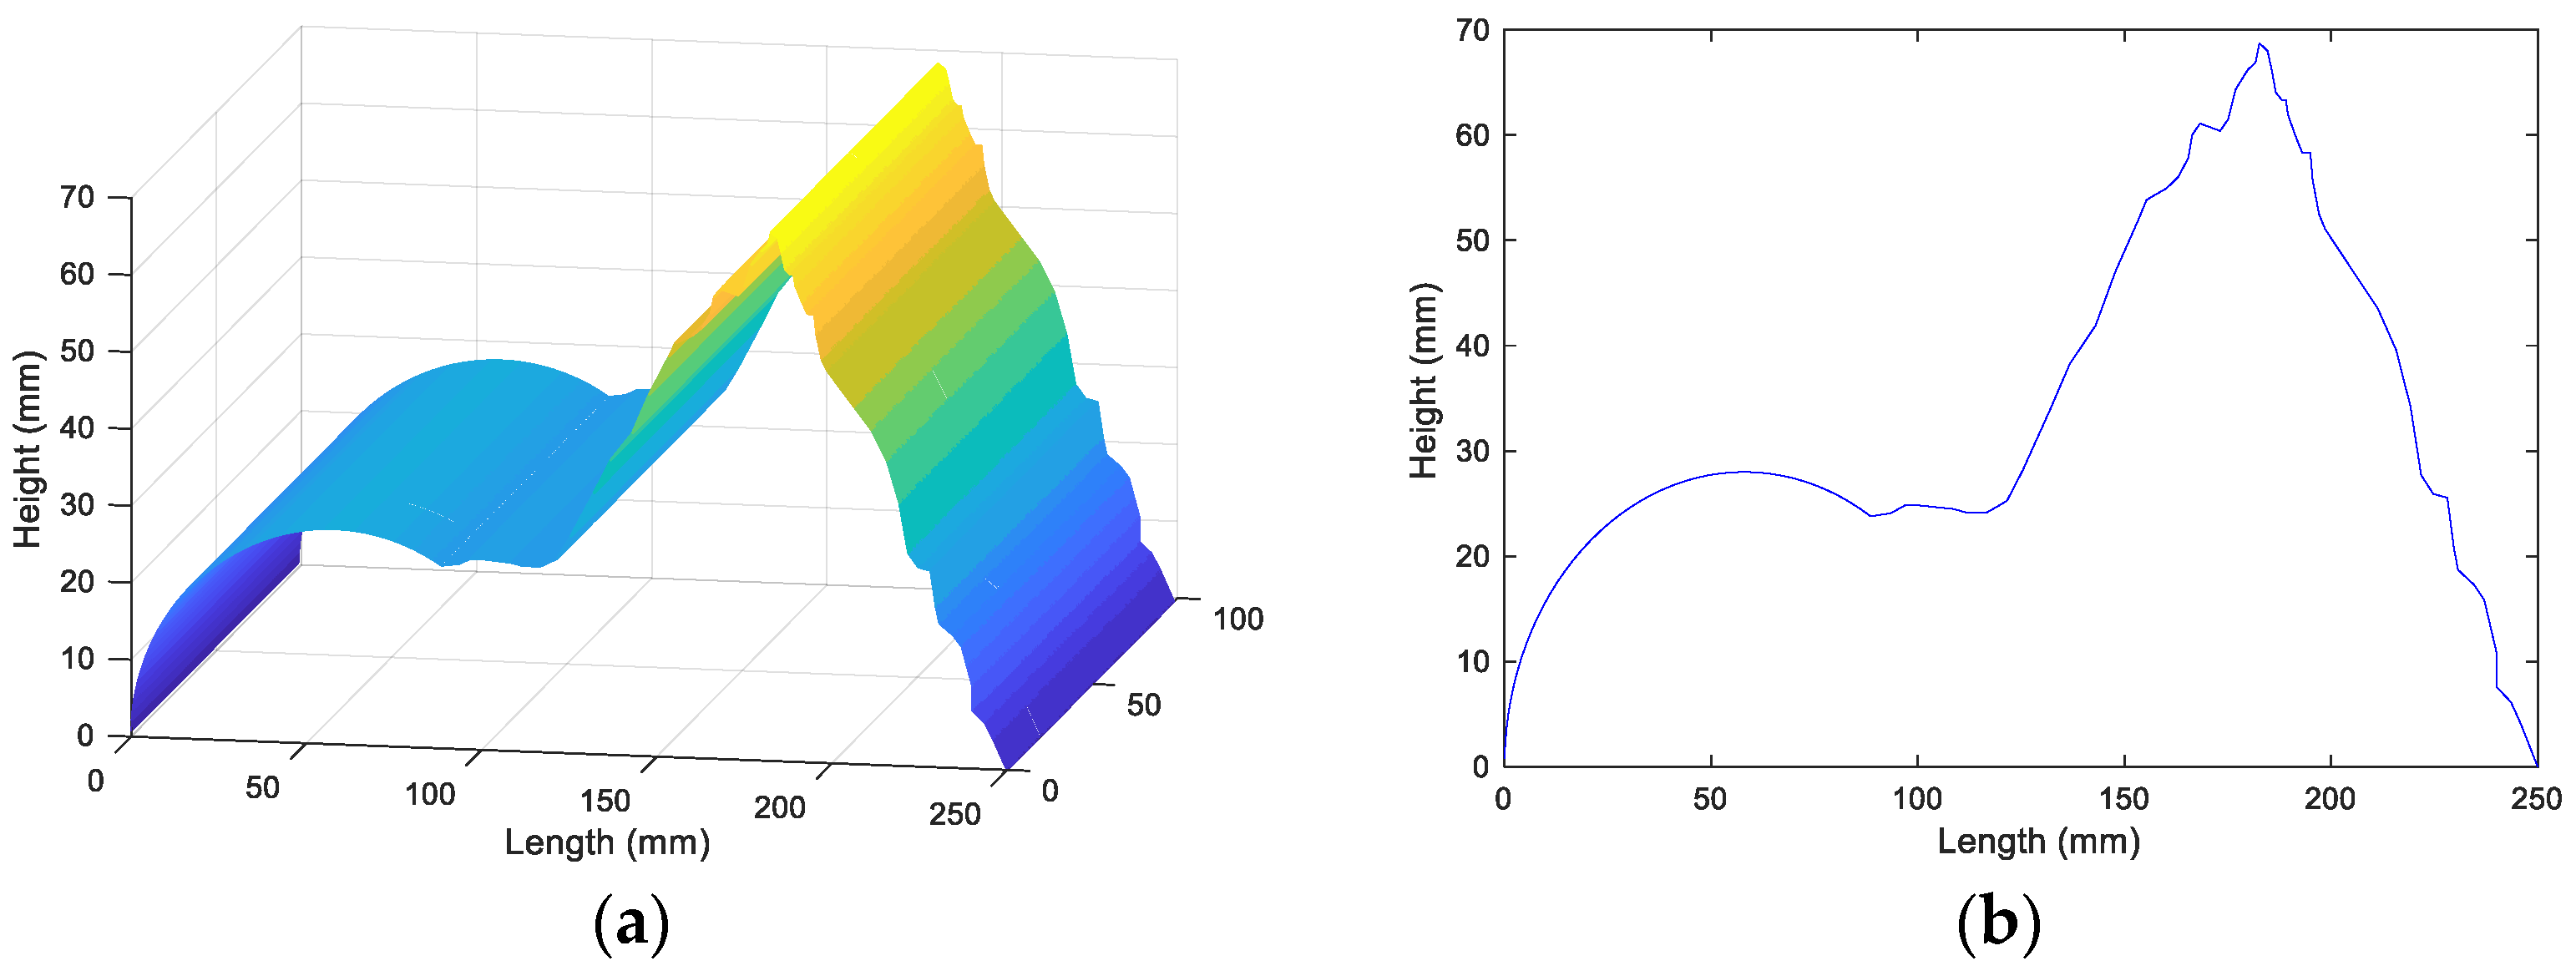
5.4. Frequency-Shifted Phase-Shifting Extraction Algorithm Based on Selective Sampling for Solving the Measured Phase

The iterative-based phase extraction algorithm tends to be less accurate and time-consuming, and the efficiency is not high. It can be seen from the analysis of the iterative algorithm and the four-step phase-shifting algorithm that the number of pixels in the whole graph substituted into the calculation is large, leading to iteration [11,33]. The efficiency is also low. This paper proposes a method based on selective sampling for phase shifting. First, the original image is equally spaced, and the sampling interval is a pixel, that is, one camera pixel is sampled as a pixel; equal interval sampling can ensure that the sampling point can represent the original algorithm to the greatest extent. At this time, the calculation method of the phase-shifting error can be used according to the actual measurement process. When the phase-shifting error is small, a five-step phase-shifting fast phase extraction algorithm can be used. When the error is large, the maximum pixel value of the K fringe images can be directly used to represent the contrast, and iterative calculation is performed.
Five fringe images were collected in the experiment, and the true value of the phase shifting between the fringe images was [0°, 76°, 160°, 230°, 321°]. [0°, 80°, 160°, 240°, 320°] was used as the initial phase-shifting amount into the algorithm, and then the original image was sampled at every other pixel point, and then the sampled points were input into the algorithm that performs the iterative operation, and finally, the profile of the measured surface was obtained by unwrapping and fitting; the cross-sectional view of the measured surface shape is as shown in Figure 10a,b.
To intuitively reflect the advantages of the algorithm in this paper, we calculated the measurement accuracy and RMSE of each algorithm, and the numerical values are shown in Table 4.

6. Discussion and Conclusions

The above three sets of experiments, from Figure 8, Figure 9 and Figure 10, show the iterative algorithm and four-step phase-shifting algorithm and the shape measurement results based on selecting the sampled phase-shifting algorithm. The results show that in the surface step of the measured surface, the iterative algorithm and the four-step phase-shifting algorithm were fitted to obtain a larger surface error value, and the measurement accuracy was lower. However, when using the variable phase-shifting extraction algorithm based on selective sampling, it can be seen from Figure 10a,b that the surface error level obtained after fitting was kept at a relatively low level, and the maximum iteration error value was approximately 0.1°, which was a high measurement accuracy. It can be seen from Table 4 that the measurement accuracy of the algorithm in this paper was significantly improved, and the value of the RMSE was lower than that of the normal algorithm, which shows that the algorithm has good stability. The experimental results show that when the traditional iterative algorithm and the four-step phase-shifting algorithm were used to measure simple and smooth surfaces, the phase-shifting error had little effect on the measurement results with a high accuracy, whereas they were used to measure complex step surfaces. The measurement results had a significant influence in the case of apparently low accuracy.
In the measurement of the variable phase-shifting extraction algorithms based on selective sampling, the method was used to solve the measured phase without phase calibration of the test system, and the measurement was not sensitive to the phase-shifting error. The variable phase-shifting extraction algorithm based on selective sampling can obtain the actual phase-shifting amount by accurate iteration and simultaneously sampling the original image at equal intervals, after which it can perform sampling selectively, reducing the iterative calculation amount and ensuring the accuracy of the iterative result. After verifying the efficiency and accuracy of the algorithms by measurement experiments, we concluded that the algorithm proposed in this paper has a broader scope of application, not only to simple and smooth surfaces, but also to complex step surfaces. When this algorithm is used to measure complex step surfaces, a high accuracy and short running times can be reached. As a result, such an algorithm can be used for practical measurements.

Author Contributions

S.Z., experiments and writing; H.H., operation instruction, experiments, and reviewing. All authors have read and agreed to the published version of the manuscript.

Funding

This work was supported by the National Natural Science Foundation of China (51865004), National Natural Science Foundation of China (52165063), the Major Science and Technology Plan of Guizhou Province (Qiankehe major special plan [2018] No.3002), the Major Projects of Guizhou Province (Qiankehe major project [2017] No.3004), the Industrial Key Project of Guizhou Province (Qiankehe zhicheng [2016] No.2332), the Natural Science Foundation of Guizhou Province (Qiankehe platform talent [2018] No.5781), the Top Talent Projects in Guizhou Province (Qianjiaohe KY[2018]037), and the Guizhou Province Graduate Research Fund (Qainjiaohe YJSCXJH[2020]091).

Conflicts of Interest

The authors declare no conflict of interests.

References

  1. Ordones, S.; Servin, M.; Kang, J.S. Moire profilometry through simultaneous dual fringe projection for accurate phase demodulation: A comparative study. Appl. Opt. 2021, 60, 8667–8675. [Google Scholar] [CrossRef]
  2. Dickins, A.; Widjanarko, T.; Sims-Waterhouse, D.; Thompson, A.; Lawes, S.; Senin, N.; Leach, R. Multi-view fringe projection system for surface topography measurement during metal powder bed fusion. JOSA A 2020, 37, B93–B105. [Google Scholar] [CrossRef]
  3. Zhang, S. Recent progresses on real-time 3D shape measurement using digital fringe projection techniques. Opt. Lasers Eng. 2010, 48, 149–158. [Google Scholar] [CrossRef]
  4. Zhang, S.; Van Der Weide, D.; Oliver, J. Superfast phase-shifting method for 3-D shape measurement. Opt. Express 2010, 18, 9684–9689. [Google Scholar] [CrossRef] [PubMed] [Green Version]
  5. Su, X.; Chen, W.; Zhang, Q.; Chao, Y. Dynamic 3-D shape measurement method based on FTP. Opt. Lasers Eng. 2001, 36, 49–64. [Google Scholar] [CrossRef]
  6. Lai, G.; Yatagai, T. Generalized phase-shifting interferometry. JOSA A 1991, 8, 822–827. [Google Scholar] [CrossRef]
  7. Cheng, Y.-Y.; Wyant, J.C. Phase shifter calibration in phase-shifting interferometry. Appl. Opt. 1985, 24, 3049–3052. [Google Scholar] [CrossRef]
  8. Quan, C.; Tay, C.J.; Kang, X.; He, X.Y.; Shang, H.M. Shape measurement by use of liquid-crystal display fringe projection with two-step phase shifting. Appl. Opt. 2003, 42, 2329–2335. [Google Scholar] [CrossRef]
  9. Huang, P.S.; Zhang, S. Fast three-step phase-shifting algorithm. Appl. Opt. 2006, 45, 5086–5091. [Google Scholar] [CrossRef]
  10. Remmersmann, C.; Stürwald, S.; Kemper, B.; Langehanenberg, P.; von Bally, G. Phase noise optimization in temporal phase-shifting digital holography with partial coherence light sources and its application in quantitative cell imaging. Appl. Opt. 2009, 48, 1463–1472. [Google Scholar] [CrossRef]
  11. Zuo, C.; Feng, S.; Huang, L.; Tao, T.; Yin, W.; Chen, Q. Phase shifting algorithms for fringe projection profilometry: A review. Opt. Lasers Eng. 2018, 109, 23–59. [Google Scholar] [CrossRef]
  12. Xu, J.; Zhang, S. Status, challenges, and future perspectives of fringe projection profilometry. Opt. Lasers Eng. 2020, 135, 106193. [Google Scholar] [CrossRef]
  13. Tonelli, L.; Fortunato, A.; Ceschini, L. CoCr alloy processed by Selective Laser Melting (SLM): Effect of Laser Energy Density on microstructure, surface morphology, and hardness. J. Manuf. Process. 2020, 52, 106–119. [Google Scholar] [CrossRef]
  14. Gao, T.; Zhang, X.; Li, C.; Zhang, Y.; Yang, M.; Jia, D.; Ji, H.; Zhao, Y.; Li, R.; Yao, P. Surface morphology evaluation of multi-angle 2D ultrasonic vibration integrated with nanofluid minimum quantity lubrication grinding. J. Manuf. Process. 2020, 51, 44–61. [Google Scholar] [CrossRef]
  15. Hongbei, W.; Xiaoqian, C.; Yuanbo, L.; Mengge, Z.; Shuhua, L.; Guangnan, L.; Hongbin, D. Measurement of the surface morphology of plasma facing components on the EAST tokamak by a laser speckle interferometry approach. Plasma Sci. Technol. 2018, 20, 035602. [Google Scholar]
  16. Tahara, T.; Kozawa, Y.; Ishii, A.; Wakunami, K.; Ichihashi, Y.; Oi, R. Two-step phase-shifting interferometry for self-interference digital holography. Opt. Lett. 2021, 46, 669–672. [Google Scholar] [CrossRef]
  17. Wang, Y.; Zhang, F.; Tang, X.; Chen, X.; Chen, Y.; Huang, W.; Liang, Z.; Wu, L.; Ge, Y.; Song, Y. All-optical phosphorene phase modulator with enhanced stability under ambient conditions. Laser Photonics Rev. 2018, 12, 1800016. [Google Scholar] [CrossRef]
  18. Chen, Y.; Kemao, Q. General iterative algorithm for phase-extraction from fringe patterns with random phase-shifts, intensity harmonics and non-uniform phase-shift distribution. Opt. Express 2021, 29, 30905–30926. [Google Scholar] [CrossRef]
  19. Qian, J.; Feng, S.; Tao, T.; Hu, Y.; Li, Y.; Chen, Q.; Zuo, C. Deep-learning-enabled geometric constraints and phase unwrapping for single-shot absolute 3D shape measurement. APL Photonics 2020, 5, 046105. [Google Scholar] [CrossRef]
  20. Li, E.; Peng, X.; Xi, J.; Chicharo, J.F.; Yao, J.; Zhang, D. Multi-frequency and multiple phase-shift sinusoidal fringe projection for 3D profilometry. Opt. Express 2005, 13, 1561–1569. [Google Scholar] [CrossRef]
  21. Kim, E.-H.; Hahn, J.; Kim, H.; Lee, B. Profilometry without phase unwrapping using multi-frequency and four-step phase-shift sinusoidal fringe projection. Opt. Express 2009, 17, 7818–7830. [Google Scholar] [CrossRef] [Green Version]
  22. Jin, L.; Kodera, Y.; Yoshizawa, T.; Otani, Y. Shadow moiré profilometry using the phase-shifting method. Opt. Eng. 2000, 39, 2119–2123. [Google Scholar] [CrossRef]
  23. Hu, Y.; Chen, Q.; Feng, S.; Zuo, C. Microscopic fringe projection profilometry: A review. Opt. Lasers Eng. 2020, 135, 106192. [Google Scholar] [CrossRef]
  24. Gao, P.; Yao, B.; Lindlein, N.; Mantel, K.; Harder, I.; Geist, E. Phase-shift extraction for generalized phase-shifting interferometry. Opt. Lett. 2009, 34, 3553–3555. [Google Scholar] [CrossRef] [PubMed]
  25. Seyler, T.; Bienkowski, L.; Beckmann, T.; Fratz, M.; Bertz, A.; Carl, D. Multiwavelength digital holography in the presence of vibrations: Laterally resolved multistep phase-shift extraction. Appl. Opt. 2019, 58, G112–G119. [Google Scholar] [CrossRef]
  26. Zhang, X.; Sun, J.; Zhang, X. Automatic modulation classification based on novel feature extraction algorithms. IEEE Access 2020, 8, 16362–16371. [Google Scholar] [CrossRef]
  27. Guo, H.; Zhao, Z.; Chen, M. Efficient iterative algorithm for phase-shifting interferometry. Opt. Lasers Eng. 2007, 45, 281–292. [Google Scholar] [CrossRef]
  28. Luo, P.; Li, D.; Wang, R.; Zhang, X.; Li, X.; Zhao, W. Phase-extraction algorithm for a single-shot spatial-carrier orthogonal fringe pattern with least squares method. Opt. Eng. 2020, 59, 024103. [Google Scholar] [CrossRef]
  29. Duan, M.; Zong, Y.; Zhu, R.; Li, J. Phase-tilt iteration: Accurate and robust phase extraction from random tilt-shift interferograms. Opt. Lasers Eng. 2021, 142, 106595. [Google Scholar] [CrossRef]
  30. Sun, F.; Dan, X.; Yan, P.; Zhao, Q.; Zhong, S.; Wang, Y. A spatial-phase-shift-based defect detection shearography system with independent adjustment of shear amount and spatial carrier frequency. Opt. Laser Technol. 2020, 124, 105956. [Google Scholar] [CrossRef]
  31. Xu, Z.; Zhao, L. Investigation of Brillouin frequency shift error estimated by quadratic fitting and the improved algorithm. Optik 2021, 241, 166456. [Google Scholar] [CrossRef]
  32. Liu, C.-Y.; Yen, T.-P. Digital multi-step phase-shifting profilometry for three-dimensional ballscrew surface imaging. Opt. Laser Technol. 2016, 79, 115–123. [Google Scholar] [CrossRef]
  33. Feng, S.; Zuo, C.; Tao, T.; Hu, Y.; Zhang, M.; Chen, Q.; Gu, G. Robust dynamic 3-d measurements with motion-compensated phase-shifting profilometry. Opt. Lasers Eng. 2018, 103, 127–138. [Google Scholar] [CrossRef]
  34. Xie, L.; Zhang, X.; Tu, D.; Li, C.; Xiao, G.; Zhang, C.; Zhuang, S. Calibration of underwater fisheye camera with multi-frequency heterodyne technique based on light field. Meas. Sci. Technol. 2020, 31, 115206. [Google Scholar] [CrossRef]
  35. Zhang, J.; Yu, H.; Deng, H.; Chai, Z.; Ma, M.; Zhong, X. A robust and rapid camera calibration method by one captured image. IEEE Trans. Instrum. Meas. 2018, 68, 4112–4121. [Google Scholar] [CrossRef]
  36. Liu, Z.; Wu, Q.; Wu, S.; Pan, X. Flexible and accurate camera calibration using grid spherical images. Opt. Express 2017, 25, 15269–15285. [Google Scholar] [CrossRef] [PubMed]
  37. Kuo, C.-F.J.; Wu, H.-C. A homography fringe generation method of fringe projection profilometry technology. Opt. Lasers Eng. 2014, 56, 28–34. [Google Scholar]
Figure 1. Four simulated fringe images: (ad) the fringe pattern corresponding to different n obtained according to Equation (15).
Photonics 08 00592 g001
Figure 2. The results of the running time and mean square error of the three algorithms. (a) Comparison of the running time of the three algorithms with equal interval sampling. (b) Comparison of root mean square error of three algorithms for equal interval sampling.
Photonics 08 00592 g002
Figure 3. Measured part: (a) 3D model and dimensions of the part; (b) photo of measuring part.
Photonics 08 00592 g003
Figure 4. Optical geometry of the phase measuring method (the fringe projection emitted by the projector is projected onto the inspected part at an incident angle θ, the deformed fringe pattern is collected by a CCD camera and saved in the computer for later processing, the reference plane is a movable surface parallel to the projector and the CCD. C, D, O represents the reflection point of the projector lens and reference plane, and h ( x , y ) is the tested object height relative to the reference plane).
Photonics 08 00592 g004
Figure 5. Test system light path diagram. A: projector, B: Cognex CCD camera, C: ring light source, D: test part, E: platform, F: PC, G: dedicated test equipment.
Photonics 08 00592 g005
Figure 6. Process of experimental calibration: ① obtaining of stripe pattern; ② projector projects fringe patterns; ③ change the position of the calibration plate to obtain enough calibration images; ④ CCD camera captures images; ⑤ the PC filters and denoises the fringe pattern, extracts the checkerboard, calibrates the board feature points, extracts the phase value of the feature points, and extracts the 3D coordinates corresponding to the feature points after calibrating the camera.
Photonics 08 00592 g006
Figure 7. (a) Simulated wavefront map with its gray-scale bar (b) wrapped phase fringe map. Dark areas represent lower slope values, and lighter areas represent larger slope values.
Photonics 08 00592 g007
Figure 8. Results of the iterative algorithm measurement (iterative algorithm with a phase-shifting of π/2). (a) The measured surface shape of the iterative method; (b) the measured surface profile of the iterative method.
Photonics 08 00592 g008
Figure 9. Results of the iterative algorithm measurement (four-step phase-shifting algorithm with phase-shifting of π/2). (a) The measured surface shape of the four-step phase-shifting algorithm; (b) the measured surface profile of the four-step phase-shift algorithm.
Photonics 08 00592 g009
Figure 10. Results measured by a variable-phase phase-shifting extraction algorithm based on selected samples (frequency-shifted phase-shift phase extraction algorithm based on selective sampling for solving measured phase). (a) The measured shape surface solved by the variable frequency phase-shifting extraction algorithm based on the selected sampling; (b) sectional view of the measured shape solved by the variable frequency phase-shifting extraction algorithm based on the selected sampling.
Photonics 08 00592 g010
Table 1. Phase-shifting by interaction method and the theoretical phase-shifting (arbitrary phase-shifting).
Step1234
Theoretical phase-shifting/rad0.93231542.01235454.15324565.2231458
Phase-shifting by iteration method/rad0.93231422.01235204.15324465.2231419
Table 2. Phase-shifting by interaction method and the theoretical phase-shifting (arbitrary phase-shifting).
Step123
Theoretical phase-shifting (rad)1.5607563.1414564.712354
Phase-shifting by iteration method (rad)1.5607423.1414254.712313
Table 3. Phase-shifting by integration method and the theoretical phase-shifting (arbitrary phase-shifting).
Step123
Theoretical phase-shifting (rad)2.13251354.15365896.3254756
Phase-shifting by iteration method (rad)2.13251254.15365456.3254742
Table 4. Accuracy of different algorithms.
Normal Iterative AlgorithmNormal Four-Step Phase-Shifting AlgorithmThe Algorithm of This Paper
Measurement accuracy (%)92.6593.3197.55
RMSE (µm)17.820.713.2
Publisher’s Note: MDPI stays neutral with regard to jurisdictional claims in published maps and institutional affiliations.

