Article

Usability of Tilted Plasmon Antenna with Structured Light

by
Rafael Quintero-Torres
1,*,
Jorge Luis Domínguez-Juárez
1,2,
Mariia Shutova
3 and
Alexei V. Sokolov
3
1
Centro de Física Aplicada y Tecnología Avanzada, Universidad Nacional Autónoma de México, Juriquilla, Querétaro 76230, Mexico
2
Cátedras CONACyT, Centro de Física Aplicada y Tecnología Avanzada, Universidad Nacional Autónoma de México, Juriquilla, Querétaro 76230, Mexico
3
Institute for Quantum Science and Engineering, Department of Physics and Astronomy, Texas A&M University, College Station, TX 77843-4242, USA
*
Author to whom correspondence should be addressed.
Photonics 2021, 8(11), 504; https://doi.org/10.3390/photonics8110504
Submission received: 8 October 2021 / Revised: 26 October 2021 / Accepted: 1 November 2021 / Published: 9 November 2021

Abstract

:
We study the effect of oblique illumination on the functioning of a plasmonic nanoantenna for chiral light. The antenna is designed to receive a structured beam of light and produce a nanosized near-field distribution that possesses nonzero orbital angular momentum. The design consists of metal (gold) microrods laid on a dielectric surface and is compatible with well-developed nanofabrication techniques. Experimental arrangements often require such an antenna to operate in a tilted geometry, where input light is incident on the antenna at an oblique angle. We analyze the limitations that the angled illumination imposes and discuss approaches to mitigate these limitations. Through our numerical simulations, we find that tilt angles require modifications to the antenna design. Our analysis can guide current and future experimental configurations to push the limits of resolution and sensitivity.

Graphical Abstract

1. Introduction

Technologies that use electromagnetic fields can be used with a large frequency bandwidth, only limited by the frequency of the field used [1]. At the same time, their spatial resolution is limited by diffraction. Similarly, technologies that use electronic transport have the capability to distinguish and use small geometries, limited by quantum confinement, which can reach values around 1 nm in spatial resolution [2]. However, they have a limited frequency bandwidth, defined by electron mobility and device size. Electric field confinement by plasmonic interaction has been explored for some time with very important results, from localized light [3] to nano sources of radiation [4]. Furthermore, structured beams with an orbital angular momentum have been applied to increase the amount of encoded information [5,6]; their use in conjunction with plasmonic nanoantennae is of particular interest and will result in confined field structures with sizes well beyond the diffraction limit [7]. The angular momentum nanometrology with a plasmonic angular momentum field at the nanoscale is possible [8]. The manipulation of light polarization and the interconnection of the near field to plasmonic nanoantennae is a key ingredient of control [9]. The plasmonic nanostructure geometries with the development of nanofabrication tools can also control the near field to induce topological charge and plasmonic vortex [8,10]. Such geometry of plasmonic nanostructures with the combination of dynamic phases can tune the orbital angular momentum of the surface plasmon [11].
A nanoantenna can control the field intensity of Gaussian beams and linear states of polarization. Controlling the spatially structured field with an orbital angular momentum (OAM) of a beam of light proves more challenging due mainly to the requirement to maintain the singularity at the axis of the vortex. This control is anticipated to reach the dimensions defined by the beam, the antenna, and the geometrical arrangement between them. Studies show that light with orbital angular momentum can interact with single molecules and ions and directly induce quadrupole transitions [12,13]. For efficient interaction with single molecules, light with OAM needs to be brought to the size of the interaction particle (nanometers). Plasmonic nanoantennae are the easiest way to break the diffraction limit and “focus” the OAM beam to the nanoscale. The theory for subdiffraction focusing and probing quadrupole transitions is being developed rapidly [14]. In recent years, inducing and controlling the nanoscale orbital rotation of such nanoparticles or molecules [15] with the light’s angular momentum has required the effort of various scientific fields to elucidate the light–matter angular momentum transfer mechanisms using plasmonic nanoantennae [16]. Novel nanosystems to understand the confinement of light at the nanoscale requires alternative research to push the limits in orbital angular momentum transfer, including orbital angular momentum dichroism [17], orbital angular momentum transfer to electrons using metamaterials [18], optical vortices with fractional topological charges [19], optical vortices induced with nonlinearities [20], plasmonic nanoantennae to control nonlinear emissions by linear field enhancement [21], focused vortex beams using surface plasmon metasurfaces [22], or, as we show here, the effect of oblique illumination on the functioning of a plasmonic nanoantenna for chiral light.
In this paper, we study the effect of oblique illumination and simulate defocusing and adjustments close to the center on the functioning of a plasmonic nanoantenna for chiral light. We consider a nanoantenna (eight arms) for a beam of light with OAM that is incident at an angle greater than zero to the normal antenna plane. To gain some intuition and visualization with a case of normal incidence and Laguerre m = 1 beam, we constructed a two-arm dipole antenna to produce a basic guide for resonance as a function of wavelength. Next, we show how to improve illumination with oblique incidence by defocusing with nanometer step adjustments near to the center of the normal axis reference. We show that the electric field magnitude of a Laguerre–Gauss (LG) beam over the antenna gets further from the center, increasing the effective beam diameter. Consequently, the resonant frequency decreases, leaving fewer variables to correct. Such corrections include the antenna–beam interaction, the arm length, and the central gap structure of the antenna. In a multi-rod antenna, attempts to correct the slanted angle α are limited because the antenna sees a beam growing from 1 to 1/cos(α) in the two normal axes.
We consider the situation when the antenna is used in combination with an atomic force microscope (AFM) using the side-illumination objective. The angle at which the side objective is situated differs significantly from normal illumination; hence, it will affect the functioning of the nanoantenna and, therefore, needs to be considered in our calculations. The antenna used in this work was inspired by a geometry achievable with a commercially focused ion beam (FIB) [23]. Figure 1 is a schematic figure of a Laguerre–Gauss beam of light with OAM and the eight-arm antenna geometry, along with the intensity distribution of such a beam at normal incidence.

2. Materials and Methods

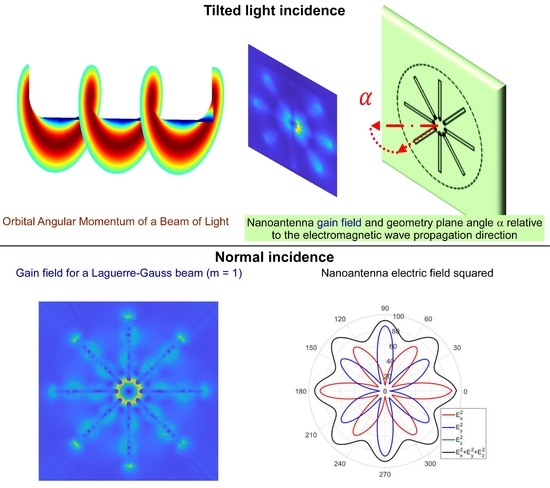
2.1. Orbital Angular Momentum (OAM) of a Beam of Light

A Laguerre–Gauss (LG) laser beam has more degrees of freedom than a regular Gaussian beam [24]. Its propagation modes have rotational symmetry along its propagation axis and carry an intrinsic rotational orbital angular momentum of iħ per photon. This means that a refractive object placed along the propagation axis will experience torque. Figure 2a presents a standard electric field norm ( n o r m ( E ) || E || = | E x | 2 + | E y | 2 + | E z | 2 = E x E x * + E y E y * + E z E z * ) as presented by the scalar field in Equation (1).
E ( r , φ , z ) = E 0 ( w 0 w ( z ) ) ( 2 r w ( z ) ) m exp ( ( r w ( z ) ) 2 ) exp ( i k z ( r w 0 ) 2 2 ( w ( z ) z 0 ) 2 ) e x p ( i ( k z + m φ ( x , y ) ( m + 1 ) tan 1 z z 0 ) ) .
In this representation, a typical connection between Cartesian and cylindrical coordinates is used, r ( x , y ) = x 2 + y 2 , φ ( x , y ) = tan 1 y x , with a beam radius at focus defined by w 0 , a beam size parameter w ( z ) = w 0 1 + ( z z 0 ) 2 , and a Rayleigh range z 0 = π w 0 2 λ , where k is the wave vector, and λ is the wavelength.
The vector field propagating in the z-direction and with circular polarization is described with the usual Cartesian coordinates as follows:
E = E ( r , φ , z ) 2 ( i ^ e + i π 4 + j ^ e i π 4 ) .
All the parameters are standard for light description. Emphasis must be placed on the azimuthal index m, since m = 0 describes a Gaussian beam and m = 1 describes a Laguerre beam with an optical vortex. Figure 2b illustrates the electric field norm distribution over the antenna space that can be used to justify some of the limitations of the antenna. The intensity distribution is zero at the axis of propagation z and changes along with the antenna radial distance and the beam radius. An incident beam with a radius of 1 µm accommodates the whole antenna in the low-intensity central region.

2.2. The Nanolens

We consider the nanoantenna as a lens in the sense of focusing the electric field and maintaining its structure in a region smaller than the free propagation. The plasmonic antenna relies on the dielectric function and requires a small resistivity. The accepted model for the dielectric function in metals is the Lorentz–Drude model [25], which depends on the plasmonic frequency ( ω p ) and the dissipation factor ( γ ).
ε ( ω ) = 1 n ω p n 2 ω 2 + i ω γ n   1 ω p 2 ω 2 + i ω p 2 γ ω 3 .
The spectral study on frequency ω requires this dependence in the dielectric function. In this work, we used parameters for gold ( ω p = 13.8 × 10¹⁵ rad/s and γ = 0.5× 10¹⁴ rad/s) [26], useful for frequencies larger than 500 nm. In this dielectric function, the real part is negative, and relations with the optical constants are ε ( ω ) = ε 1 + i ε 2 = ( n + i κ ) 2 and n 2 = ( | ε | + ε 1 ) / 2 , κ 2 = ( | ε | ε 1 ) / 2 .
The antenna consists of eight-arm straight rods, 500 nm in length; from a top view, they are seen as 480 nm long rectangles plus a 20 nm radius half circle, 40 nm in width and 50 nm in thickness [23], as shown in Figure 3a. Figure 4b presents one arm, as well as its location (100 nm with respect to the center of the antenna) and the angle α between the propagation vector and the normal to the antenna plane.
Figure 3a presents the geometry of the whole antenna, designed to be resonant with a wavelength of 1800 nm [27], and the simulation volume, where the propagation of the beam and the contribution from the antenna are measured.
This spatial simulation allows us to study performance as a function of the wavelength [28], as well as the modifications due to noncollinear conditions between the antenna axis and the propagation vector.
When the antenna plane is normal to the beam propagation, the electric field on the antenna is symmetrical if an even number of arms is used in the antenna. Otherwise, the antenna plane is not normal to the beam propagation, and the electric field on the antenna is not symmetrical, although the intensity is still symmetrical. In the latter case, adjustments to the antenna due to changes in intensity are inevitable, such as uneven arms and asymmetrical location.

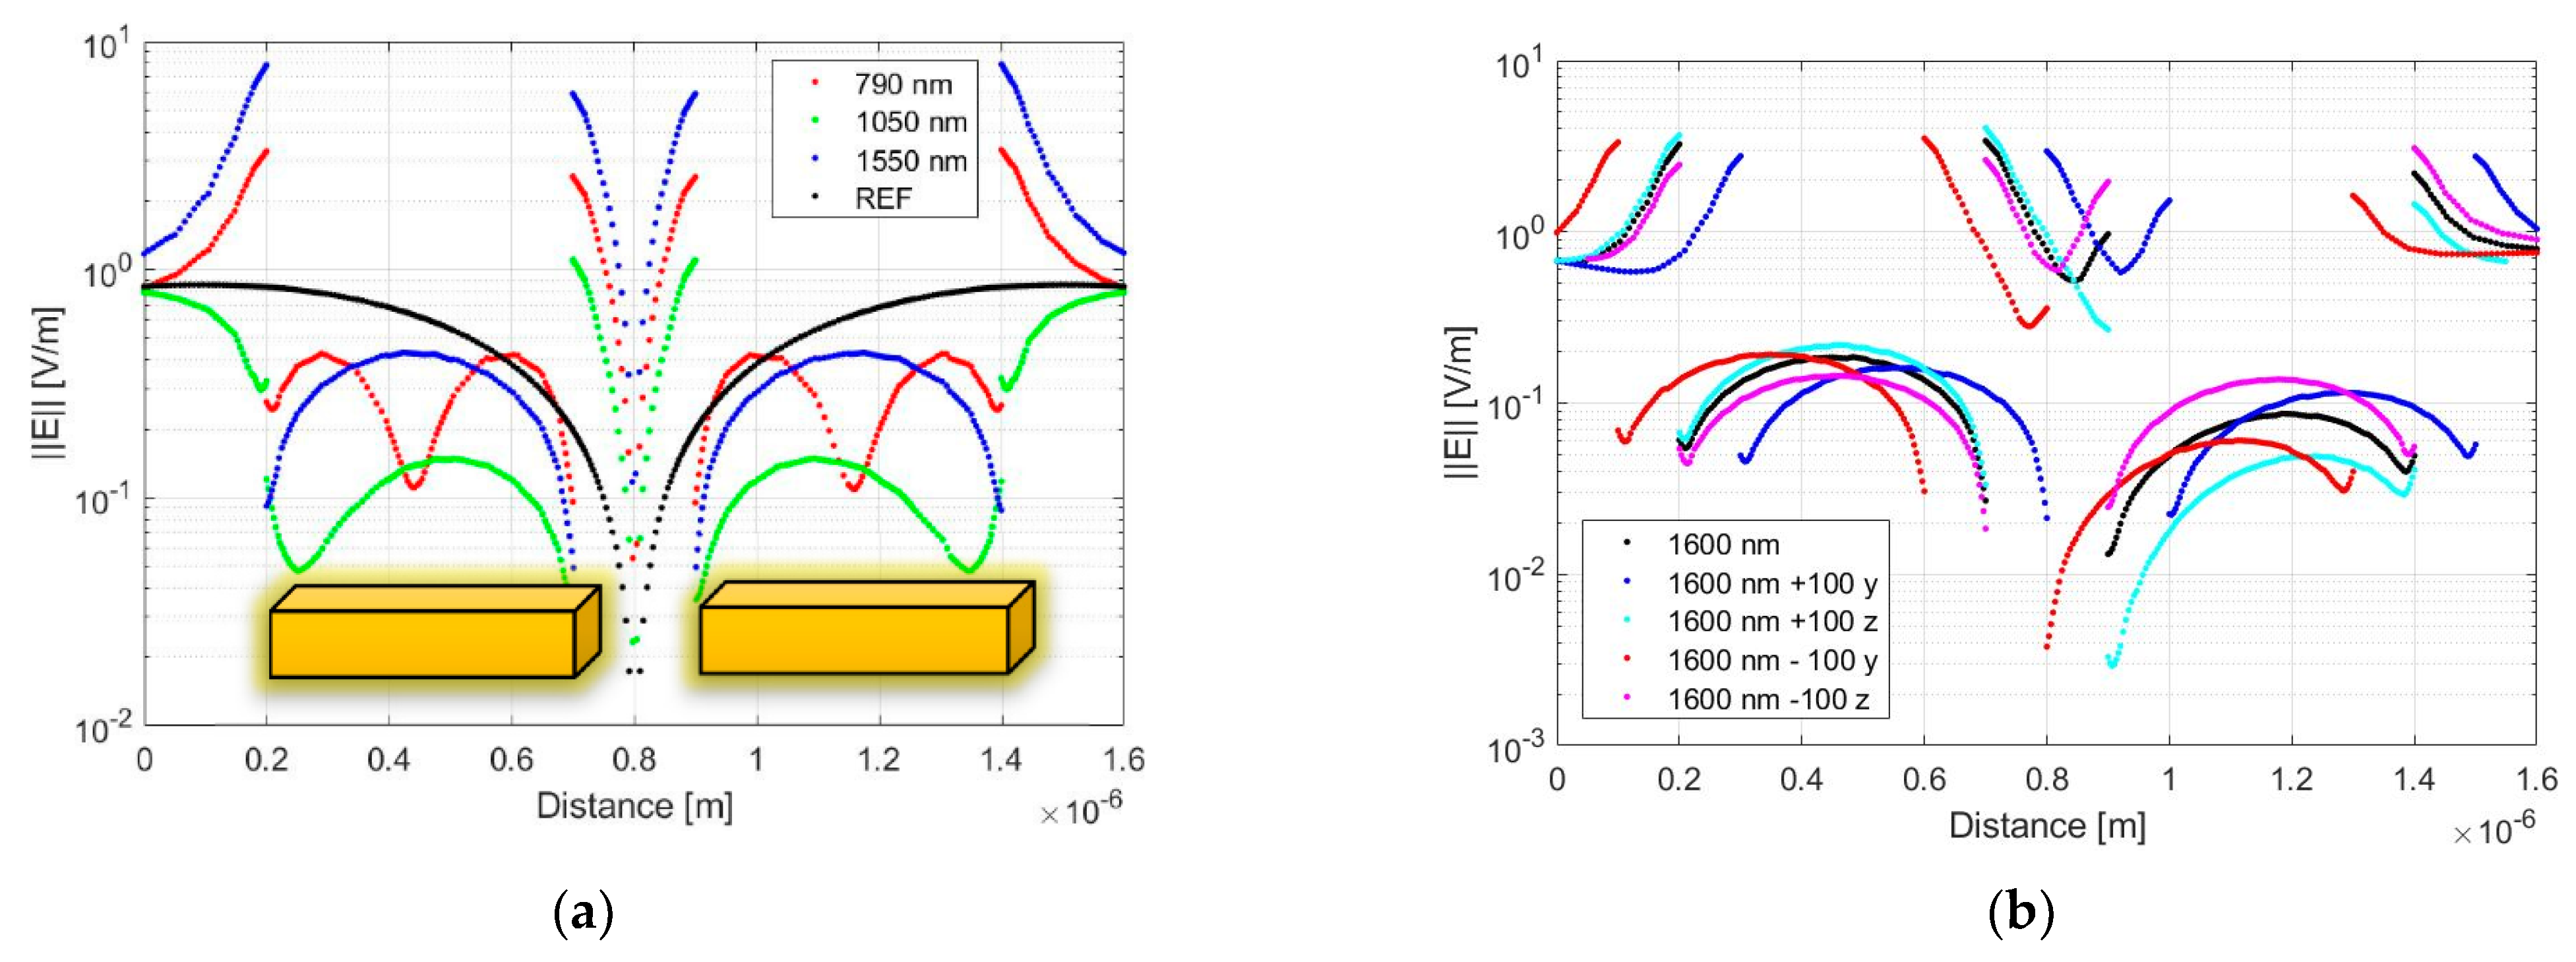
2.3. Electric Field Calculations

We show the description of the computer simulation used to back the results of the scattered electric field relative to the free moving field. The system performance, including the details of the Laguerre–Gauss beam, the plasmonic antenna, and the electric field profile [29] can be analyzed by finite-difference time-domain (FDTD) [23] and by finite element implemented in Mathematica® or COMSOL®. Here, the volume was segmented with an adaptable mesh, 2.2 million degrees of freedom, and 100,000 scattered independent points that produce 2 nm resolution at critical locations and 100 nm where it is not needed.
The results of the simulation include a matrix of x ,   y ,   z locations and E x ,     E y ,     E z complex numbers for each location. All the illustrations present n o r m ( E ) || E || , which is produced by the source and modified by the antenna, keeping in mind to not destroy the phase profile of the beam.

3. Results

3.1. Two-Arm Dipole Antenna Intuition

The behavior and the antenna merit depend on the light beam. To gain some intuition and visualization (case of normal incidence and Laguerre m = 1 beam), we constructed a two-arm dipole antenna with a geometry of two 500 nm rods and a gap of 100 nm, which produced the main resonance with light at approximately 1450 nm. When we increased the gap to 200 nm, the antenna’s resonance changed to approximately 1550 nm. The above example produced a basic guide for resonance at a wavelength approximately equal to the gap length plus 1.35 metallic length.
Figure 4 illustrates the electric field norm near the metallic rod for a linear antenna with two metallic rods 500 nm long and a 200 nm air gap. Figure 4a shows an antenna in the plane normal to the beam propagation. The black line describes the incident electric field, and the blue line illustrates the produced electric field with an incident beam wavelength of 1550 nm, corresponding with the main resonance. The green line is produced with an incident beam wavelength of 1050 nm, close to antiresonance, and the red line is produced with an incident beam wavelength of 790 nm, close to the second resonance. All the lines are symmetrical to the center of the antenna. Figure 4b shows the same linear antenna in a 45° slanted plane; the blue line is the field produced by a beam with a wavelength of 1600 nm, which does not match the symmetrical profile. The red and blue lines show the effect of shifting the antenna by 100 nm in the y-direction (positive and negative, respectively). The positive shift helps to regain the symmetry of the field profile. The cyan and magenta lines show the effect of moving the antenna in the z-direction (positive and negative). Here, the negative movement helps the symmetry.

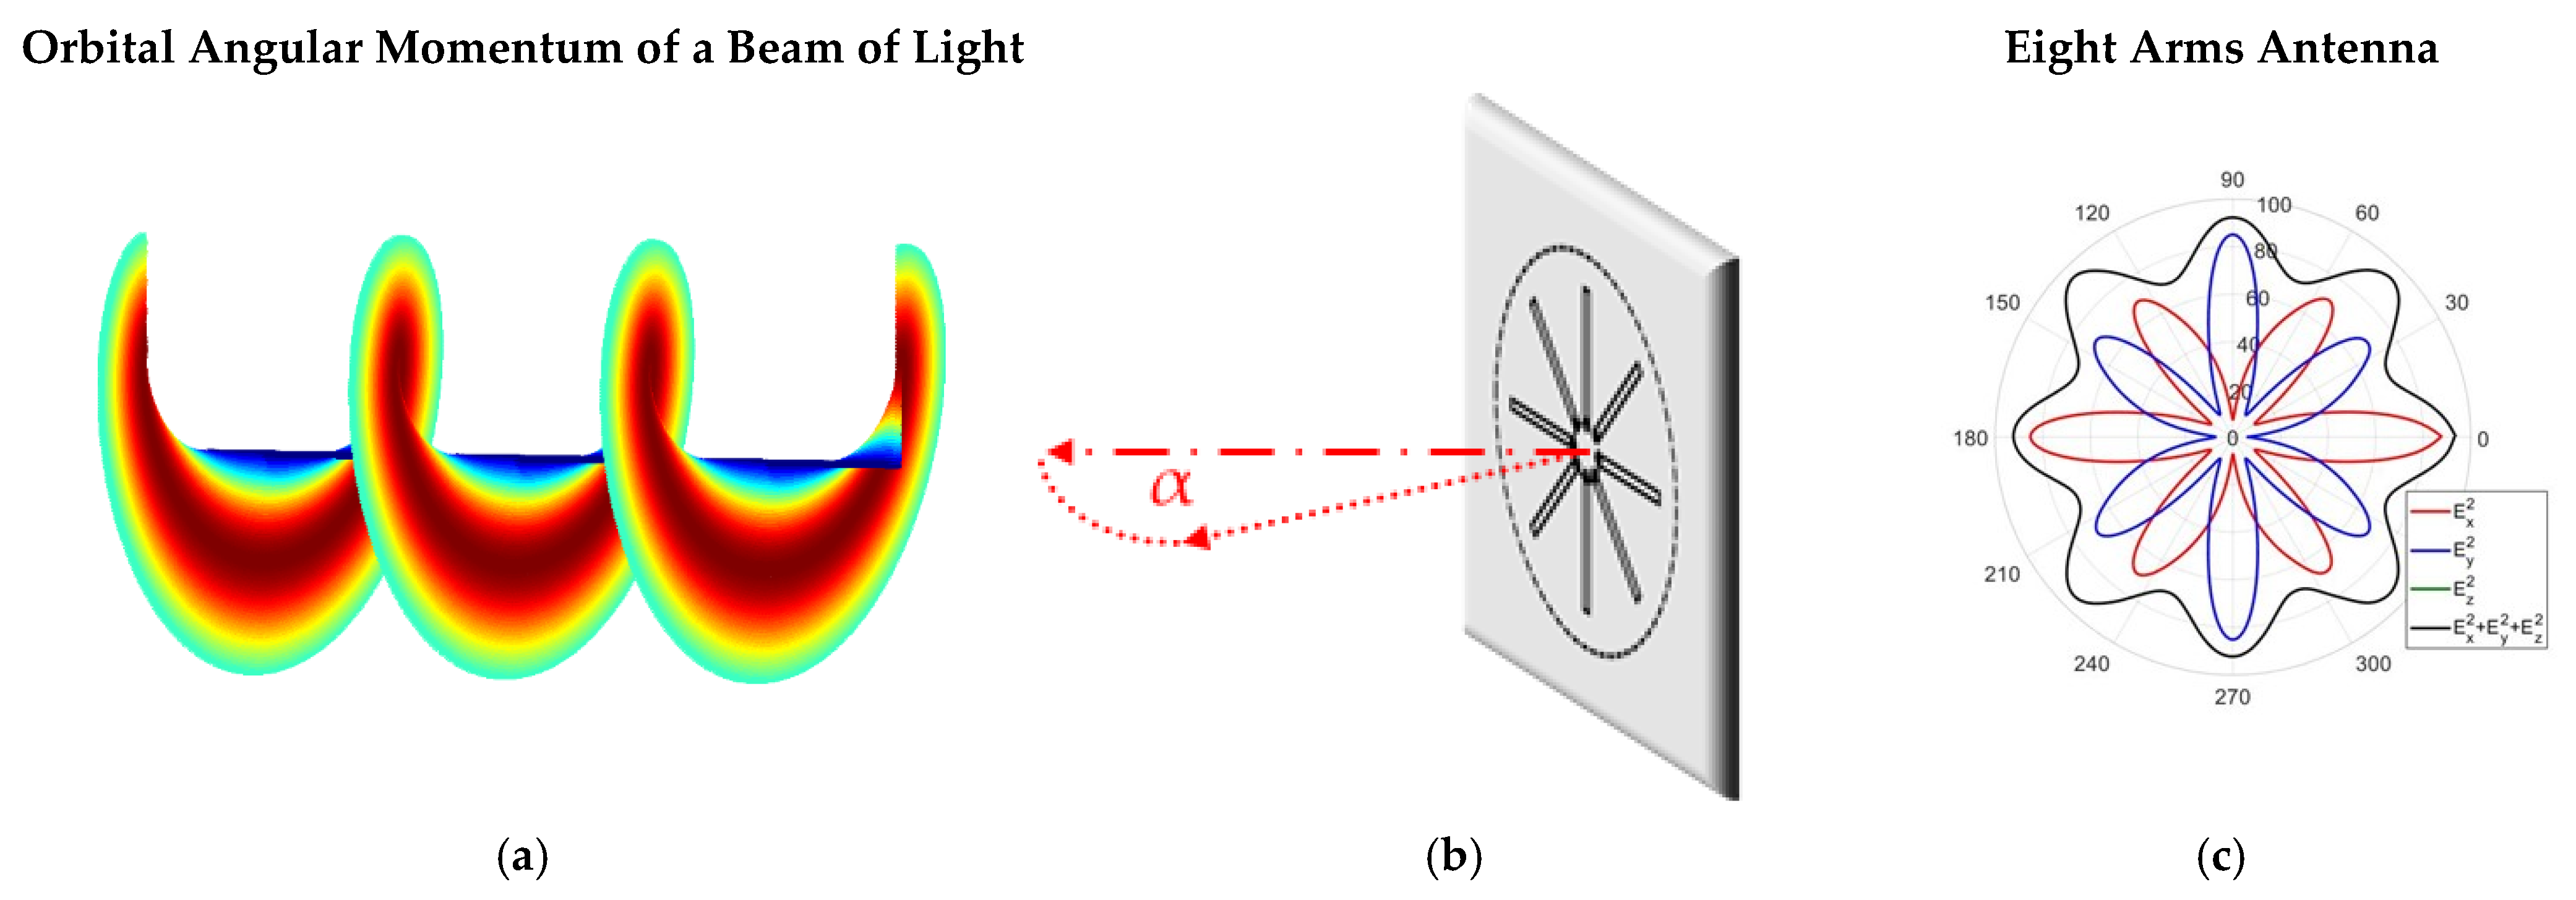
3.2. Eight-Arm Antenna: Corral

Figure 5 presents the figure of merit of the antenna, the intensity near the center of the antenna, and the intensity along a circular 75 nm radius path compared to the intensity with no antenna. The blue line shows the results for normal incidence and highlights the enhancement due to arms with an antenna matching lambda (~1800 nm), lambda over two (~900 nm), and lambda over three (~600 nm). Due to the symmetry, the results are produced in part for the 1D (colinear arms) and the 2D proximity of adjacent arms. The black line around the main resonant peak corresponds to the same antenna slanted at 22.5°, which is associated with the blurred gray shadows indicating loss of symmetry in the electric field to the antenna lines and, subsequently, a variation in the intensity, as indicated by the gradual gray shadow. The green line indicates the results for a 45° angle, and the blurred area indicates the intensity variation, which is quite severe in this case, limiting its use as an intensity homogenous amplifier at this angle for this frequency region, being even more severe at the other resonances.
The variability in the field enhanced corral is detailed in the Supplementary Materials, where Figure 6 coincides with Figure S4 and describes the norm of the electric field in a polar plot at ρ = 70 nm from the propagation axis. The symmetrical black dots are for normal incidence to the antenna and the others are for different locations of the slanted antenna center, resulting in an electric field corral distorted with larger variation in |E|.

3.3. Improved Illumination with Oblique Incidence

The reason for such intensity variation is the combination of the 1D and 2D structure of the antenna. The 1D colinear two-arm antenna has an enhancement of the electric field at the gap of the antenna and the external extremes of the antenna (Figure 4a). This enhancement is symmetrical in the electric field due to the symmetry in the antenna and the incident field preserving the incident beam properties. If the linear antenna is aligned with the slanted plane, the electric field enhancement loses its symmetry, which is readily noticeable because it erases the zero intensity in the antenna center. The 2D structure demands symmetry with the incident field that a normal antenna readily provides. On the other hand, a slanted antenna exposes each arm to a different electric field and phase, which enhances the properties of the incident beam, while being more difficult to preserve.
To compare the symmetry of field enhancement at the center of the antenna, a metric needs to be defined; the gain variation along a circular path near the antenna center, with a radius ρ < 80 nm, is free from the antenna. A uniform enhancement antenna will have a minimum gain variation. To decrease the gain variation along the path, a combination of (1) antenna defocusing (z-axis movement), (2) antenna misalignment (x and y movement) (see Table S1 in the Supplementary Materials, and (3) a simple antenna redesign changing rod length is proposed. For example, increasing the length of one antenna does not produce a measurable advantage (see Supplementary Figures S9–S16). However, a clear advantage is seen with a reduction to one arm (see Figures S17–S24).
Changing the antenna in a minute amount (30 nm) occurs in both directions. Fabrication variability may dominate a specific design linked to good performance; however, it opens the door to seek and try intentional variations in the design. Figures S26 and S28 illustrate such a possibility, with three arms 30 nm shorter at 90°, 135°, and 180°, where a noticeable improvement in the variability was identified.
Figure 7 illustrates the electric field norm, which is equal to the gain because it is normalized to the incoming beam, for an (LG) m = 1 beam over the antenna at normal incidence, where the symmetry helps to visualize the first three resonant frequencies. The insets a1, a2, and a3 show that the gain is largest for the first resonance. The insets b1, b2, and b3 show a 22.5° slanted antenna, and the insets c1, c2, and c3 for a 45° slanted antenna; in these last two cases, the loss of symmetry is evident as illustrated by the intensity in the corral.

4. Discussion

Realizing a plasmonic antenna interacting with light carrying orbital angular momentum (in our case, for an LG beam) faces many obstacles [30]; for normal incidence, the antenna size, the beam size, and the working wavelength demand conflicting requirements [31]. To work with larger antennas, one needs to work with higher resonances; this is in addition to the diminished properties of the dielectric constant at short wavelengths [32]. An antenna designed for 532 nm may have such a small footprint that it will be exposed to the center of the beam and, consequently, to a very small electric field. Figure 7a illustrates the enhanced intensity profile at the first three stationary waves that match the three peaks in Figure 5; labels a1, a2, and a3 correspond to 600, 850, and 1800 nm, respectively; the intensity is better appreciated in Figure 4, and the symmetry is shown in Figure 7. Figure 7b shows the gain profile at 1800 nm (first resonance) for incidence at 22.5°, at three planes parallel to the antenna: 50, 30, and 0 nm defocusing with labels b1, b2, and b3, respectively. In those images, whereby the horizontal axis (the x-axis) is used to rotate the antenna, the top part (positive y) is now at positive z, and the lower part (negative y) is at negative z. This image can be misleading if compared, due to different colors for the same intensity. Figure 7c presents pictures for the gain profile at 1800 nm for incidence at 45° at three planes parallel to the antenna: 50, 30, and 0 nm with labels c1, c2, and c3, respectively. In those images, the horizontal axis (the x-axis) is used to rotate the antenna, whereby the top part (positive y) is now at positive z, and the lower part (negative y) is at negative z. The intensity in the image should not be taken as a guide for the rotation.
This immediately shows the limitation of antennas at angles different from the normal incidence and gives some knowledge of how to construct an antenna for such angles. Two factors determine the efficiency of the antenna, usually conflicting: (1) the electric field magnitude of an LG beam over the antenna has its maximum further from the center as the beam diameter increases (shown in Figure 2b), and this decreased intensity makes the structure less effective as an antenna shifting the working frequency; (2) the rod length and central gap structure in the dipole antenna define the resonant frequency. In a multi-rod antenna, attempts to correct the slanted angle α are limited because the antenna sees a beam growing from 1 to 1/cos(α) in the two normal axes, and it is already doubling for α.
From the systematic results presented in the Supplementary Materials (Figures S17–S24), a reduction in one arm’s length is advantageous to compensate for the slanted angle, and a combination of lengths is even more convenient, presenting the possibility of partially correcting the effects of the slanted angle.

5. Conclusions

We discussed the effect of oblique illumination on the functioning of a plasmonic nanoantenna for chiral light. The objective of focusing the intensity profile of the electric field in an LG, m = 1 beam, while preserving its properties, is achievable with a nanoantenna. If the beam symmetry is available at the antenna plane, antenna geometry and alignment are needed, and a scale factor will suffice to adjust for the wavelength used, as suggested in Figure 2b, assuming the dielectric constant still has a negative real part, with a wavelength larger than 500 nm for gold. When the combination is a slanted antenna and an LG, m = 1 beam, adjustments in the distance between the beam focal plane and the antenna plane, as well as the position of the beam axis to the antenna axis, will be needed, as suggested in Figure 4, and the antenna needs to be designed by appropriately decreasing the arm’s length following the vortex structure in a way that increases the antenna’s usability. The study also showed that orbital angular momentum manipulation is possible with tilted light incidence, giving rise to a controlled intensity distribution, the interaction beam phase front, and the effects of possible tunable OAM with the nanoantenna’s geometry, which opens the door for controlling properties and optical manipulation technologies for advanced application [33].

Supplementary Materials

The following are available online at https://www.mdpi.com/article/10.3390/photonics8110504/s1.

Author Contributions

Conceptualization, R.Q.-T., M.S. and A.V.S.; Data curation, R.Q.-T., M.S. and A.V.S.; Formal analysis, R.Q.-T., M.S. and A.V.S.; Funding acquisition, R.Q.-T. and A.V.S.; Investigation, R.Q.-T., M.S. and A.V.S.; Methodology, R.Q.-T. and A.V.S.; Project administration, R.Q.-T. and A.V.S.; Resources, R.Q.-T. and A.V.S.; Software, R.Q.-T., M.S. and A.V.S.; Supervision, R.Q.-T. and A.V.S.; Validation, R.Q.-T., J.L.D.-J., M.S. and A.V.S.; Visualization, R.Q.-T., J.L.D.-J. and A.V.S.; Writing—original draft, R.Q.-T.; Writing—review & editing, R.Q.-T. and J.L.D.-J. All authors have read and agreed to the published version of the manuscript.

Funding

R.Q.-T. acknowledges the support from UNAM-DGAPA PASPA. We thank the Robert A. Welch Foundation (Award # A-1547) and the Texas A&M Triads for the Transformation program. J.L.D.J. thanks Catedras CONACYT-UNAM. R.Q.-T and J.L.D.J. wish to thank the financial support from CONACYT, under grant A1-S-8317.

Institutional Review Board Statement

Not applicable.

Informed Consent Statement

Not applicable.

Data Availability Statement

Data is contained within the article or supplementary material, correspondence and requests for materials should be addressed to R.Q.-T. (rquintero@fata.unam.mx).

Acknowledgments

Special thanks are given to Jose Luis Aragon Vera as a research project supervisor of CATEDRAS-CONACYT, grant number 1039, in the Centro de Física Aplicada y Tecnología Avanzada at the UNAM.

Conflicts of Interest

The authors declare no conflict of interest.

References

  1. Yu, H.; Peng, Y.; Yang, Y.; Li, Z.-Y. Plasmon-enhanced light–matter interactions and applications. NPJ Comput. Mater. 2019, 5, 45. [Google Scholar] [CrossRef]
  2. Wyrick, J.; Wang, X.; Kashid, R.V.; Namboodiri, P.; Schmucker, S.W.; Hagmann, J.A.; Liu, K.; Stewart, M.D., Jr.; Richter, C.A.; Bryant, G.W.; et al. Atom-by-Atom Fabrication of Single and Few Dopant Quantum Devices. Adv. Funct. Mater. 2019, 29, 1903475. [Google Scholar] [CrossRef]
  3. Kraemer, A.R.; Jones, R.W. Optical Antennas; International Foundation for Telemetering: Los Angeles, CA, USA, 14–16 November 1978. [Google Scholar]
  4. Krasnok, A.E.; Maksymov, I.S.; Denisyuk, A.I.; Belov, P.A.; Miroshnichenko, A.E.; Simovski, C.R.; Kivshar, Y.S. Optical nanoantennas. Physics-Uspekhi 2013, 56, 539–564. [Google Scholar] [CrossRef]
  5. Naidoo, D.; Roux, F.S.; Dudley, A.; Litvin, I.; Piccirillo, B.; Marrucci, L.; Forbes, A. Controlled generation of higher-order Poincaré sphere beams from a laser. Nat. Photonics 2016, 10, 327–332. [Google Scholar] [CrossRef] [Green Version]
  6. Holleczek, A.; Aiello, A.; Gabriel, C.; Marquardt, C.; Leuchs, G. Classical and quantum properties of cylindrically polarized beams of light via a Poincaré sphere representation. In Proceedings of the CLEO/Europe and EQEC 2011 Conference Digest, Munich, Germany, 5 May 2011; p. EA_P14. [Google Scholar]
  7. Shutova, M.; Shutov, A.; Sokolov, A. Spectroscopic Sensing Enhanced by Quantum Molecular Coherence and by Plasmonic Nanoantennas; SPIE OPTO: San Francisco, CA, USA, 2020; Volume 11296. [Google Scholar]
  8. Yue, Z.; Ren, H.; Wei, S.; Lin, J.; Gu, M. Angular-momentum nanometrology in an ultrathin plasmonic topological insulator film. Nat. Commun. 2018, 9, 4413. [Google Scholar] [CrossRef] [PubMed] [Green Version]
  9. Wang, M.; Huang, Z.; Salut, R.; Suarez, M.A.; Lu, H.; Martin, N.; Grosjean, T. Plasmonic Helical Nanoantenna As a Converter between Longitudinal Fields and Circularly Polarized Waves. Nano Lett. 2021, 21, 3410–3417. [Google Scholar] [CrossRef] [PubMed]
  10. Carli, M.; Zilio, P.; Garoli, D.; Giorgis, V.; Romanato, F. Sub-wavelength confinement of the orbital angular momentum of light probed by plasmonic nanorods resonances. Opt. Express 2014, 22, 26302–26311. [Google Scholar] [CrossRef] [PubMed]
  11. Tan, Q.; Guo, Q.; Liu, H.; Huang, X.; Zhang, S. Controlling the plasmonic orbital angular momentum by combining the geometric and dynamic phases. Nanoscale 2017, 9, 4944–4949. [Google Scholar] [CrossRef] [PubMed] [Green Version]
  12. Afanasev, A.; Carlson, C.E.; Schmiegelow, C.T.; Schulz, J.; Schmidt-Kaler, F.; Solyanik, M. Experimental verification of position-dependent angular-momentum selection rules for absorption of twisted light by a bound electron. New J. Phys. 2018, 20, 023032. [Google Scholar] [CrossRef] [Green Version]
  13. Schmiegelow, C.T.; Schulz, J.; Kaufmann, H.; Ruster, T.; Poschinger, U.G.; Schmidt-Kaler, F. Transfer of optical orbital angular momentum to a bound electron. Nat. Commun. 2016, 7, 12998. [Google Scholar] [CrossRef] [PubMed]
  14. Forbes, K.A.; Andrews, D.L. Spin-orbit interactions and chiroptical effects engaging orbital angular momentum of twisted light in chiral and achiral media. Phys. Rev. A 2019, 99, 023837. [Google Scholar] [CrossRef] [Green Version]
  15. Litvin, I.A.; Mueller, N.S.; Reich, S. Selective excitation of localized surface plasmons by structured light. Opt. Express 2020, 28, 24262–24274. [Google Scholar] [CrossRef] [PubMed]
  16. Fujiwara, H.; Sudo, K.; Sunaba, Y.; Pin, C.; Ishida, S.; Sasaki, K. Spin–Orbit Angular-Momentum Transfer from a Nanogap Surface Plasmon to a Trapped Nanodiamond. Nano Lett. 2021, 21, 6268–6273. [Google Scholar] [CrossRef]
  17. Kerber, R.M.; Fitzgerald, J.M.; Oh, S.S.; Reiter, D.E.; Hess, O. Orbital angular momentum dichroism in nanoantennas. Commun. Phys. 2018, 1, 87. [Google Scholar] [CrossRef]
  18. Arikawa, T.; Hiraoka, T.; Morimoto, S.; Blanchard, F.; Tani, S.; Tanaka, T.; Sakai, K.; Kitajima, H.; Sasaki, K.; Tanaka, K. Transfer of orbital angular momentum of light to plasmonic excitations in metamaterials. Sci. Adv. 2020, 6, eaay1977. [Google Scholar] [CrossRef] [PubMed]
  19. Jesus-Silva, A.J.; Fonseca, E.J.S.; Hickmann, J.M. Study of the birth of a vortex at Fraunhofer zone. Opt. Lett. 2012, 37, 4552–4554. [Google Scholar] [CrossRef]
  20. Zhang, Y.; Wu, Z.; Yuan, C.; Yao, X.; Lu, K.; Belić, M.; Zhang, Y. Optical vortices induced in nonlinear multilevel atomic vapors. Opt. Lett. 2012, 37, 4507–4509. [Google Scholar] [CrossRef] [PubMed] [Green Version]
  21. Lesina, A.C.; Berini, P.; Ramunno, L. Vectorial control of nonlinear emission via chiral butterfly nanoantennas: Generation of pure high order nonlinear vortex beams. Opt. Express 2017, 25, 2569–2582. [Google Scholar] [CrossRef] [Green Version]
  22. Ding, F.; Chen, Y.; Bozhevolnyi, S.I. Focused vortex-beam generation using gap-surface plasmon metasurfaces. Nanophotonics 2020, 9, 371–378. [Google Scholar] [CrossRef] [Green Version]
  23. Heeres, R.W.; Zwiller, V. Subwavelength Focusing of Light with Orbital Angular Momentum. Nano Lett. 2014, 14, 4598–4601. [Google Scholar] [CrossRef] [PubMed]
  24. Plick, W.N.; Krenn, M. Physical meaning of the radial index of Laguerre-Gauss beams. Phys. Rev. A 2015, 92, 063841. [Google Scholar] [CrossRef] [Green Version]
  25. Palik, E.D. Handbook of Optical Constants of Solids: Volume 1; Elsevier Science: Amsterdam, The Netherlands, 2012. [Google Scholar]
  26. Rakić, A.D.; Djurišić, A.B.; Elazar, J.M.; Majewski, M.L. Optical properties of metallic films for vertical-cavity optoelectronic devices. Appl. Opt. 1998, 37, 5271–5283. [Google Scholar] [CrossRef] [PubMed]
  27. Novotny, L.; van Hulst, N. Antennas for light. Nat. Photonics 2011, 5, 83–90. [Google Scholar] [CrossRef]
  28. Ghenuche, P.; Cherukulappurath, S.; Taminiau, T.H.; van Hulst, N.F.; Quidant, R. Spectroscopic Mode Mapping of Resonant Plasmon Nanoantennas. Phys. Rev. Lett. 2008, 101, 116805. [Google Scholar] [CrossRef] [PubMed] [Green Version]
  29. Novotny, L. Optical Antennas: A New Technology That Can Enhance Light-Matter Interactions. In Proceedings of the Frontiers of Engineering Reports on Leading-Edge Engineering from the 2009 Symposium, Washington, WA, USA, 10–12 September 2009; pp. 45–56. [Google Scholar]
  30. Hachtel, J.A.; Cho, S.-Y.; Davidson, R.B.; Feldman, M.A.; Chisholm, M.F.; Haglund, R.F.; Idrobo, J.C.; Pantelides, S.T.; Lawrie, B.J. Spatially and spectrally resolved orbital angular momentum interactions in plasmonic vortex generators. Light Sci. Appl. 2019, 8, 33. [Google Scholar] [CrossRef] [PubMed]
  31. Kerber, R.M.; Fitzgerald, J.M.; Reiter, D.E.; Oh, S.S.; Hess, O. Reading the Orbital Angular Momentum of Light Using Plasmonic Nanoantennas. ACS Photonics 2017, 4, 891–896. [Google Scholar] [CrossRef] [Green Version]
  32. Arikawa, T.; Morimoto, S.; Tanaka, K. Focusing light with orbital angular momentum by circular array antenna. Opt. Express 2017, 25, 13728–13735. [Google Scholar] [CrossRef]
  33. Shen, Y.; Wang, X.; Xie, Z.; Min, C.; Fu, X.; Liu, Q.; Gong, M.; Yuan, X. Optical vortices 30 years on: OAM manipulation from topological charge to multiple singularities. Light Sci. Appl. 2019, 8, 90. [Google Scholar] [CrossRef] [PubMed] [Green Version]
Figure 1. (a) Spatially structured field with an orbital angular momentum (OAM) of a beam of light. (b) Antenna geometry and antenna plane angle (α) relative to the electromagnetic wave propagation direction. (c) Antenna electric field squared at normal incidence. Due to the symmetry in normal incidence, Ez is approximately zero.
Photonics 08 00504 g001
Figure 2. (a) Cross-section profile of the electric field norm for a Gaussian beam ( m = 0 ) and Laguerre–Gauss beam ( m = 1 ). Both beams have ω 0 = 700 nm. (b) Electric field norm at r = 100 nm, near the center of the antenna and spatial location of the maximum beam intensity. Both numbers are a function of the beam radius at the focal plane.
Photonics 08 00504 g002
Figure 3. Antenna plane with the eight arms in addition to the simulation volume cross-section with a diameter of 1600 nm. (a) The distance mark is closer to the 200 nm inner circle of the antenna (twice the 100 nm identify in Figure 3b), and 40 nm is the width of the rod. (b) One-arm antenna geometry and antenna plane angle (α) relative to the electromagnetic wave propagation direction.
Photonics 08 00504 g003
Figure 4. (a) Linear antenna in a plane with the incident beam; the black line describes the incident electric field, and the blue line illustrates the electric field produced with an incident beam wavelength of 1550 nm, corresponding with the main resonance. The green line is produced with an incident beam wavelength of 1050 nm close to antiresonance, and the red line is produced with an incident beam wavelength of 790 nm close to the second resonance. (b) Linear antenna at 45°, slanted plane; the black line is the field produced by a beam with a wavelength of 1600 nm, and it is not a symmetrical profile; the red and blue lines are the effect of shifting the antenna 100 nm in the y-direction, where a positive movement helps the symmetry. Cyan and magenta lines are the effect of moving the antenna in the z-direction, where a negative movement also helps the symmetry.
Photonics 08 00504 g004
Figure 5. The figure of merit for the reference antenna, and its performance as a function of the angle between the propagation vector and antenna plane. Blue represents the normal incidence; black is 22.5°, and green is 45°. The blurred area illustrates the gain variability where the inset color (gray and green) shows the corresponding angle between the propagation vector and the antenna plane.
Photonics 08 00504 g005
Figure 6. Contour polar plot for the gain variability at 70 nm from the center and antenna center location, simulating defocusing with step displacement adjustments. (a) Norm of the total electric field at ρ = 70. The black REF line is for normal incidence, and other colors are for the 45° tilted antenna with position adjustments. (b) The symmetrical x-axis corresponds to normal incidence; the colored position adjustments also correspond to the 45° tilted antenna. The best conditions were obtained for y = −5 nm and z = +25 nm, whereas the worst were obtained for y = +25 nm and z = −25 nm.
Photonics 08 00504 g006
Figure 7. (a) Gain field for a beam at normal incidence to the antenna with an (LG) m = 1 at 600 nm, 850 nm, and 1800 nm wavelength excitation, for labels a1, a2, and a3, respectively. (b) Gain field for incidence at 22.5° to the antenna at 1800 nm wavelength excitation at 50 nm, 30 nm, and 0 nm over the antenna plane for labels b1, b2, and b3, respectively. (c) Gain field with an incident beam (LG) m = 1 at 45° to the antenna at 1800 nm wavelength excitation at 50 nm, 30 nm, and 0 nm over the antenna plane for labels c1, c2, and c3, respectively.
Photonics 08 00504 g007
Publisher’s Note: MDPI stays neutral with regard to jurisdictional claims in published maps and institutional affiliations.

