Communication

Wide Area Uniform Illumination Scheme Using LED Matrix for Optogenetic Cardiac Pacing

1
Tyndall National Institute, Lee Maltings Complex, Dyke Parade, T12 R5CP Cork, Ireland
2
School of Electrical Engineering, University College Cork, Western Road, T12 R229 Cork, Ireland
3
Institute of Physiology I, Medical Faculty, University of Bonn, 53127 Bonn, Germany
*
Author to whom correspondence should be addressed.
Photonics 2021, 8(11), 499; https://doi.org/10.3390/photonics8110499
Submission received: 15 August 2021 / Revised: 31 October 2021 / Accepted: 5 November 2021 / Published: 8 November 2021
(This article belongs to the Section Biophotonics and Biomedical Optics)

Abstract

:
Control of heart rhythm is vital in the case of arrhythmia. Cardiac optogenetics is a promising technique to replace electrical stimulation in a next generation of pacemakers and defibrillators. Therefore, further research towards optimizing light delivery methods is essential. A major requirement is the uniform stimulation of all cells in the area of interest while reducing side effects such as photodamage. Here, a 2 × 2 blue (470 nm, InGaN-based) light-emitting diode (LED) optoelectronic module for uniform ex vivo cardiac muscle illumination is demonstrated. It satisfies two important requirements in optogenetics, which are high illumination homogeneity and high irradiance. CCD camera images show an average 90% homogeneity over the central illumination area of close to 38 mm 2 at 1 cm distance from the light source. The module is used to perform physiological experiments on channelrhodopsin 2-expressing Langendorff-perfused mouse hearts. Successful ventricular pacing is obtained for an optical power density threshold below 2 mW/mm 2 with light pulses as short as 1 ms. For 10 ms long pulses, the threshold was below 0.2 mW/mm 2 . The large homogeneous illumination area enabled optogenetic pacing with less than half the optical power of previous attempts with smaller areas of 2 mm 2 and thus, presumably, will result in less phototoxicity.

1. Introduction

Optogenetics is an emerging hybrid technique, which combines genetics and optoelectronics in order to control cell activity. It was chosen by Nature Methods as the method of the year in 2010 due to its enormous capability to control single cell behavior and function with millisecond precision. Optogenetics enables optical control of the cell membrane potential with blue light (470 nm) in cells expressing Channelrhodopsin (ChR2), which is a light-activated cation channel [1]. In recent years, there has been a fast pace in the experimental realization of optogenetics concepts. Extensive research has been conducted in different biomedical fields such as fundamental neuroscience, for instance in genetically targeted brain cells for the functional analysis of neural networks. It can be used to gain new insights into conditions such as epilepsy [2], Parkinson’s disease [3], autism [4] and depression [5], as well as towards the creation of the next generation of implants and prosthetics such as deep brain stimulation electrodes [6,7], retina implants [8,9], cochlear implants [10,11] and spinal cord injury implants [12] or early stage experiments for restoring function to permanently denervated muscles in motor neuron diseases such as Amyotrophic Lateral Sclerosis (ALS) [13].
Regarding cardiology, there have been tremendous technological advancements in electrophysiology related studies and treatments. However, there are still many abnormalities, in particular fatal cardiac arrhythmia that require further advanced studies. Furthermore, the shortcomings of electrical stimulation in therapeutic cardiac electrophysiology-based devices, that is, cardiac pacemakers and implantable cardioverter defibrillators (ICDs) require alternative technologies to trigger or silence action potentials in cells with better spatio-temporal resolution. In electrical stimulation, the locally-induced action potentials propagate to electrically-coupled neighboring cells. Because of the controlled expression of opsins in selected cell-types, optogenetic stimulation can be a specific approach, not affecting sensory neurons, for terminating cardiac arrhythmia [14].

Problem Statement

The precise alteration of cellular activity to induce activation or inhibition simultaneously for the entire desired target area demands uniform light illumination. This is challenging, requiring high-quality illumination tools. With beam pattern non-uniformity over the targeted tissue, the optical power delivery will differ. This may cause either no stimulation or—on the other extreme—phototoxicity, photobleaching and change of pH due to excess optical power density. Current light delivery approaches for optogenetics mainly use LED light focused through the optical path of a microscope or macroscope onto the sample [15] or utilize fiber coupled laser or fiber-coupled LEDs [16,17,18,19,20,21]. The LED-coupled beam output profile is Gaussian shaped with maximum intensity in the center, decaying laterally as it spreads. This inhomogeneity can bring experimental limitations, especially in wide-area tissue illumination. Different methods have been proposed to achieve homogeneous illumination with a ‘top-hat’ profile. One method is the so-called Fly’s eye condenser, which consists of two periodic microlens arrays and a Fourier lens. However, the production of microlenses is costly and manufacturing tolerances for the lenses, as well as misalignment in the arrays, are issues.
Moreno et al. presented a method using the Sparrow criterion [22] for LED configurations to achieve uniform illumination distribution in the near-field. In this method, the irradiance distribution is dependent on m-value defined by the half angle and the relative position of LED chip from the encapsulant curvature center provided by the manufacturer [23]. We consider the LEDs as point sources and show the validity of the Sparrow criterion for millimeter-scale wide beam LEDs to form a more uniform beam by the overlap of the individual Gaussian distributions. This is achieved by reducing the minimum between adjacent maxima leading to a homogeneous distribution (see Appendix A).
Although the optogenetic pacing of mouse hearts can be performed by the illumination of areas as small as 0.05 mm 2 [24], much larger areas need to be depolarized for optogenetic termination of ventricular tachyarrhythmia or atrial fibrillation [25]. For example, 1 mW/mm 2 applied over 15 mm 2 or 0.4 mW/mm 2 applied over 143 mm 2 is required to induce enough uniform depolarization of the mouse ventricle for the successful termination of ventricular tachycardia [26]. Similarly, 0.4 mW/mm 2 applied over 10 mm 2 or 0.1 mW/mm 2 applied over 100 mm 2 is needed for the optogenetic termination of atrial fibrillation episodes [25]. Thus, there is a clear correlation between the illumination area and the required power density for optogenetic termination of cardiac arrhythmia.

2. Methods

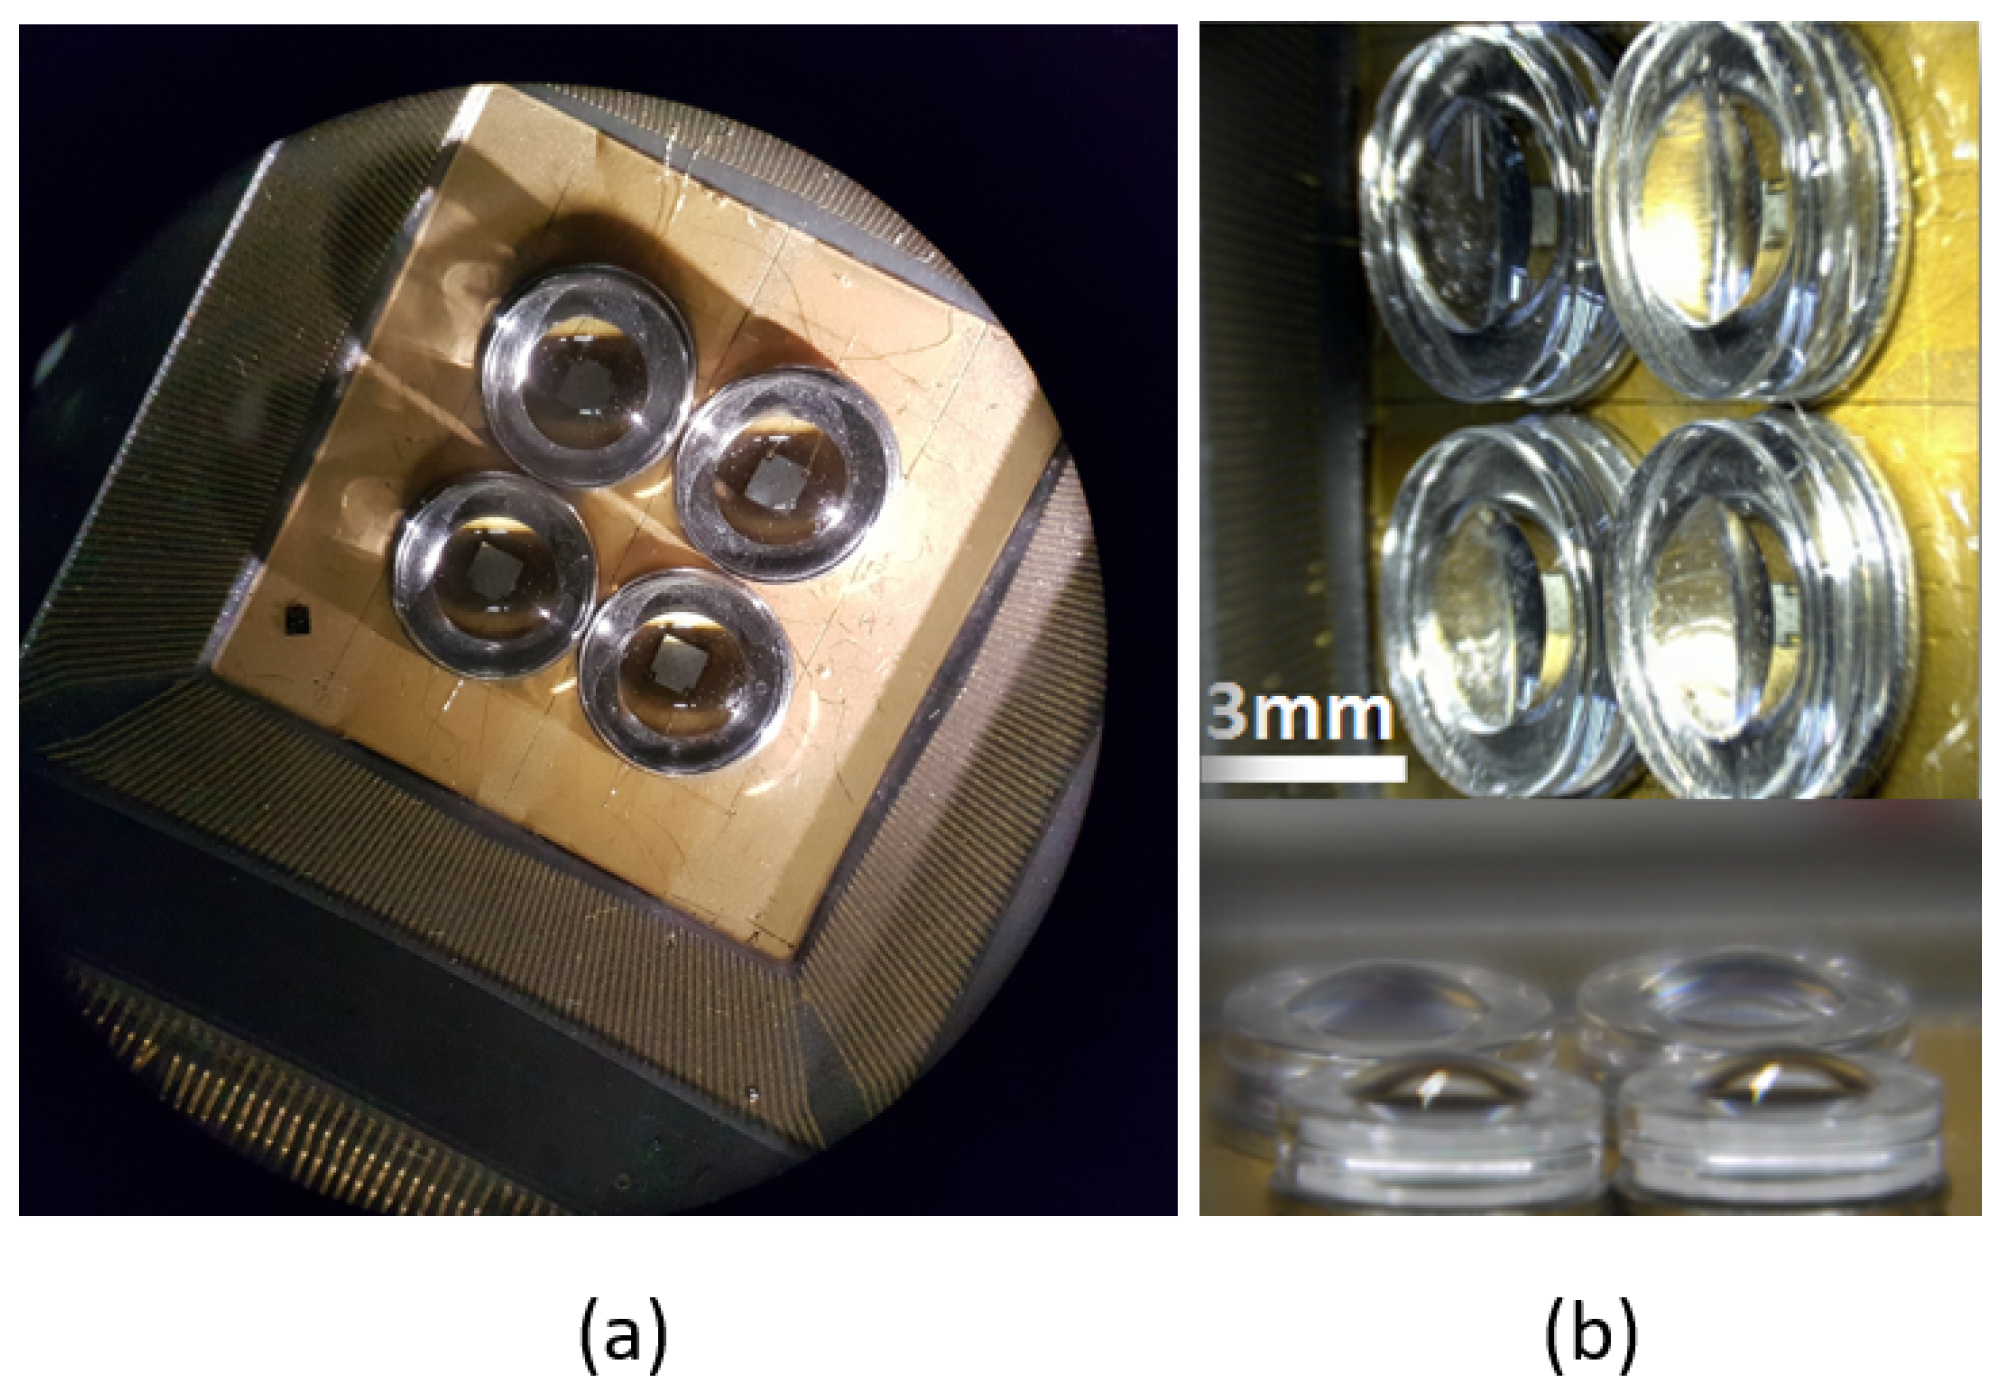
2.1. LED Matrix Design

We have addressed the issue of homogeneous illumination and delivered light to a target area at 1 cm between the source and the tissue, by overlapping the quasi-Gaussian beam distribution from two or four lens-coupled blue LEDs. By using the measured far field data from a single lensed LED, we calculate the pitch of LED needed for flat top beam generation and demonstrate 2 × 2 and 1 × 2 arrays for application in ex-vivo cardiac optogenetics. The most homogeneous central area of the LED matrix beam was designed to be 38 mm 2 . As mentioned earlier, the optimum spacing of each LED from its neighbor can be determined using the Sparrow criterion for the resolution limit in an optical system. This happens when the LED spacing D h o m o g e n = 2 σ ; this is equal to 6.4 mm and will lead to the most uniform beam pattern. Figure 1 illustrates a 2D projected visualization of a single, two element LED array and a four element LED matrix at 1 cm distance using Gaussian summation of the intensity from each LED.

2.2. Radiometry Measurements and Analysis of Single LED

The LED chips used were 930 μ m × 930 μ m, 170 μ m thick blue-emitting Cree LED chips (EZ950-p). They have a nominal maximum DC forward current of 1500 mA and 470 mW total radiant flux at 350 mA. The chip has two p (anode) bond-pads for current spreading located at two corners. The LED layers were grown on a thermally-conductive SiC substrate which assists heat dissipation from the p-n junction. In order to develop a module to provide uniform illumination, the light from each LED enters a Panasonic aspheric glass lens (EYLGULF387). The lens has a numerical aperture (NA) of 0.4, a focal length of 4.6 mm, an open diameter of 4 mm, an outer diameter of 6.4 mm and a total height of 2.5 mm. Glass lenses are chosen due to their high heat resistance.The angular distribution of the beam intensity (far-field) from single LEDs was measured using a goniometric radiometer (Labsphere LED-1100). The intensity plots without a lens and with a lens are shown in polar coordinates in Figure 2 (left). The radiation from the bare LED has a Lambertian profile, where the radiant intensity is proportional to the cosine of the angle between the direction of the incident light and the surface normal I ( θ ) = I 0 cos( θ ).
The addition of the lens changes the beam radiation pattern to a narrower, more directional beam. In Figure 2 (right), the intensity distribution projected at 1 cm is shown. This profile can be approximated to a Gaussian form with I ( x ) = I 0 e x p ( x 2 / 2 σ 2 ) , where σ is the spread parameter with σ = 3.2 mm.

2.3. Illuminator Assembly and Packaging

The LEDs are die-attached to a ceramic quad flatpack package using conductive silver paste. They are sequentially picked and placed using a FINETECH FD 3.2 flip chip bonder. The LEDs are spaced at 6.6 mm from each other to fit with a larger than desired size of lens holder. The dual p-bond pads of each LED are Au wire bonded to the package pads and arranged in a parallel circuit configuration. The wire bonds are insulated with cured optical adhesive to avoid short circuits. Lens holder rings are placed around the individual LEDs at pre-marked boundary lines. An aspheric glass lens is positioned on each metal holder using Norland UV cured optical adhesive, see Figure 3.

2.4. Set up for Optogenetic Cardiac Pacing with LED Devices

The effectiveness of LED devices for optogenetic pacing was tested in ChR2 expressing mouse hearts from transgenic CAG-ChR2-EYFP mice as previously described [24]. All animal experiments were performed in accordance with the European Guidelines for animal experiments 2010/63/EU. Ethical approval for animal experiments was not required because experiments were exclusively performed ex vivo on isolated hearts. Mice were sacrificed by cervical dislocation and explanted hearts were perfused in Langendorff configuration with Tyrode solution (in mM: 140 NaCl, 5.4 KCl, 2 MgCl 2 , 1.8 CaCl 2 , 10 HEPES and 10 Glucose, pH 7.4 with NaOH). The ECG was recorded from a silver-chloride electrode placed at the aorta and a metal spoon under the apex of the heart with a bio-amplifier system (PowerLab 8/35, Animal Bio Amp FE136, LabChart 8 software, AD Instruments), which was also used for LED pulse control. LEDs of the matrix were driven by a high-power constant current LED driver (DC2200, Thorlabs). LEDs were driven in a parallel configuration and shared the rated current each by 1/4 of total bias for four LED matrix and 1/2 for two LED matrix. The experiments started with the intact four LED matrix but later due to contact of LED wire bonds with water, two LEDs were disconnected. Therefore, only one experiment on one mouse with the four LED matrix is shown and three identical experiments on three different mice were performed with a two LED configuration. The LED module was placed parallel to the long cardiac axis (apex-base) with about 3 mm distance between the lenses and the heart in order to obtain homogeneous illumination of the anterior ventricular wall.
Using the four LED matrix, the illuminated area was about 204 mm 2 , which is much larger than the epicardial area of the mouse heart (70 mm 2 ). Because the illuminated area from the two LED matrix (106 mm 2 ) is much better at reflecting the epicardial area, only experiments with the two LED matrix were used for the quantification of optical power density.
To determine optogenetic pacing thresholds, 20 successive light pulses of the indicated duration (1, 2, 10 and 20 ms) were applied at a repetition rate of 50 bpm (beats per minute) above the intrinsic beating frequency. Light intensity was stepwise reduced with a resolution of 1 mA until pacing failed. The pacing threshold was defined as the lowest light intensity at which all of the last ten light pulses were reliably inducing ventricular extra beats. The width of the ECG QRS complexes is an indirect parameter describing the duration of ventricular activation and was measured using the LabChart peak analysis software module (full width at half maximum). Light intensity was measured with the power meter PM100A and sensor S170C (Thorlabs).

3. Results and Analysis

3.1. Optical Assessment of LED Matrix

An optical set up was used to experimentally determine the uniformity of the light emission from the LED matrix. A two inch single-side-polished sapphire wafer located at 1 cm from the source is used as a light diffusing plate, which captures the beam pattern from the LED matrix. Two anti-reflective coated plano-convex lenses are used to de-magnify the image onto a CCD camera. The first lens has a focal distance of 150 mm and is positioned at its focal point from the diffuser. The second lens is located at 50 mm focal distance from the Basler scout sc A1400-30fm camera with a Sony CCD imaging sensor (chip size 7 × 6 mm 2 ). A Neutral Density (ND) filter of OD = 2.0 (1% transmittance) is attached to the camera entrance aperture to attenuate the high illumination power of the LEDs and avoid saturation of the camera pixels.
The camera image in Figure 4 shows peak uniformity of 94% in the central vertical (a) and horizontal lines (c). An average 90% homogeneity in all four line scans including oblique lines is calculated. From the image, the most homogeneous distance covers 372 pixels (horizontal line scan of two LED distance) corresponding to a length of 7.19 mm (where each pixel is 6.45 μ m and a de-magnification of three related to the lenses is applied to the image). The small inhomogeneity in the camera images implies that the distance between LEDs should have been reduced in the fabricated device. One source of error is related to the metal lens-holder being larger than the diameter of the lens. Additionally, the internal resistance and thereby the forward voltage of each LED die is slightly different from the other. This causes differences in the light output of each LED (which can be observed in the camera image) and is another source of inhomogeneity. This issue can be fixed by the addition of a current regulator circuit for the LEDs to yield identical light output.
The irradiance is measured at different distances of a detector from the LED matrix as shown in Figure 5. The LED matrix is driven with 500 mA (125 mA per LED) in direct current (DC) mode, while the distance of the detector from the lens is varied by means of a Newport stepper motor. The detector is a Thorlabs FDS1010 Si photodiode with an attenuator and the photocurrent is measured with a Keithley 2000 multimeter. It can be seen, for example, that at 1 cm distance from the source, an optical power of about 1.5 mW/mm 2 over 100 mm 2 is measured.
Pulsed illumination is advantageous compared to DC as it leads to reduced total heat generation with reduced thermal damage and tissue necrosis in the vicinity. Additionally, pulsing provides higher peak power values than DC for the same average power, which allows for higher intensity and deeper penetration into the tissue if required. In optogenetics, the required frequency range is commonly below 40 Hz as the original variant of ChR2 has long decay kinetics ( > 10 ms), which can lead to slow repolarization of the cells and poor optical control at higher frequencies [27]. A pulse generator delivered 500 mA to the LED matrix (125 mA to each LED). The average optical power at modulated pulse widths for frequencies between 10 and 150 Hz was measured. A linear increase in average optical power with increasing duty cycle can be observed, see Figure 6. Additionally, a small increase in power with increasing frequency can be observed.
Transgenic hearts with ChR2 expression in all cardiomyocytes require ∼1 mW/mm 2 when using 5 ms long pulses applied to 2.0 mm 2 (from Figure 3c Bruegmann et al. [24]). However, only ∼40% of hearts with virus-based ChR2 expression could be paced with similar light pulses and intensities despite 10% larger illumination size (1 mW/mm 2 , 5 ms, 25 mm 2 , Figure 3D in Vogt et al. [28]).

3.2. Comparison of Thermal Properties in DC and Pulsed Modes

Operating LEDs at high bias result in an increased junction temperature and has an adverse effect on the device efficiency, light output and lifetime. It also leads to a blue shift of the wavelength. Pulsing the LEDs leads to efficient heat dissipation and easier thermal management which becomes specially more critical for in-vivo implants with integrated light sources. In order to understand the impact of bias in heating, thermal imaging in pulsed and DC mode has been performed using an infra-red (IR) camera (FLIR X6540 sc) with an accuracy of 1 °C. Current drive of 500 mA (125 mA per LED) is applied to the four LED matrix in DC mode and in pulsed mode with a 2 ms pulse width, 40 Hz (duty cycle of 8%). Differential thermal images between on- and off-states of an individual LED die from four LED matrix shows the temperature distribution related to pulsed and DC illumination modes (Figure 7). This indicates a temperature difference of only 1 °C for pulsed operation and 12 °C in DC over a ten second time duration.

3.3. Optogenetic Cardiac Pacing with the Four LED Matrix

In an initial experiment, the four LED matrix was placed above an explanted ChR2 expressing mouse heart perfused in Langendorff configuration so that the central most homogeneous part illuminated the anterior ventricular wall (Figure 8a). The application of brief light pulses of various durations resulted in ventricular pacing indicated by a higher stable heart rate, a change in QRS morphology and a 1:1 coupling of light pulses to ventricular extrabeats (Figure 8b).
The threshold for successful pacing was about 15 mA for all four LEDs (∼4 mA per LED) for pulses between 10 and 50 ms (Figure 8c). Importantly, even light pulses as brief as 1 ms reliably induced ventricular pacing if ∼120 mA was used for all four LEDs (30 mA per LED). Of note is that the LED currents used here for successful optogenetic pacing (4 mA for 10 ms up to 30 mA for 1 ms (per LED)) are >1 order of magnitude below the maximal forward current for the LEDs used in this device (1500 mA).

3.4. Reproducible Optogenetic Cardiac Pacing with the Two LED Matrix

The two LED matrix was placed above the long axis of the explanted hearts resulting in an effective illumination of ∼106 mm 2 . Overall, three experiments were performed with three individual hearts. Reliable optogenetic pacing was possible with the two LED (1 × 2 matrix) with light pulses between 1 and 20 ms indicated by a 1:1 coupling of light pulses to ventricular extrabeats (Figure 9a,b). Threshold determination showed that reliable pacing with the two LED matrix required 15 ± 2.95 mA using 10 ms pulses and 107 ± 30.3 mA using 1 ms pulses (both n = 3 hearts). Because the illumination area of the two LED device matched the mouse heart surface, we were able to measure LED optical power (in mW) and estimate the optical power density (in mW/mm 2 ) in dependence on the applied LED forward current (Figure 9c). This calculation was used to quantify the pacing effectiveness using light pulses between 1 and 20 ms (Figure 9d). Interestingly, we found that 1 ms short light pulses required only 1.3 ± 0.4 mW/mm 2 for reliable pacing, which is more than two times less than our previous attempts for optogenetic pacing (>3 mW/mm 2 at 1 ms) using an illumination area of 2 mm 2 (see Figure 3c in [24]). The quantification of the QRS duration, which is an indirect measure of duration and synchronicity of electrical activation showed that 1 ms light pulses resulted in QRS durations similar to those during the spontaneous sinus rhythm (Figure 9e). In contrast, pacing with 10 ms long light pulses required lower light intensities but this also led to longer QRS durations (Figure 9e).
This indicates a fast and synchronous ventricular activation using strong 1 ms pulses compared to a presumably less synchronous activation using longer but also weaker 10 ms light pulses. Thus, the large homogeneous illumination area of the two LED device allows successful pacing with lower optical power density and thereby presumably reduces phototoxicity during chronic optogenetic pacing. This becomes more important when using brief light pulses of 1 ms, which require higher light intensities but seem to be beneficial for synchronous activation of the ventricle.

4. Discussion

In this study, we demonstrated a simple, low-cost 2 × 2 blue InGaN/GaN LED-based matrix module with uniform illumination for ex-vivo optogenetics applications. The homogeneous spatial irradiance pattern was used for the successful optical pacing of a mouse heart. As the mouse heart size was smaller than the size of the four LED matrix, the advantage of the largest spot size illumination could not be tested. The design, simulation, assembly and assessment of the module performance was shown. The module requires the assembly of LED dies, supported lenses on a ceramic package with a component cost of <60 euro. This LED matrix can be scaled to larger dimensions for direct homogeneous illumination of tissue for larger illumination areas as well as the possibility of beam shaping. Credi et al. have used the LED illumination of multiwell plates for the investigation of cardiac electrophysiology. However, the uniformity and intensity of the light source on the plates was limited and a more homogeneous system was recommended [29]. Such a large area of homogeneous illumination could be generated by scaling our design to directly illuminate a multiwell plate.
A recent publication by Zgierski-Johnston et. al. has designed flexible implantable LED arrays for optogenetic pacing of mouse hearts [30]. Each LED (size 270 μ m × 220 μ m) had an aperture of diameter 50–100 μ m from which the light emerged. Stable pacing was obtained at 10 ms pulse duration with an emittance of 13.4 mW/mm 2 using one LED and of 8.9 mW/mm 2 using two LEDs. Using our two LED device, much lower values of only 0.2 mW/mm 2 were needed for stable pacing, which is most likely due to the much larger illumination area of the whole left ventricle ( 100 mm 2 ) compared to the small local illumination obtained from implanted LEDs (0.02 mm 2 ). Although for 10 ms pulses, our two LED system requires a much higher total radiant flux of 20 mW compared to the implanted two LED system of only 57.3 µW [30] the much lower local light intensities by global illumination could be less phototoxic to the cells, and the larger area allows synchronization of electrical activity.
Our two LED matrix was ideally suited to pace the heart even with short (1 ms) light pulses with optical power densities much lower than reported before, especially for such short light pulses. The short and strong light pulse enabled a faster and more synchronous activation of the ventricles, which could be beneficial for some cardiac pathologies such as bundle branch block or heart failure. Additionally, we observed approximately the same activation threshold current for two and four LED arrays. For the same area of the heart, the four LED matrix has half the required optical power density of the two LED matrix for stable pacing. This suggests that stimulation with a larger homogeneous spot is more effective for pacing. Nevertheless, to prove this point requires further studies. Further experiments, for instance, in combination with optical mapping, could be performed to precisely determine the effect of illumination size on ventricular activation and QRS duration. The multi LED concept could also be used for large illumination areas during in vivo applications. Future prospects can be envisaged for in vivo applications of miniaturized LEDs on guiding catheters, embedded in flexible polymer covering the organ.

Author Contributions

Conceptualization: I.I. & V.D.; LED matrix assembly: I.I. & N.N.; Measurement: I.I., V.D., K.G. & P.S.; Data curation: I.I., V.D. & A.T.; Formal analysis: I.I., V.D., A.T., K.G. & P.S.; Supervision: P.O., P.S. & B.C.; Writing: I.I., V.D., K.G., P.S. & B.C. All authors have read and agreed to the published version of the manuscript.

Funding

Funding by the Irish Photonic Integration Centre (IPIC), a Science Foundation Ireland (SFI) research center (project number IPIC-12/RC/2276-P2) is gratefully acknowledged. This work was also supported by the German Research Foundation [380524518/SA1785/9-1, 214362475/GRK1873/2] and by the German Federal Ministry of Education and Research, funding program Photonics Research Germany, project BioPACE (13N14087).

Acknowledgments

We thank Tobias Bruegmann (Goettingen University) for initial discussions on the LED device requirements.

Conflicts of Interest

The authors declare no conflict of interest.

Appendix A

In Equation (A1), the Sparrow criterion is applied for summation of two LEDs using standard Gaussian function formula.
g s u m ( x ) = 1 σ 1 2 π e ( x μ 1 ) 2 2 σ 1 2 + 1 σ 2 2 π e ( x μ 2 ) 2 2 σ 2 2
where σ 1 , σ 2 are the standard deviations and μ 1 , μ 1 mean values or the positions of the peak centers.
We assume that σ 1 = σ 2 and μ 1 = μ 2 . Putting the second derivative of the summation equal to zero:
d 2 g s u m ( x ) d x 2 | ( x = 0 ) = 0
Therefore we have:
μ 1 = ± σ 1 , μ 2 = ± σ 2
Optimum separation ( D h o m o g e n ) of two LEDs for having uniform illumination distribution is D h o m o g e n = 2 μ i = 2 σ i , i = 1 , 2

References

  1. Nagel, G.; Szellas, T.; Huhn, W.; Kateriya, S.; Adeishvili, N.; Berthold, P.; Ollig, D.; Hegemann, P.; Bamberg, E. Channelrhodopsin-2, a directly light-gated cation-selective membrane channel. Proc. Natl. Acad. Sci. USA 2003, 100, 13940–13945. [Google Scholar] [CrossRef] [Green Version]
  2. Elvis, C.; Sjöström, P.J. Novel Optogenetic Approaches in Epilepsy Research. Front. Neurosci. 2019, 13, 947. [Google Scholar]
  3. Chen, Y.; Xiong, M.; Zhang, S.C. Illuminating Parkinson’s therapy with optogenetics. Nat. Biotechnol. 2015, 33, 149–150. [Google Scholar] [CrossRef] [Green Version]
  4. Seyed Javad Javaheri, E.S.; Bigdeli, M.R.; Zibaii, M.I.; Dargahi, L.; Pouretemad, H.R. Optogenetic Stimulation of the Anterior Cingulate Cortex Ameliorates Autistic-Like Behaviors in Rats Induced by Neonatal Isolation, Caudate Putamen as a Site for Alteration. NeuroMol. Med. 2019, 21, 132–142. [Google Scholar] [CrossRef]
  5. Muir, J.; Lopez, J.; Bagot, R.C. Wiring the depressed brain: Optogenetic and chemogenetic circuit interrogation in animal models of depression. Neuropsychopharmacology 2019, 44, 1013–1026. [Google Scholar] [CrossRef]
  6. Carter, M.E.; de Lecea, L. Optogenetic investigation of neural circuits in vivo. Trends Mol. Med. 2011, 17, 4. [Google Scholar] [CrossRef] [Green Version]
  7. Packer, A.M.; Roska, B.; Haeusser, M. Targeting neurons and photons for optogenetics. Nat. Neurosci. 2013, 16, 805–815. [Google Scholar] [CrossRef] [Green Version]
  8. Barret, J.M.; Palmini, R.B.; Degenaar, P. Optogenetic approaches to retinal prosthesis. Vis. Neurosci. 2014, 31, 345–354. [Google Scholar] [CrossRef]
  9. McGovern, B.; Drakakis, E.; Neil, M.; O’Brian, P.; Corbett, B.; Berlinguer-Palmini, R.; Degenaar, P. Individually addressable optoelectronic arrays for optogenetic neural stimulation. In Proceedings of the IEEE Biomedical Circuits and Systems Conference (BioCAS), San Diego, CA, USA, 10–12 November 2011; pp. 329–332. [Google Scholar]
  10. Jeschke, M.; Moser, T. Considering optogenetic stimulation for cochlear implants. Hear. Res. 2015, 322, 224–234. [Google Scholar] [CrossRef]
  11. Gossler, C.; Bierbrauer, C.; Moser, R.; Kunzer, M.; Holc, K.; Pletschen, W.; Koehler, K.; Wagner, J.; Schwaerzle, M.; Ruther, P.; et al. Gan-based micro-led arrays on flexible substrates for optical cochlear implants. J. Phys. D Appl. Phys. 2014, 47, 205401. [Google Scholar] [CrossRef]
  12. Samineni, V.K.; Yoon, J.; Crawford, K.E.; Jeong, Y.R.; McKenzie, K.C.; Shin, G.; Xie, Z.; Sundaram, S.S.; Li, Y.; Yang, M.Y.; et al. Fully implantable, battery-free wireless optoelectronic devices for spinal optogenetics. Pain 2017, 158, 2108–2116. [Google Scholar] [CrossRef]
  13. Magown, P.; Shettar, B.; Zhang, Y.; Rafuse, V.F. Direct optical activation of skeletal muscle fibres efficiently controls muscle contraction and attenuates denervation atrophy. Nat. Commun. 2015, 6, 8506. [Google Scholar] [CrossRef] [Green Version]
  14. Sasse, P.; Funken, M.; Beiert, T.; Bruegmann, T. Optogenetic Termination of Cardiac Arrhythmia: Mechanistic Enlightenment and Therapeutic Application? Front. Physiol. 2019, 10, 675. [Google Scholar] [CrossRef]
  15. Jia, Z.; Valiunas, V.; Lu, Z.; Bien, H.; Liu, H.; Wang, Z.H.; Rosati, B.; Brink, P.; Cohen, I.; Entcheva, E. Stimulating cardiac muscle by light cardiac optogenetics by cell delivery. Circ. Arrhythm. Electrophysiol. 2011, 4, 753–760. [Google Scholar] [CrossRef] [Green Version]
  16. Nussinovitch, U.; Shinnawi, R.; Gepstein, L. Modulation of cardiac tissue electrophysiological properties with light-sensitive proteins. Cardiovasc. Res. 2014, 102, 176–187. [Google Scholar] [CrossRef] [PubMed]
  17. Aravanis, A.M.; Wang, L.P.; Zhang, F.; Meltzer, L.A.; Mogri, M.Z.; Schneider, M.B.; Deisseroth, K. An optical neural interface: In vivo control of rodent motor cortex with integrated fiberoptic and optogenetic technology. J. Neural Eng. 2007, 4, S143–S156. [Google Scholar] [CrossRef]
  18. Huber, D.; Petreanu, L.; Ghitani, N.; Ranade, S.; Hromadka, T.; Mainen, Z.; Svoboda, K. Sparse optical microstimulation in barrel cortex drives learned behaviour in freely moving mice. Nat. Lett. 2008, 451, 61–65. [Google Scholar] [CrossRef] [PubMed]
  19. Gradinaru, V.; Thompson, K.R.; Zhang, F.; Mogri, M.; Kay, K.; Schneider, M.B.; Deisseroth, K. Targeting and readout strategies for fast optical neural control in vitro and in vivo. J. Neurosci. 2007, 27, 14231–14238. [Google Scholar] [CrossRef]
  20. Boyle, P.M.; Williams, J.C.; Ambrosi, C.M.; Entcheva, E.; Trayanova, N.A. A comprehensive multiscale framework for simulating optogenetics in the heart. Nat. Commun. 2013, 4, 2370. [Google Scholar] [CrossRef] [PubMed] [Green Version]
  21. Ferenczi, E.A.; Tan, X.; Huang, C.L.-H. Principles of Optogenetic Methods and Their Application to Cardiac Experimental Systems. Front. Physiol. 2019, 10, 1096. [Google Scholar] [CrossRef]
  22. Sparrow, C. On Spectroscopic Resolving Power. Astrophys. J. 1916, 44, 76. [Google Scholar] [CrossRef]
  23. Moreno, I.; Avendaño-Alejo, M.; Tzonchev, R.I. Designing light-emitting diode arrays for uniform near-field irradiance. Appl. Opt. 2006, 45, 10. [Google Scholar] [CrossRef]
  24. Bruegmann, T.; Malan, D.; Hesse, M.; Beiert, T.; Fuegemann, J.C.; Fleischmann, K.B.; Sasse, P. Optogenetic control of heart muscle in vitro and in vivo. Nat. Methods 2010, 7, 897–900. [Google Scholar] [CrossRef]
  25. Bruegmann, T.; Beiert, T.; Vogt, C.C.; Schrickel, J.W.; Sasse, P. Optogenetic termination of atrial fibrillation in mice. J. Cardiovasc. Res. 2018, 114, 713–723. [Google Scholar] [CrossRef]
  26. Bruegmann, T.; Boyle, P.M.; Vogt, C.C.; Karathanos, T.V.; Arevalo, H.J.; Fleischmann, B.K.; Trayanova, N.A.; Sasse, P. Optogenetic defibrillation terminates ventricular arrhythmia in mouse hearts and human simulations. J. Clin. Investig. 2016, 126, 3894–3904. [Google Scholar] [CrossRef] [PubMed]
  27. Tucci, V. Handbook of Neurobehavioral Genetics and Phenotyping; John Wiley & Sons: Hoboken, NJ, USA, 2016; p. 471. [Google Scholar]
  28. Vogt, C.C.; Bruegmann, T.; Malan, D.; Ottersbach, A.; Roell, W.; Fleischmann, K.B.; Sasse, P. Systemic gene transfer enables optogenetic pacing of mouse hearts. Cardiovasc. Res. 2015, 106, 338–343. [Google Scholar] [CrossRef] [PubMed] [Green Version]
  29. Credi, C.; Balducci, V.; Munagala, U.; Cianca, C.; Bigiarini, S.; de Vries, A.F.; Loew, L.M.; Pavone, F.S.; Cerbai, E.; Sartiani, L.; et al. Fast Optical Investigation of Cardiac Electrophysiology by Parallel Detection in Multiwell Plates. Front. Physiol. 2021, 12, 1439. [Google Scholar] [CrossRef]
  30. Zgierski-Johnston, C.M.; Ayub, S.; Fernández, M.C.; Rog-Zielinska, E.A.; Barz, F.; Paul, O.; Kohl, P.; Ruther, P. Cardiac pacing using transmural multi-LED probes in channelrhodopsin-expressing mouse hearts. Prog. Biophys. Mol. Biol. 2020, 154, 51–61. [Google Scholar] [CrossRef]
Figure 1. Two-dimensional (2D) visualization at 1 cm distance from source related to a single LED, two LEDs and four LED matrix with optimal spacing of 6.4 mm. The color scales are normalised and in arbitrary units.
Photonics 08 00499 g001
Figure 2. (left) Angular far-field from a single LED with and without lens at 125 mA bias, (right) LED with lens light intensity versus spot size with Gaussian fit.
Photonics 08 00499 g002
Figure 3. (a) LED matrix on ceramic quad flatpack. (b) Optical microscope image of LED matrix with aspheric lenses.
Photonics 08 00499 g003
Figure 4. Re-imaged far field from the LED matrix at 1 cm from source with line scans showing the pixel homogeneity level. The peak deviation from uniformity values for 4 indicated line scans in the image are (a): 6%, (b): 10%, (c): 6%, (d): 15.6%, respectively.
Photonics 08 00499 g004
Figure 5. Optical power density over 100 mm 2 versus distance between the detector and the source with 500 mA applied to the matrix.
Photonics 08 00499 g005
Figure 6. Optical power versus frequency at 1 cm distance between source and detector, with 500 mA bias (125 mA to each LED) for different duty cycles over 10 s integration time.
Photonics 08 00499 g006
Figure 7. Spatially resolved differential temperature distribution across the surface of a single LED from a 2 × 2 matrix with 125 mA into the LED in pulsed mode (left) and DC (right). The LED dimension is 930 μ m × 930 μ m. The colorbar unit is °C.
Photonics 08 00499 g007
Figure 8. (a) Horizontally placed explanted mouse heart perfused in Langendorff configuration with the four LED matrix placed about 3 mm above for illuminating the left anterior ventricular wall of ∼10 mm × 7 mm. (b) Example trace for optogenetic pacing at 300 beats per minute (bpm) with 10 ms light pulses (blue line top, indicating TTL trigger voltage for the constant current driver), ECG traces (in mV, middle) and heart rate analysis (in bpm, lower). Note the change in ECG shape due to ventricular pacing, the 1:1 coupling to light pulses and the stable heart rate upon pacing. (c) Threshold current for reliable optogenetic pacing versus pulse duration for the four LED matrix.
Photonics 08 00499 g008
Figure 9. (a) Example trace for optogenetic pacing with the two LED matrix at 300 beats per minute (bpm) with 10 ms light pulses (blue line top indicating LED trigger), ECG traces (in mV, middle) and heart rate analysis (in bpm, lower). (b) Examples of QRS complexes triggered by 10 ms (top) and 1 ms (lower) light pulses (blue bars). (c) Measured optical power and estimated optical power density in dependence on the cumulative current applied to all LEDs from the two LED matrix (divide by 2 for individual LED current). (d) Analysis of threshold cumulative LED current and overall optical power density for reliable optogenetic pacing for different pulse durations. (e) Analysis of QRS duration during sinus rhythm (SR) and during optogenetic pacing with 1 ms and 10 ms light pulses from three different hearts (data points from each mouse heart connected by black line).
Photonics 08 00499 g009
Publisher’s Note: MDPI stays neutral with regard to jurisdictional claims in published maps and institutional affiliations.

