1. Introduction
The constant increase in the need for high-quality food products, their efficient production, and storage in sterile conditions is caused not only by the growth of population, but also by the emergence of new diseases affecting huge stocks of food products. In this regard, technologies for storing agricultural products and registering and predicting infection are needed at early stages. The study of the physical properties of infected plants and seeds is of fundamental importance for determining crop losses, conducting a disease survey, setting thresholds when making decisions, obtaining new knowledge about the epidemiology of diseases, and evaluating the effectiveness of combating them (assessing the resistance of crops and varieties, the effect of fungicides, etc.).
The first methods of determining the degree of infection are visual, but they are subjective, and they show themselves to be ineffective and inaccurate at the early stages of infection. The diagnosis is carried out manually, analyzing such indicators as the shape of grain, the characteristics of its surface (surface color and gloss), the structure of the endosperm (vitreous, consistency), the color of the embryo, etc.
Laboratory methods do not have such disadvantages. They have a fairly high accuracy and reproducibility, but large time and economic costs also do not make them optimal for predicting food contamination. Mycological analysis, enzyme immunoassay, real-time PCR [
1,
2], and quantitative digital PCR, using markers based on intergenic spacers [
3], are used to diagnose fusarium lesions. The common disadvantages of these methods are extremely expensive equipment and reagents, the duration of the analysis of up to 7–10 days, and the need for highly qualified specialists to conduct them.
Technologies that can replace or complement visual assessments are sensor-based image analysis, including visible spectrum sensors, and hyperspectral (HSI) and multispectral (MSI) sensors [
4,
5,
6,
7,
8,
9,
10]. These technologies make it possible to accurately measure the severity of the disease in controlled conditions, but have not yet demonstrated their full potential for accurate measurement in field conditions. Sensor technology is developing rapidly, and artificial intelligence can help overcome problems with measurement automation [
11,
12].
Unlike RGB cameras, which have a spatial resolution of several megapixels, spectral sensors have a higher resolution [
13]. HSI and MSI sensors evaluate narrow wave ranges combined with high spatial resolution. The visible and near-infrared regions have the greatest amount of information for monitoring plant stress. The ultraviolet range [
14] and the SWIR range [
15] also provide information. Spectral sensors can be characterized by the resolution and the type of a detector. Often, MSI sensors cover the visible and near-infrared range, but provide less data due to lower spectral resolution, although they are lightweight and cheaper [
13]. On the contrary, HSI sensors are more complex, heavy, expensive, and measurements take longer and require strict protocols. The systems consist of a sensor, a light source, and a control unit for measuring, storing, and processing data [
16].
There are also other sensory methods for quantifying diseases or pathogens (thermal imaging, chlorophyll fluorescence).
To date, photoluminescent diagnostic methods in the ultraviolet and visible ranges have not been studied. They, as with other optical methods, are highly accurate, selective, expressive, as well as distant and non-destructive; moreover, they have lower economic costs compared to previous methods. Their other advantages are the simplicity and safety of operation of devices for their implementation, a minimum of subjective factors and the possibility of integration into existing modern agricultural machines and units.
Chlorophyll fluorescence is a promising method for research the quality of fruit after harvest. The HSI method was used to measure the laser-induced fluorescence of apple fruit to predict several parameters of fruit quality [
17]. Reducing the chlorophyll content in plant leaves is a means of early diagnosis of plant diseases. The occurrence of diseases affects the fluorescence of phenolic compounds and chlorophyll in grapefruit fruit [
18] and other citrus fruit [
19]. The fluorescence spectra of the surface parts of healthy and infected apples and potatoes were studied [
20]. Two zones were found for apples, where the radiation spectra of healthy samples and samples affected by scab differed significantly from each other. A similar zone was found for potato root crops. The revealed differences in fluorescence spectra can be used to detect and separate diseased and healthy fruit and vegetables. In our work, we search for spectral regions, characteristics, and parameters of excitation and luminescence spectra to determine winter wheat seeds infected with pathogenic
Fusarium microflora.
2. Materials and Methods
One of the most common and dangerous diseases for plants, and no less dangerous for humans, is fusarium, the causative agents of which are fungi of the genus fusarium. Winter wheat seeds were used as biomaterial.
Obtaining the spectral characteristics of the luminescence of winter wheat seeds “Irishka No. 172”. Pedigree: Ind. O. from a hybrid population created with the participation of a ligulless line of mutant origin 86 lg 333 and varieties Obriy, Skifianka. Included in the State Register for the North Caucasus (6) region. Recommended for cultivation in the North, West-delta, South-foothill zones of the Krasnodar Territory; in the Central zone of the Stavropol Territory; Priazovskaya, southern and eastern zones of the Rostov region. A kind of lutescens. Colored caryopsis. The mass of 1000 grains is 34–45 g. The average yield in the region is 48.2 c/ha. In the Krasnodar Territory, black and busy steam, the increase to the Palpich standard was 3.9 c/ha, in the southern and eastern zones of the Rostov region to the standard Zernogradka 10–5.7 c/ha, in the Central, Mountain and Foothill zones of the Stavropol Territory. Row-crop predecessors to the average standard−3.5 c/ha had a yield of 58.7; 64.7 and 59.0 c/ha, respectively. Valuable wheat: According to the applicant, highly resistant to storm and stem rust; moderately resistant to yellow rust, powdery mildew; moderately susceptible to septoria and fusarium spike; moderately susceptible to hard smut. Properties of the Irishka variety: Recommended region: North Caucasian. Direction of use: valuable in terms of quality Ripening period: medium early. This sample is the harvest of 2020, the Central Black Earth zone of Russia.
In the studied seed fractions, the degree of damage to p. Fusarium seeds was determined. The research was conducted at the Federal Center for Safety and Quality Assessment of Grain and Processed Products by the Federal Service for Veterinary and Phytosanitary Surveillance. Sample weight −3.2 kg. Definition of fusarium grains according to GOST 31646-2012 (RF) “Grain crops. Method for determining the content of fusarium grains”. Equipment: liquid Prominence chromatograph with spectroscopic detector SPD-M20A, spectrofluorimetric detector RF-20AXS. The degree of seed damage was 98%.
The study of luminescence was carried out based on the hardware and software complex consisting of the multifunctional spectrofluorometer “Fluorat-02-Panorama”, a computer with the software “Panorama Pro” installed and an external camera for the samples under study. During measurements, the intensity of the luminescence photosignal depends on the intensity of excitation. This is taken into account in the Panorama Pro program. Additionally, the photo signal depends on the exposure time (
t = 1.5 microseconds) and the sensitivity of the photoelectric multiplier. These parameters, as well as the parameters of the radiation source, remain unchanged when measuring healthy and infected seeds. The measurement of the excitation and photoluminescence spectra was carried out similarly to the previously performed measurements [
21].
The excitation specters η
e (λ) and on their basis, the luminescence specters
φl (λ) were measured with synchronous scanning. Synchronous scanning involves simultaneous restructuring of the monochromators of the excitation channels and registration of luminescence at a fixed value of their displacement, preferably close to the Stokes shift. In this case, the maximum value of the signal is obtained. The statistical processing was carried out according to the measurement results, where averaging over 250 specters was carried out. In the PanoramaPro program, the integral parameters of the H and Φ spectra were calculated. The latter is the photoluminescence flux expressed in relative units (r. u.).
ηe(λ) is the spectral characteristics of the excitation
λ
1…λ
2 are limits of the operating spectral range of excitation.
φl(λ) is spectral characteristics of photoluminescence,
λ1…λ2 are limits of the operating spectral range of photoluminescence.
The photoluminescence spectrum is continuous, and it is continuous in the range of measured wavelengths. The mathematical expectation (mean value)
Mλ is determined by the integral:
where
φ(λ) is differential distribution function (probability density distribution);
λ is wavelength, nm;
λmin, λmax are minimum and maximum value of wavelength range of photoluminescence measurements, nm.
Dispersion σ
2 is determined by the formula:
The numerical characteristic of the asymmetry (skewness) is the central static moment of the 3rd order μ
3:
In practice, the asymmetry coefficient is used to evaluate the asymmetry
As:
where σ is the standard deviation.
With right-sided asymmetry (the “tail” of the spectrum curve is stretched to the right)
As > 0. With left-sided symmetry (the “tail” of the spectrum curve is stretched to the left)
As < 0. The numerical characteristic of the steepness of the spectrum is the estimate of the central static moment of the 4th order μ
4:
In practice, an artificially created value is taken as an estimate of the steepness coefficient, which is called the kurtosis
Eλ:
For curves that are steeper (more island-like) than the curve of the normal distribution (bell-shaped curve), the kurtosis is positive, and the kurtosis is negative for
The largest absolute value of the negative kurtosis is 2. At this value, the vertex of the curve falls to the kurtosis axis and the curve is divided into two independent peaks and their analysis should be considered separately. The positive value of the kurtosis can be any type.
To obtain the equation of the numerical characteristic of the photoluminescence energy, it should be taken into account that each photon of photoluminescence has an energy associated with the radiation wavelength by the ratio:
where
Eph is measured in
eV, and λ—in nm. If the differential distribution function
φ(λ) is known, then the total energy of the spectrum in the wavelength range is as:
To select the optimal value of the monochromator displacement, the spectral characteristics of the excitation were measured during synchronous scanning of wheat seeds in the spectral range of 180–700 nm.
To implement this stage, 20 uninfected wheat seeds were selected, after which a synchronous scan of each seed was performed, followed by averaging the results.
The next stage of spectrum processing is their decomposition into elementary bands. One of the main problems of high-quality photoluminescence analysis is the separation of a wide experimental spectrum into elementary bands and the determination of the parameters of individual radiation bands. For this purpose, such methods of decomposition of experimental photoluminescence spectra into individual bands as the Alentsev–Fock method, λ-modulation, and derivative spectroscopy are mainly used. At the same time, each of the methods has its own limitations. The Alentsev–Fock method requires significant differences in photoluminescence spectra while maintaining the unchanged shape of individual bands in the spectra. The disadvantage of the λ-modulation method is its low noise immunity. In the method of derivative spectroscopy, the accuracy of determining the half-width of the spectrum and the order of the derivative is insufficient. Computer modeling is divorced from real physical processes, and it is difficult to associate the individual bands found with real photoluminescence centers.
A method is proposed for decomposing the sum of Gaussian functions that make up the experimental photoluminescence spectrum into individual bands. It is implemented based on simple mathematical operations. The method of decomposition of the sum of Gaussian functions has been tested on the example of solving the problem of identifying the parameters of individual bands in the photoluminescence spectrum. The parameters of individual bands are close to those obtained by the Alentsev–Fock and derivative spectroscopy methods [
22].
The decomposition into Gaussians was carried out according to the method described in [
23]. To obtain Gauss curves, the spectral characteristics of luminescence were smoothed, after which, to determine the differential distribution function of the spectrum, it is necessary to divide the ordinates of the luminescence spectrum curve by the numerical value of the area bounded by the curve, i.e., normalize the area, which will be the future axis of the ordinates. To create the abscissa axis, i.e., to transition from wavelengths to the frequency range, it is necessary to divide the coefficient 1240 (see Formula (9)) by the abscissa curve of the luminescence spectrum. After constructing the abscissa axis and the ordinate axis, using the hardware capabilities of the Microcal Origin program, multi-peak processing was carried out, i.e., direct decomposition of the luminescence spectral characteristic into Gaussian curves. The error of the decomposition into Gaussians is about 0.018%.
3. Results
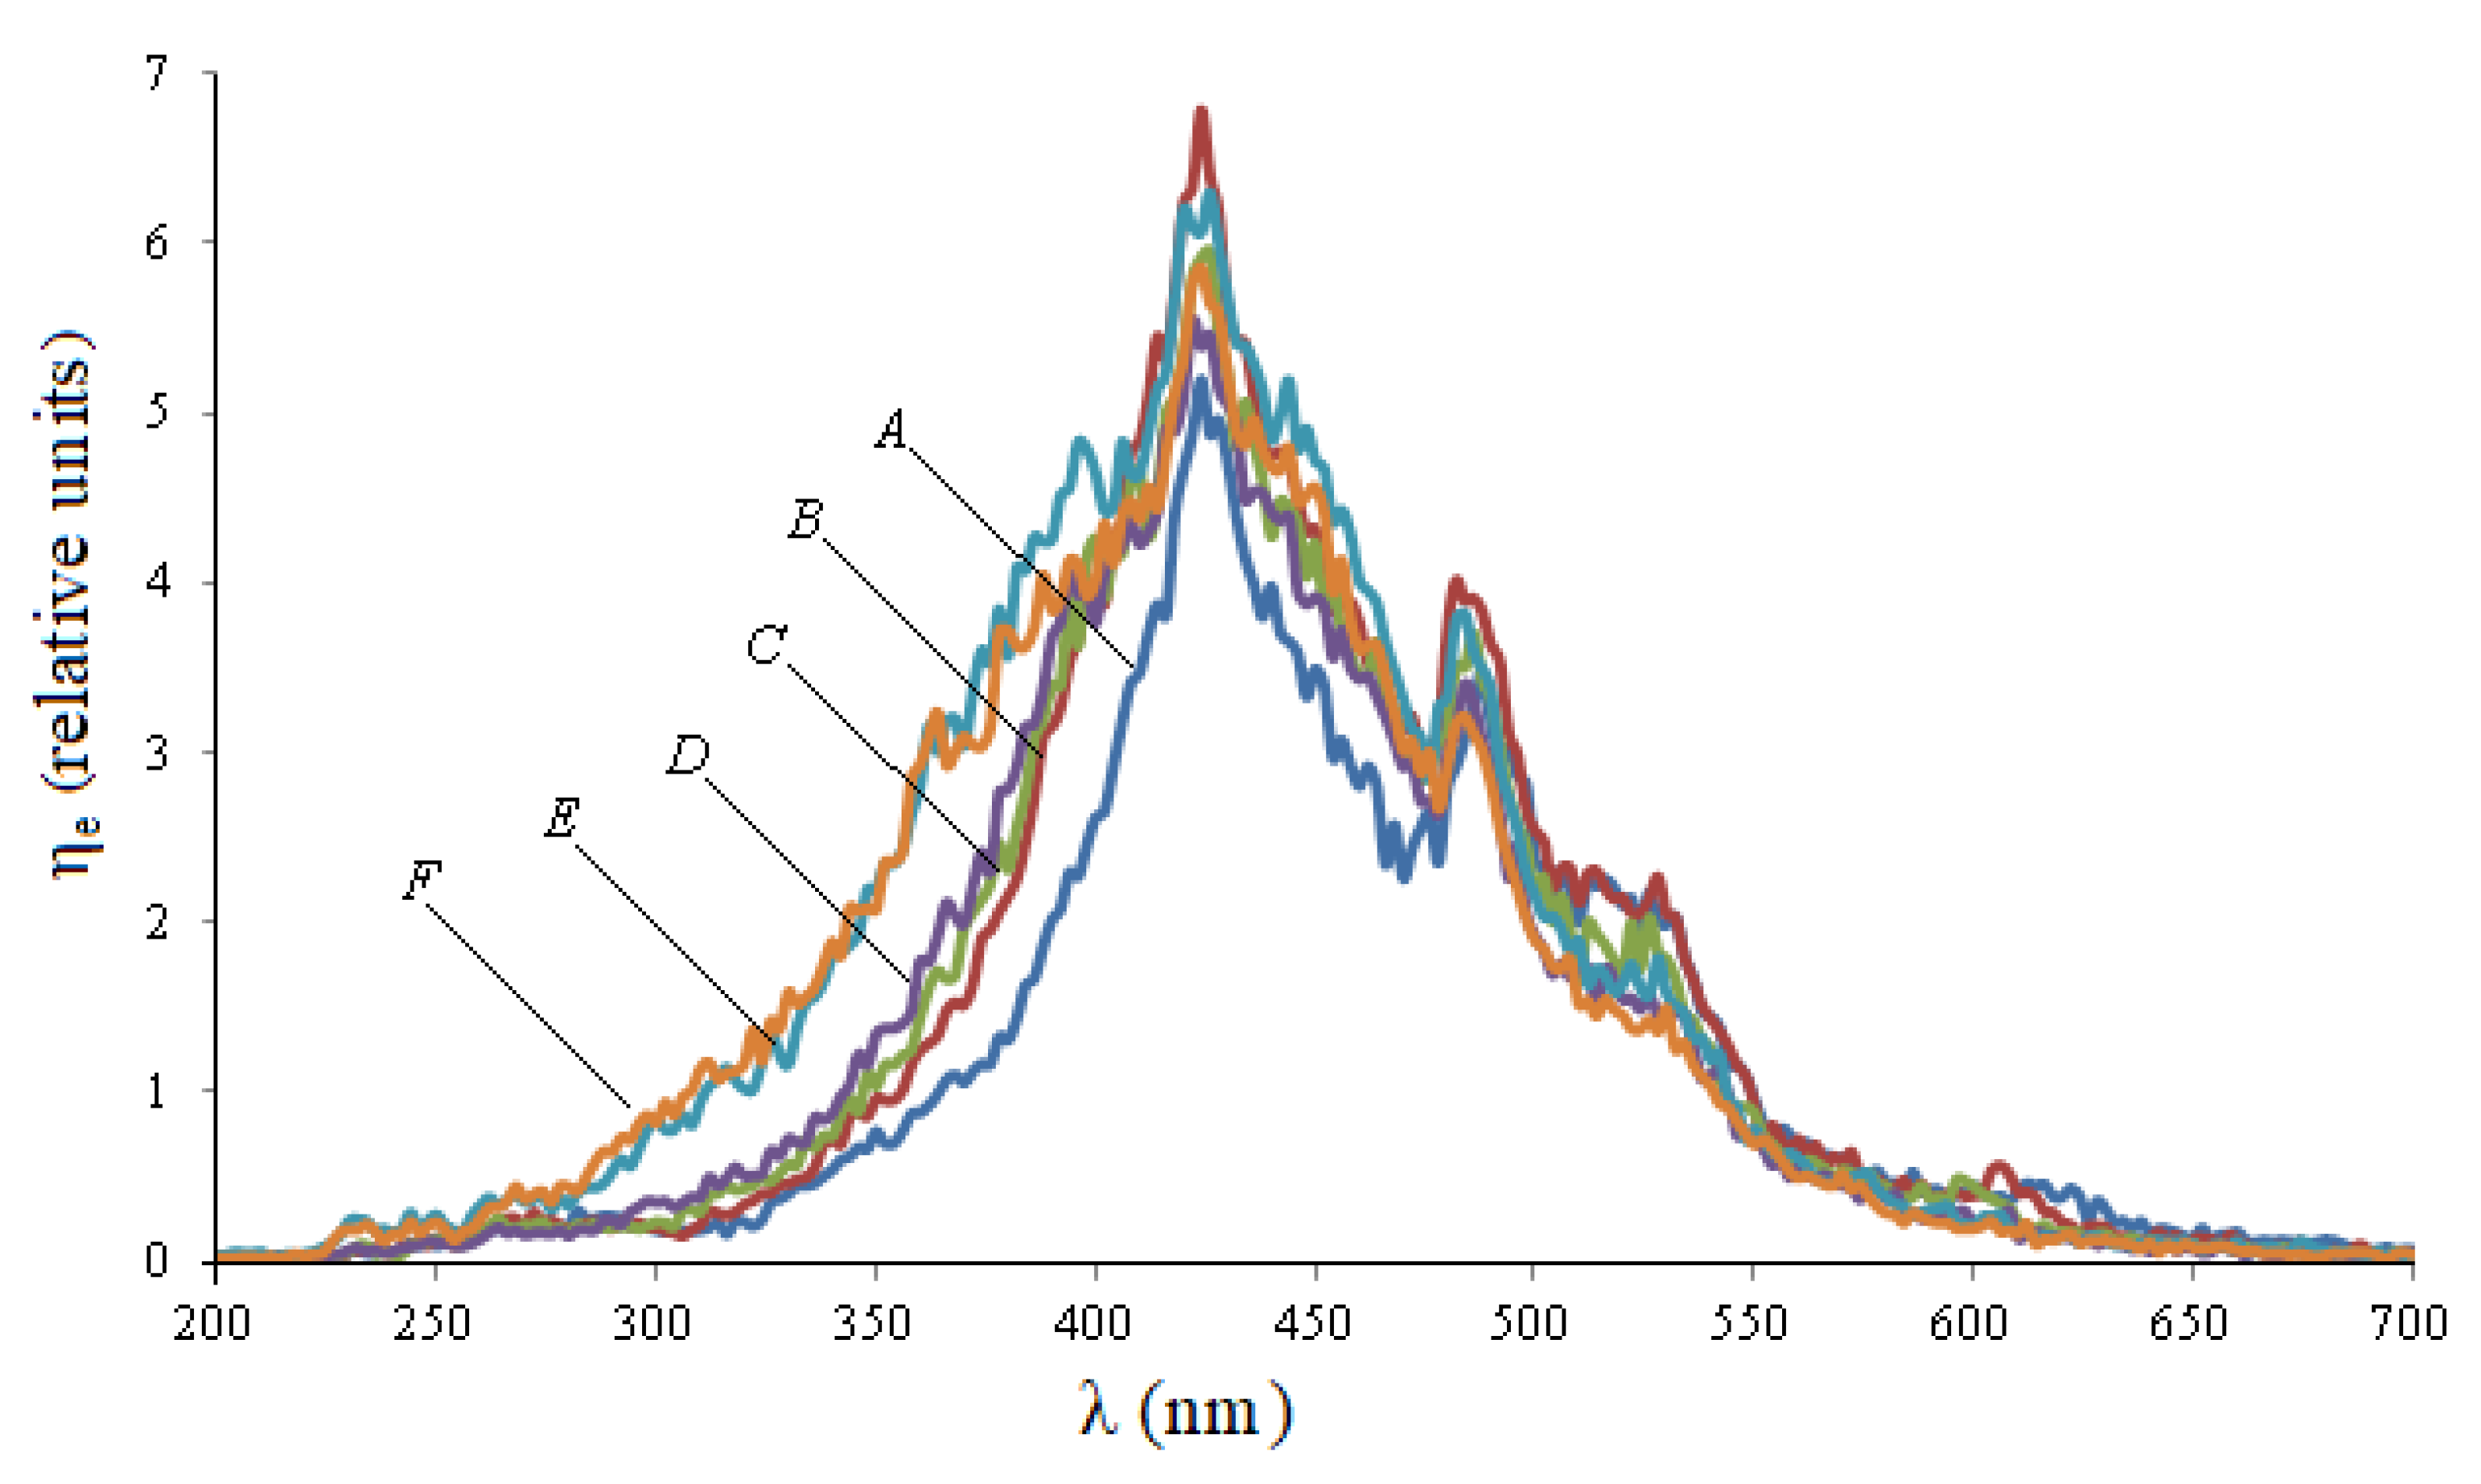
Figure 1 shows the excitation spectra during synchronous scanning of wheat seeds in the spectral range of 180–700 nm with a displacement of monochromator excitation and registration from 50 to 100 nm.
When the displacement value changes, the spectral characteristics of the excitation differ from each other not only quantitatively, but also qualitatively: when the displacement of monochromators increases, the left part of the spectrum shifts to the left, and the right part practically does not change.
Table 1 shows the integral parameters of the excitation spectra of wheat seeds, which were calculated using Formula (1).
It follows from
Table 1 that when the displacement value is equal to 90 nm, the integral parameter of the absorption spectrum H is the maximum and is equal to 816 r.u., therefore we will use it for further measurements.
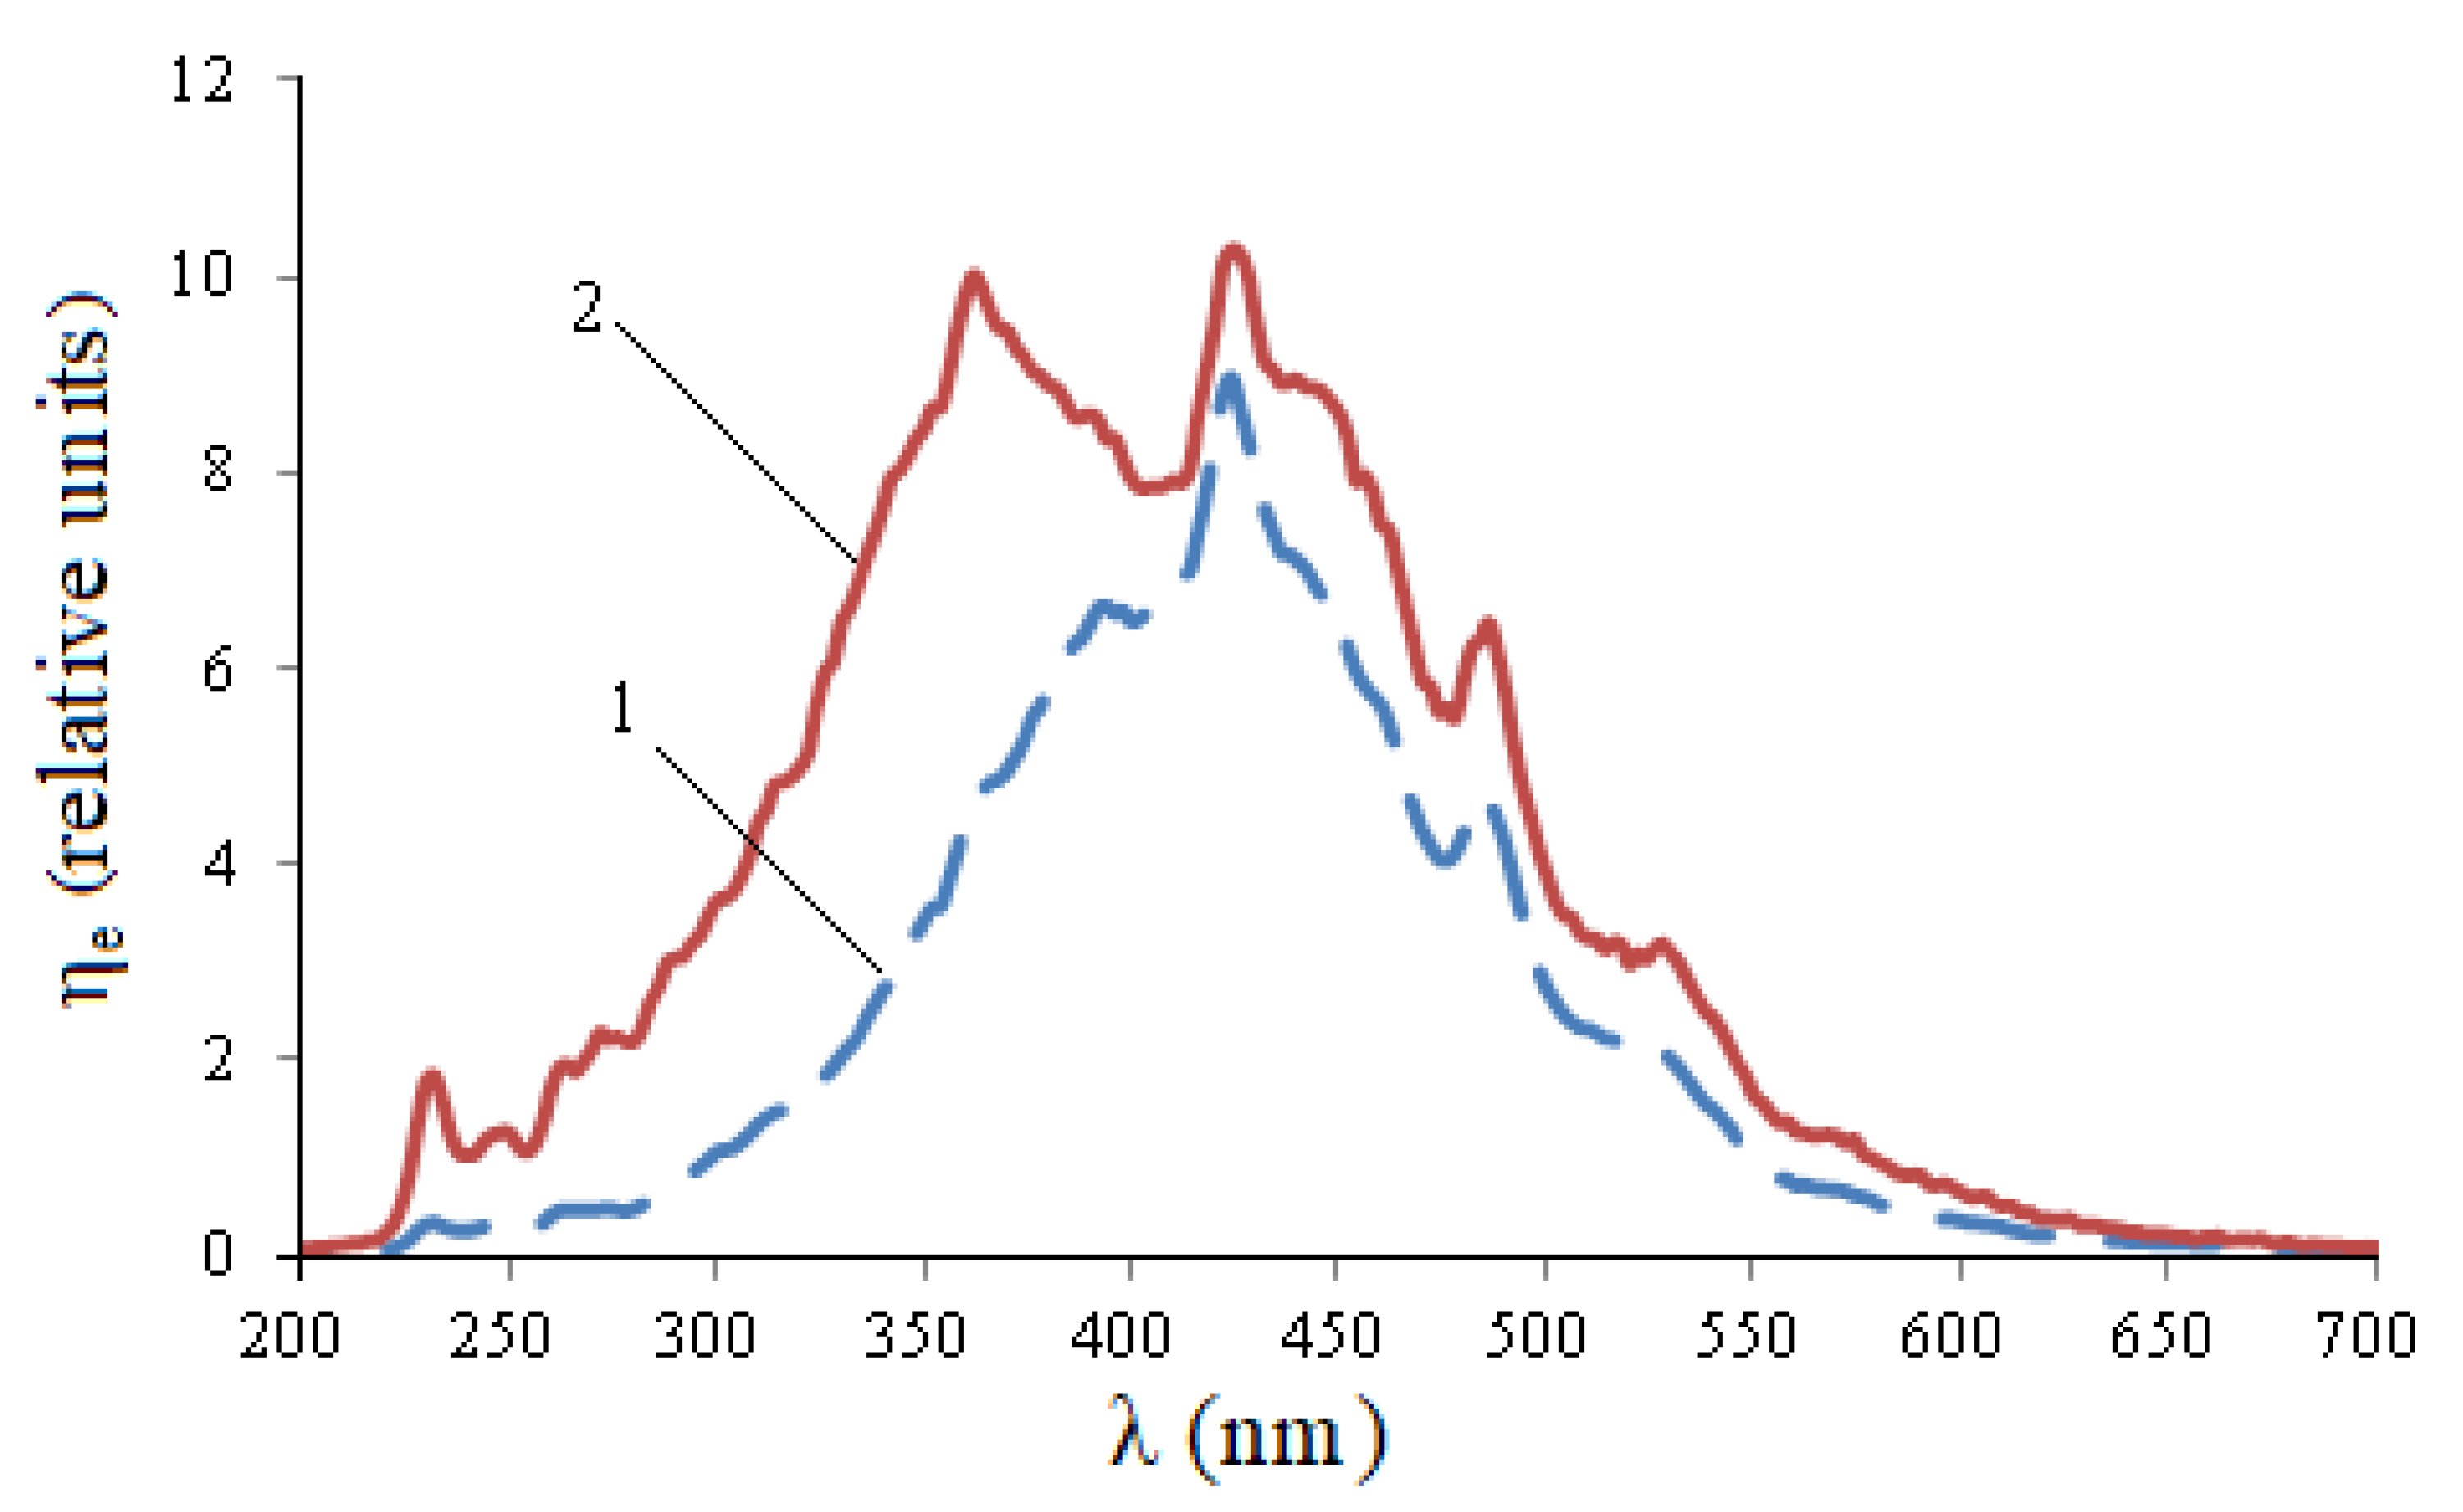
Knowing the optimal value of the displacement, 250 measurements were carried out with simultaneous scanning of infected and uninfected seeds. The average results of wheat seed measurements are shown in
Figure 2.
It follows from
Figure 2 that during infection, wheat seeds have a maximum at a wavelength of 232 nm, and there is also a quantitative increase in peaks at wavelengths: 362 nm, 424 nm, 485 nm. The integral parameters of excitation spectra of wheat seeds of various degrees of fusarium infection in different spectral ranges corresponding to the maxima are presented in
Table 2.
Thus, in infected seeds, the integral absorption capacity of H in the range of 220–240 nm (peak 232 nm) exceeds the same indicator for healthy seeds by 5.75 times, in the range of 340–400 nm (peak 362 nm) by 1.79 times. For other ranges, this ratio is lower: for 400–460 nm (peak 424 nm)—1.22 times, 460–510 nm (peak 485 nm)—1.39 times, 510–550 nm (peak 528 nm)—1.5 times.
Knowing from
Figure 2 the wavelengths of the excitation maxima λe, we measure the photoluminescence spectra
φl(λ). To do this, the excitation channel monochromator is set to the wavelength λ
e, and the luminescence channel monochromator scans a longer wavelength range, registering the spectral flux density
φl(λ).
Figure 3,
Figure 4,
Figure 5,
Figure 6 and
Figure 7 show the spectral characteristics of luminescence averaged over 250 measurements at various λ
e.
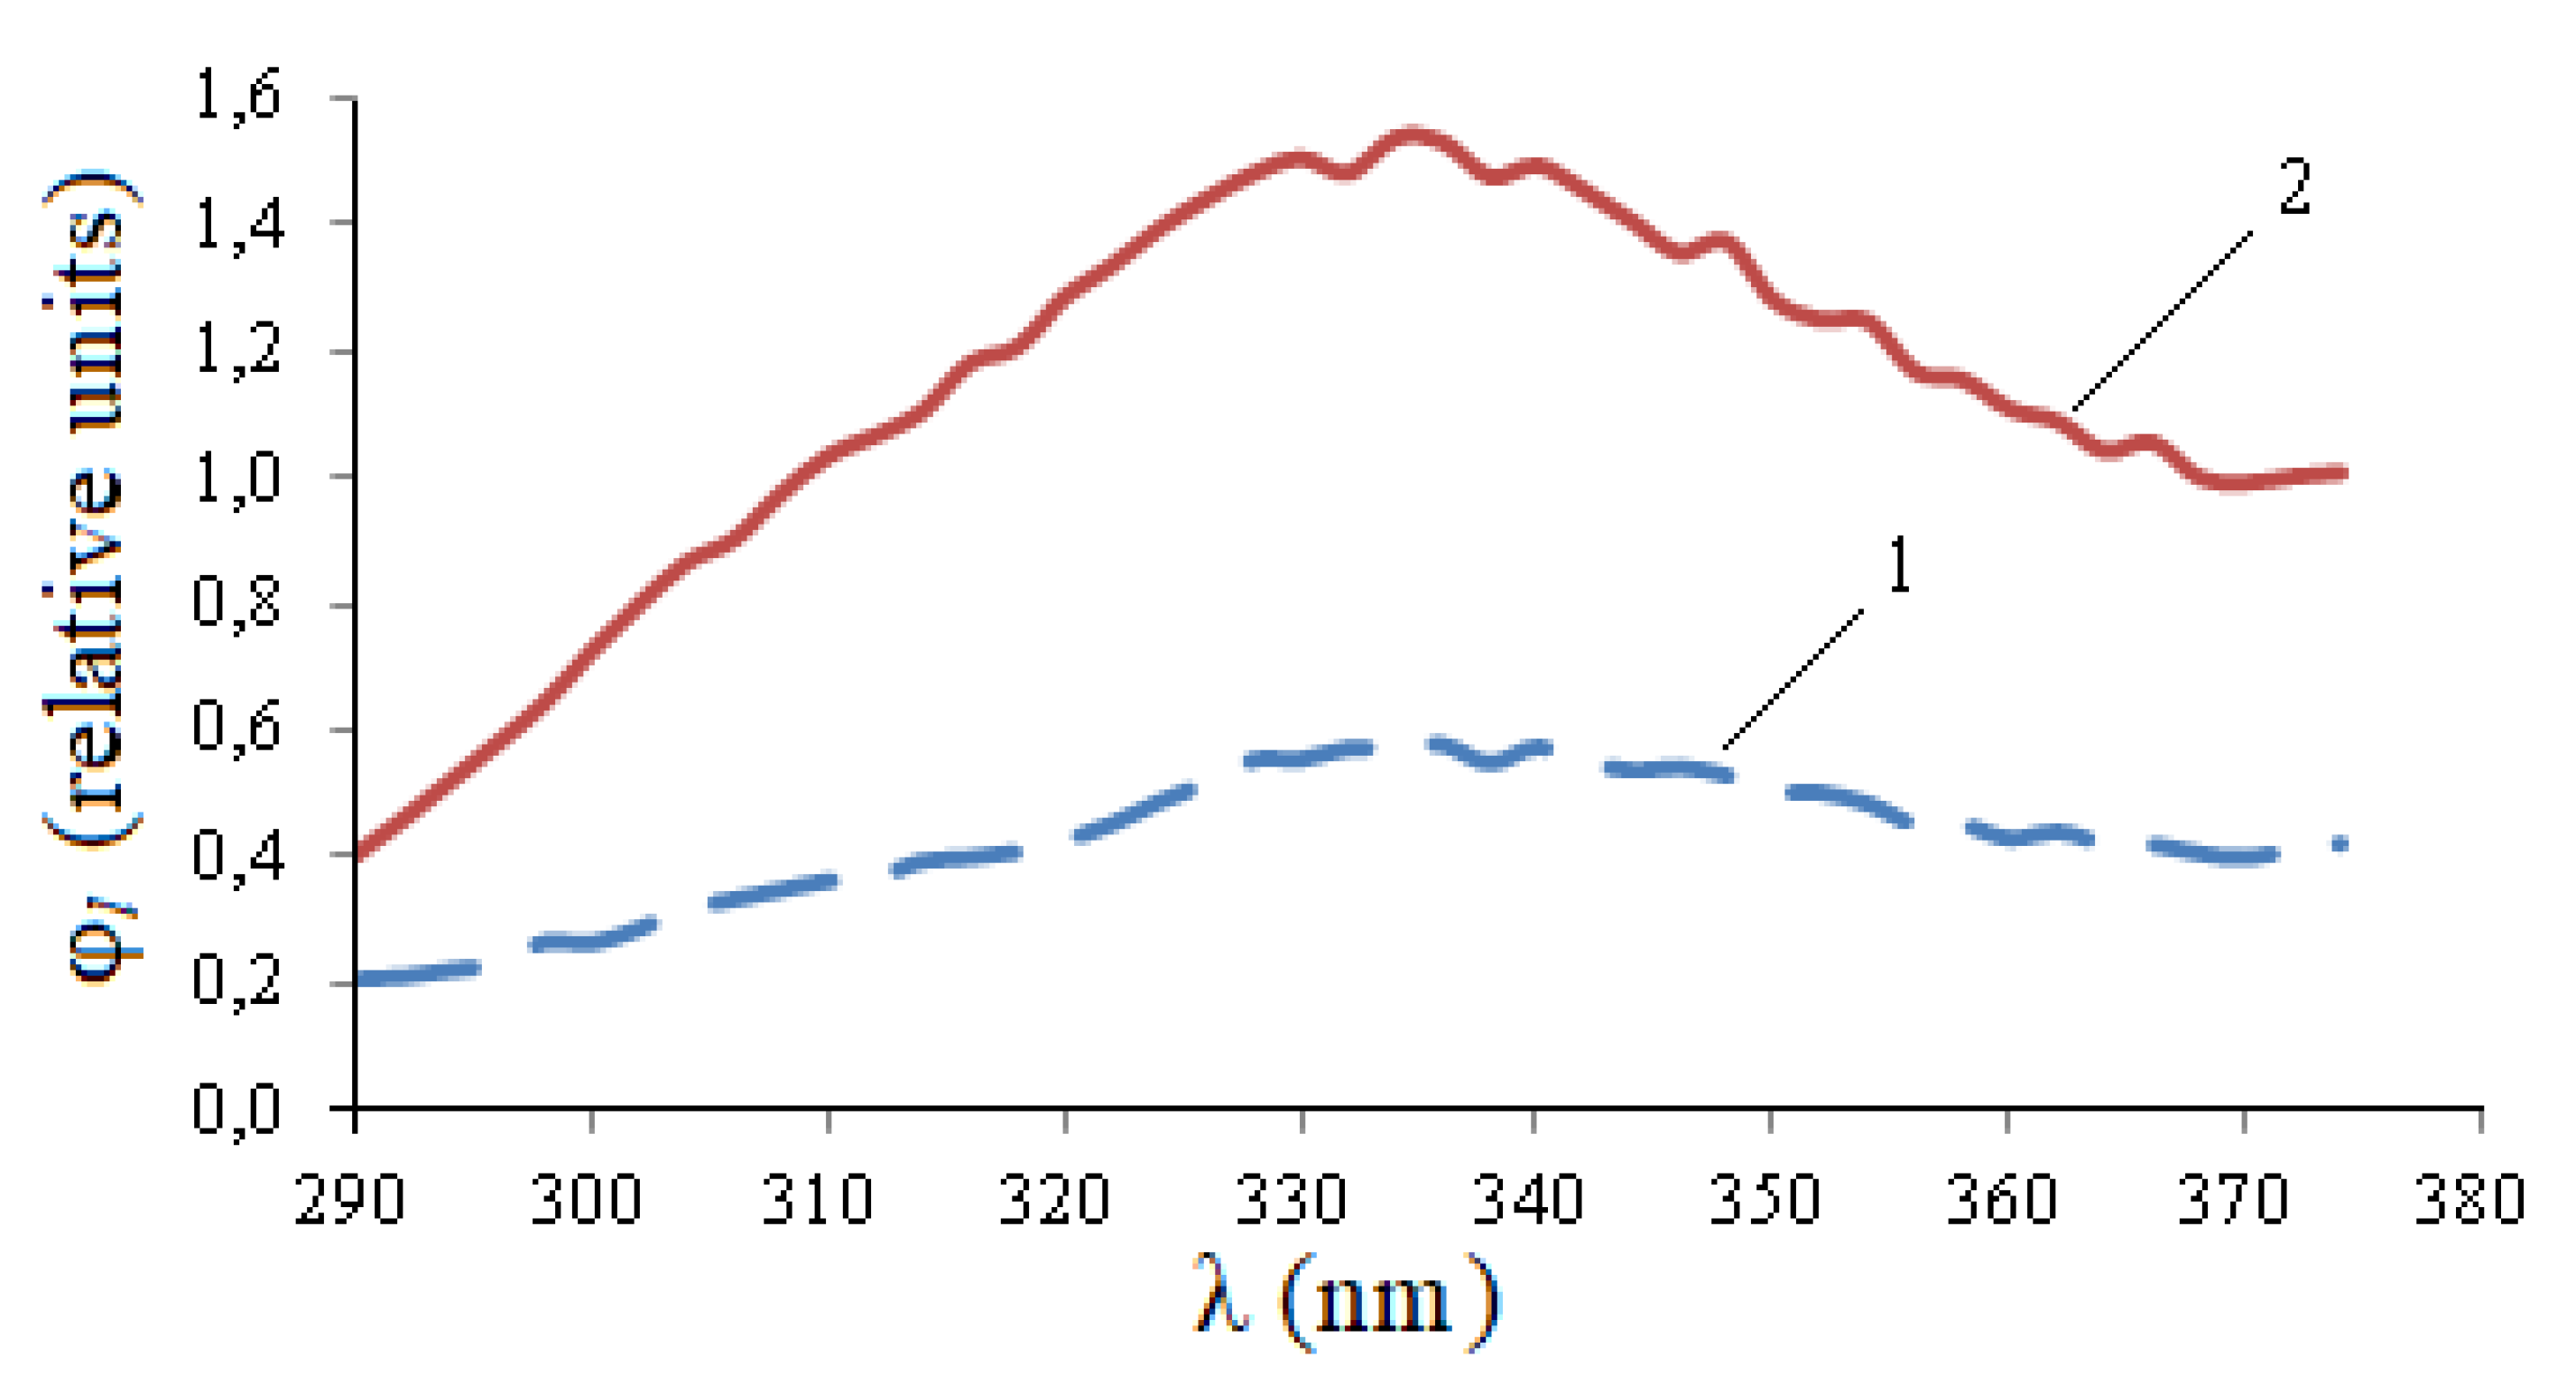
It follows from
Figure 3 that the luminescence spectrum lies in the range of approximately 290–374 nm. The integral parameter of the spectrum—the relative photoluminescence flux—in this range is determined by Formula (2).
The maximum values of spectral characteristics for infected and uninfected seeds differ by 2.58 times. Photoluminescence fluxes at λ
e,1 = 232 nm differ by 2.64 times. This confirms the significance of the spectral differences of η
e(λ) in the range 220–240 nm in
Figure 2. At the same time, the photo signal is relatively small.
Similar calculations were performed for other wavelengths of the excitation maxima.
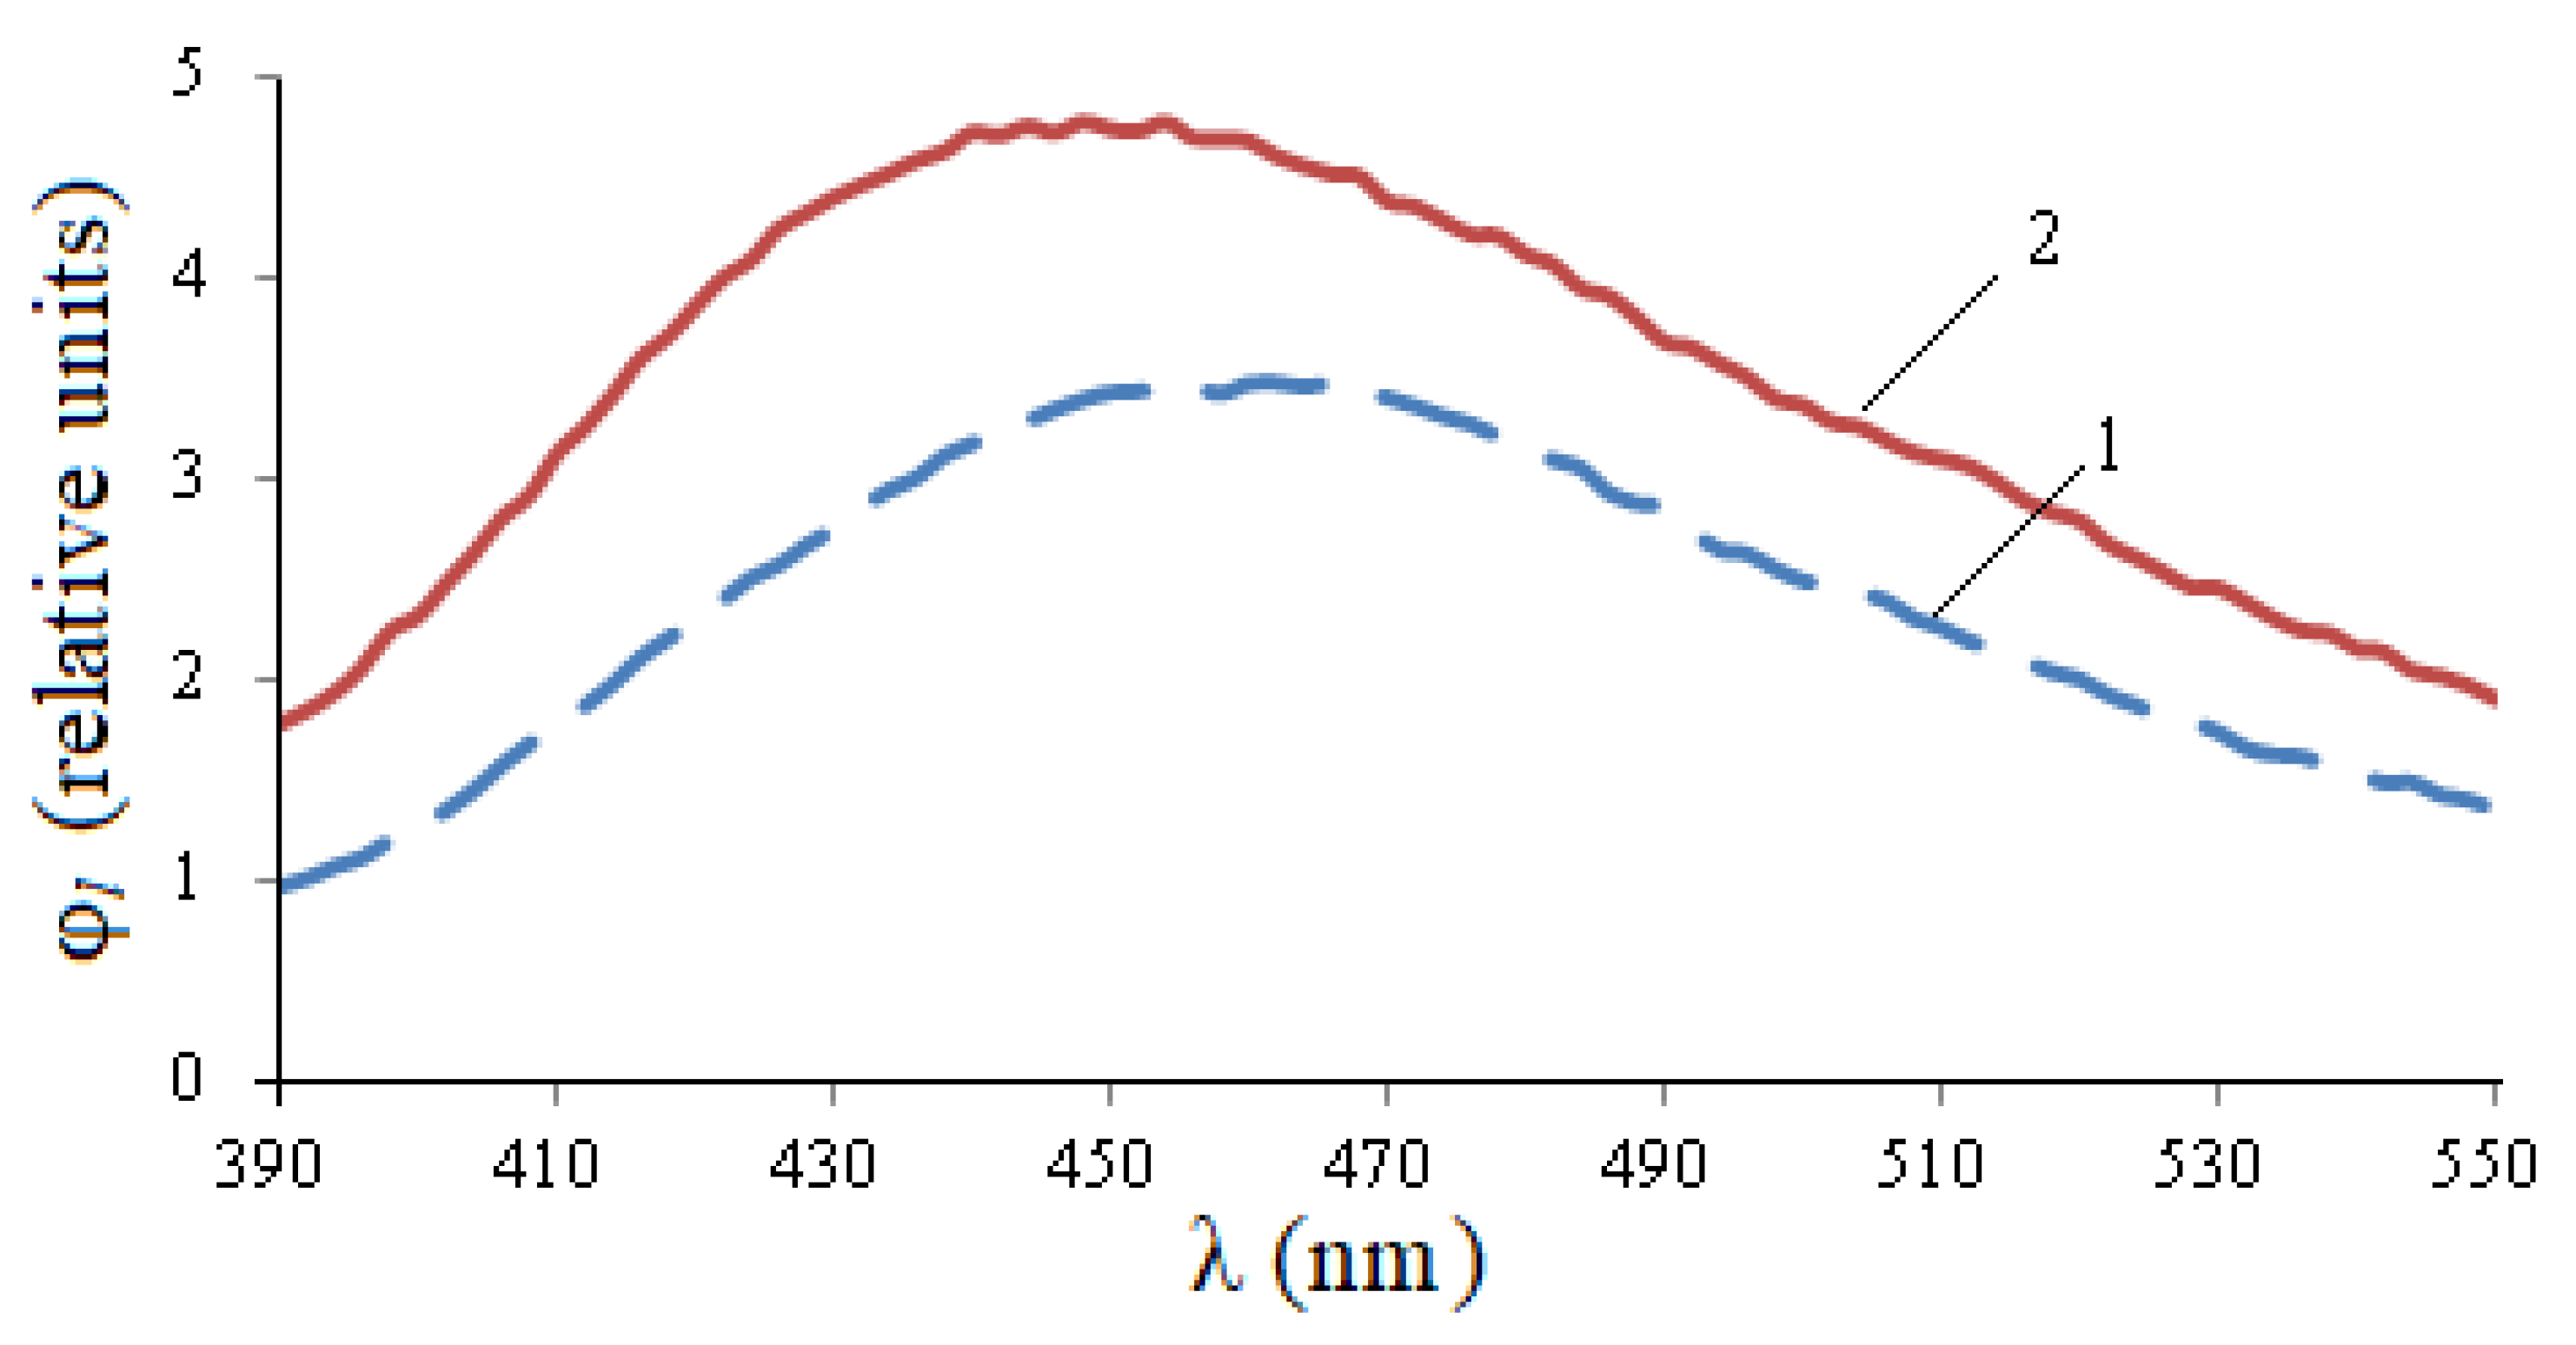
The luminescence range at a given excitation wavelength is 390–550 nm (
Figure 4). At the same time, also for infected seeds, the relative photoluminescence flux is 1.44 times higher, the maximum value is 1.36 times higher.
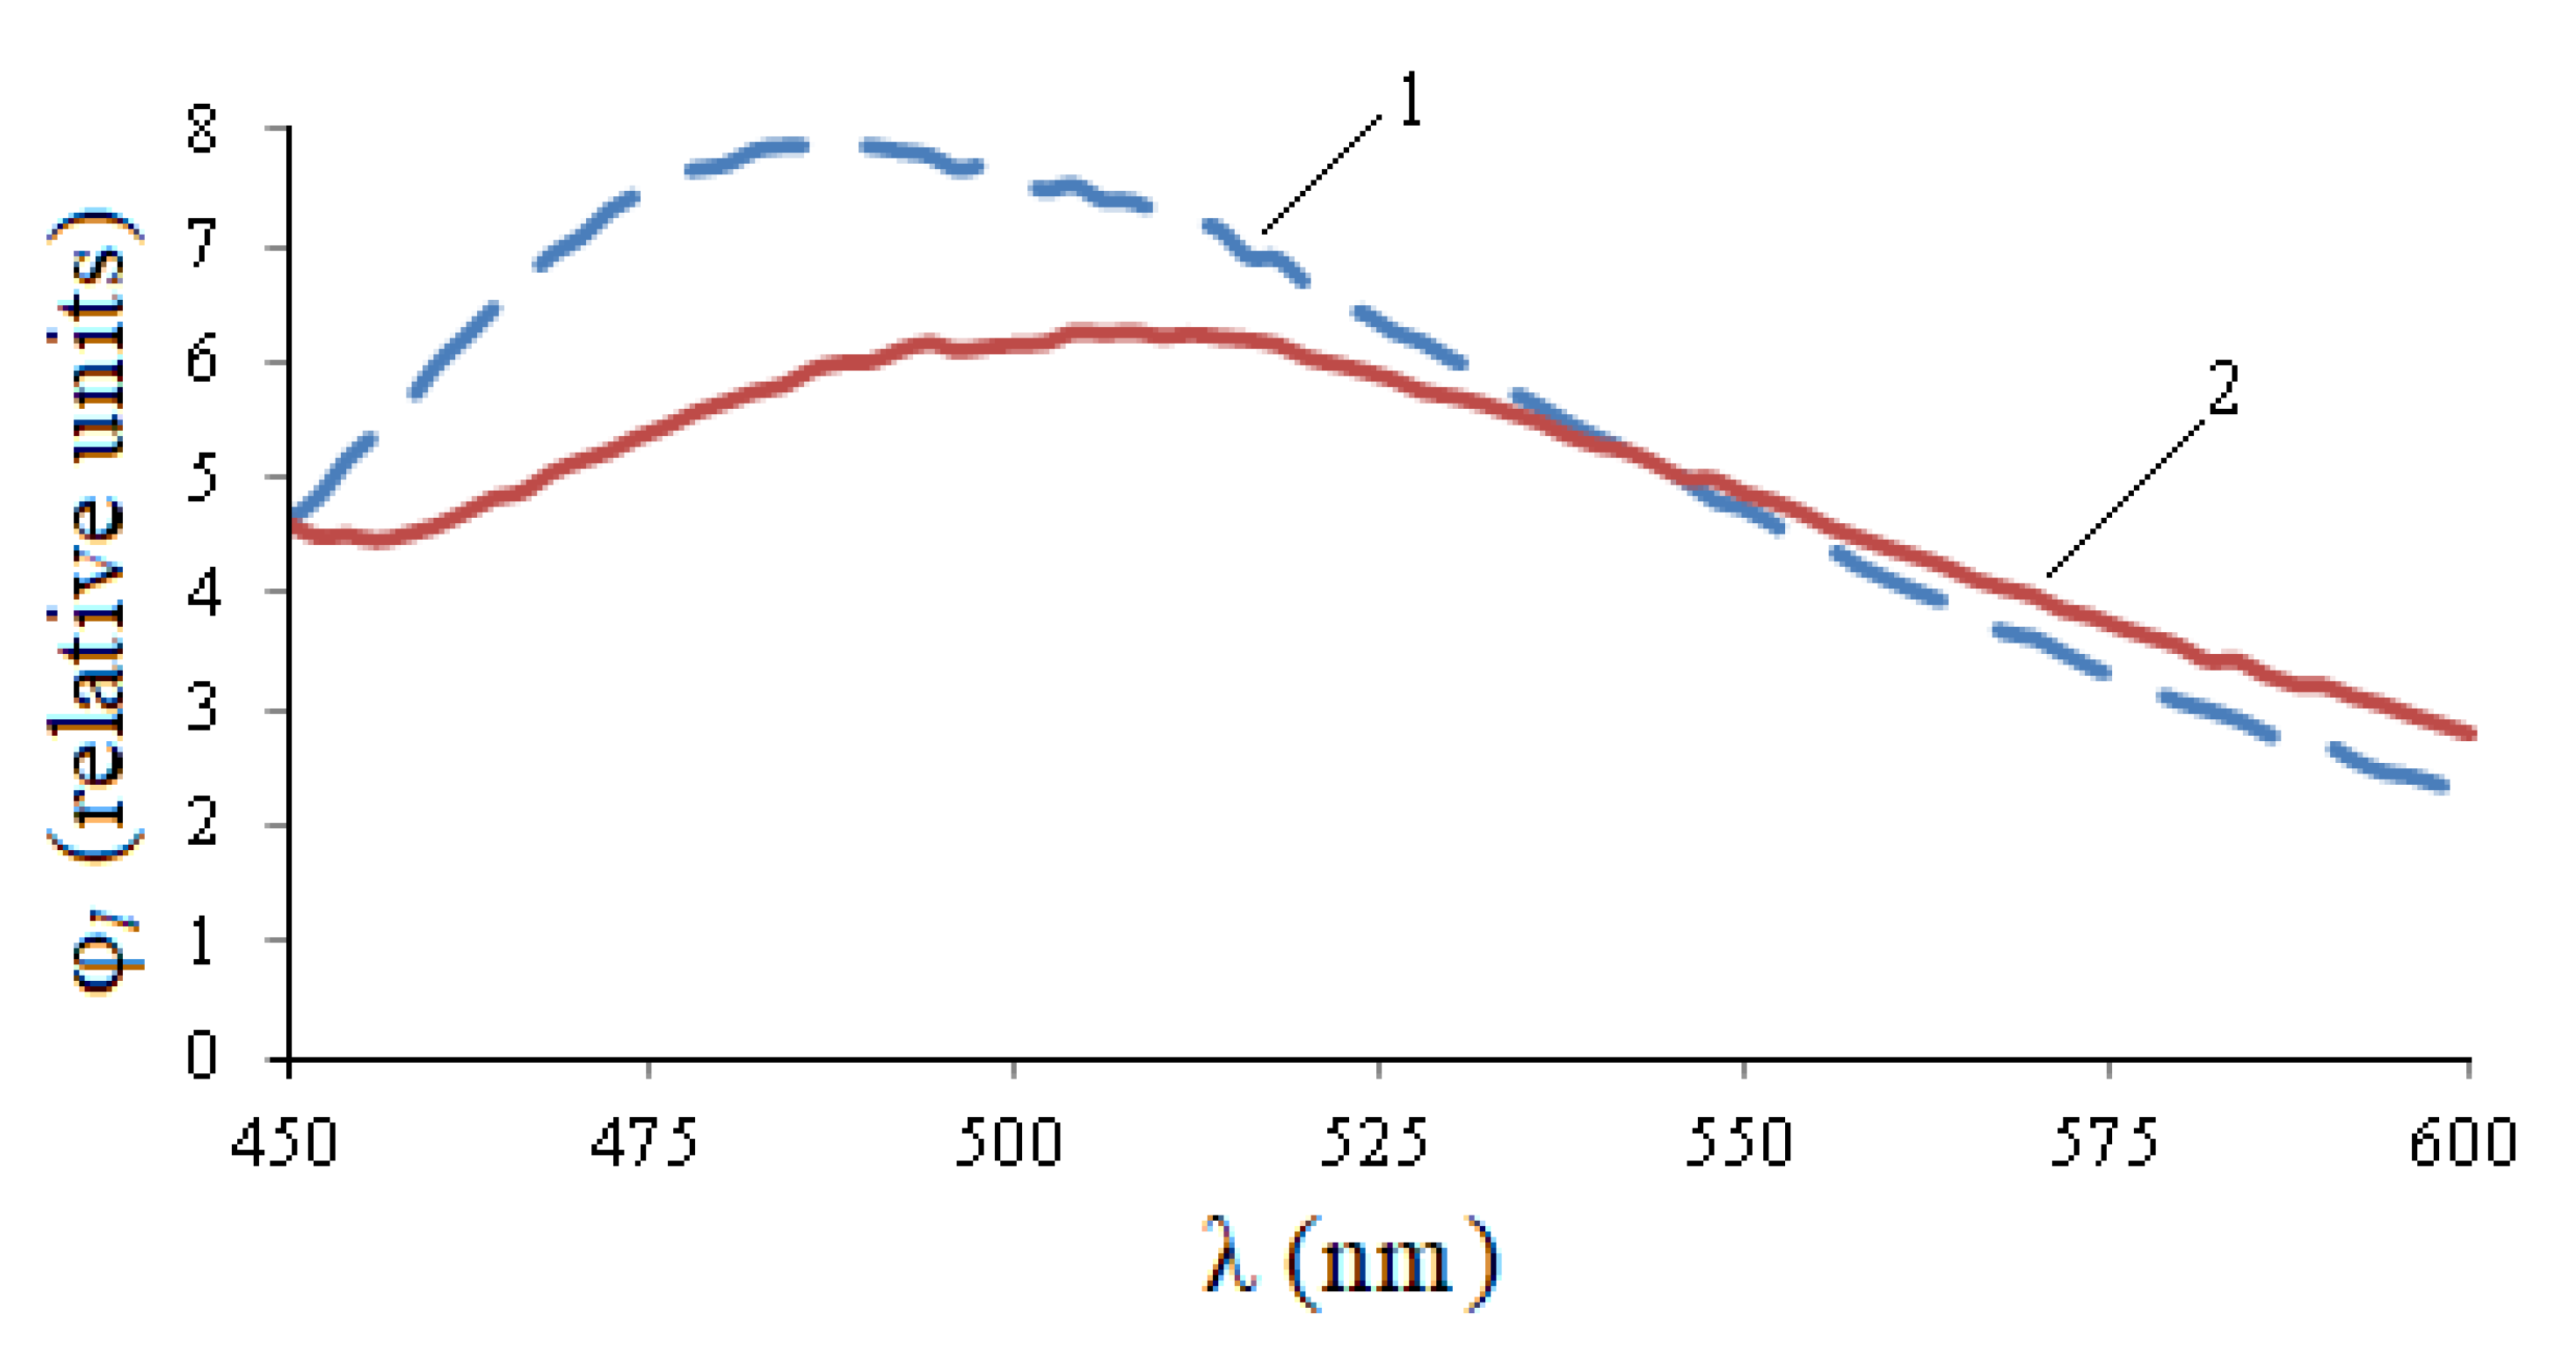
In
Figure 5, the entire photoluminescence range is 450–600 nm, but in the 450–550 nm area, the curve for healthy seeds is noticeably higher than the curve for infected seeds, and in the 550–600 nm area, quantitative changes are practically indistinguishable. The integral flow of healthy seeds exceeds the flow of infected seeds by 1.12 times, the maximum value is 1.29 times, but the wavelength of the maximum is shifted by 25 nm to the right.
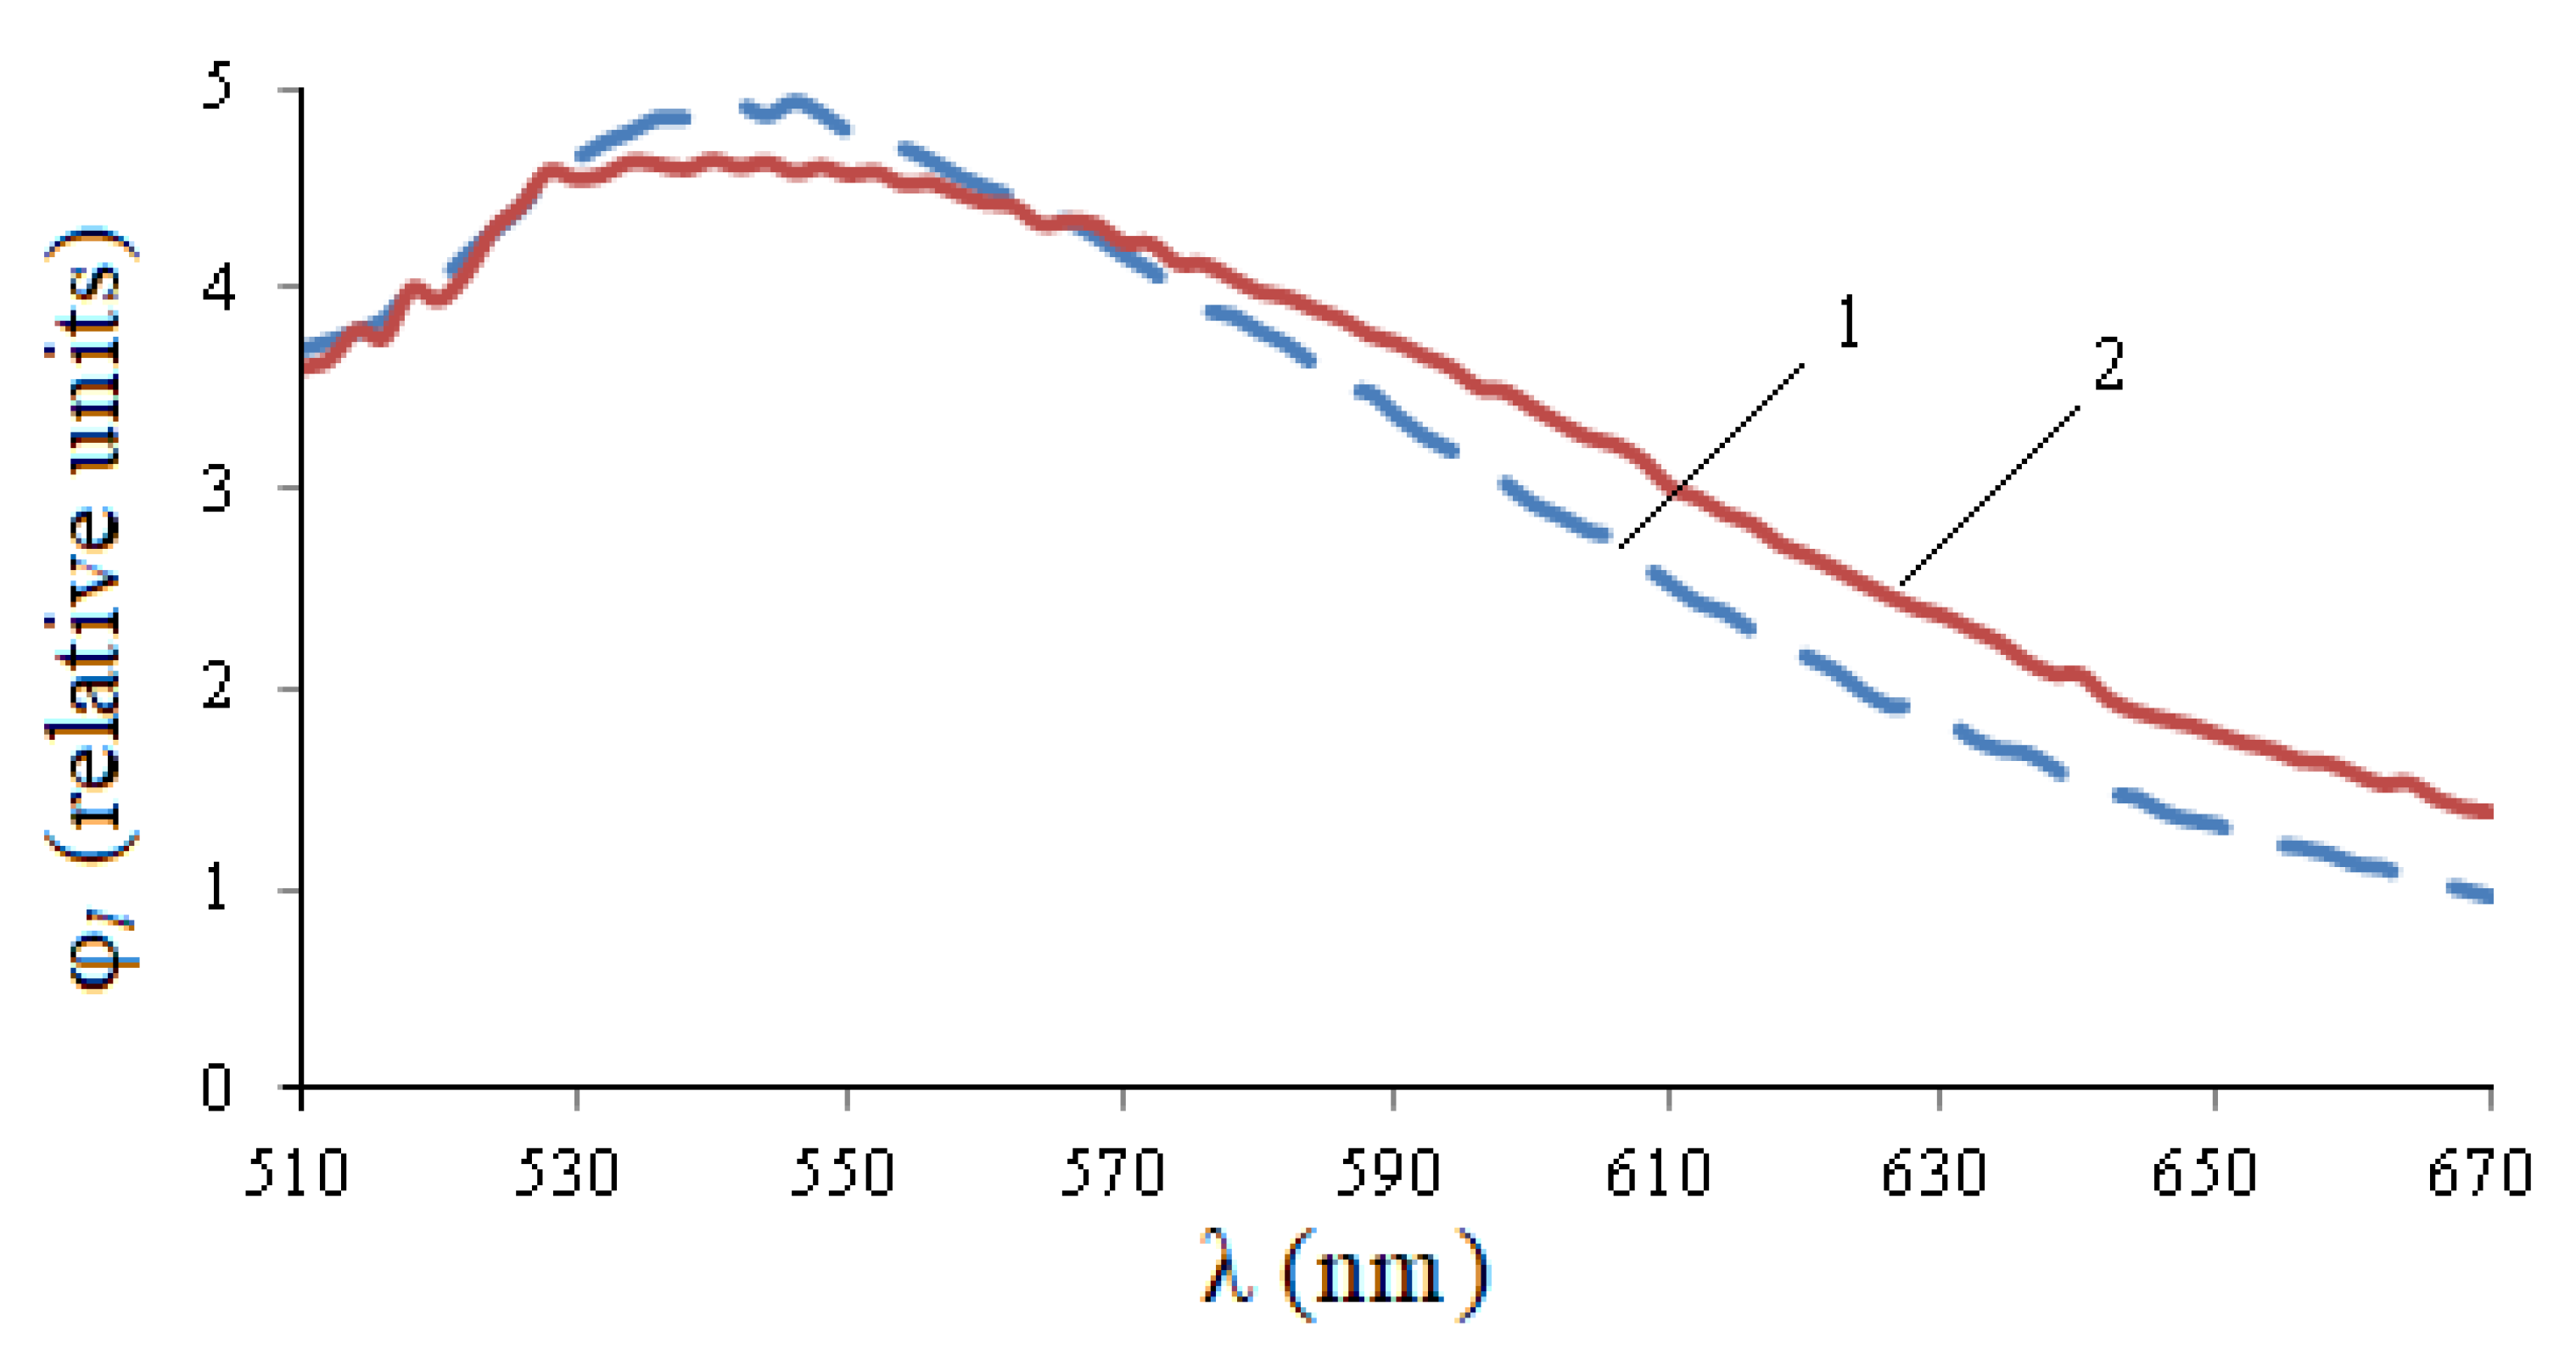
In
Figure 6, the photoluminescence spectrum of healthy seeds exceeds the spectrum of infected seeds at a site of 530–560 nm, and then becomes smaller. The integral flow of infected seeds exceeds the flow of healthy seeds by 1.09 times, the maximum value is 1.07 times.
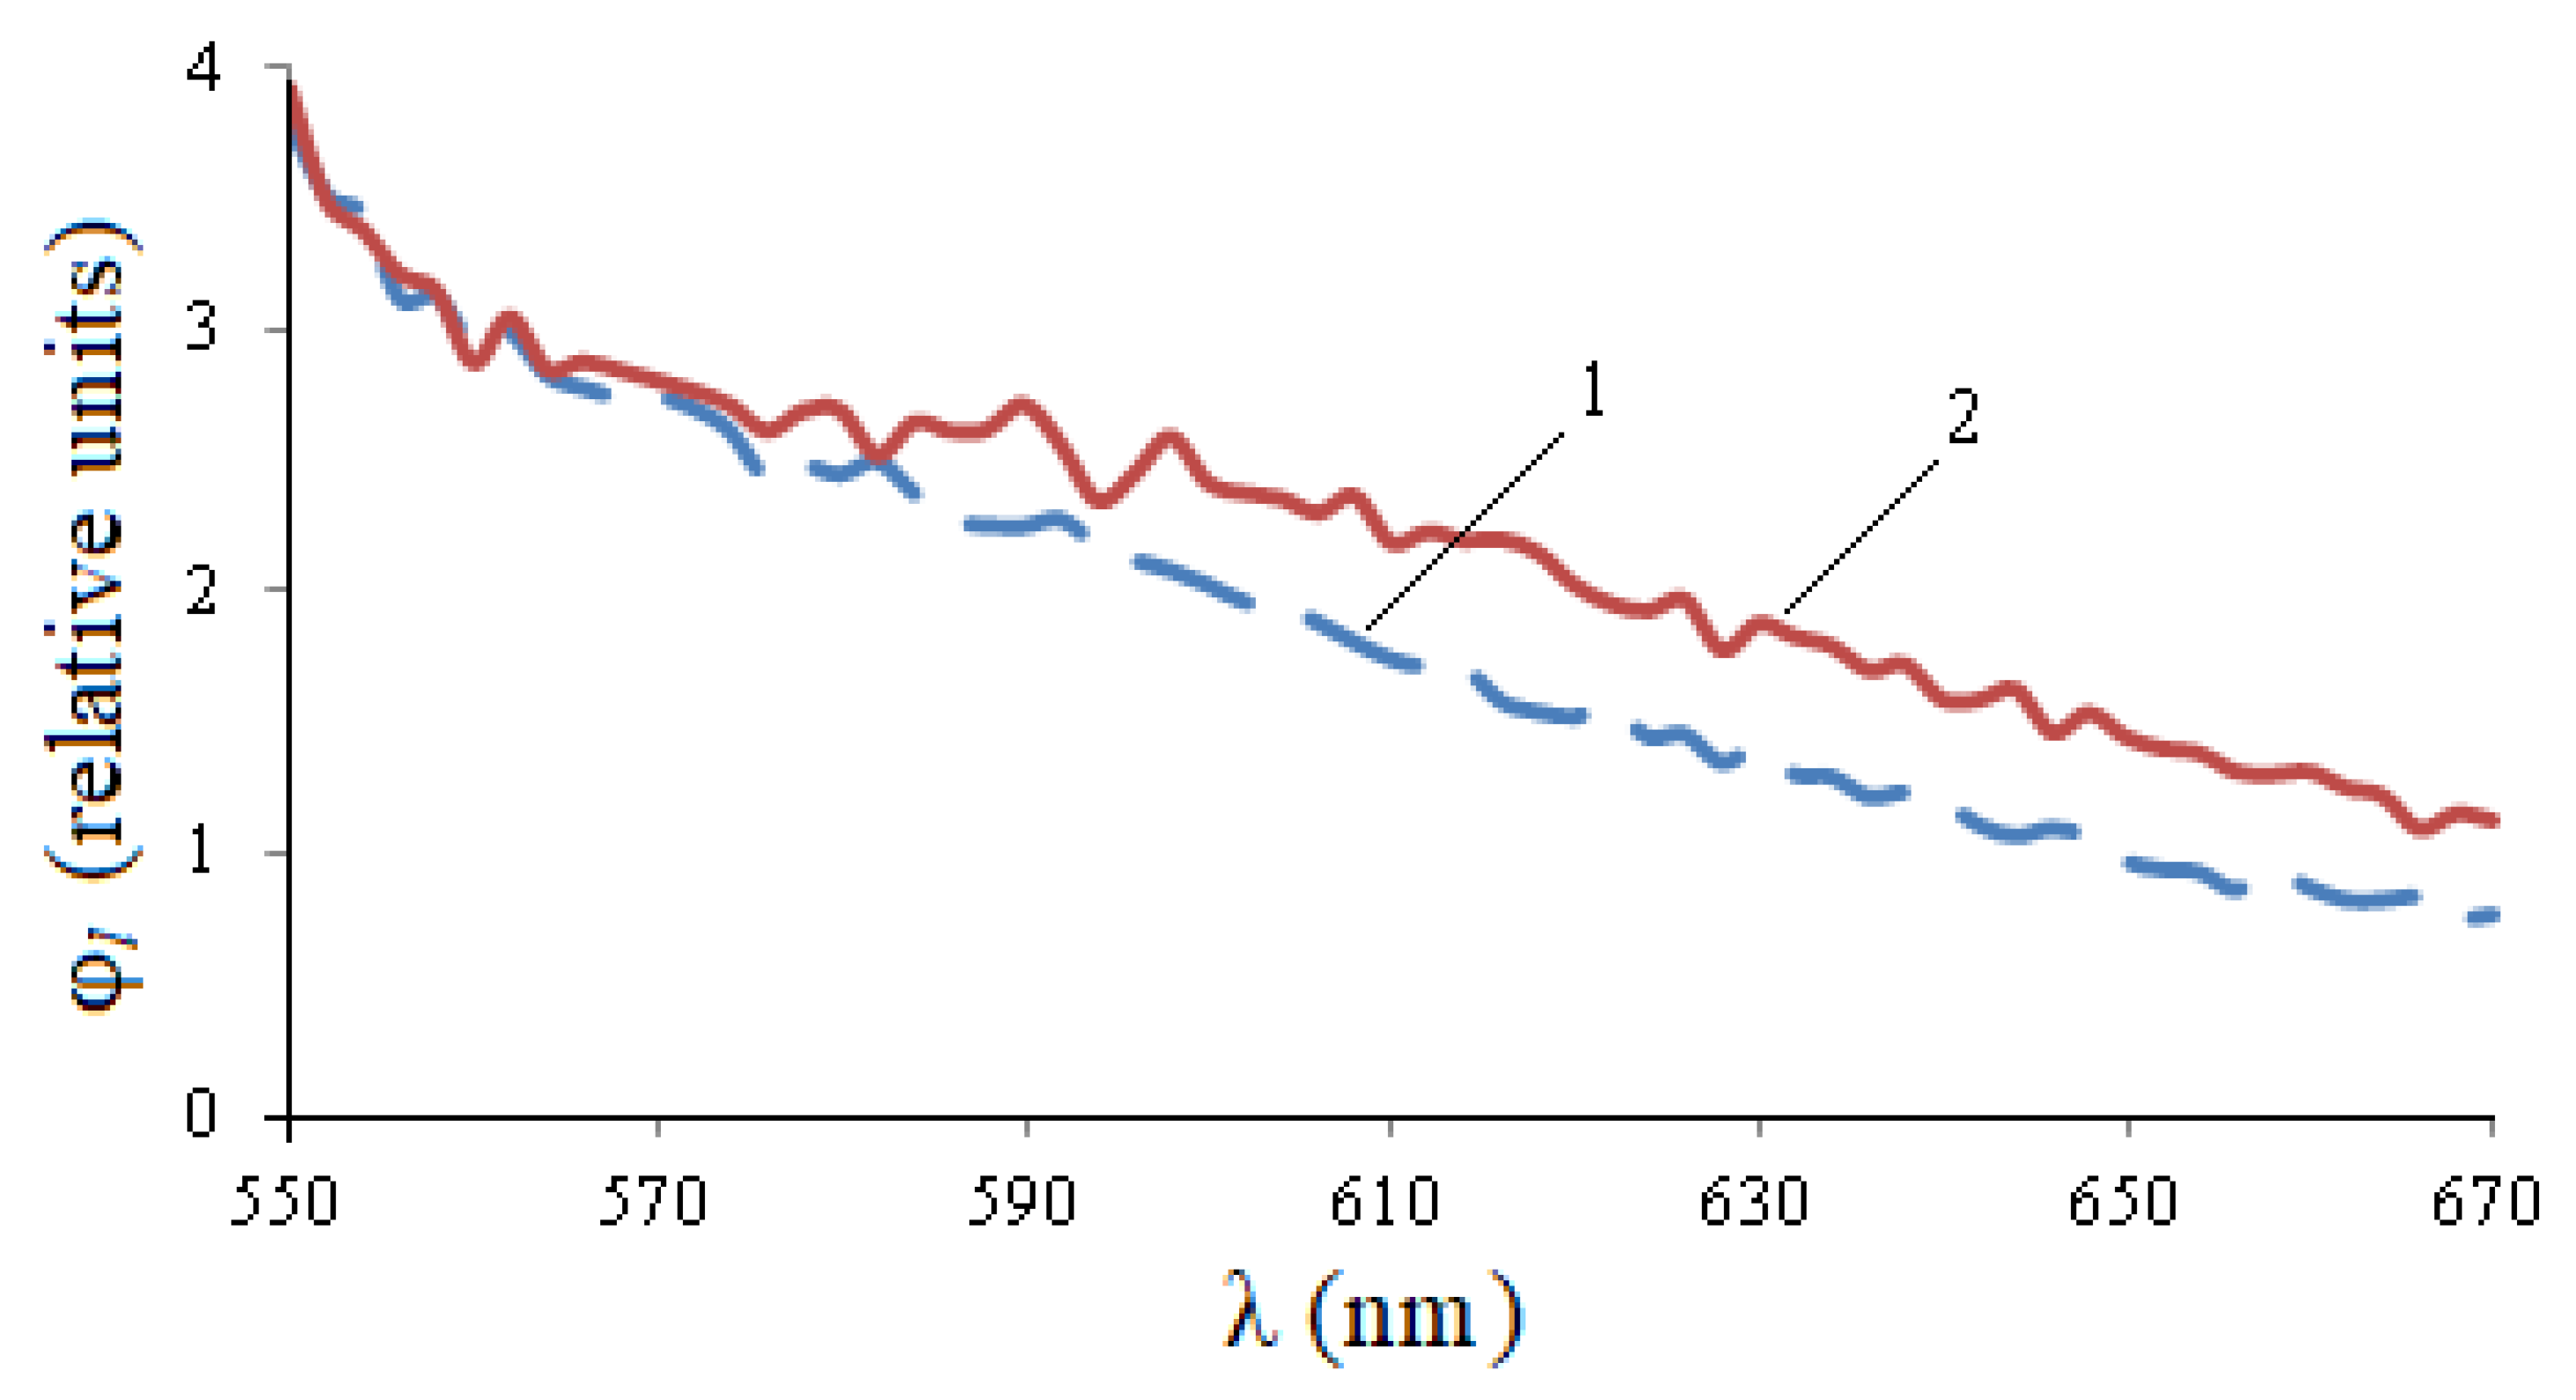
It follows from
Figure 7 that there is practically no luminescence at the excitation of λ
e = 528 nm. The rise of the graphs in the left part is explained by the influence of exciting radiation.
It is advisable to analyze the spectra, determining their parameters, with the help of which it is possible to understand the most significant features of the photoluminescence spectra. The following numerical parameters, well-known from mathematical statistics, determined by Formulas (3)–(10), were used for the analysis.
The calculation results are presented in
Table 3.
Table 3 shows that the mathematical expectations of healthy and infected seeds differ more strongly when excited by wavelengths λ
e,1 = 232 nm (on 11 nm), λ
e,3 = 424 nm (on 12 nm) and less important (on 6 nm) at λ
e,4 = 485 nm, and on λ
e,2 = 362 nm do not almost differ. The variance differences are significant only for λ
e,2 = 362 nm. The statistical moment of the third order μ
3 for λ
e,1 = 232 nm is negative and is 27.7 times different for healthy and infected seeds. The statistical moments of µ
3 are positive and differ less significantly by 1.5–4.9 times for remaining excitation wavelengths. The statistical moment of the fourth-order µ
4 at λ
e,1 = 232 nm is very large in absolute value compared to others. The value of the asymmetry A
S behaves similar to a statistical moment of the third order. The value of the kurtosis
Eλ differs only at λ
e,1 = 232 nm for infected and healthy seeds. Moreover, the difference can be traced both by the absolute value of 103 times, and by the sign. The difference in the energy of the spectrum for healthy and infected seeds is relatively small (up to 2.3%) for all wavelengths of excitation.
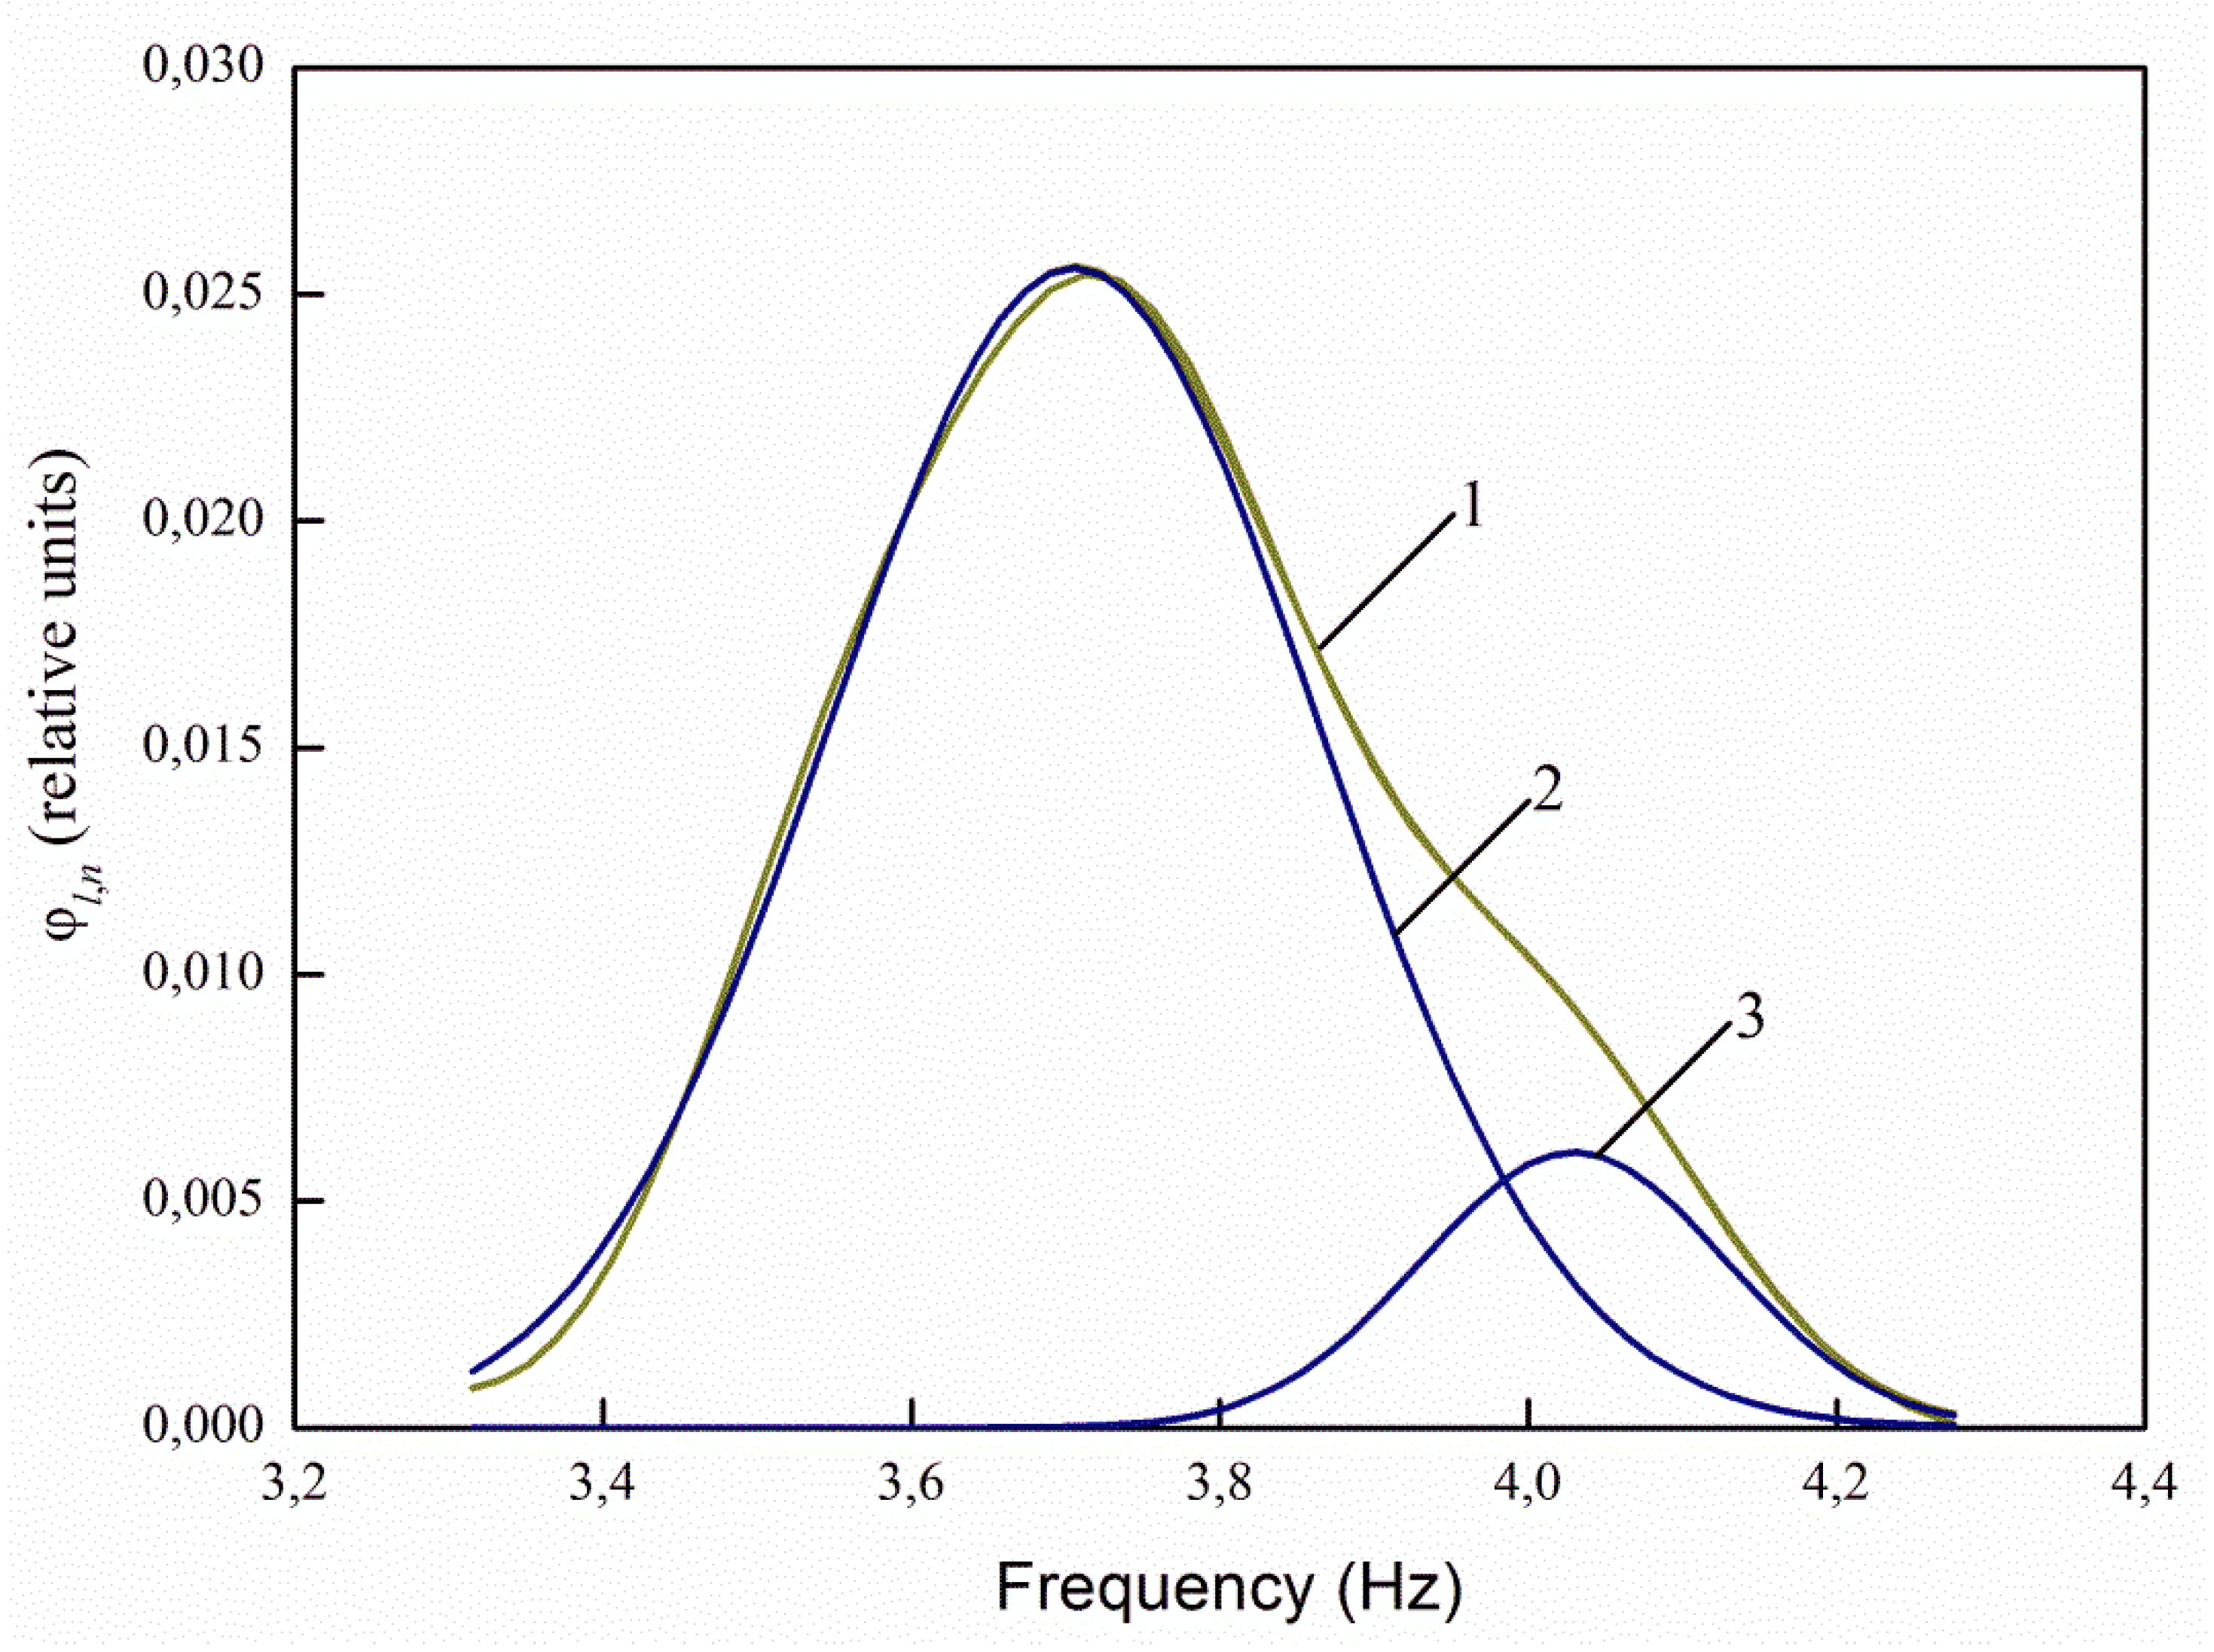
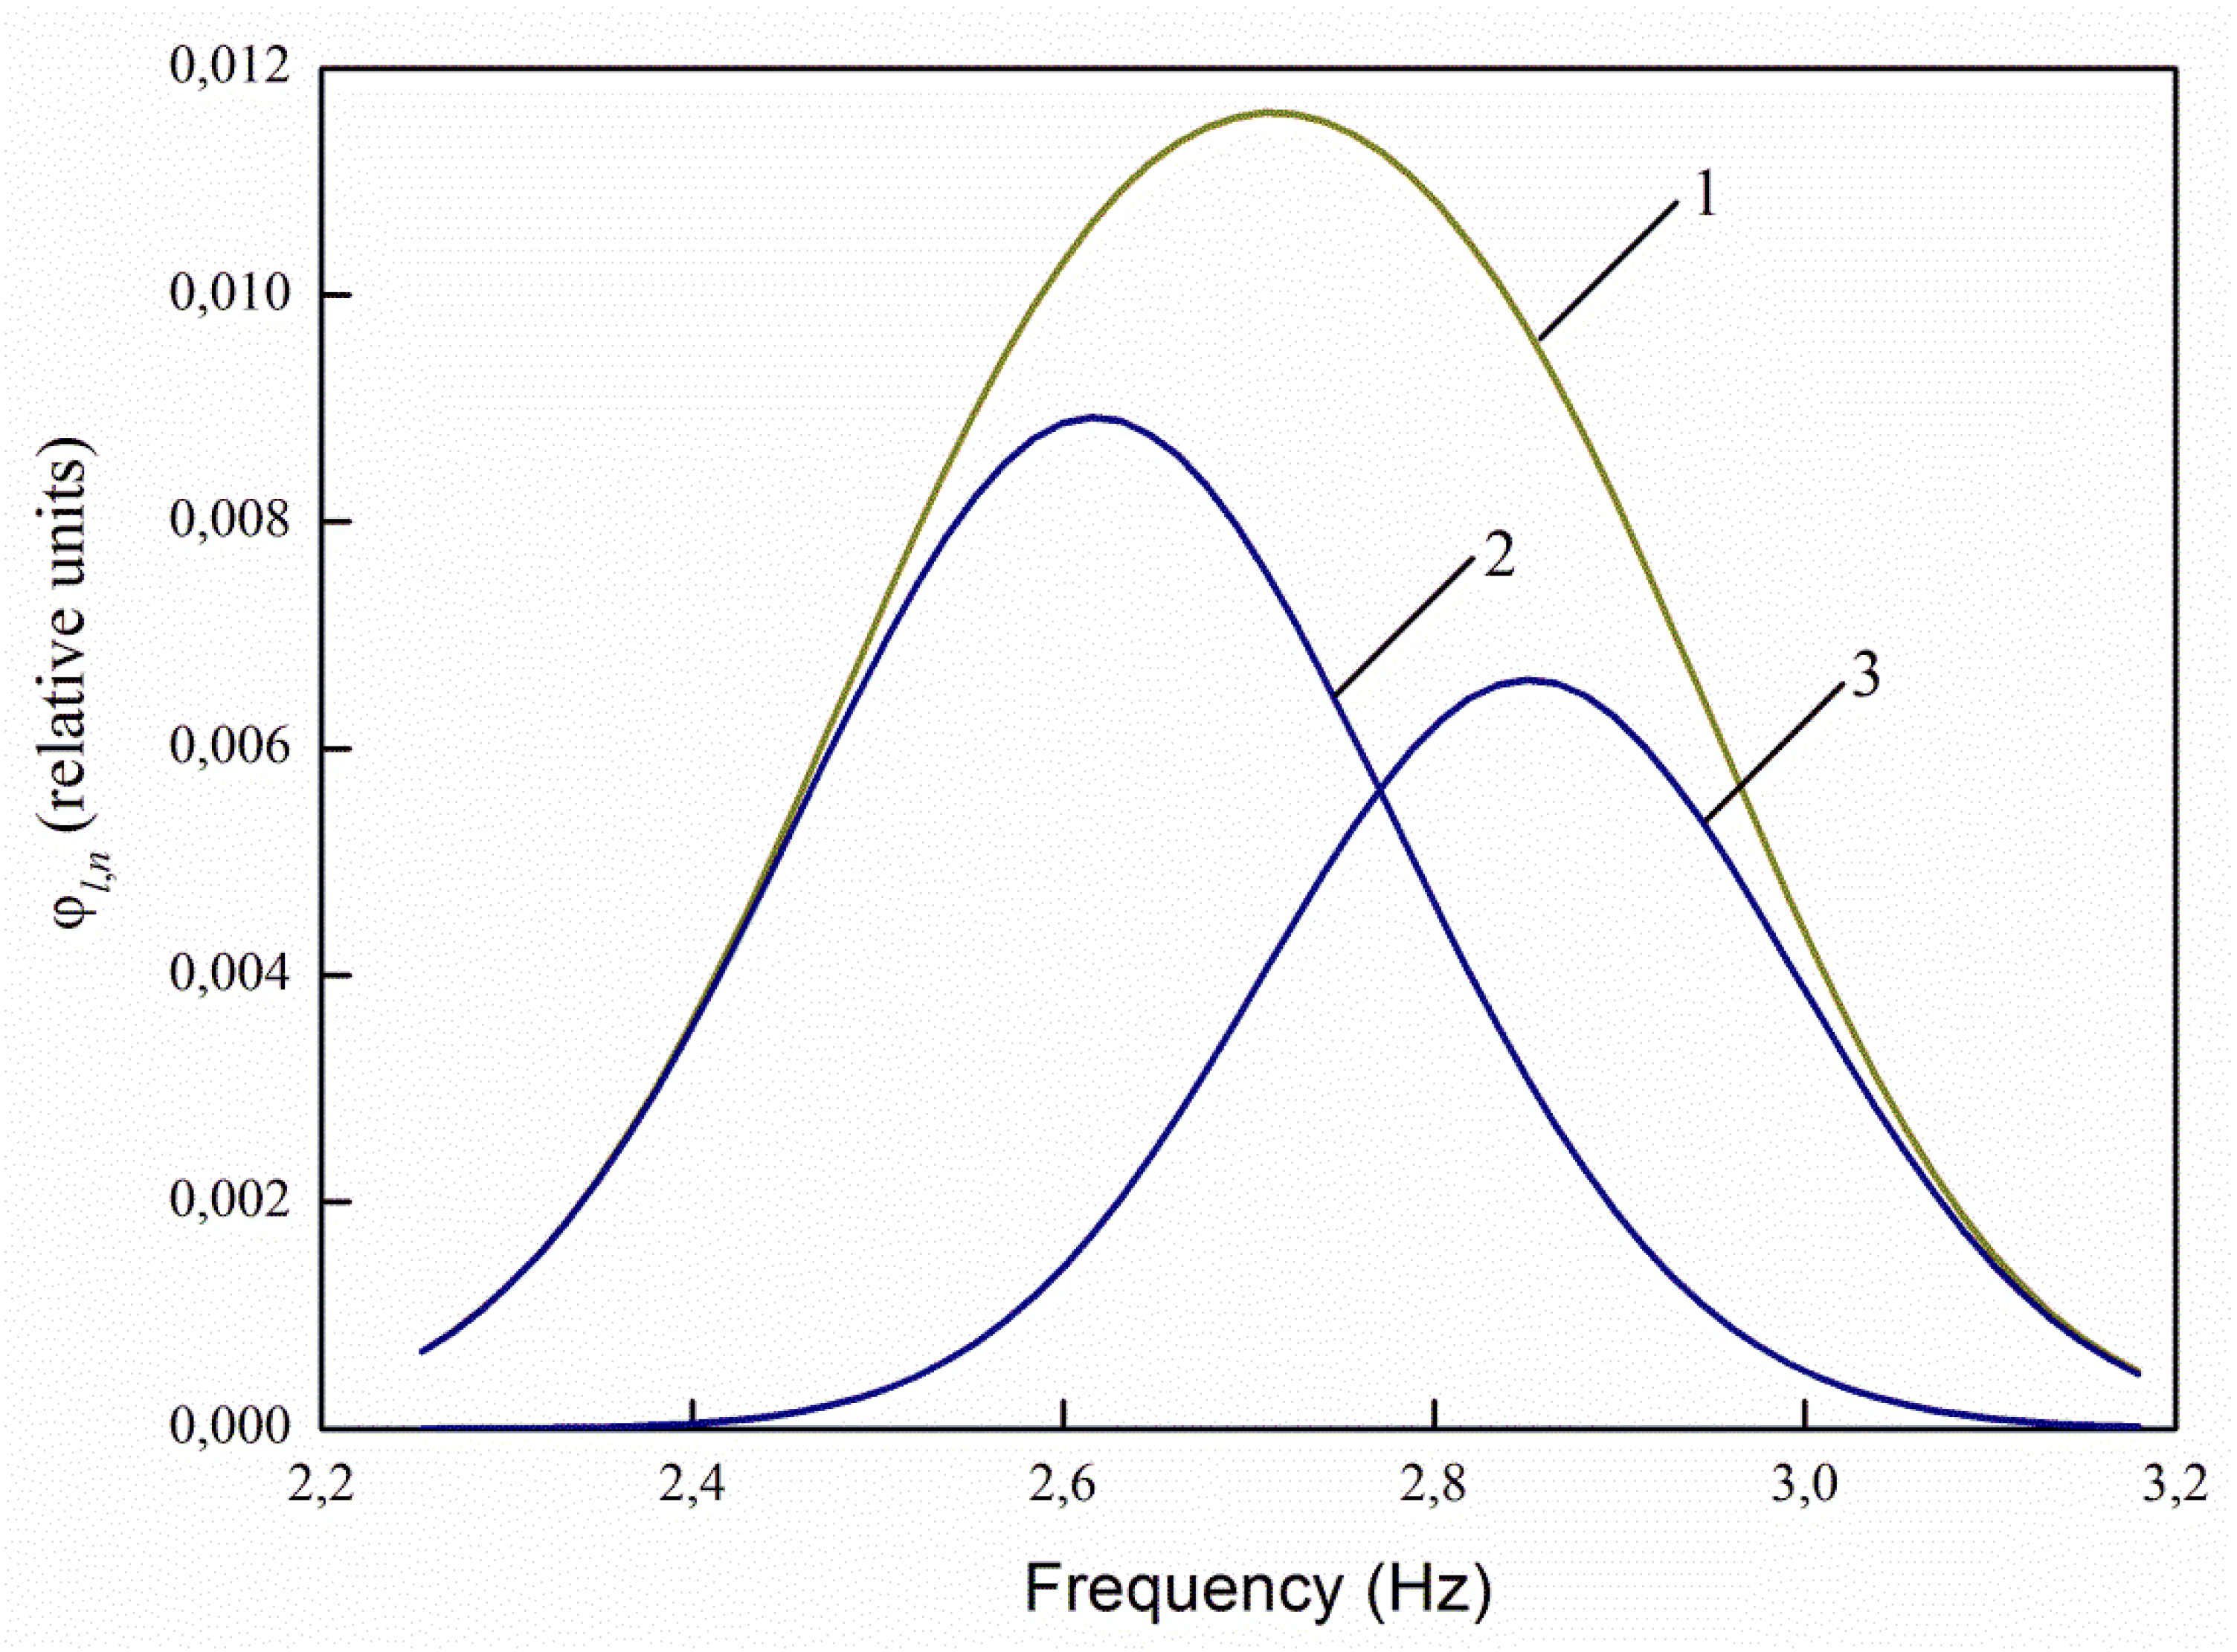
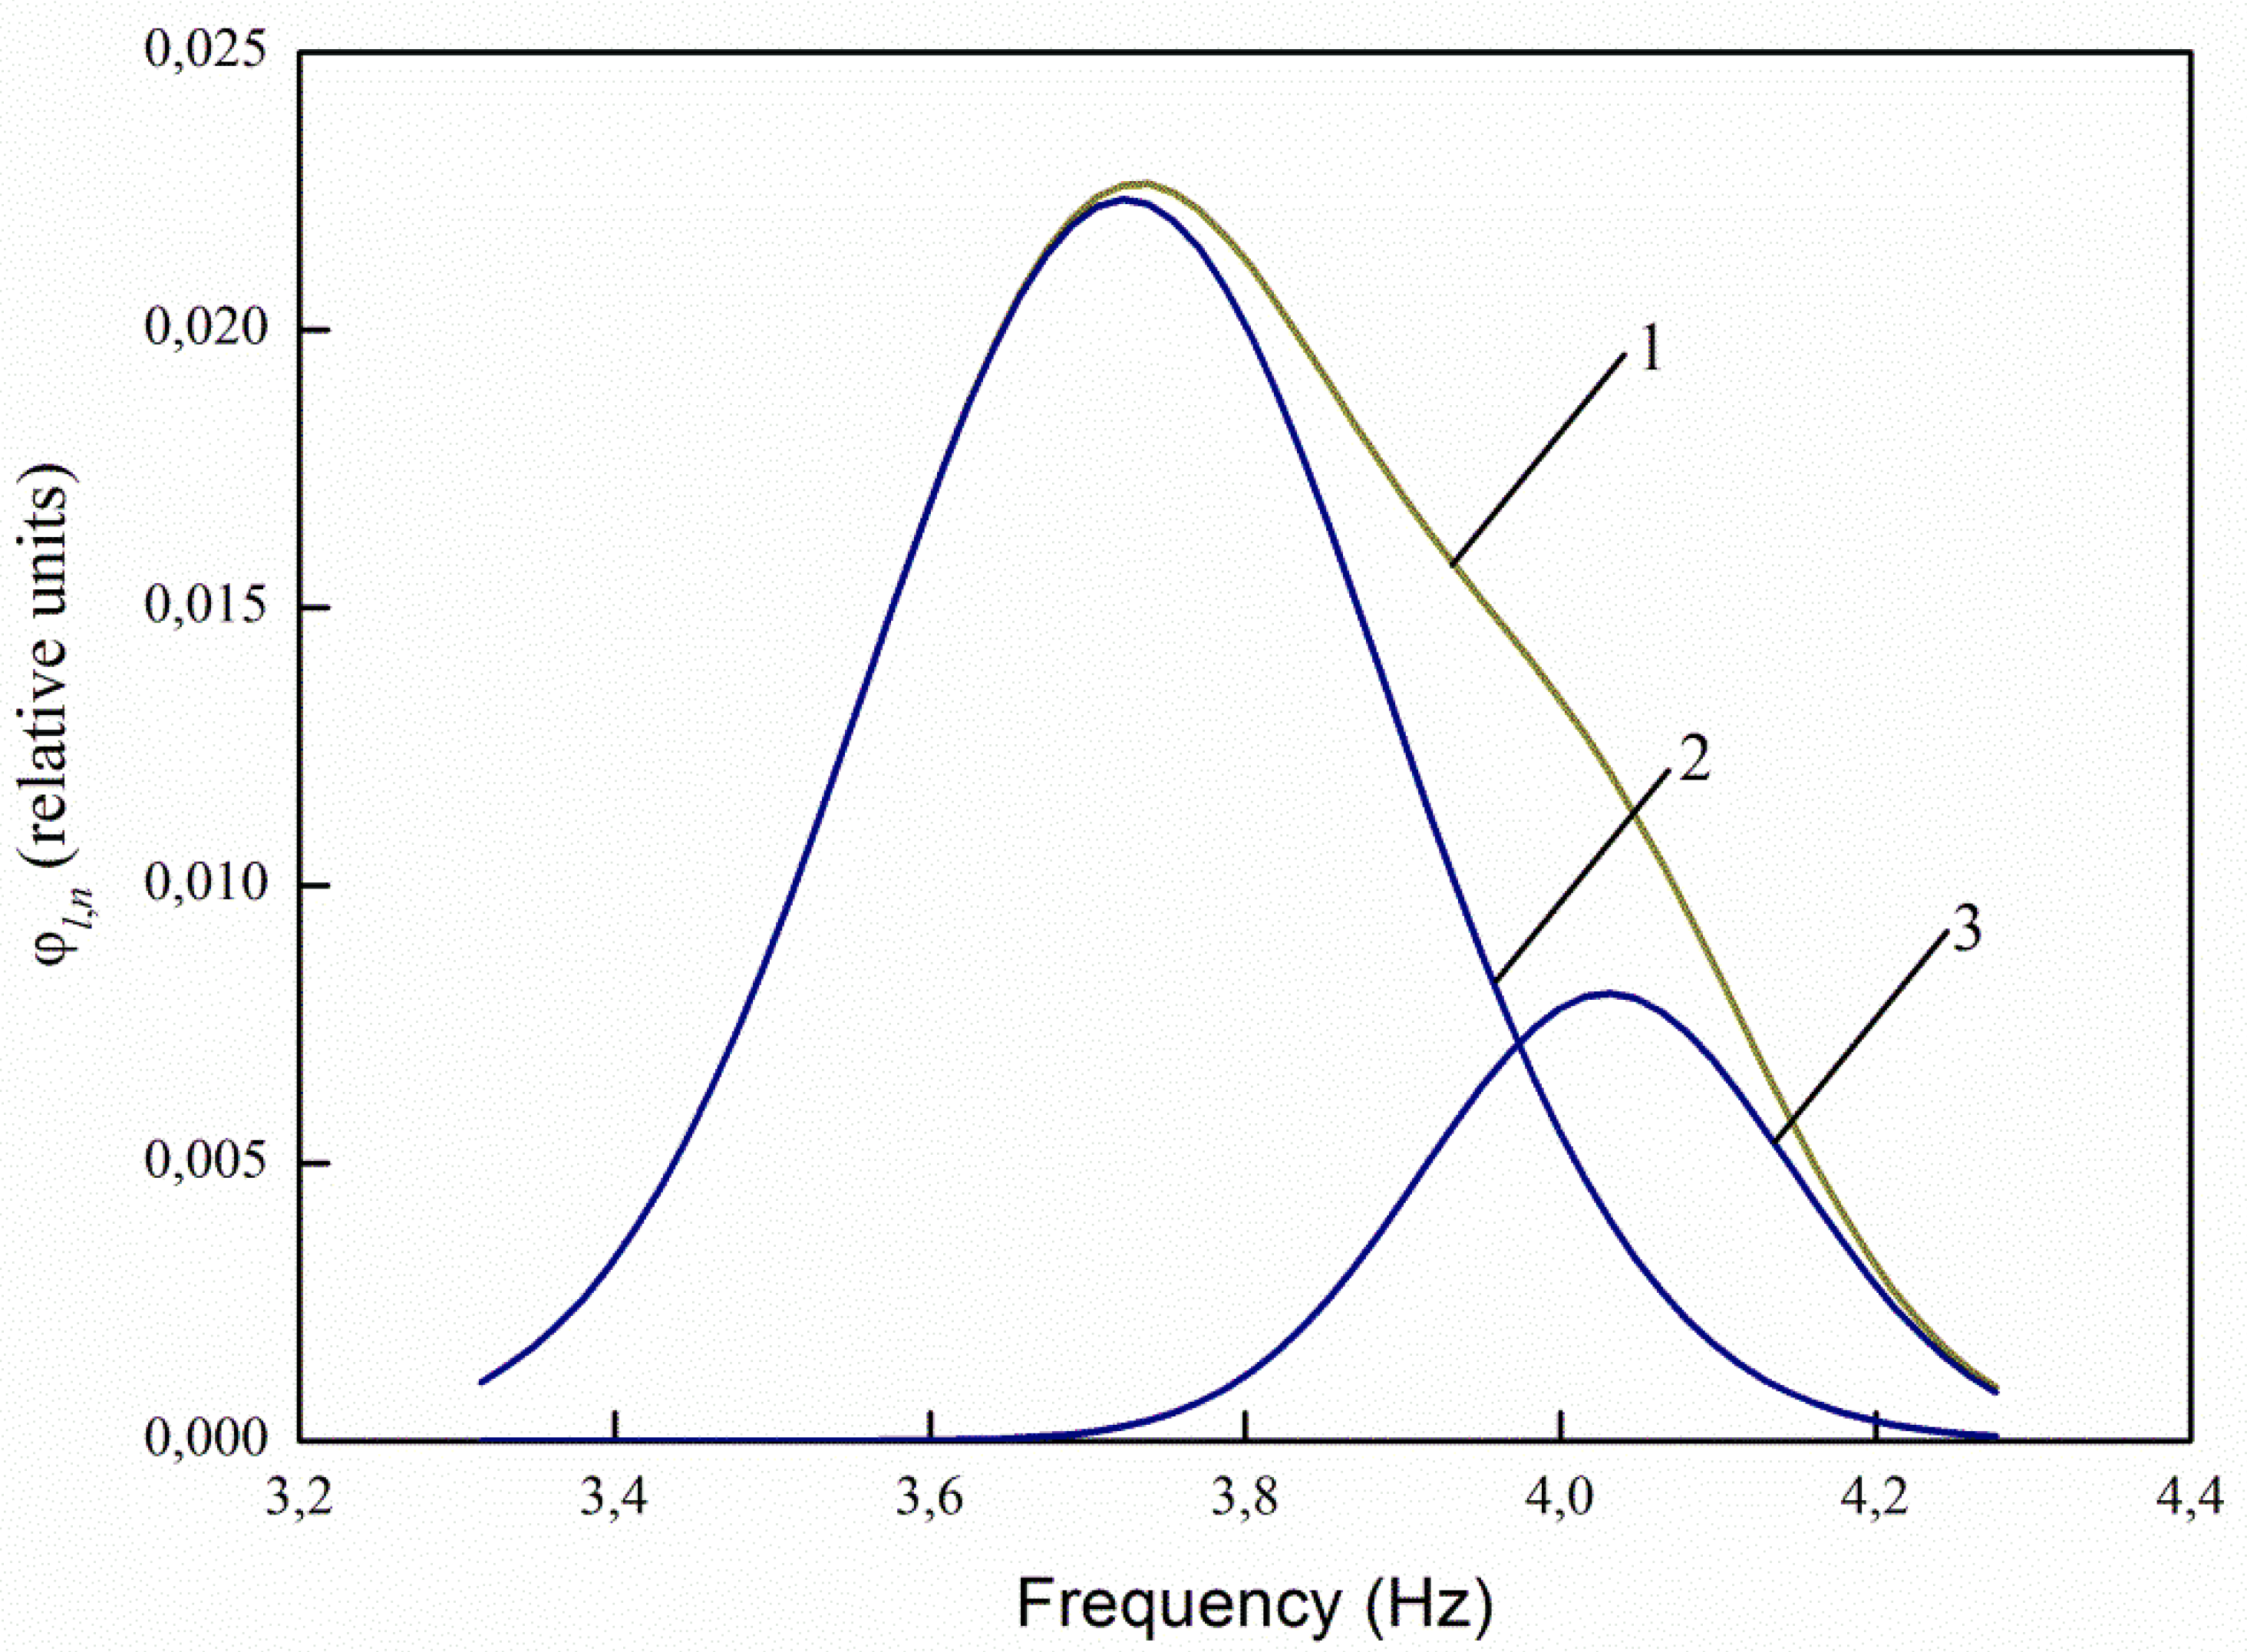
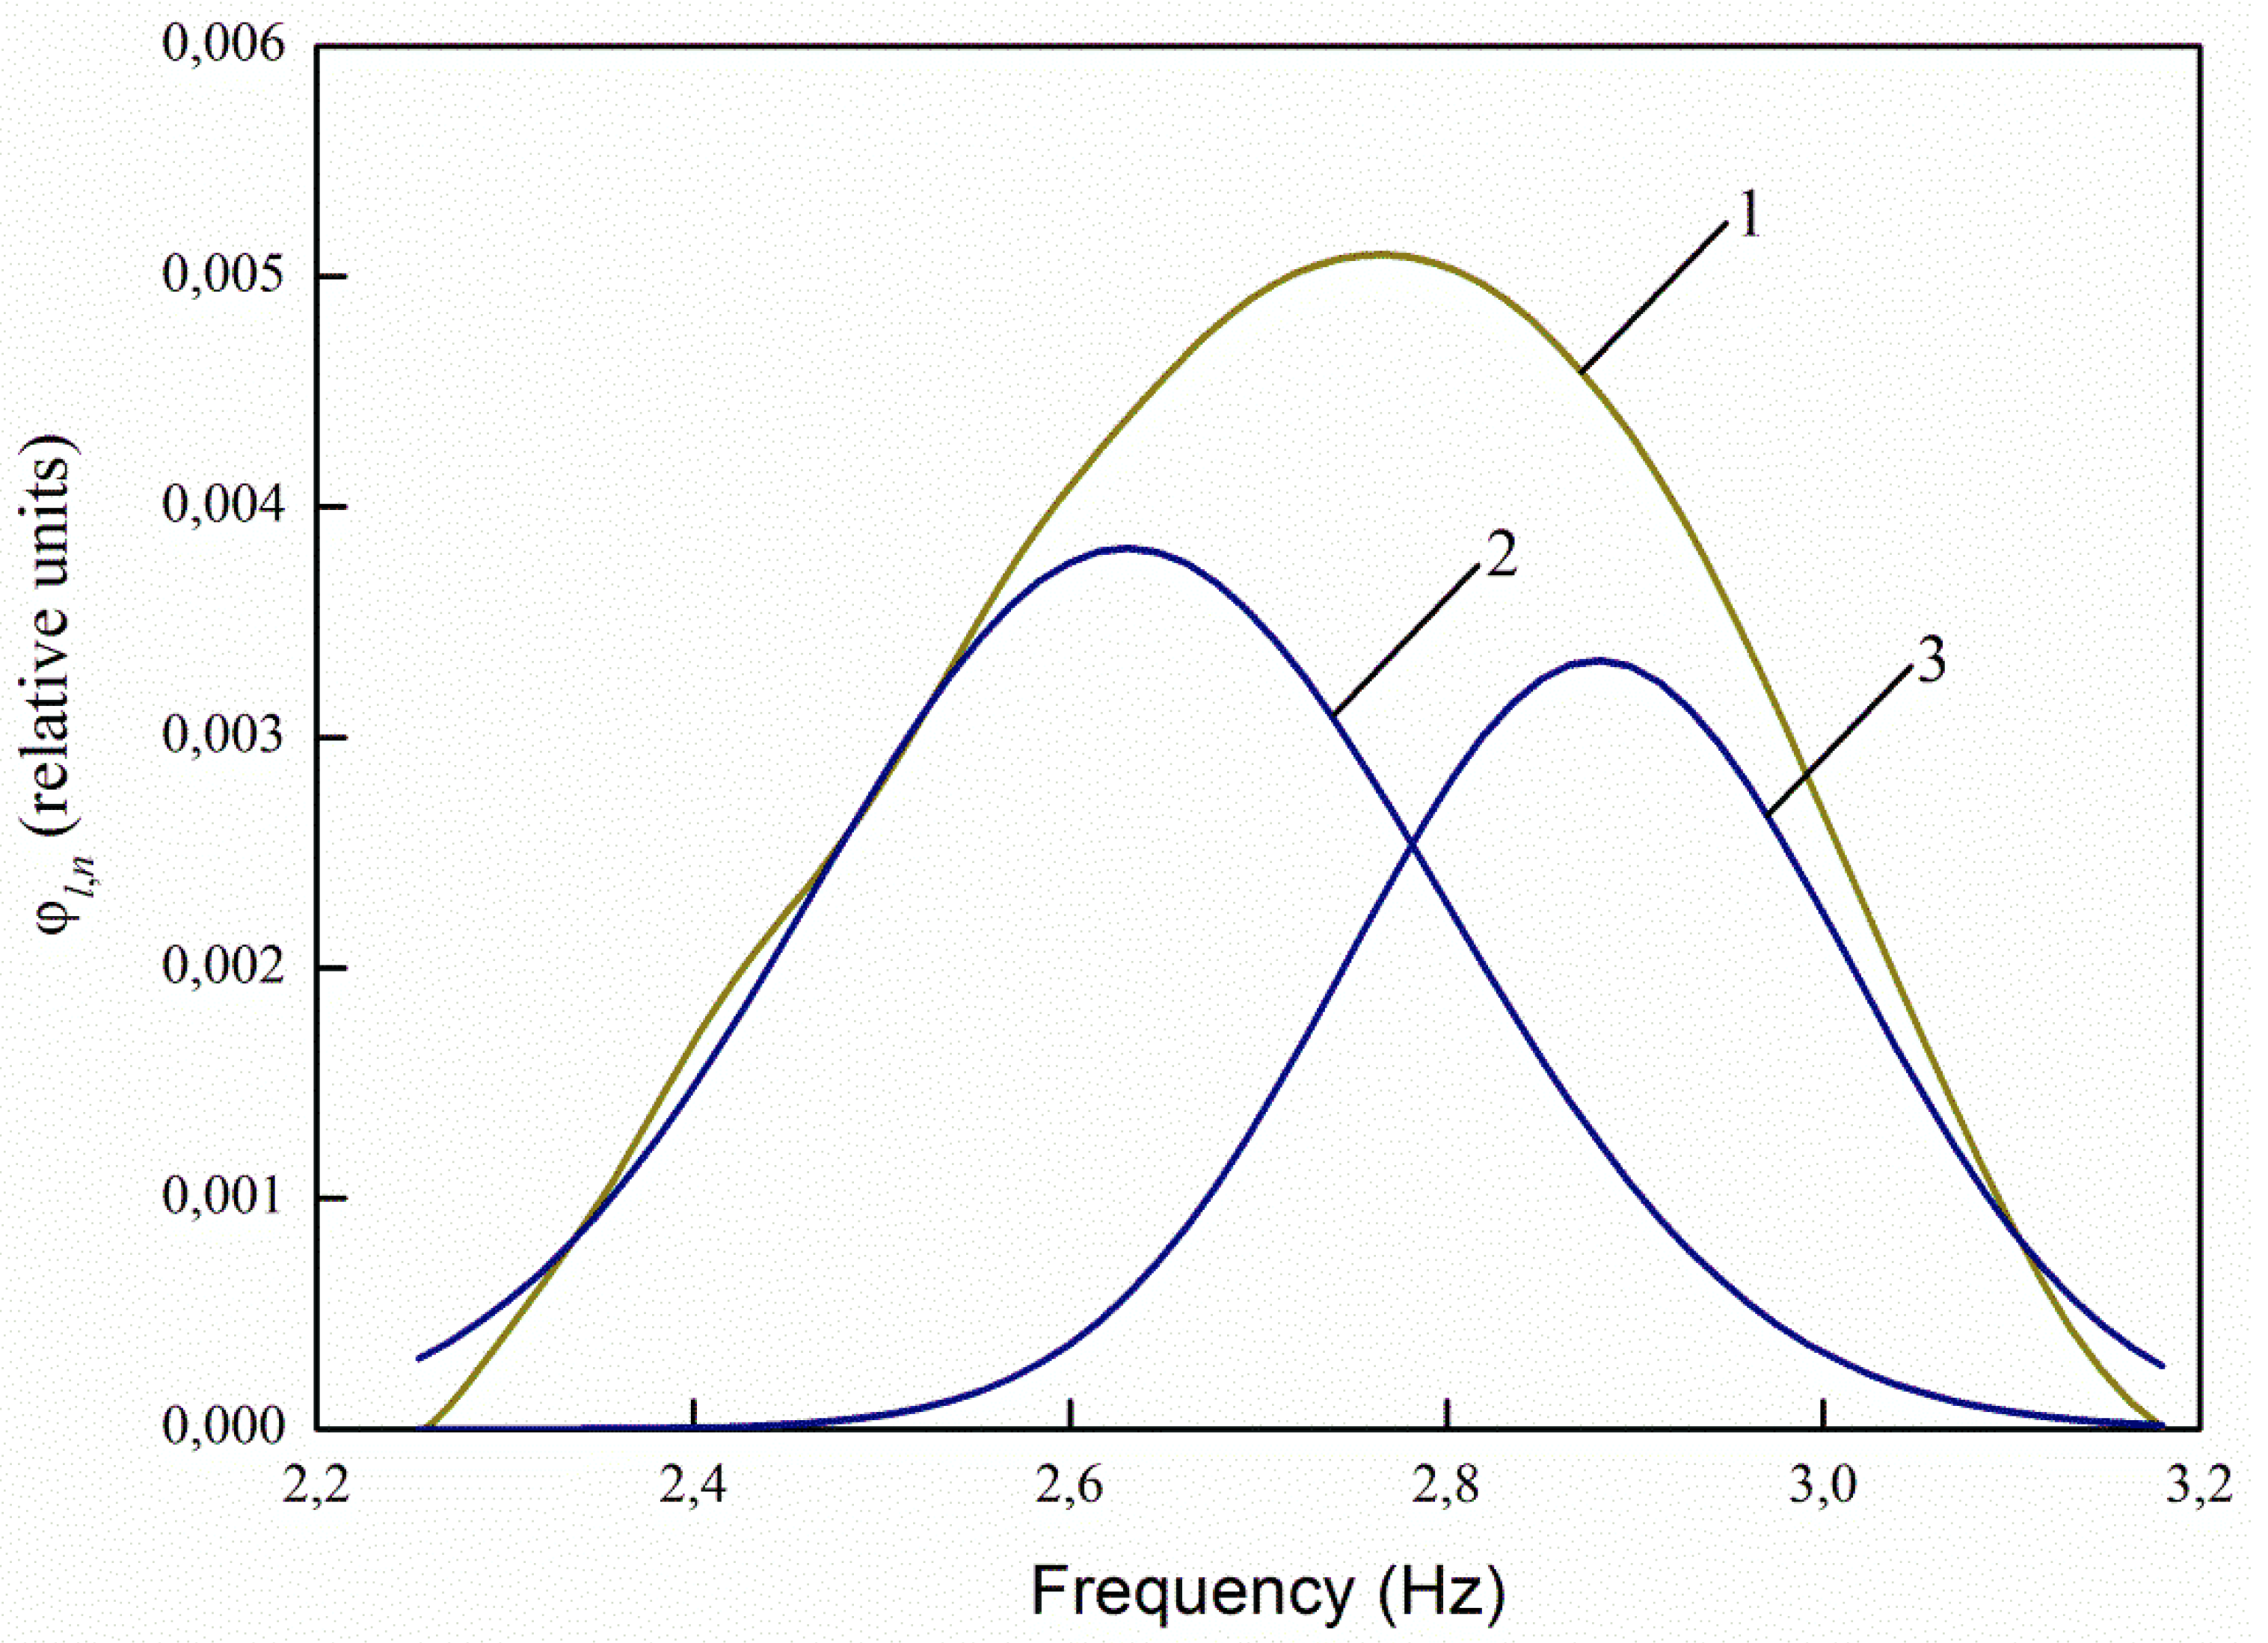
The greatest interest in the analysis of the spectra of infected and uninfected seeds decomposed into Gaussians is the ratio of the maxima of the decomposition curves 2 and 3 (
Figure 8,
Figure 9,
Figure 10 and
Figure 11). For healthy seeds at λ
e,1 = 232 nm, the ratio between the maxima of the main (central) and right curves for healthy seeds is 3.71 times, and for infected seeds it decreases to 2.88 times, i.e., by 1.29 times. At λ
e,2 = 362 nm, the ratio is 1.38 times for healthy seeds, and 1.12 times for infected ones. For excitation by radiation, the wavelength of 424 nm and 485 nm, there are no changes in the ratios.

 ,
, 


