Article

Study of Full-Color Multiplexed Transmission Holograms of Diffusing Objects Recorded in Photopolymer Bayfol HX

by
Marina Sevilla
1,
Julia Marín-Sáez
1,
Daniel Chemisana
2,*,
María-Victoria Collados
1 and
Jesús Atencia
1
1
Applied Physics Department, Aragon Institute of Engineering Research (I3A), Faculty of Science, University of Zaragoza, Pedro Cerbuna 12, 50009 Zaragoza, Spain
2
Applied Physics Section of the Environmental Science Department, Polytechnic School, University of Lleida, Jaume II 69, 25001 Lleida, Spain
*
Author to whom correspondence should be addressed.
Photonics 2021, 8(11), 465; https://doi.org/10.3390/photonics8110465
Submission received: 30 September 2021 / Revised: 15 October 2021 / Accepted: 19 October 2021 / Published: 22 October 2021
(This article belongs to the Special Issue Materials, Methods and Models for Holographic Optical Elements)

Abstract

:
A wavelength multiplexing procedure for color transmission volume holograms of diffusing objects recorded in Bayfol® HX200 photopolymer is proposed. For the recording, three lasers of 442 nm, 532 nm and 633 nm, and a Spectralon® diffusing object were used for monochromatic and polychromatic calibration. Monochromatic calibration shows that the maximum index modulation obtained for each wavelength was not enough to give 100% efficiency, although the efficiency values achieved in the case of monochromatic recordings with diffusing objects were high, at around 90% for 633 nm and 532 nm recordings, and 60% for 442 nm. The efficiency values obtained for multiplexed holograms were 19.1% for the 442 nm hologram, 25.9% for the 532 nm hologram and 15.2% for the 633 nm.

1. Introduction

It is known that there are different applications of holography; it should be highlighted that color reproduction is one of the most important. The applications involve different fields—for instance, art [1], security holography [2], sensors [3,4], displays [5] and LEDs [6]. These examples show the wide range of color-hologram applications [7]. In terms of the types of panchromatic holograms, it should be noted that there are transmission-type configurations as well as reflection-type options. Reflection-type configurations are appropriate in the case of color reproduction when reconstructed with white light and are the most extended type. However, in the case of transmission-color holograms, it is necessary to illuminate these devices with the required wavelengths with directions that are used in the recording stage. Nevertheless, there are some techniques (for example, rainbow color holography [8]) which allow their reconstruction using white light.
Panchromatic materials were not available until recently—this is a major disadvantage related to recording-color holograms. In 1996, Bjelkhagen et al. [9] presented a study related to this topic. The results showed that it is possible to record color holograms in a single-layer silver halide emulsion by means of wavelength multiplexing. It was found that multiplexing conditions (exposure times, intensities, etc.) depend on the photosensitive material. Nowadays there are materials (Slavich PFG-03 silver halide plates, or photopolymers such as Bayfol® HX) that are sensitive to a wide range of wavelengths, allowing the recording of color holograms.
Although the most widespread color holograms are the reflection type, numerous applications that require the use of transmission holograms such as the recording of rainbow color holograms from a master [10], augmented reality systems [11] or diffusers [12], can benefit from the new panchromatic recording materials.
One of the main advantages of panchromatic photopolymers over other panchromatic recording materials like silver halides is the grain absence, which avoids diffusion in the blue region. In previous works published about multiplexed holograms in photopolymers, two main recording techniques are described: simultaneous and sequential exposure. In simultaneous exposure, the recording material is illuminated with different wavelengths at a time and during the same time period. The exposure energy for each wavelength depends on the exposure time (the same for all) and the intensity of each laser, which has to be controlled accurately by means of lasers with variable power, continuous density filters or two combined linear polarizers. An inadequate adjustment of the intensity of each wavelength can lead to troubles in color reproduction, as the resulting efficiencies of the wavelengths involved are then difficult to control [13]. In sequential exposure techniques, the recording material is exposed to each laser separately, one wavelength after the other, and during a time interval—which can be different for each one. A variation of this technique founded on time-scheduled iterative exposition, and consisting of repeating an illumination sequence for a certain number of cycles was used by Piao et al. [11,12], achieving high diffraction efficiencies (over 50%) for transmission-type multiplexed gratings.
It should be noted that in the studies described above (by other authors) the calibration has been carried out by recording holographic gratings. In none of them were the recording and calibration conducted by placing a diffusing object in the object beam. Holograms of diffusing objects perform quite differently than gratings or any type of direct beam interference since, in that case, the light is scattered in the object and multiple interferences are produced between scattered waves and with the reference wave. This phenomenon produces speckle on the recording material, increasing the mean refractive index and, thus, decreasing the effective modulation of the refractive index in comparison to plane-wave holograms [14]. Vazquez et al. analyzed this effect in color reflection holograms recorded in Bayfol® HX photopolymer and optimized its efficiency [15] using simultaneous exposure with different times.
An important aspect in color hologram recording is the number of wavelengths necessary for reliable color reproduction. Bjelkhagen et al. [16] found a tolerable error in color reproduction when three lasers with wavelengths around 466, 545 and 610 nm were used. Increasing the number of wavelengths leads to an improvement in color reproduction, but also increases the cost and complexity of the recording set-up, so a trade-off solution should be considered to balance complexity and accurate color reproduction.
Bearing in mind the issues mentioned above, the present investigation analyzes the behavior of volume transmission holograms of color diffusing objects in self-developing photopolymers, deepening the understanding of these kinds of holograms. The technique uses simultaneous exposure with different times for the lasers involved, with the goal of obtaining uniform and high efficiencies for the comprised wavelengths. The procedure regards the polychromatic calibration of the photosensitive material by directly including the diffusing object (Spectralon® target). To the best of the authors’ knowledge, there are no previous works by other authors performing a polychromatic calibration of the photosensitive material with a diffusing object in transmission volume holograms. The photosensitive recording material utilized is the panchromatic Bayfol® HX200 photopolymer, and the number of lasers selected is three. In the Materials and Methods section, the recording material and the experimental setup used are described, together with an explanation of the effect of chromatic selectivity of volume holograms in multiplexed holograms. Besides this, in this section the methodologies of the monochromatic and polychromatic calibrations are explained. The following section includes experimental results and discussion. Finally, the main conclusions are stated.

2. Materials and Methods

2.1. Photosensitive Material

The material used in this work is a self-processing photopolymer, Bayfol ®HX200 [17,18], which has enough sensitivity to make transmission or reflection volume holograms with wavelengths from 440 nm to 680 nm. The photopolymer layer had a thickness of 16 ± 2 µm and was deposited on a polycarbonate substrate. The characteristics of the unexposed photopolymer and the performance parameters can be found in [17,18]. The material had peaks of absorption around 655 nm (85%) and 520 nm (55%). Since the absorption curve presented a minimum around 570 nm (30%), a darkroom safelight around this wavelength could be used to manipulate the material before exposition. In the recordings conducted in the frame of this work, a 590 nm LuxeonRebel LT1012 LED light located at least 50 cm away from the unexposed material was used.
The hologram formation in this material was related with the gradient of monomer concentration achieved during the recording step. When the material was exposed to light, the polymerization began in the regions where it received enough light, decreasing the monomer concentration and causing a monomer concentration gradient and its diffusion from the high concentration to the low concentration regions. After 5 min, a refractive index variation pattern was obtained and the hologram was already formed in the photopolymer. To fix the hologram (polymerization of the remaining monomer and bleaching of the dye) it was necessary to illuminate it with a white light led lamp of 50 W for 25 min [19].
There were no significant changes in material thickness during the process. This feature makes the Bayfol® HX 200 ideal for recording holograms in real color. The maximum index modulation achievable with this material in reflection gratings is Δn ≅ 0.033 [17]. However, in the case of transmission gratings, the index modulation depends linearly on the spatial frequency of the recorded hologram (e.g., for a frequency of 1000 lines/mm, Δn ≅ 0.024 [20]). Smaller effective modulation is expected for the recording of diffusing objects due to intermodulation noise produced by the interference between object points.
Bayfol® HX 200 sheets have a slight curvature that allows the identification of the surface of the photopolymer and the substrate. The convex part corresponds to the photopolymer. Before recording, the samples should be directly adhered to a 3.9 mm thick glass thanks to the viscosity of the photopolymer, in order to increase their mechanical stability. Prior to this step, the glass must be carefully cleaned to provide as few dust particles as possible. The presence of these particles when adhering the photopolymer to the glass causes the existence of bubbles that can produce vibrations in that zone of the photopolymer, averaging the interferential figure and so avoiding hologram formation.

2.2. Experimental Setup

To obtain color transmission holograms, three lasers with different wavelengths have to be used in the recording. The optimal wavelengths to obtain a color reproduction with tolerable error were stated by Bjelkhagen and Mirlis [16]. In the present work, we chose three lasers with wavelengths close to the optimal ones. Figure 1 shows the main characteristics of the lasers, the reference optimal wavelengths and the wavelengths shown in the CIE diagram. The lines marked in white enclose the colors that can be reproduced with the three wavelengths used in this work.
Figure 2 shows a scheme of the set up used in the recording of color transmission holograms. The three beam lasers were combined using dichroic mirrors, designed to reflect only a portion of the visible range. Red and green lasers were combined using a Chroma T556lpxr mirror, with high transmittance for wavelengths above 556 nm. Both lasers were combined with the blue one by means of a Chroma T470lpxr mirror, which has high transmittance for wavelengths above 470 nm. To equalize the diameter of the three lasers, the beam transversal section of the blue laser was increased by using a Galileo telescope.
The three beams passed through a 30/70 beam splitter. The reflected beam had less intensity and was used to illuminate the object. In this way, a relation of 1/10 between object and reference beam was obtained. This relation is desirable in diffusing object hologram recordings to minimize the intermodulation terms produced by the interference of the light diffused by each point of the object, while maintaining high contrast in the interference of the object and reference beams. To assure the coherence between the two beams, the optical path travelled was similar for both beams.
The object and reference beams were expanded and spatially filtered by using microscope objectives (x10 in the case of the reference beam and x4 in the case of the object beam) and pinholes. A collimating lens was used to obtain a plane reference beam.
As a diffusing object, we used a Spectralon® sheet, which has highly Lambertian behaviour and uniform spectral reflectance.
The exposure time of each laser was controlled by three shutters located before the beam splitter.
The angle between object and reference beam must assure the recording of three independent gratings, as is explained in the next subsection. In this case, this angle had to be 50°.

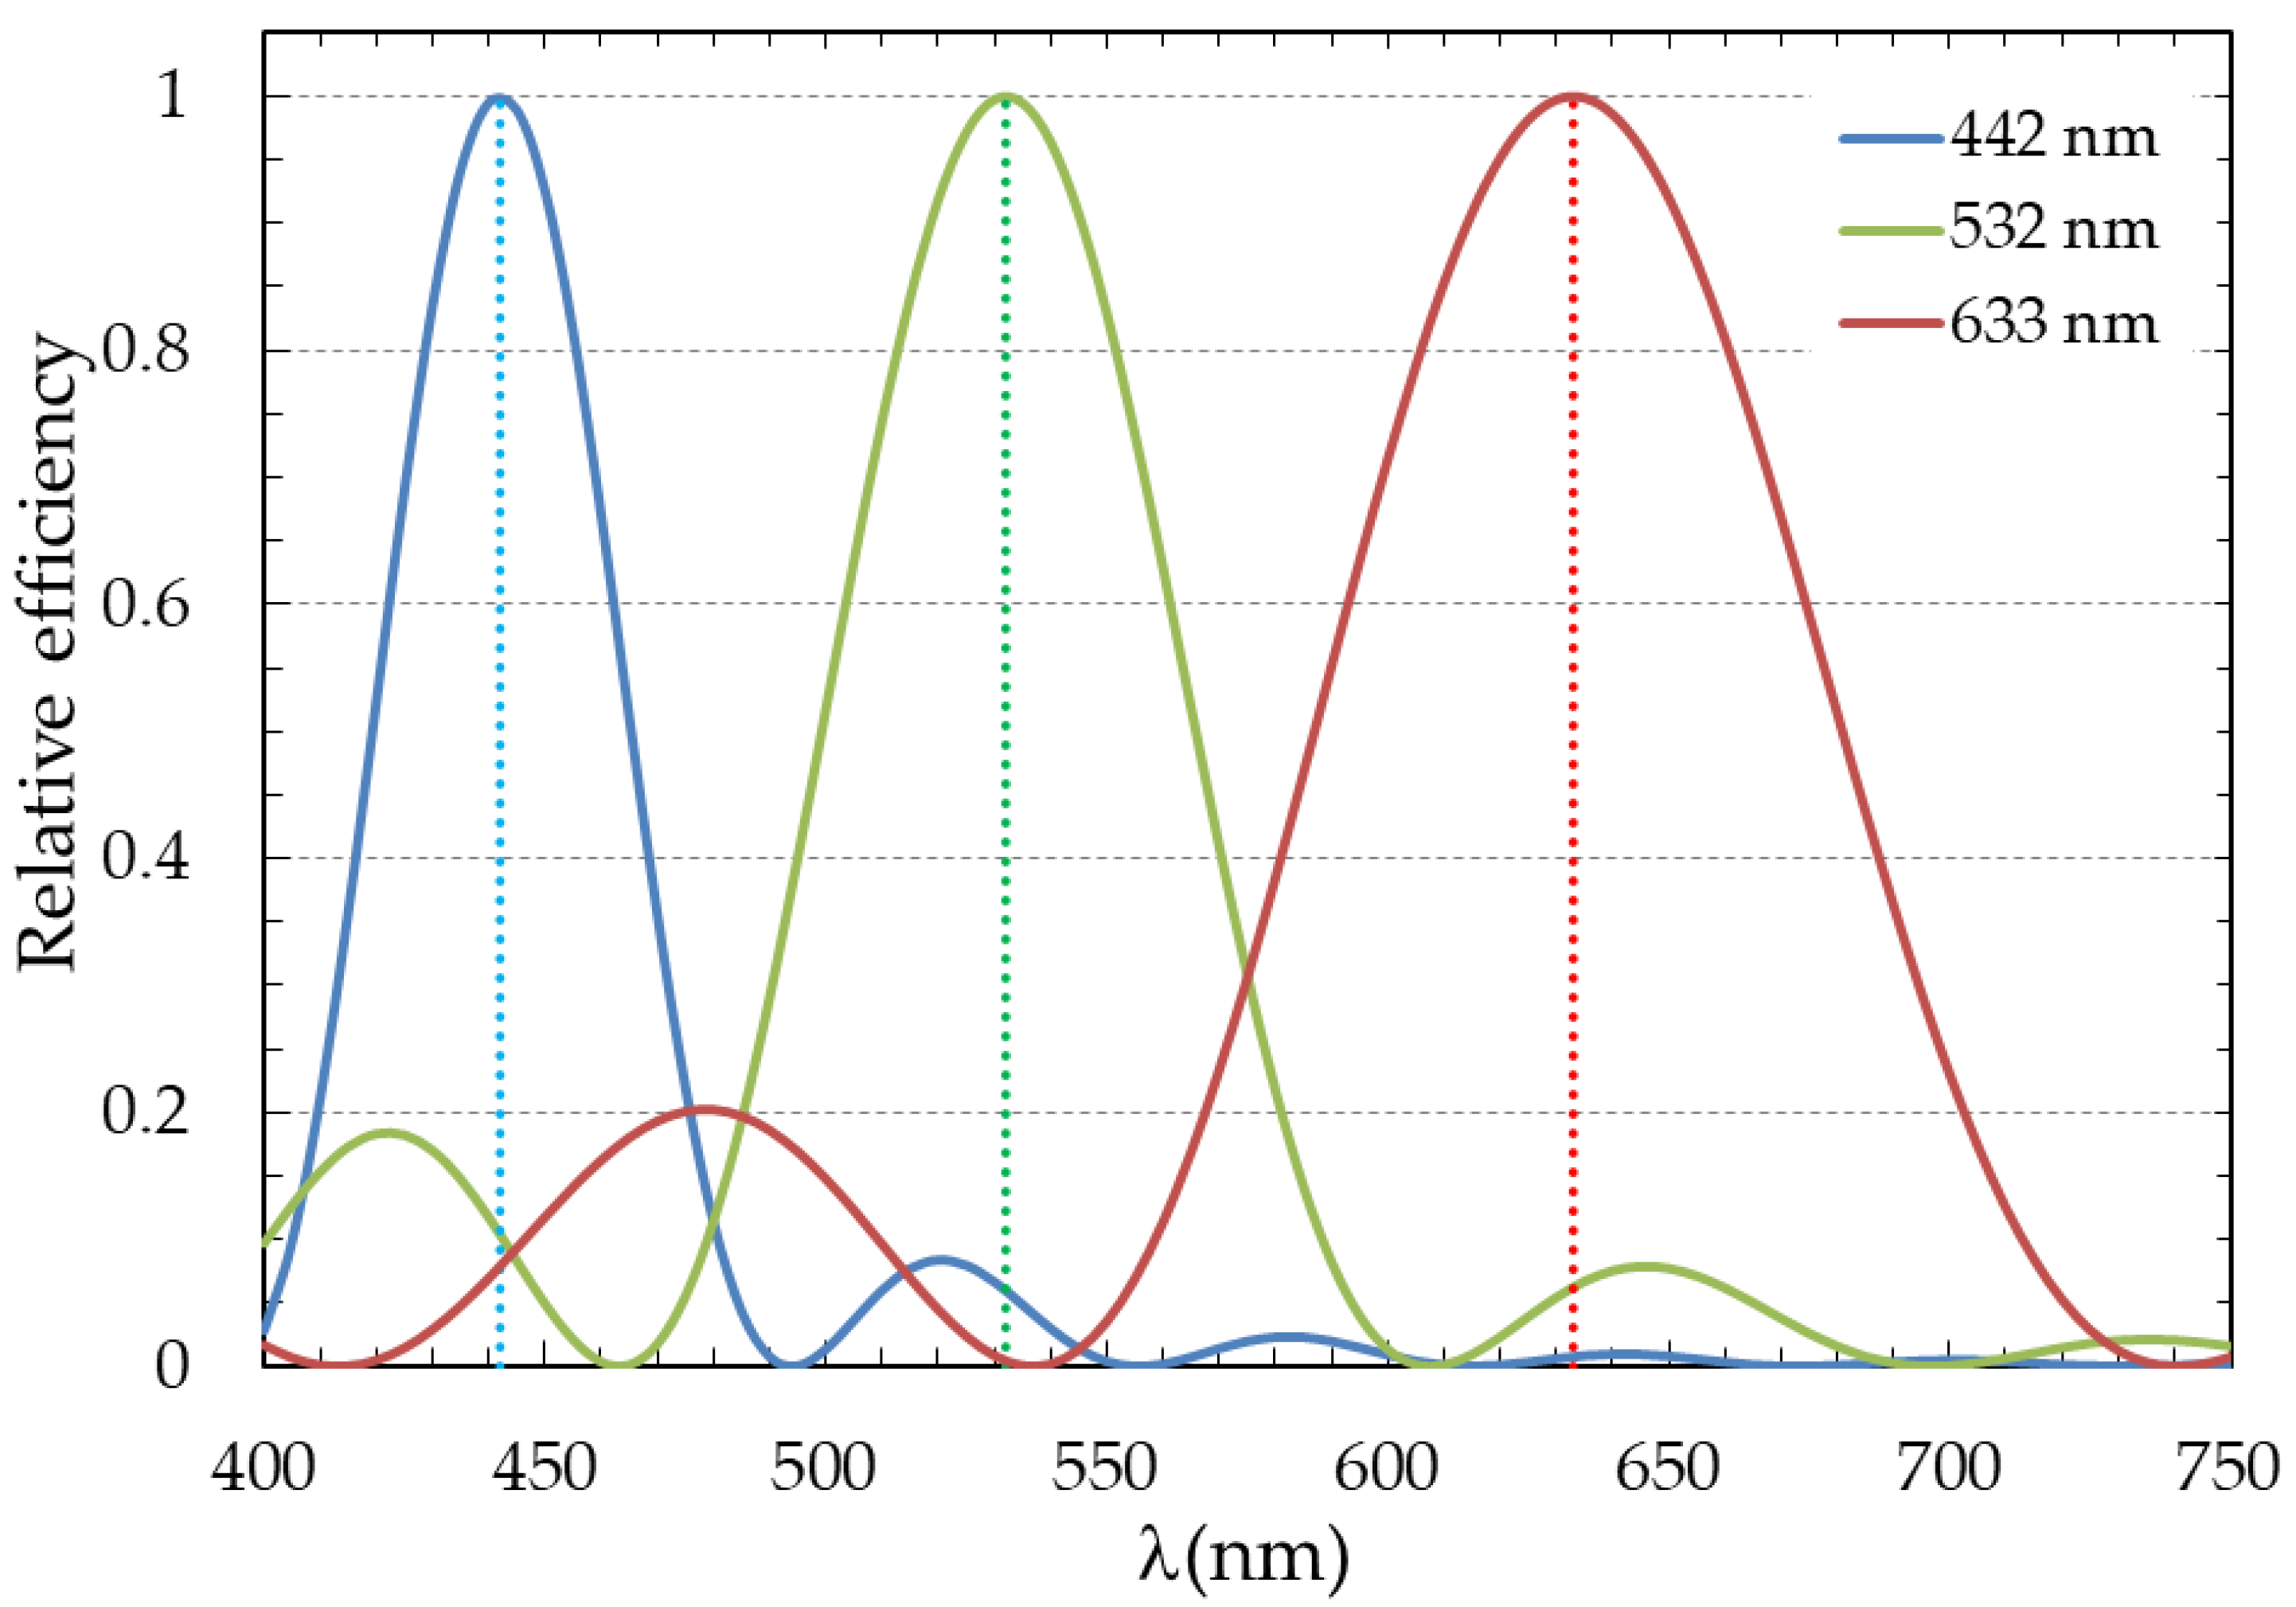
2.3. Chromatic Selectivity in Transmission Volume Holograms

When a volume transmission hologram was illuminated in the reconstruction step, two diffraction orders appeared at the output: zero order (transmitted wave that is not diffracted) and +1 diffracted wave. In this type of hologram, absolute efficiency ( η a ) and relative efficiency ( η ,) can be defined as follows:
η a = I + 1 I i
η r = I + 1 I + 1 + I 0
where I i is the intensity of the incident beam; I 0 and I + 1 are the intensities of the 0 and +1 order at the output.
In the relative efficiency definition ( η r ), reflection and absorption losses derived from the recording material are not taken into account. This is the efficiency definition that we used in this paper.
Angular and chromatic selectivity types are characteristics of volume holograms: for each wavelength, maximum efficiency is obtained only when the incident direction in the reconstruction fulfils the Bragg condition:
2 n 0 Λ sin θ 0 = λ
where n 0 is the average refraction index of the recording material, Λ is the distance between two planes with the same refraction index and 2 θ 0 is the angle between object and reference beams into the medium.
Relative efficiency values obtained when the illumination is near Bragg condition can be computed from the following expression:
η r = sin 2 ( ν 2 + ξ 2 ) 1 + ξ 2 ν 2
where ν and ξ coefficients are defined by:
ν = π n 1 d λ c r c s
ξ = ϑ d 2 c s
d is the holographic material thickness, n 1 is the refraction index modulation obtained in the recording step, c s is the cosine of the incidence angle of the object beam, and c r is the cosine of the incidence angle of the reference beam into the medium. The n1 value depends on the characteristics of the recording material and can be experimentally adjusted to obtain η r = 1 if the material dynamic range is enough.
The ϑ coefficient is related to the deviation of the illumination from the Bragg condition. If a transmission volume hologram is illuminated with polychromatic light in a range of wavelengths around the wavelength λ 0 that fulfills the Bragg condition, ϑ can be expressed as [21]:
ϑ = K 2 ( λ 0 λ ) 4 π n 0   ,
where K = 2 π Λ . When the Bragg condition is fulfilled, ξ = 0 and the efficiency obtained for λ 0 will be 100 % if the index modulation is enough ( ν = π 2 ).
Figure 3 shows relative efficiency vs. wavelength curves (chromatic selectivity) of holograms recorded with 50° between the object and reference beams (in air), when the Bragg condition is fulfilled for the three λ 0 values. These λ 0 values correspond to the wavelength values of the lasers used in the recording (Figure 1). In Figure 3, the maximum efficiency value corresponding to one λ 0 coincided with low efficiency values of the other two curves, which implies that the three holograms recorded with λ 0 and 50° between the object and reference beams were independent. When the holograms were illuminated with monochromatic light in the reconstruction step, only one hologram was efficient for the illumination wavelength, which allowed the reconstruction with the laser light of the transmission color holograms.

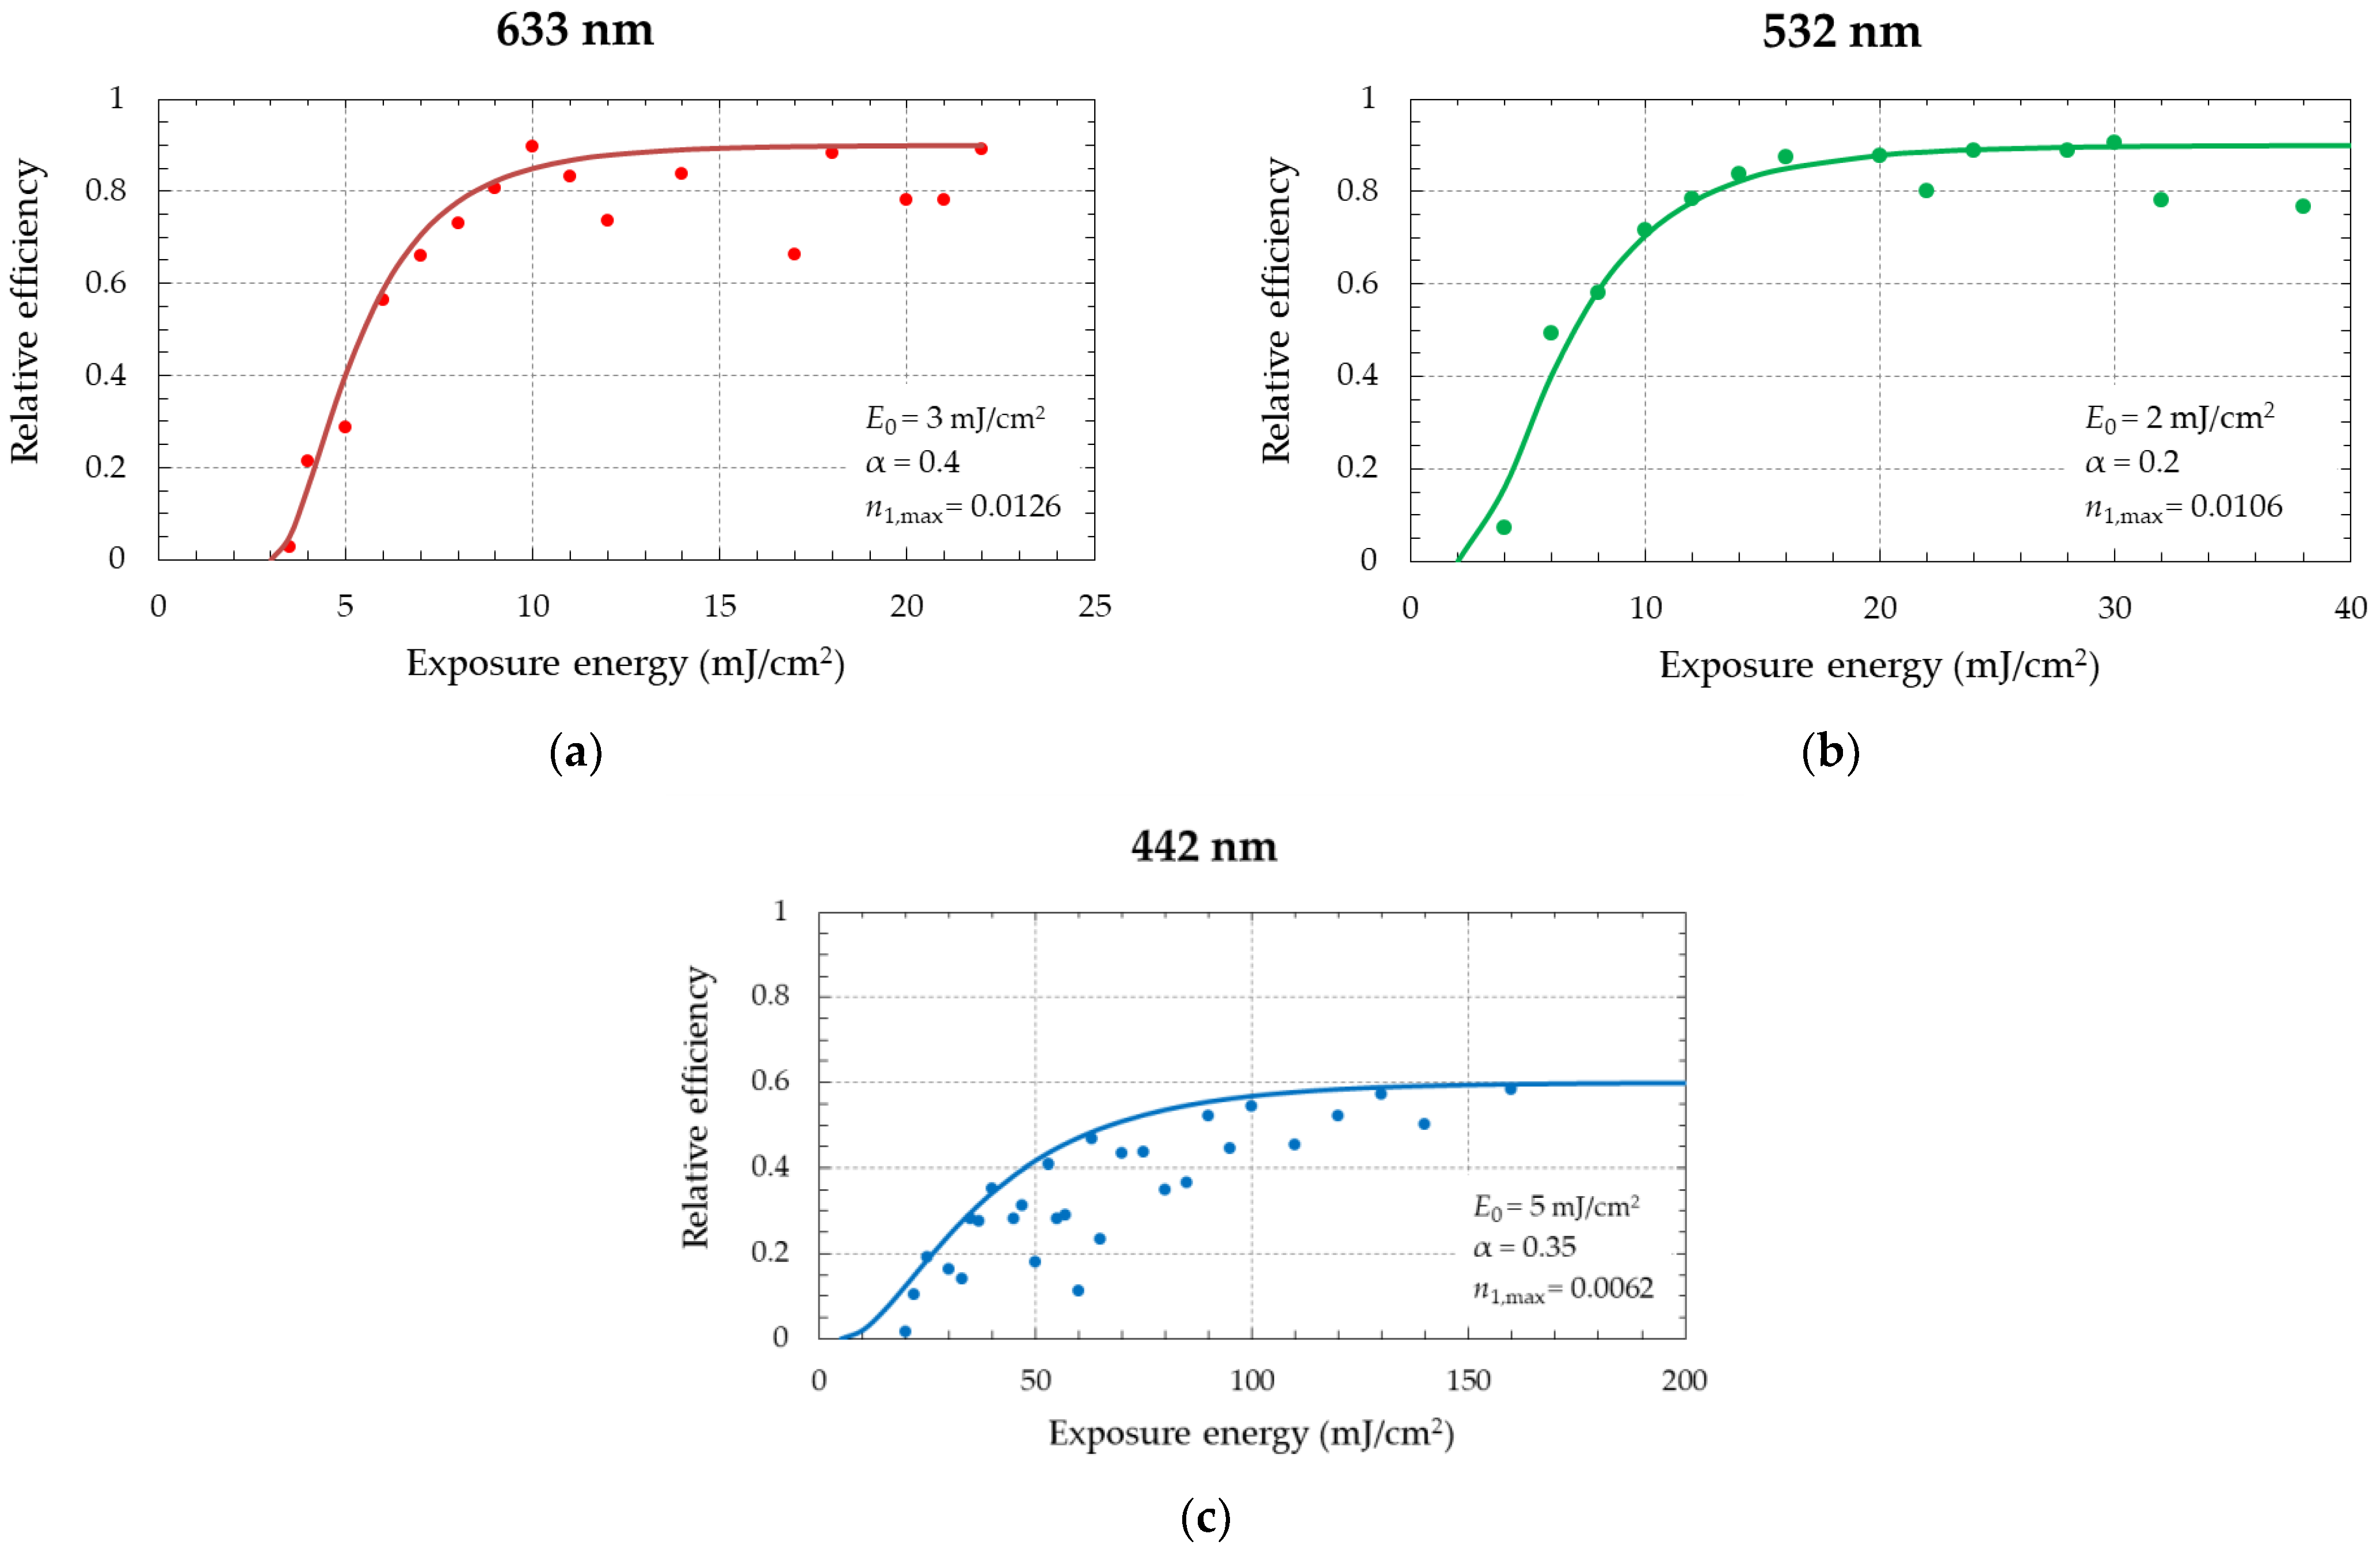
2.4. Monochromatic Calibration

Monochromatic calibration was used to obtain the exposure energy value that gave the maximum efficiency in the recording with each wavelength. With each laser separately, several recordings were carried out with different exposure times. The dependence curve of η r with exposure could be different, depending on the dynamic range of the recording material.
As can be seen in the previous section (Equations (4) and (5)), the relative efficiency in Bragg conditions ( ξ = 0 ) depends on the index modulation n 1 :
η r = sin 2 ( π n 1 d λ c r c s )
Index modulation can be controlled by exposure time. Usually, in photopolymer materials, index modulation is linear, with exposure only for a range of exposure values. Above this range, index modulation saturates, reaching a maximum value n 1 , m a x . Taking this into account, the following theoretical model for the index modulation–exposure dependence can be proposed [15]:
n 1 ( E ) = n 1 ,   m a x ( 1 e α ( E E 0 ) )
where E 0 is the minimum exposure value needed to get a value of n 1 different from zero, and α refers to the slope of the linear region.
Considering Equations (8) and (9), theoretical curves of η r vs. exposure present different shapes, depending on the n 1 ,   m a x value. If the n 1 ,   m a x value is not enough to reach 100% efficiency for reconstruction with the recording wavelength, the curve is as shown in Figure 4a. If the material can reach a maximum index modulation value n 1 ,   m a x above the value that would give 100% efficiency for the recording wavelength, the efficiency vs. exposure curve is as presented in Figure 4b. In this case, the hologram was over modulated, and 100% efficiency could be reached for reconstruction with wavelengths higher than the recording one.
To test if the recorded holograms in Bayfol® HX200 with efficiency lower than 100% were overmodulated, the efficiency as a function of wavelength was measured with a spectrophotometer (OCEAN OPTICS USB2000). If a maximum efficiency is obtained for a reconstruction wavelength higher than the recording one, the hologram is overmodulated. If the maximum efficiency is obtained for a reconstruction wavelength similar to the recording one, the efficiency vs. exposure curve would be similar to Figure 4a. The maximum efficiency value in this case depended theoretically on the dynamic range of the material ( n 1 ,   m a x ).
If the spectral efficiency of the holograms recorded with each wavelength were not overlapping—as suggested in Figure 3—if we illuminate a hologram recorded with one of the three wavelengths with the laser light of the other two wavelengths, the hologram would not be efficient. To test the performance of each hologram when the reconstruction was carried out with several wavelengths, photographs of the reconstructed diffusing object were taken.

2.5. Polychromatic Calibration

In a previous work [15], we studied different methods to record three reflection holograms with three different wavelengths in the same material. It was found that the method of simultaneous exposition with different exposure times for each wavelength provided the best results (similar efficiencies for every hologram, keeping them at the highest possible value). In the present work, we applied this method to transmission holograms; neutral filters were added when necessary to obtain exposure times of the same order of magnitude in each hologram and independent shutters allowed the operation of all the beams simultaneously, but the closing of each one at the desirable time for achieving the adequate exposure energy.
To perform the polychromatic calibration, different exposure times for every laser were considered, keeping proportionality with the exposure energy values previously found in the monochromatic calibration for reaching 99% of the maximum theoretical efficiency.
When three holograms were multiplexed in the same material, the efficiency of each hologram was lower than that of the one achieved with monochromatic exposure, because the maximum index modulation was distributed among the three wavelengths [15]. Due to this, the expected efficiency in polychromatic calibration was lower than the efficiency obtained for each hologram in monochromatic calibration.

3. Results and Discussion

3.1. Monochromatic Calibration

Figure 5 shows the results of the calibration for the three wavelengths together with the theoretical curve (Equation (8)) and the adjustment parameters.
All three graphs present a threshold exposure below which the monomer did not polymerize and the hologram did not form. To carry out the theoretical adjustment, it was taken into account that the efficiency curve followed the dependence of Figure 4a, since overmodulation in each of the holograms had been ruled out with the help of the spectrophotometer.
Figure 5 charts show that the maximum efficiency reached (both with the wavelength of 633 nm and with 532 nm) was 90%, while for 442 nm it only reached 60%. The efficiency did not reach 100% due to instabilities during the recording that caused the interference figure to average, decreasing the contrast and, therefore, decreasing the registered index modulation.
In the first tests carried out to obtain the calibration curve for the wavelength of 442 nm, very low efficiencies were obtained. This was due to the powerful fan of the He–Cd laser, which produced vibrations and air currents that caused the interference figure created in the recording step to average, significantly lowering efficiency. To avoid these inconveniences, the blue laser was isolated, placing it on a separate table. This partially solved the stability problems and higher efficiencies were achieved, although with a greater dispersion in the efficiency values obtained with this wavelength, as can be seen in Figure 5c. This dispersion is also due to the fact that the exposure times were longer, as the photopolymer had lower absorption on this wavelength.
For long exposure times, the beams were more likely to experience some perturbation, decreasing the contrast of the interference in the recording and, therefore, decreasing the efficiency of the recorded hologram. For this reason, optimal samples were not made for exposures greater than 160 mJ/cm2. However, the trend of the curve in Figure 5c shows a saturation at 60% efficiency.
In the three calibrations, the maximum efficiency was achieved with an exposure energy that tended asymptotically to infinity (E → ∞), due to refractive index modulation saturation; therefore, the exposure value was calculated for 99% of the maximum efficiency. Table 1 shows this value, as well as the maximum value of the refractive index modulation obtained with the theoretical setting.
At each wavelength, a maximum modulation of the refractive index was reached. Figure 6 shows the dependence of the index modulation with the exposure for each of the wavelengths, calculated from the experimental efficiency values with Equation (8), as well as its theoretical curve calculated with Equation (9).
The ideal value of the index modulation would give an efficiency of 100%. However, as the maximum efficiency reached experimentally was lower, it also decreased with respect to the expected value. Table 2 shows both values, experimental maximum and expected maximum if 100% efficiency were achieved, for each of the three wavelengths.
Figure 7 shows the spectrum of the diffracted beam for each of the three samples, calculated from the measured transmitted spectrum assuming that, as the holograms are volume holograms, there are only order 0 and order +1 of diffraction at the output of each hologram.
Figure 7 illustrates how the three maxima do not overlap, which means that if the three holograms are recorded with the three wavelengths involved in the same material, they will behave as three independent holograms. Table 3 shows the width at half height of the experimental maxima compared to that theoretically calculated (Figure 3).
The heights of the maxima in the experimental graph (Figure 7) are lower than the ones theoretically calculated (Figure 3) because (for the theoretical model) an efficiency of 100% was assumed, and the efficiency experimentally achieved was lower.
To verify that the efficiency values were minimal when reconstructing the hologram with a different wavelength than the construction one, each of the three samples used to obtain the spectra of Figure 7 was illuminated with the different lasers, and + 1 and 0 orders were measured to calculate the relative efficiency for each wavelength according to Equation (2). These values are included in Table 4.
Thus, when reconstructing the 633 nm hologram based on a wavelength other than that of the recording, the efficiency was lower, decreasing by 90% when reconstructing with 532 nm and 93.7% when reconstructing with 442 nm. The efficiency of the 532 nm hologram decreased by 94% when reconstructing with 633 nm and 89.9% when reconstructing with 442 nm. Finally, when reconstructing the 442 nm hologram based on the wavelength 633 nm, the efficiency decreased by 99.8%, and when reconstructing with 532 nm there was a reduction of 98.5%. The fact that the efficiency for other wavelengths (other than the construction one) was not totally zero can affect the reconstruction and indicates that the holograms were not totally independent.
The images of the diffusing object obtained when the hologram recorded for each wavelength was illuminated with the recording wavelength (Figure 8a–c) have been photographed.
Figure 8d–f show the images of the diffusing object obtained with the same holograms in Figure 8a–c respectively, simultaneously illuminated in the reconstruction with the three wavelengths. The appearance of a poorly efficient image can be clearly seen for wavelengths other than the construction wavelength.

3.2. Polychromatic Calibration

Three holograms, each one with a different laser, were recorded in the same material (multiplexed hologram). Several multiplexed holograms were made, in which the exposure energy used for each wavelength was calculated, keeping proportionality with the exposure energy values previously found in the monochromatic calibration for reaching 99% of the maximum theoretical efficiency (Table 1). After several tests with neutral density filters in the red and the green lasers, the best results were achieved by including a neutral density filter of 0.8 in the optical path of the green laser (532 nm) to obtain similar efficiencies in the recording with the three wavelengths. The results obtained for three multiplexed holograms are shown in Figure 9. Each marker type in Figure 9 corresponds to the same multiplexed hologram and the color of the marker represents the wavelength of each individual hologram in the multiplexed hologram. The square markers correspond to a multiplexed hologram in which the proportionality value of the exposure energy used for each wavelength is ~75% of the exposure values shown in Table 1 (Multiplexed hologram, MH A). The circle markers correspond to a percentage value of ~50% (Multiplexed hologram, MH B) and the triangles correspond to ~25% (Multiplexed hologram, MH C). Figure 9 includes the mean efficiency values ( η ¯ ) and the standard deviation (σ) for each multiplexed hologram. The standard deviation tended to decrease for the three cases studied and the mean efficiency had a peak in the case of MH-B and decreased strongly for MH-C. Therefore, the selected multiplexed hologram is MH-B, since its efficiency was the highest and the deviation was considered satisfactory. For this particular case, the optimum configuration could be obtained by considering the ( η ¯   · σ) product to be maximum. However, this indicator could fail in some extreme cases (e.g., when the standard deviation is very small) and this limitation should be taken into account.
Table 5 shows that the best efficiency ratio between the holograms recorded with each wavelength was obtained with an exposure corresponding to half of that necessary for achieving 99% efficiency in the monochromatic calibration. This result corresponds to the multiplexed hologram marked with circles in Figure 9 (MH-B).
The efficiency reduction with respect to the monochromatic recording was as expected, because the refractive index modulation was distributed among the three multiplexed holograms. The difference between the maximum efficiencies obtained for each wavelength in the multiplexed hologram can lead to the color reproduction of the object being altered in the reconstruction when illuminating with white light. Depending on the application, it may be necessary to carry out more precise adjustment of efficiencies.
Figure 10 shows the image of the diffusing object obtained by reconstructing the sample of Table 5 with 633 nm in Figure 10a, with 532 nm in Figure 10b, with 442 nm in Figure 10c and with all three simultaneously (Figure 10d). It was observed that, although when reconstructing with red light (Figure 10a) only the hologram recorded with red laser acted, when reconstructing with green light (Figure 10b) both green hologram (larger circle at right) and red hologram (smaller circle at left) were reconstructed, and when reconstructing with blue light (Figure 10c) the three holograms acted. This indicates that the three holograms are not totally independent, producing a cross coupling effect between them. As the images appeared separated in space, it is possible to suppress the unwanted images by modifying the recording angles or using different shading systems. Figure 10d shows that the superposition of the images of the three holograms illuminated with the three wavelengths gives a white-color image.
In order to check the behavior of the multiplexed hologram, it was illuminated with continuous spectrum white light under Bragg’s condition for the three recording wavelengths, and the transmitted beam (zero order) was measured by means of a spectrophotometer. From this measurement, the diffracted order +1, which is shown in Figure 11, was calculated. The three peaks located at the recording wavelengths, 633 nm, 532 nm and 442 nm could be clearly observed. The efficiencies that can be seen in Figure 11 were slightly different from those indicated in Table 5 (which are measured using monochromatic light of each wavelength), which may be due to the superposition of the different wavelengths and the cross-coupling effect.

4. Conclusions

In the present work, the Bayfol® HX200 photopolymer has been characterized, for the recording of full-color transmission volume holograms of diffusing objects.
In the monochromatic calibration of the material, efficiencies of 60% for the 442 nm holograms and 90% for the 532 nm and 633 nm holograms were achieved. The lower maximum efficiency value for 442 nm holograms was due to stability problems caused by longer exposure times of the 442 nm laser.
The maximum modulation of the refractive index was calculated for each hologram, obtaining the values of 0.0063 for 442 nm, 0.0106 for 532 nm and 0.0126 for 633 nm. These values are less than the theoretical maximum value, since the maximum efficiency achieved did not reach 100% due to intermodulation noise produced by the diffusing object.
The polychromatic calibration was carried out with the simultaneous exposure method with different exposure times. The maximum efficiencies achieved with this method were obtained for exposure values corresponding to half of the exposure required to achieve maximum efficiency in monochromatic calibration, and a 0.8 neutral optical density filter was included in the green laser path to equalize efficiencies. In this case, the multiplexed hologram had efficiency values of 19.1% for the 442 nm hologram, 25.9% for the 532 nm hologram and 15.2% for the 633 nm hologram.
Despite the fact that both the calculations and the experimental measurements of the chromatic selectivity in monochromatic calibration indicated that the holograms recorded with the three lasers simultaneously in the same material could be considered independent, when reconstructing the multiplexed hologram with the three wavelengths, it was observed that the holograms were not totally independent.
To record multiplexed holograms in which the three holograms are independent, it would be necessary to obtain narrower color selectivity curves, which could be achieved by using a thicker material or increasing the angle between beams at the recording to narrow the chromatic selectivity curves, or separating the peak wavelengths as much as possible within the RGB (diode lasers). In order to obtain higher efficiencies, a thicker material or a higher index modulation would be desirable to maximize n1·d product.

Author Contributions

Conceptualization, M.S., J.M.-S., D.C., M.-V.C., J.A.; methodology, M.S., J.M.-S., D.C., M.-V.C., J.A.; experimental set up and results: M.S., J.M.-S., D.C., M.-V.C., J.A.; writing—original draft preparation, writing—review and editing, M.S., J.M.-S., D.C., M.-V.C., J.A. All authors have read and agreed to the published version of the manuscript.

Funding

This research was funded by the “Diputación General de Aragón-Fondo Social Europeo” (TOL research group, E44_17R), the “Generalitat de Catalunya” (2017FI_B2_00127 and 2017 SGR 1276) and the “Ministerio de Ciencia e Innovación” (PID2019-108598GB-I00, PID2019-111536RB-I00 and PID2021-114311RA-I00).

Acknowledgments

The authors would like to thank Covestro Deutschland AG for supplying the recording photopolymer material. Daniel Chemisana thanks ICREA for the ICREA Academia award.

Conflicts of Interest

The authors declare no conflict of interest.

References

  1. Sarakinos, A.; Lembessis, A. Color holography for the documentation and dissemination of cultural heritage: OptoclonesTM from four museums in two countries. J. Imaging 2019, 5, 59. [Google Scholar] [CrossRef] [PubMed] [Green Version]
  2. Ohtaki, H.; Watanabe, M.; Kodama, D.; Noujima, F.; Ueda, K. Development of peripheral materials for color graphic arts holograms. In Proceedings of the SPIE—The International Society for Optical Engineering, San Jose, CA, USA, 24–25 January 2000; Volume 3956, pp. 245–252. [Google Scholar]
  3. Naydenova, I. Holographic Sensors. Opt. Hologr. Theory Appl. 2020, 165–190. [Google Scholar] [CrossRef]
  4. Cody, D.; Gul, S.-E.; Mikulchyk, T.; Irfan, M.; Kharchenko, A.; Goldyn, K.; Martin, S.; Mintova, S.; Cassidy, J.; Naydenova, I. Self-processing photopolymer materials for versatile design and fabrication of holographic sensors and interactive holograms. Appl. Opt. 2018, 57, E173–E183. [Google Scholar] [CrossRef] [PubMed]
  5. Gentet, P.; Gentet, Y.; Kim, L.-H.; Kim, K.-J.; Lee, S.-H. Recording ultra-realistic full-color analog holograms for use in a moving hologram display. J. Vis. Exp. 2020, 155, e60459. [Google Scholar] [CrossRef] [PubMed]
  6. Keshri, S.; Marín-Sáez, J.; Naydenova, I.; Murphy, K.; Atencia, J.; Chemisana, D.; Garner, S.; Collados, M.V.; Martin, S. Stacked volume holographic gratings for extending the operational wavelength range in LED and solar applications. Appl. Opt. 2020, 59, 2569–2579. [Google Scholar] [CrossRef] [PubMed]
  7. Bjelkhagen, H.; Brotherton-Ratcliffe, D. Ultra-Realistic Imaging: Advanced Techniques in Analogue and Digital Colour Holography; CRC Press: Boca Raton, FL, USA, 2016; ISBN 9781439828007. [Google Scholar]
  8. Chen, H.; Tai, A.; Yu, F.T.S. Generation of color images with one-step rainbow holograms. Appl. Opt. 1978, 17, 1490–1491. [Google Scholar] [CrossRef] [PubMed]
  9. Bjelkhagen, H.I.; Jeong, T.H.; Vukičević, D. Color reflection holograms recorded in a panchromatic ultrahigh-resolution single-layer silver halide emulsion. J. Imaging Sci. Technol. 1996, 40, 134–146. [Google Scholar]
  10. Leith, E.N.; Chen, H.; Roth, J. White light hologram technique. Appl. Opt. 1978, 17, 3187–3188. [Google Scholar] [CrossRef] [PubMed]
  11. Piao, M.-L.; Kim, N. Achieving high levels of color uniformity and optical efficiency for a wedge-shaped waveguide head-mounted display using a photopolymer. Appl. Opt. 2014, 53, 2180–2186. [Google Scholar] [CrossRef] [PubMed]
  12. Piao, M.-L.; Kwon, K.-C.; Kang, H.-J.; Lee, K.-Y.; Kim, N. Full-color holographic diffuser using time-scheduled iterative exposure. Appl. Opt. 2015, 54, 5252–5259. [Google Scholar] [CrossRef] [PubMed]
  13. Vázquez-Martín, I.; Gómez-Climente, M.; Marín-Sáez, J.; Collados, M.V.; Atencia, J. True colour Denisyuk-Type hologram recording in Bayfol HX self-developing photopolymer. In Proceedings of the SPIE—The International Society for Optical Engineering, Anaheim, CA, USA, 9–13 April 2017; Volume 10233. [Google Scholar]
  14. Upatnieks, J.; Leonard, C. Efficiency and Image Contrast of Dielectric Holograms. J. Opt. Soc. Am. 1970, 60, 297–305. [Google Scholar] [CrossRef]
  15. Vázquez-Martín, I.; Marín-Sáez, J.; Gómez-Climente, M.; Chemisana, D.; Collados, M.-V.; Atencia, J. Full-color multiplexed reflection hologram of diffusing objects recorded by using simultaneous exposure with different times in photopolymer Bayfol® HX. Opt. Laser Technol. 2021, 143, 107303. [Google Scholar] [CrossRef]
  16. Bjelkhagen, H.I.; Mirlis, E. Color holography to produce highly realistic three-dimensional images. Appl. Opt. 2008, 47, A123–A133. [Google Scholar] [CrossRef] [PubMed]
  17. Berneth, H.; Bruder, F.K.; Fäcke, T.; Hagen, R.; Hönel, D.; Jurbergs, D.; Rölle, T.; Weiser, M.-S. Holographic recording aspects of high-resolution Bayfol® HX photopolymer. In Proceedings of the SPIE—The International Society for Optical Engineering, San Francisco, CA, USA, 22–27 January 2011; Volume 7957. [Google Scholar]
  18. Berneth, H.; Bruder, F.-K.; Fäcke, T.; Jurbergs, D.; Hagen, R.; Hönel, D.; Rölle, T.; Walze, G. Bayfol HX photopolymer for full-color transmission volume Bragg gratings. In Proceedings of the SPIE—The International Society for Optical Engineering, San Diego, CA, USA, 17–21 August 2014; Volume 9006. [Google Scholar]
  19. Marín-Sáez, J.; Atencia, J.; Chemisana, D.; Collados, M.-V. Characterization of volume holographic optical elements recorded in Bayfol HX photopolymer for solar photovoltaic applications. Opt. Express 2016, 24, A720–A730. [Google Scholar] [CrossRef] [PubMed]
  20. Marín-Sáez, J.; Atencia, J.; Chemisana, D.; Collados, M.-V. Full modeling and experimental validation of cylindrical holographic lenses recorded in Bayfol HX photopolymer and partly operating in the transition regime for solar concentration. Opt. Express 2018, 26, A398–A412. [Google Scholar] [CrossRef] [PubMed] [Green Version]
  21. Collados, M.-V.; Sola, I.J.; Marin-Saez, J.; Holgado, W.; Atencia, J. Holographic Optical Elements to Generate Achromatic Vortices withUltra-Short and Ultra-Intense Laser Pulses. In Vortex Dynamics and Optical Vortices; Perez-De-Tejada, H., Ed.; IntechOpen: London, UK, 2017; pp. 201–225. ISBN1 978-953-51-2930-1. ISBN2 978-953-51-2929-5. [Google Scholar]
Figure 1. Main characteristics of the lasers used in the recording setup, together with the optimal λ for color reproduction stated in [16]. CIE diagram with the representation of the color reproduction area obtained with the three lasers.
Photonics 08 00465 g001
Figure 2. Recording setup diagram. GT is the Galileo telescope, M are the broadband mirrors, S1–S3 are the shutters for each laser, DM1 and DM2 are the dichroic mirrors, BS is the beam splitter, SF is the spatial filtering stage (microscope objective lens + pinhole), CL is the collimating lens, HP stands for the photopolymer and DO represents the diffusing object.
Photonics 08 00465 g002
Figure 3. Chromatic selectivity curves for three holograms recorded with three different wavelengths (633 nm, 532 nm and 442 nm) with 50° between the object and reference beams.
Photonics 08 00465 g003
Figure 4. Efficiency vs. exposure curves for different values of n 1 , m a x . Black dots represent theoretical dependence of Equation (8), assuming linear dependence of index modulation with exposure. The blue curve represents the dependence when the index modulation reaches a saturation value n 1 ,   m a x : (a) n 1 ,   m a x is not enough to reach 100% efficiency and (b) n 1 ,   m a x is higher than the index modulation value needed to obtain 100% efficiency (overmodulation).
Photonics 08 00465 g004
Figure 5. Efficiencies versus exposure and theoretical curve in the recording with each of the three wavelengths (a) 633 nm, (b) 532 nm and (c) 442 nm.
Photonics 08 00465 g005
Figure 6. Index modulation with respect to the exposure in the recording with each of the three wavelengths (a) 633 nm (red) (b) 532 nm (green) and (c) 422 nm (blue).
Photonics 08 00465 g006
Figure 7. Experimentally measured chromatic selectivity curves for the three maximum efficiency samples obtained in the monochromatic calibration of each of the wavelengths (50° between beams).
Photonics 08 00465 g007
Figure 8. Image of the diffusing object obtained when holograms recorded with each wavelength were illuminated with the recording wavelength: (a) 633 nm, (b) 532 nm and (c) 442 nm, and when each hologram is reconstructed using three lasers simultaneously: (df).
Photonics 08 00465 g008
Figure 9. Efficiency as a function of exposure in polychromatic calibration for three multiplexed holograms. Each marker corresponds to a multiplexed hologram and each color of the same marker corresponds to the efficiency obtained for each of the three holograms that compose one multiplexed hologram.
Photonics 08 00465 g009
Figure 10. Reconstruction of the multiplexed hologram MH-B of Table 5 with 633 nm (14 (a)), 532 nm (14 (b)), 442 nm (14 (c)) and with the three wavelengths (14 (d)).
Photonics 08 00465 g010
Figure 11. Diffracted spectrum of the sample with the data shown in Table 5 when the illumination was performed with continuous spectrum white light under Bragg’s condition.
Photonics 08 00465 g011
Table 1. Maximum relative efficiency, exposure energy at which 99% of the maximum efficiency was achieved and modulation of the maximum refractive index for the three wavelengths.
λ   ( nm ) η max   ( % ) E   f o r   0.99 η m a x   ( mJ / c m 2 ) n 1 , m a x
44260147.20.0062
5329024.20.0104
6339014.10.0125
Table 2. Maximum modulation values of the refractive index for an ideal efficiency of 100% and that obtained experimentally.
Laser n 1 ( η r = 1 ) n 1 ( η r , e x p e r i m e n t a l )
Blue (442 nm) 0.0111 0.0063
Green (532 nm) 0.0133 0.0106
Red (633 nm) 0.0159 0.0126
Table 3. Full width at half maximum (FWHM) for each laser, both experimental (Figure 7) and theoretical (Figure 3) measurements.
Laser FWHM THEORETICAL   ( nm ) FWHM EXPERIMENTAL ( nm )
Blue ( 442   nm ) 46.1 48.7
Green ( 532   nm ) 66.5 68.6
Red ( 633   nm ) 93.0 94.2
Table 4. Efficiency measured when each sample, recorded with a different wavelength, was illuminated with each wavelength.
λ r e c o r d i n g   ( nm ) 633 532 442
λ i n c i d e n t   ( nm ) 633532442633532442633532442
R e l a t i v e   e f f i c i e n c y   ( % ) 88.38.85.65.2878.80.10.958
Table 5. Laser intensities, optical density of the filters used, intensity after filtering, exposure for which higher and similar efficiency were obtained for each wavelength and maximum efficiency obtained for each of the three wavelengths (MH-B).
λ   ( nm ) I i   ( mW cm 2 ) Optical   Density I t   ( mW cm 2 ) E   ( mJ cm 2 ) η m a x ( % )
442 0.466 0.466 70 19.1 %
532 0.438 0.8 0.076 12 25.9 %
633 0.079 0.079 7 15.2 %
Publisher’s Note: MDPI stays neutral with regard to jurisdictional claims in published maps and institutional affiliations.

