Article

Study of the Optical Properties of Multi-Particle Phosphors by the FDTD and Ray Tracing Combined Method

National and Local Joint Engineering Research Center of Semiconductor Display and Optical Communication Devices, South China University of Technology, Guangzhou 510641, China
*
Author to whom correspondence should be addressed.
Photonics 2020, 7(4), 126; https://doi.org/10.3390/photonics7040126
Submission received: 27 October 2020 / Revised: 24 November 2020 / Accepted: 2 December 2020 / Published: 6 December 2020
(This article belongs to the Section Optoelectronics and Optical Materials)

Abstract

:
It is well known that the optical properties of multi-particle phosphor are crucial to the light performance of white light-emitting diodes (LEDs). Note that the optical properties including scattering or absorption properties for a single particle are easy to be calculated. However, due to the large computation considering the complicated re-scattering and re-absorption, it is difficult to calculate the scattering behaviors of the multi-particles. A common method to reduce the computation, which can cause unknown deviations, is to replace the multi-particle scattering properties by using the average scattering data of single particles. In this work, a cluster of multi-phosphor particles are directly simulated by the finite-difference time-domain (FDTD) method. The total scattering data of the cluster was processed as a bulk scattering parameter and imported to the Monte-Carlo ray-tracing (RT) method to realize a large-scale multi-particle scattering calculation. A polynomial mathematical model was built according to the multi-particle scattering data. An experiment was carried out for verifying the accuracy of the method in this work. The mean absolute percentages of the previous method are 1.68, 2.06, and 1.22 times larger than the multi-particle method compared with the experimental curves, respectively.

1. Introduction

A phosphor-converted white light-emitting diode (LED) is the most common setup to obtain high-quality white light with a high color rendering index, uniform color distribution, and high lumen [1,2,3]. It is well known that the optical behaviors of phosphor particles are crucial to the quality of white light [4,5].
For obtaining accurate and comprehensive optical behavior of the phosphor particle, the ideal simulation should include all particles. The optical properties, including scattering and absorption, of a single particle, can be easily calculated. However, for the multi-particle configuration, the re-scattering and re-absorption among all particles are very complicated [6]. The computation load is often so large that many computers cannot meet the demand and usually require a workstation with a huge computation capacity [7]. One method to solve this problem is to reduce the number of particles in the simulation. For example, Qian et al. [8] studied the scattering characteristics of phosphor particles with different particle radii. The re-scattering and re-absorption were omitted for reducing the calculation. They found that the scattering was enhanced with a decreasing phosphor particle radius, thus increasing the color uniformity. Xu et al. [9] studied the optical behavior of double and triple particles. The results show that the scattering was enhanced by decreasing distance between particles. Although they obtained relatively comprehensive results for the optical behavior of double and triple particles, the optical behavior of multi-particle phosphor configurations has not yet been studied. Another solution is to improve the algorithms used to study the optical behavior of multi-particle configurations. The Monte-Carlo ray-tracing method [10,11,12] is simple and can get light re-absorption and re-scattering among the multi-particle phosphor configurations when assuming dependent scattering [13]. However, in the case of micron particles, whose sizes range to 10 times the incident wavelength, the ray-tracing (RT) method is invalid because the diffractive effect becomes prominent. The FDTD method [14,15,16,17,18] (based on wave optics) is used to study the propagation of electromagnetic or light waves by solving Maxwell’s equations. The finite-difference time-domain (FDTD) approach can be applied to structures with dimensions of only a few micrometers because of the limitations of computational power. In our previous work [19], we proposed a convenient method to obtain more comprehensive results about multi-scale structure by combining the FDTD with RT methods. First, we obtained the scattering and absorption cross-sections of every single particle by the FDTD method. Then, the total electric field distribution in space was determined by adding the average of every single particle linearly. These data were imported to RT to obtain far-field data, such as haze, transmittance, and absorption. We call this method the average method. The computation of the average method was simple, but light re-absorption and re-scattering among particles were ignored during the simulation with the FDTD method. In fact, the distance between particles is usually three times less than their diameter. The dependent scattering is necessary to ensure the accuracy of the results. In the double-particle configuration, the scattered field of one particle due to the incident light beam is assumed to be the incident field on the other particle [20]. This means that the incident-field source of every particle is different [21]. Therefore, dependent scattering among particles cannot be ignored.
To obtain more accurate and comprehensive results of multi-particle phosphor configurations with low computation, in this work, we proposed a multi-particle method, in which a cluster of multi-phosphor particles were directly simulated in the FDTD. Then, the total scattering data of the cluster was processed as a bulk scattering parameter and imported to the ray tracing method to realize a large-scale multi-particle scattering calculation. In this way, the deviation of the traditional weighted average single particle method can be limited. Finally, an experiment was conducted for verifying the accuracy of the large-scale multi-particle calculation method.

2. Model and Simulation

The FDTD method calculation region can be divided into two parts which are the total field region and scattered field region. In the total field region, the incident source electromagnetic field and scattered electromagnetic field are both calculated. However, in scattered field regions, there is only scattered electromagnetic fields that could be calculated. Therefore, the Psca(λ), Pabs(λ) can be obtained for Equations (1) and (2):
P sca ( λ ) = i = 1 n T scattered ( λ ) P source ( λ )
P abs ( λ ) = ( 1 i = 1 n T total ( λ ) ) P source ( λ )
where Tscattered and Ttotal are the scattered transmission and total transmission, respectively, Psource(λ) is the power (W) of the incident source and λ is the wavelength of the source.
Scattering cross-section (Csca) and absorption cross-section (Cabs) are important parameters for evaluating the optical properties. They can be calculated according to Equations (3) and (4):
C sca ( λ ) = P sca ( λ ) I source ( λ )
C abs ( λ ) = P abs ( λ ) I source ( λ )
where the Isource(λ) is the source irradiance (W/m2).
In this work, the model of the FDTD method is shown in Figure 1. Figure 1a shows the setup in the FDTD simulation. The sources in this work were a 455 nm blue monochromatic light and a 525 nm green monochromatic light. The type of source was the total field scattered field source (TFSF source). The TFSF sources can separate the computation region into two distinct regions, one of which contains the total field and the other only contains scattered field. It is particularly useful to study the scattering behavior of optical particles, as the scattered field can be separated from the incident field [22,23]. The particles were around with a monitors group and three-dimensional FDTD simulation region whose length, width and height were 15, 15, and 30 μm, respectively. The random access memory (RAM) of the computer in this work is 896 GB. Therefore, the size of the simulation region is just suitable for the computational power of the computer. Between the simulation region boundary and monitors group were the scattering analysis groups and absorption analysis groups which were around the particles. These monitors were frequency domain field and power monitors which could obtain the frequency-domain field and power in the simulation region and calculate the transmittance and reflectance, Csca, and Cabs. The boundary conditions in this study were the perfect match layer (PML) [24]. The mesh accuracy of this simulation was 2. The minimum mesh step is 0.25 nm, which is smaller than one-twelfth of the wavelength of the light source. The mesh accuracy is enough. All particles in the model were spherical. Because the main factors affecting the results in this work are the radius and concentration, it is reasonable to simplify the particles as spheres. The average radius of these particles was 2.5 μm. The Csca and Cabs were the key indexes in this work, which can describe the scattering and absorption properties of multi-particle configurations.
The model of the RT method is shown in Figure 1b. The central wavelengths of simulation source were 455 and 525 nm, respectively. The type for in the RT model was the grid source. The distribution for the grids was random. This light source can simulate the source in ultraviolet spectrophotometer which was used in the experiment in this work. The encapsulation material of the phosphor film was polydimethylsiloxane (PDMS), whose real and imaginary parts of refractive index were 1.44 and 1.35 × 10⁻⁶ in 455 nm, 1.43 and 1.39 × 10⁻⁶ in 525 nm, respectively [25]. There was an integrating sphere whose radius was 25 mm around the model. The integrating sphere could collect all the rays from the model. The thickness ranged from 0.1 to 0.5 mm. The materials of these particles were yttrium aluminum garnet:Ce (YAG:Ce), whose real and imaginary parts of refractive index were 1.78 and 7.24 × 10⁻⁴ in 455 nm, 1.84 and 2.09 × 10⁻⁵ in 525 nm, respectively [26,27]. The absorption and emission spectra for the phosphor in the simulation are shown in Figure 1d. The absorption and scattering coefficients of the phosphor film can be calculated according the Equations (5) and (6):
μ sca = c C sca m × 1000
μ abs = c C abs m × 1000
where the Csca and Cabs are the scattering and absorption cross-sections for multi-particle configurations which can be obtained by the FDTD method. The m is the mass of multi-particle configurations in the FDTD method model (g). The average radius for the multi-particle configurations is 2.5 μm. The density is 4.5 g/cm3. The c is concentration of the phosphor film (g/cm3). The concentration in the RT method ranged from 0 to 0.436 g/cm3. The number of particles in the model varies from 5 to 3000 with the changing of radius and concentration. The μsca and μabs value can be processed to a bulk scattering parameter and imported to the RT method to realize a large-scale multi-particle scattering calculation.
To compare with the average method proposed in our previous work [19], the interaction between the particles was studied and their impact on the scattering properties was shown in the double-particle situation. The average method calculates the average of scattering and absorption properties for every calculated particle linearly. Separate simulations are used to obtain the optical properties such as Csca and Cabs for particles with different radii, difference shapes and materials. Then, these data are weight averaged to obtain the optical properties of multi-particle phosphor configurations, as shown in Equations (7) and (8):
C abs ( λ ) = C abs , D ( λ ) n ( D ) d D n ( D ) d D
C sca ( λ ) = C sca , D ( λ ) n ( D ) d D n ( D ) d D
where D is the radius of the particle in the FDTD method model (μm). The n(D) is a concentration of the phosphor particle size distribution function. The Csca,D and Cabs,D are the scattering and absorption cross sections of the phosphor particle with radius D (m2).
The method is convenient, without much calculation. However, the dependent scattering is neglected. The interaction between the particles is an important part of studying the optical properties of multi-particle phosphor configurations [18].

3. Results and Discussion

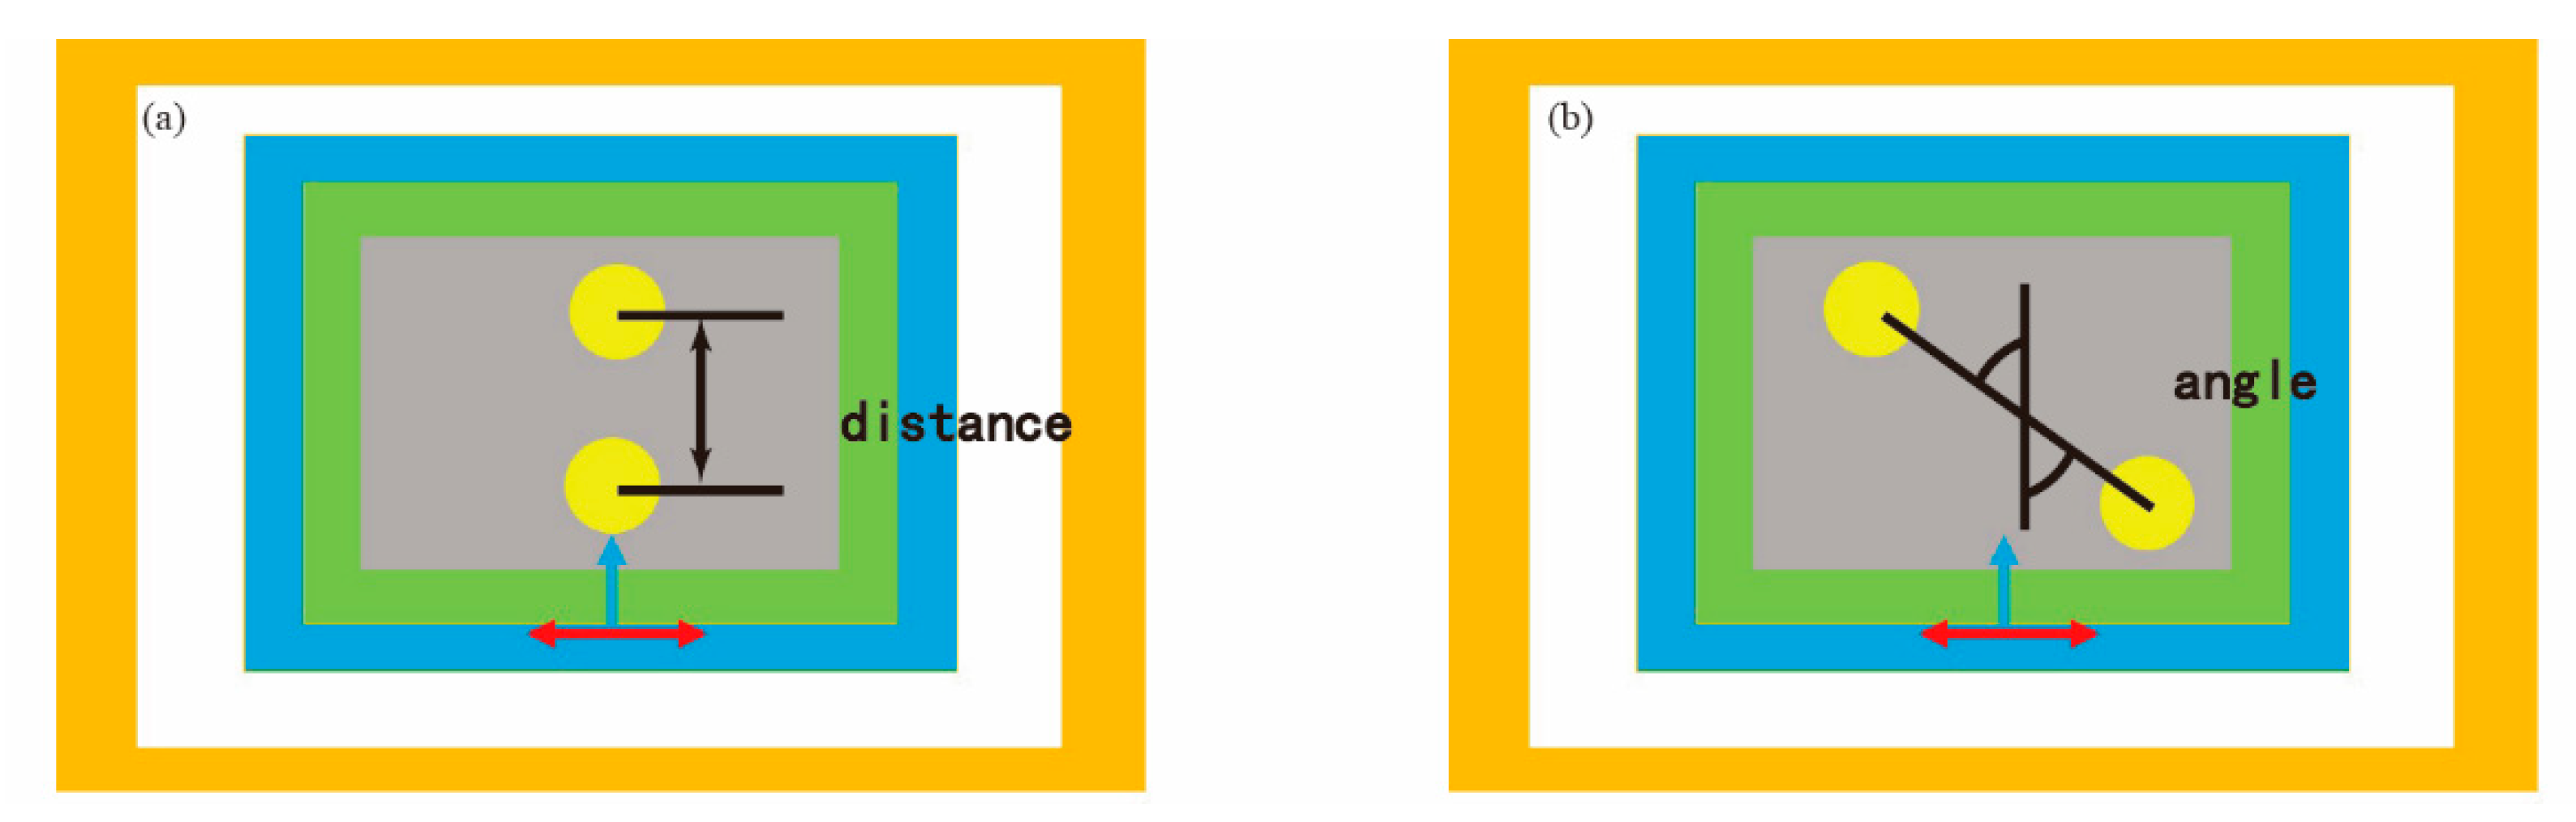
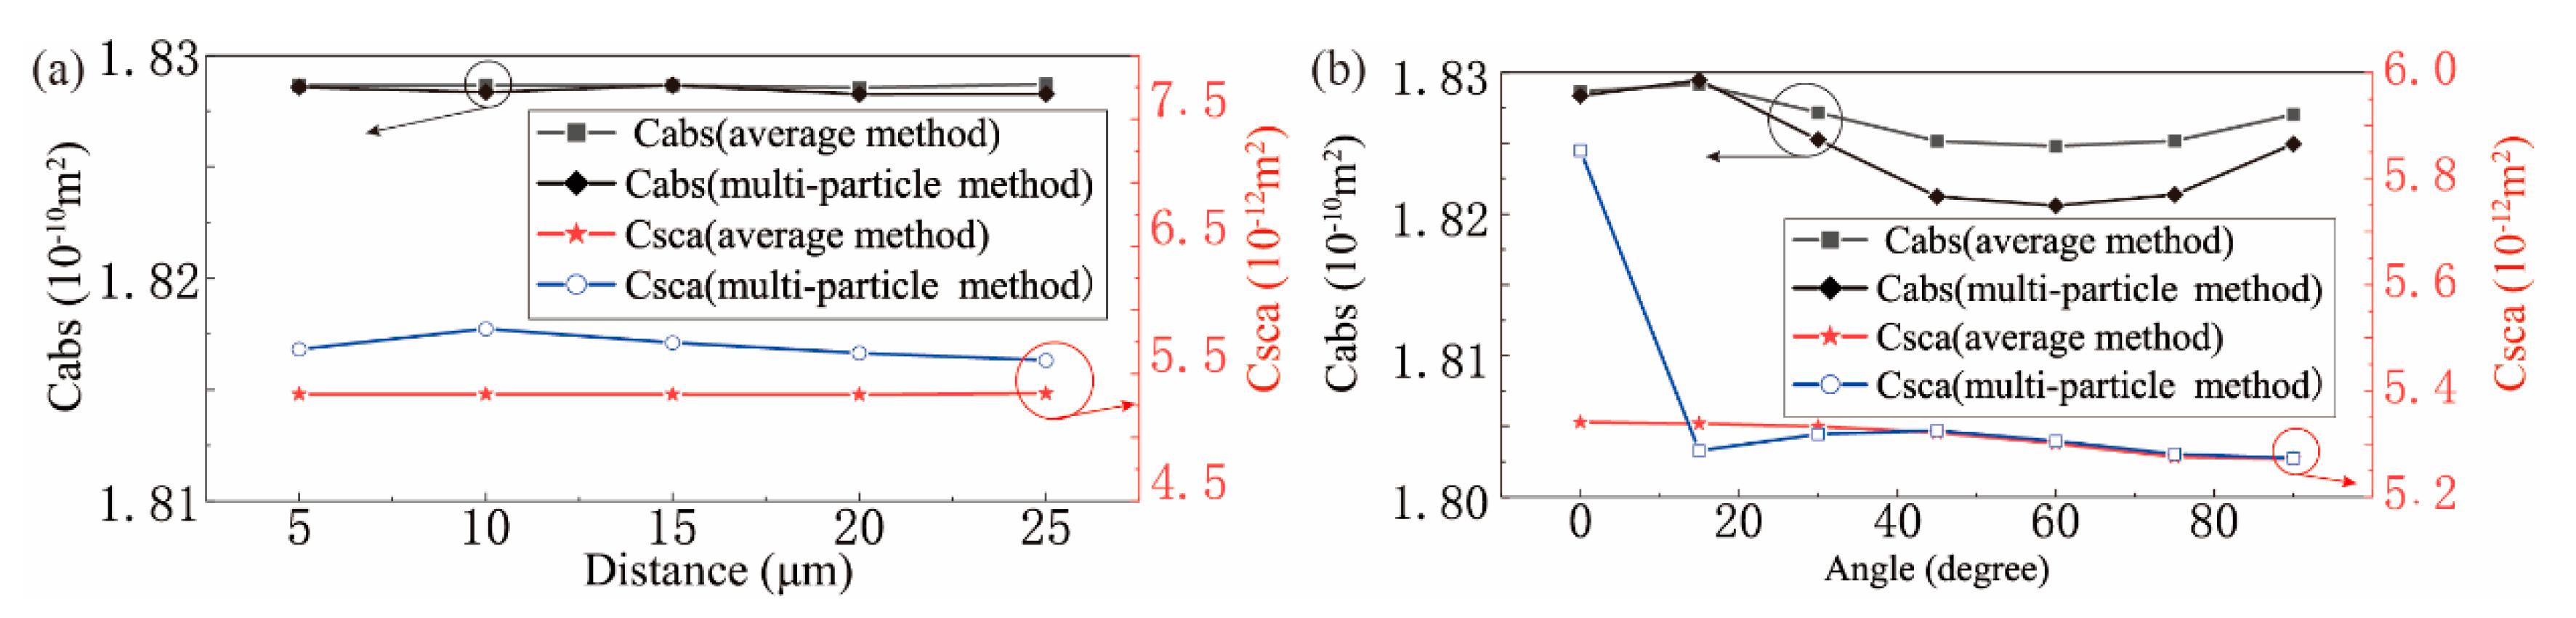
3.1. Double Particles

For comparing the multi-particle method and average method, the optical properties of double particles with different distances and different angles were simulated in this work. The difference with the multi-particle method is that the average method replaces the multi-particle scattering properties by using the average scattering data of single particles. The dependent scattering is not considered in the average method. Therefore, the results of the average method cannot be influenced by the position of the particles.
The models are shown in Figure 2. The parameters of the model were introduced in Section 2. In the case of different distances, the distance between the two particles changes from 2.5 to 25 μm. In the case of different angles, the distance between two particles is 10 μm. The angle changes from 0° to 90°. The radius of these particles is 0.5 μm.
It can be observed from Figure 3a that Csca first increases and then decreases with increasing distance. Csca is highest when the distance is 10 μm. In Figure 3b, it can be observed that the Csca is highest when the angle is 0°. The Csca value decreases quickly when the angle increases from 0° to 7.5° and Csca is lowest when the angle is 7.5°. Then, Csca increases from 7.5° to 15°. After 15°, the curve tends to be smooth. The reason for these phenomena is the diffracted light from other particles. It can be observed that there is a central light fringe behind the bottom particle. With increasing distance, the central light fringe becomes sparse, and the power of light incident on the top particle decreases. Additionally, at 7.5°, the incident-light source of the upper left particle is in the middle of the largest dark fringe of the diffracted light, so the incident-light source of this particle is the lowest. The largest dark fringe can be seen from Figure 3a. These results mean that the position of the particles can influence the scattering and absorption properties in a double-particle situation. The scattering of these particles is not independent.
As shown in Figure 4a,b, the change of Csca and Cabs in the average method is lower than the multi-particles method. This is because the average of scattering and absorption properties are added for every calculated particle linearly in the average method. The interaction between particles is neglected. The influence of particle position is not obvious in the average method. However, the interaction between the particles is an important part of studying the optical properties which cannot be ignored in the simulation. The diffraction and scattering light from a particle can be seen as the incident-field source on the other particle [28]. The incident-field source of particles in different positions is different [21]. This is the limitation of the average method.

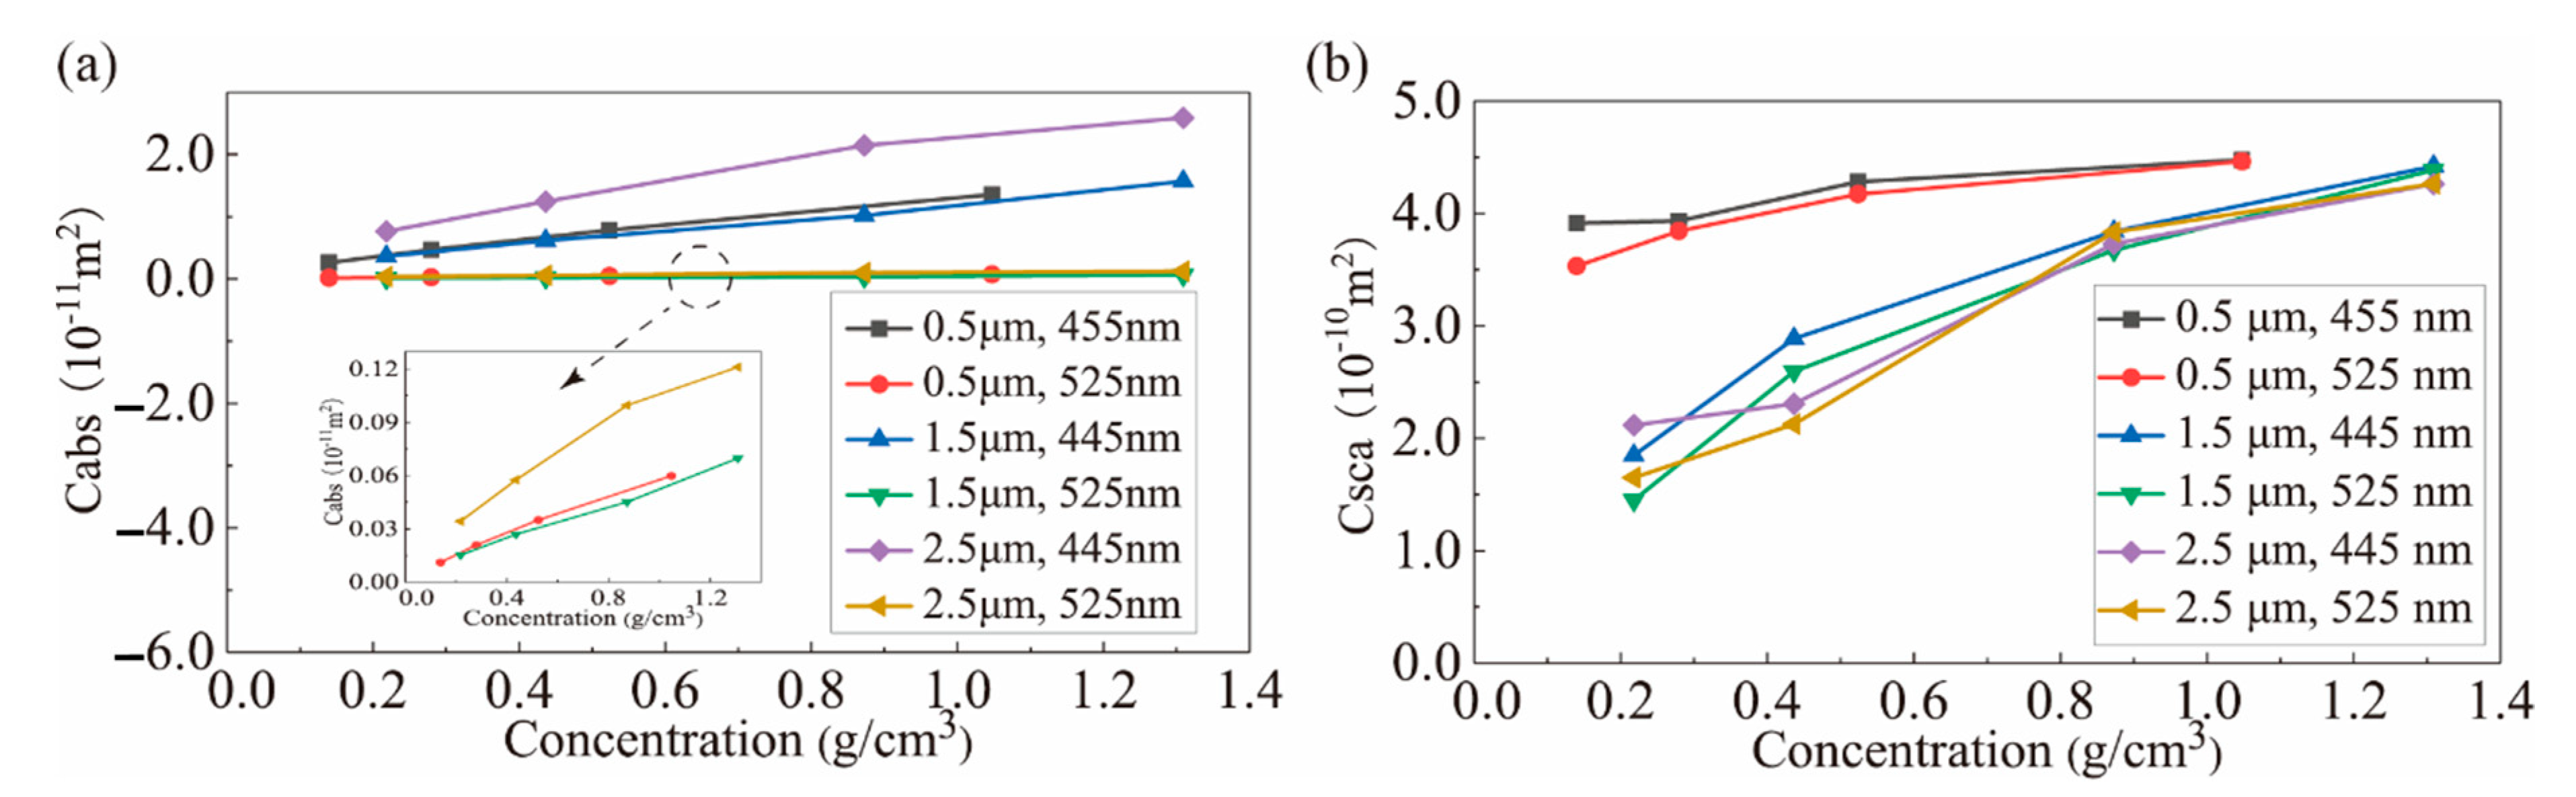
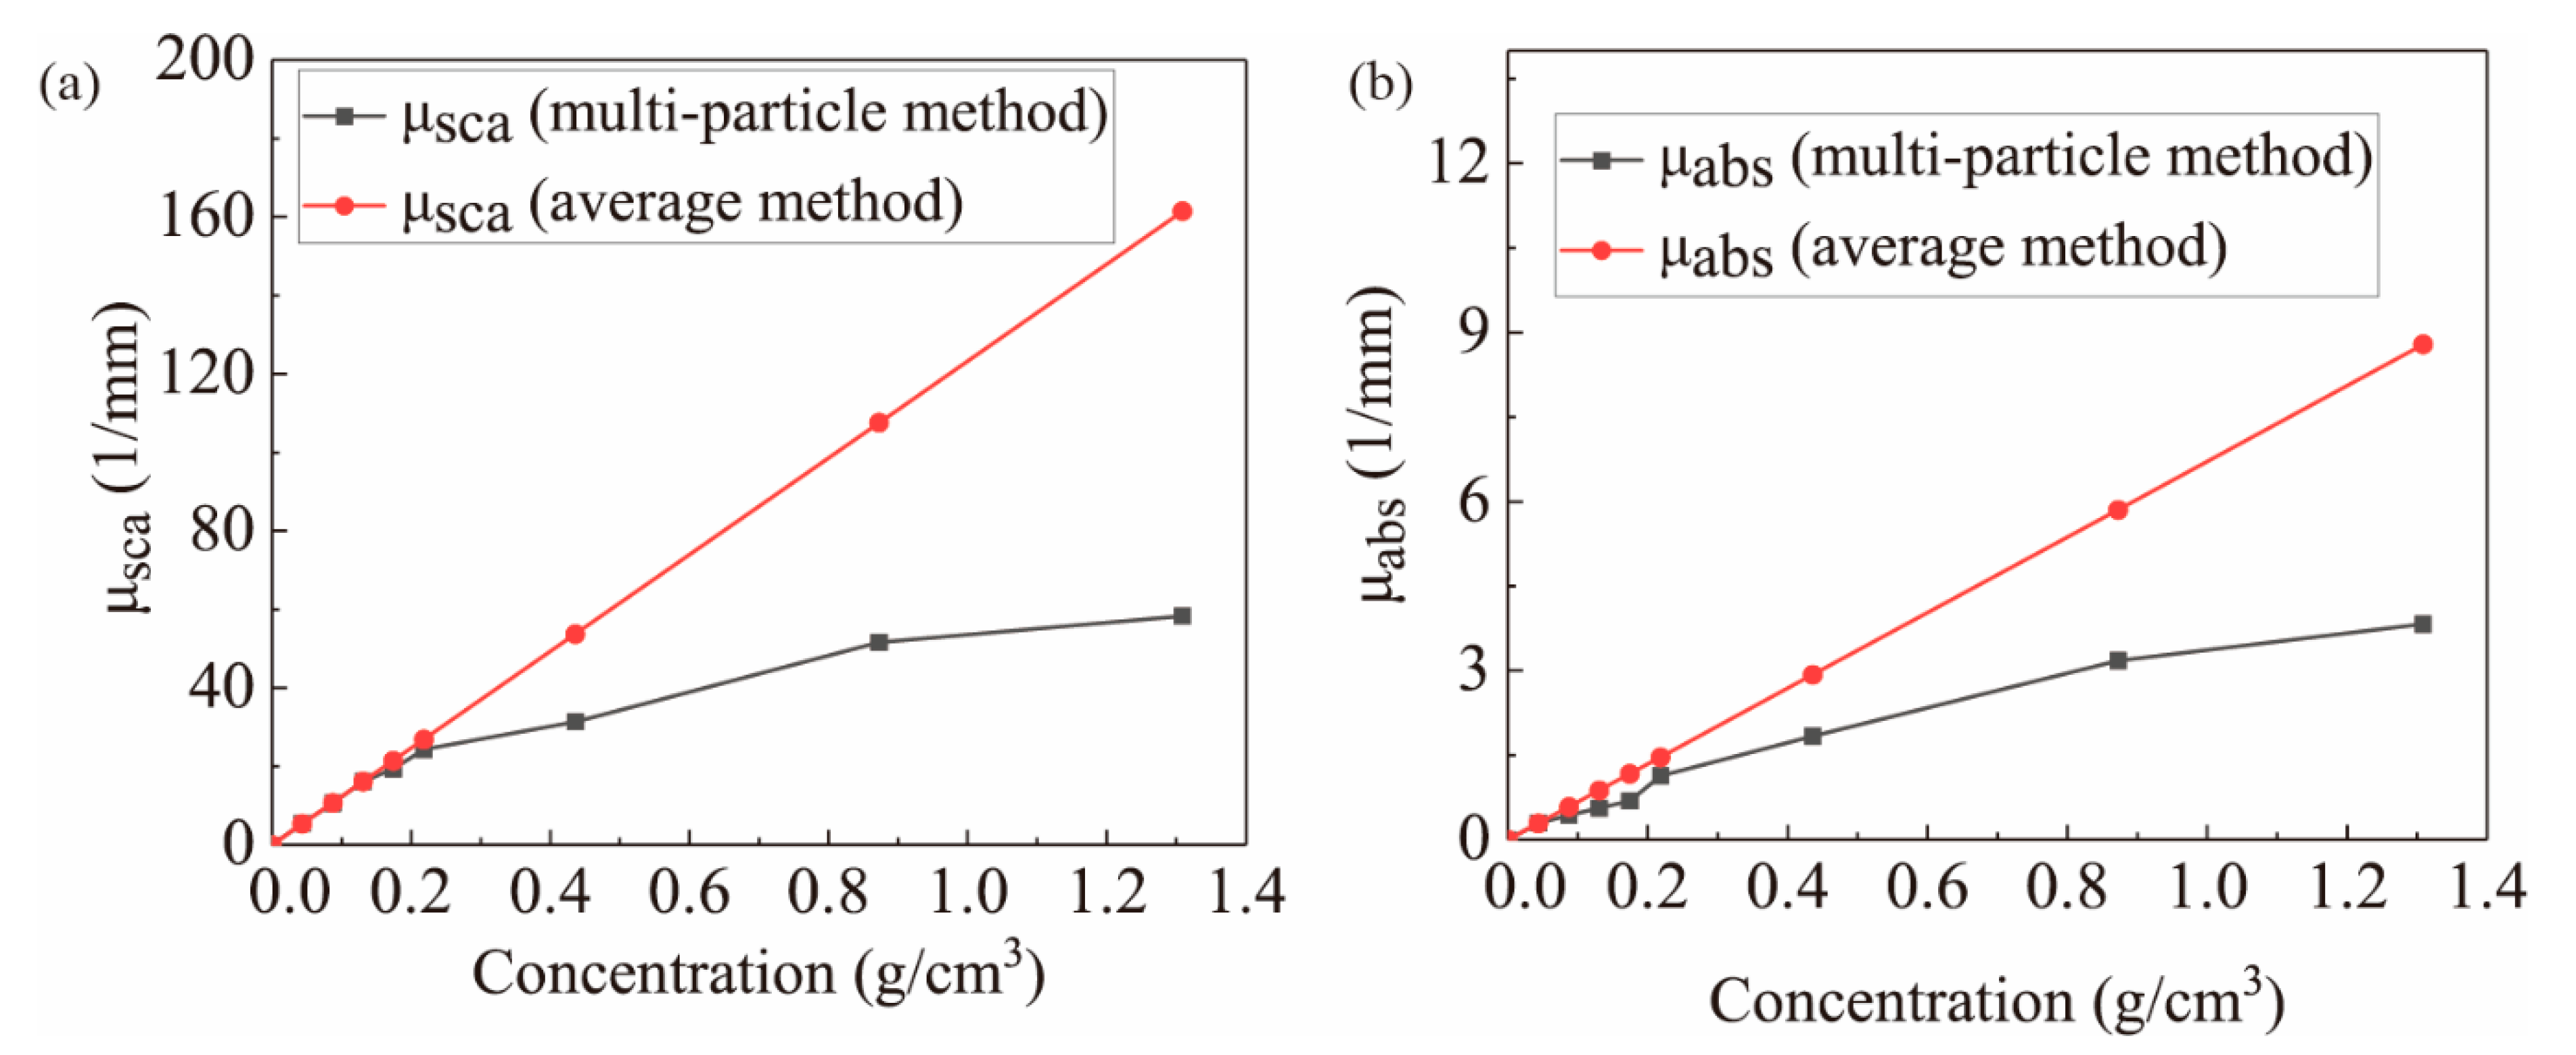
3.2. Multi-Particle Phosphor Configurations

In addition to double particle cases, the optical properties of multi-particle phosphor configurations were also studied in this work. Multi-particle phosphor configurations with three radii, 0.5, 1.5, and 2.5 μm, were studied under incident lights of 445 and 525 nm. The simulation region was described earlier in Section 2. The concentration of multi-particle phosphor configuration ranges from 0.14 to 1.3 g/cm3. It can be seen from Figure 5 that both Csca and Cabs increase with increasing concentration. The Csca value of the 0.5 μm radius multi-particle phosphor configurations is the highest, which means that scattering is enhanced by small particles. This phenomenon can be explained by the Mie theory [8,13,27]. The scattering is negatively correlated with the radius of particle when the particle radius is greater than the wavelength and less than 50 times the wavelength. The optical difference of multi-particle phosphor configurations between the 1.5 μm radius and the 2.5 μm radius is not evident. The impact of wavelength on Csca is not obvious; in contrast, its impact on Cabs is significant. It can be observed from Figure 5a that the Cabs values obtained under the 455 nm incident light are higher than those derived for the 525 nm incident light. The Cabs values of the 2.5 μm multi-particle phosphor configurations under the incident light of 455 nm are the highest.
For researching the trend for the Csca, Cabs curves, the relationship between the Csca, Cabs value and concentration was built by polynomial fitting. When the radius of particles is 2.5 μm, the source wavelength is 455 nm. The mathematical models are shown as the Equations (9) and (10):
C abs ( c ) = 2 × 10 10 c 2 + 5 × 10 10 c + 6 × 10 11
C sca ( c ) = 1 × 10 11 c 2 + 3 × 10 11 c + 3 × 10 13
where the c is the concentrations ( g / cm 3 ) of phosphor particles.
The coefficients of determination of Equations (9) and (10) are R2 = 0.9986 and R2 = 0.9656, respectively. These show that the polynomial fitting is reliable. The Csca, Cabs value can be obtained by the fitting model conveniently when the concentration is within the above range. The fitting curves are shown in Figure 6.
It can be observed from Figure 7 that the μsca and μabs values increase with increasing concentration. The trend agrees well with the actual situation. The μsca and μabs values of the average method are higher than the multi-particle method in a high concentration. The reason of this phenomenon is that the dependent scattering is neglected in the average method. The results of the average method are linear. However, in the actual situation, the dependent scattering cannot be neglected in the simulation. The growth rate will decrease with the increasing concentration because of the re-scattering and re-absorption. The incident of every particle will be occluded by other particles.
Through the multi-particle method, not only data in micro scale can be obtained, but also data in macro scale can be obtained, too. It can be observed from Figure 8a that the transmittance occurs with different concentrations and thickness films. It can be found that the transmittance decreases with the increasing concentrations and the thickness of phosphor films. In Figure 8b, it can be found that the change law of absorption is opposite to the change law of transmittance. The trend of simulation agrees well with the actual situation. These results can qualitatively test the accuracy of the multi-particle method.
In this work, an experiment was carried out for verifying the accuracy of the multi-particle method. In this experiment, 24 phosphor films were fabricated and were divided into three groups of different thicknesses. Additionally, every group included phosphor films of eight different concentrations. The thickness of phosphor films was measured by spiral micrometer. When measuring, the pressure was very small. The deformation of phosphor films under compression was small. Measurement error was within 0.01 mm. The purpose of doing this is studying the consistency between the trend of simulation and actual situation. The flow chart for manufacturing phosphor films is shown in Figure 9. The encapsulant in Figure 9a was the mixture with a 10:1 ratio of PDMS and curing agent. Firstly, phosphor and encapsulating PDMS were fully mixed. Secondly, the mixture was coated on the glass and put into the oven for curing. Finally, phosphor films were peeled off from the glass. Several phosphor films are shown in Figure 10e. The concentration of these films is 0.1 g/cm3. The measurement equipment of this experiment is shown in Figure 10b, which is an ultraviolet spectrophotometer. The phosphor films were tested in the ultraviolet spectrophotometer in the wavelength range 300–800 nm. In this experiment, the haze values of these phosphor films were tested with a source wavelength of 455 nm. The radius distribution for phosphor particles is shown in Figure 10f. The haze is a physical quantity to describe the source scattering strength. They can be calculated according to the Equation (11):
H a z e = 1 P sca 2.5 P transmission
where the Ptransmission is the transmitted light. The Psca2.5° is the transmission light in the space angle in 2.5° in the direction of the incident light.
These experimental results were compared with the results of the multi-particle method in this work.
The comparison results are shown in Figure 10a. The experimental curves are close to the simulation curves. The simulation curve of 0.5 mm thickness films is higher than the simulation curves of 0.1 and 0.2 mm thickness films. It means that the trend of simulation still agrees well with the actual situation. Although, the FDTD simulation region is smaller than actual phosphor films. The results can be combined with the RT method. The far-field data can be obtained conveniently by this method. This is the biggest advantage of the multi-particle method. The importance of dependent scattering was mentioned in Section 3.1, which is too strong to be neglected in the multi-particle configurations. The re-scattering and re-absorption are shown in Figure 10c,d for multi-particle configuration concentrations of 0.218 g/cm3 and 1.583 g/cm3, respectively. The re-scattering and re-absorption in Figure 10c,d can be classified as typical double particle cases shown in Section 3.1. In Figure 10c, diffraction stripes are clear and complete and there are obvious fluctuations in energy distribution. In Figure 10d, diffraction stripes intertwined, which are complicated and fragmented. Compared with Figure 10c, energy distribution fluctuation is not obvious and the scattering field is more uniform, indicating that the scattering is enhanced when there are more particles.
It can also be seen that the curves of the multi-particle method match better with the experiment than the average method. The haze results of the average method are lower than the results of the multi-particle method when the concentration is low and are higher in the high concentration. The phenomenon can be explained by the results in Figure 7. The μabs values of the average method is higher than multi-particle method in low concentration. Additionally, the μsca is higher than the multi-particle method in a high concentration. Additionally, there is an interesting phenomenon. The curves in the experiment for the average method are not linear, while the curves for μsca and μabs are linear. In fact, the relationship between the haze and μsca is not linear. As mentioned above, the haze is the ratio of transmission light outside the space angle 2.5° to the total transmission light. It can be observed from Figure 8a that the transmission will decrease with increasing concentration. The absolute value for the slope gradually decreases. Additionally, the transmission light outside the space angle 2.5° will increase with increasing concentration and eventually tend to be saturated. Finally, the transmission light outside the space angle 2.5° will approach the total transmission light infinitely. So, the haze curve is not linear and the upper limit is 1.
The curve for the multi-particle method is closer to the experiment curve when the thickness is 0.5 mm. This can be explained by the elastic deformation for the phosphor films. As mention above, the thickness was measured by spiral micrometer. The film was sandwiched and its thickness was measured. Under the same pressure, the deformation is the same. The same amount of deformation has a greater effect on a thin film than a thick film. So, the curve for the simulation is closer to the experiment when the film is thick. In addition to the above reasons, the hole size of the ultraviolet spectrophotometer which was used to measure haze in the experiment is not is not strictly 2.5°. The spectral data in the RT model is not continuous. Comparing the spectra of reality phosphor, some spectral data points are missing in simulation. Therefore, the molar extinction coefficient for the reality phosphor films is higher than the films in the simulation. These reasons may cause errors. The mean absolute percentage errors between the 0.1-mm-thickness, 0.2-mm-thickness and 0.5-mm- thickness experimental curves and the multi-particle method curves are 8.52%, 5.20%, and 5.73%, respectively. The mean absolute percentage errors between the experimental curve and average method are 14.28%, 10.70%, and 6.97%, respectively. The mean absolute percentage deviations of the average method are 1.68, 2.06, and 1.22 times larger than the multi-particle method, respectively. These results show that the multi-particle method is an accurate method to simulation the optical behaviors of multi-particle configuration.

4. Conclusions

Considering the interaction between the phosphor particles, the optical properties of multi-particle phosphor configurations were studied by the multi-particle method in this work. The results show that the change of Csca and Cabs in the average method is lower than the multi-particles method. The location of the particles in the double-particle situation can influence the scattering and absorption obviously. It means that re-scattering and re-absorption are important in the simulation of multi-particle configurations. In a multi-particle situation, both of the Csca and Cabs increase with increasing concentration. Compared with the double-particle situation, Cabs can be significantly influenced by the concentration, radius, and source wavelength. The radius of the particles is not a key parameter for Csca. The experimental curves are close to the simulation results. The mean absolute percentage errors between the 0.1-mm-thickness, 0.2-mm-thickness and 0.5-mm-thickness experimental curves and the multi-particle method curves are 8.52%, 5.20%, and 5.73%, respectively. Additionally, the mean absolute percentage of the average method is 1.68, 2.06, and 1.22 times larger than the multi-particle method, respectively. These results show that the multi-particle method agrees with the actual situation. The mathematical model of this work was built based on FDTD and polynomial fitting. The scattering and absorption of multi-particle configuration can be obtained by this model without complex computation. The coefficient of determination of scattering and absorption equations are R2 = 0.9975 and R2 = 0.9994, respectively. Overall, it is expected that our work can deepen the understanding of phosphor scattering simulation and help promote the development of pc-LEDs.

Author Contributions

Conceptualization, X.D.; methodology, X.D. and C.S.; simulation, C.S.; validation, X.D., C.S. and S.Y.; writing—review and editing, all authors. All authors have read and agreed to the published version of the manuscript.

Funding

This research was funded by: the Science and Technology Program of Guangzhou (201904010252); Natural Science Foundation of Guangdong Province (2019A1515011741); China Postdoctoral Science Foundation (2020M672618); The Project of the National and Local Joint Engineering Research Center of Semiconductor Display and Optical Communication (Zhongshan Branch) (190919172214566).

Conflicts of Interest

The authors declare no conflict of interest.

References

  1. Shudong, Y.; Yong, T.; Zongtao, L.; Kaihang, C.; Xinrui, D.; Binhai, Y. Enhanced optical and thermal performance of white light-emitting diodes with horizontally layered quantum dots phosphor nanocomposites. Photonics Res. 2018, 6, 90–98. [Google Scholar] [CrossRef]
  2. Ding, X.; Tang, Y.; Li, Z.; Li, J.; Xie, Y.; Lin, L. Multichip LED Modules With V-Groove Surfaces for Light Extraction Efficiency Enhancements Considering Roughness Scattering. IEEE Trans. Electron Devices 2017, 64, 182–188. [Google Scholar] [CrossRef]
  3. Mitterhofer, S.; Korošak, Ž.; Rojec, Ž.; Jankovec, M. Development and Analysis of a Modular LED Array Light Source. Photonics 2020, 7, 92. [Google Scholar] [CrossRef]
  4. Shao, C.; Wu, K.; Li, Z.; Yu, B.; Ding, X. Investigating of different arrangement configurations of phosphor particles by using the Finite-Difference Time-Domain method. In Proceedings of the 2019 20th International Conference on Electronic Packaging Technology, ICEPT 2019, Hong Kong, China, 12–15 August 2019. [Google Scholar]
  5. Yu, S.; Fritz, B.; Johnsen, S.; Busko, D.; Richards, B.S.; Hippler, M.; Wiegand, G.; Tang, Y.; Li, Z.; Lemmer, U. Enhanced Photoluminescence in Quantum Dots–Porous Polymer Hybrid Films Fabricated by Microcellular Foaming. Adv. Opt. Mater. 2019, 7, 1900223. [Google Scholar] [CrossRef]
  6. Luo, X.; Song, W.; Wang, H.; Sun, Y.; Li, S. Coaxial semipolar InGaN/GaN microwire array LED with substantially suppressed efficiency droop. J. Lumin. 2019, 221, 117014. [Google Scholar] [CrossRef]
  7. Yu, S.; Yu, J.; Chen, J.; Ding, X.; Li, J.; Rao, L.; Tang, Y.; Li, Z. Numerical study on the scattering property of porous polymer structures via supercritical CO2 microcellular foaming. Appl. Opt. 2020, 59, 4533–4541. [Google Scholar] [CrossRef]
  8. Qian, K.Y.; Ma, J.; Fu, W.; Luo, Y. Research on scattering properties of phosphor for high power white light emitting diode based on Mie scattering theory. Acta Phys. Sin. 2012, 61. [Google Scholar] [CrossRef]
  9. Xu, Y. Electromagnetic scattering by an aggregate of spheres. Appl. Opt. 1995, 34, 4573–4588. [Google Scholar] [CrossRef]
  10. Yu, X.; Shu, W.; Hu, R.; Xie, B.; Ma, Y.; Luo, X. Dynamic phosphor sedimentation effect on the optical performance of White LEDs. IEEE Photonics Technol. Lett. 2017, 29, 1195–1198. [Google Scholar] [CrossRef]
  11. Li, J.; Tang, Y.; Li, Z.; Ding, X.; Yuan, D.; Yu, B. Study on scattering and absorption properties of quantum-dot-converted elements for light-emitting diodes using finite-difference time-domain method. Materials 2017, 10, 1264. [Google Scholar] [CrossRef] [Green Version]
  12. Sommer, C.; Hartmann, P.; Pachler, P.; Hoschopf, H.; Wenzl, F.P. The phosphor’s optical properties-chromaticity coordinate relationship of phosphor converted white LEDs. Opt. Quantum Electron. 2012, 44, 111–117. [Google Scholar] [CrossRef]
  13. Wang, B.X.; Zhao, C.Y. Effect of dependent scattering on light absorption in highly scattering random media. Int. J. Heat Mass Transf. 2018, 125, 1069–1078. [Google Scholar] [CrossRef] [Green Version]
  14. Yee, K.S. Numerical Solution of Initial Boundary Value Problems Involving Maxwell’s Equations in Isotropic Media. IEEE Trans. Antennas Propag. 1966, 14, 302–307. [Google Scholar] [CrossRef] [Green Version]
  15. Yee, K.S.; Ingham, D.; Shlager, K. Time-Domain Extrapolation to the Far Field Based on FDTD Calculations. IEEE Trans. Antennas Propag. 1991, 39, 410–413. [Google Scholar] [CrossRef]
  16. Yee, K.S.; Chen, J.S.; Chang, A.H. Conformal finite-different time-domain (FDTD) with overlapping grids. IEEE Trans. Antennas Propag. 1992, 40, 1068–1075. [Google Scholar] [CrossRef]
  17. Yee, K.S.; Shlager, K.; Chang, A.H. An Algorithm to Implement a Surface Impedance Boundary Condition for FDTD. IEEE Trans. Antennas Propag. 1992, 40, 833–837. [Google Scholar] [CrossRef]
  18. Zhao, Y.; Liu, J. FDTD for hydrodynamic electron fluid maxwell equations. Photonics 2015, 2, 459–467. [Google Scholar] [CrossRef] [Green Version]
  19. Li, J.; Chen, J.; Lin, L.; Li, Z.; Tang, Y.; Yu, B.; Ding, X. A Detailed Study on Phosphor-Converted Light-Emitting Diodes With Multi-Phosphor Configuration Using the Finite-Difference Time-Domain and Ray-Tracing Methods. IEEE J. Quantum Electron. 2015, 51, 1–10. [Google Scholar] [CrossRef]
  20. Jeon, S.W.; Noh, J.H.; Kim, K.H.; Kim, W.H.; Yun, C.; Song, S.B.; Kim, J.P. Phosphor modeling based on the reabsorption of Stokes shifted light. In Proceedings of the 2014 IEEE Photonics Conference, IPC 2014, San Diego, CA, USA, 12–16 October 2014; pp. 24–25. [Google Scholar]
  21. Ren, K.F.; Gréhan, G.; Gouesbet, G. Scattering of a Gaussian beam by an infinite cylinder in the framework of generalized Lorenz–Mie theory: Formulation and numerical results. J. Opt. Soc. Am. A 1997, 14, 3014. [Google Scholar] [CrossRef]
  22. Tan, T.; Potter, M. FDTD Discrete Planewave (FDTD-DPW) Formulation for a Perfectly Matched Source in TFSF Simulations. IEEE Trans. Antennas Propag. 2010, 58, 2641–2648. [Google Scholar] [CrossRef]
  23. Benkler, S.; Chavannes, N.; Kuster, N. Novel FDTD huygens source enables highly complex simulation scenarios on ordinary PCs. In Proceedings of the IEEE Antennas and Propagation Society, AP-S International Symposium (Digest), Charleston, SC, USA, 1–5 June 2009. [Google Scholar]
  24. Du, L.G.; Li, K.; Kong, F.M.; Hu, Y. Parallel 3D finite-difference time-domain method on multi-GPU systems. Int. J. Mod. Phys. C 2011, 22, 107–121. [Google Scholar] [CrossRef]
  25. Zhang, X.; Qiu, J.; Zhao, J.; Li, X.; Liu, L. Complex refractive indices measurements of polymers in infrared bands. J. Quant. Spectrosc. Radiat. Transf. 2020, 252. [Google Scholar] [CrossRef]
  26. Pan, Y.; Wu, M.; Su, Q. Tailored photoluminescence of YAG:Ce phosphor through various methods. J. Phys. Chem. Solids 2004, 65, 845–850. [Google Scholar] [CrossRef]
  27. Liu, Z.; Liu, S.; Wang, K.; Luo, X. Measurement and numerical studies of optical properties of YAG:Ce phosphor for white light-emitting diode packaging. Appl. Opt. 2010, 49, 247–257. [Google Scholar] [CrossRef] [PubMed]
  28. Johnson, B.R. Light diffraction by a particle on an optically smooth surface. Appl. Opt. 1997, 36, 240–246. [Google Scholar] [CrossRef]
Figure 1. (a) Schematic of the finite-difference time-domain (FDTD) method simulation model. (b) Schematic of the ray-tracing (RT) method simulation method. (c) Schematic of the data transfer from the FDTD method to the RT method. (d) The absorption and emission spectra for the phosphor in the simulation.
Photonics 07 00126 g001
Figure 2. Schematic of the simulation model. (a) Double particles with different distance. (b) Double particles with different angles.
Photonics 07 00126 g002
Figure 3. Simulation results for Csca and Cabs. (a) Resulting curves for the case of different distances. (b) Resulting curves for the case of different angles.
Photonics 07 00126 g003
Figure 4. Comparison of the average method between the multi-particle method. (a) Resulting curves for Cabs and Csca for the case of different distances. (b) Resulting curves for Cabs and Csca for the case of different angles.
Photonics 07 00126 g004
Figure 5. Cabs and Csca for every multi-particle phosphor configuration. (a) Cabs for different particle radii, concentrations, and source wavelengths. (b) Csca for different particle radii, concentrations, and source wavelengths.
Photonics 07 00126 g005
Figure 6. Fitting graph of math model. (a) The relationship between the Cabs value and concentration. (b) The relationship between the Csca value and concentration.
Photonics 07 00126 g006
Figure 7. Results comparison of the multi-particle method and average method. (a) The results of relationship between the μsca value and concentration. (b) The relationship between the μabs value and concentration.
Photonics 07 00126 g007
Figure 8. Results of multi-particle method simulation under an incident light of 445 nm. (a) The change of transmittance with different concentrations and thickness films. (b) The change of absorption with different concentrations and thickness films.
Photonics 07 00126 g008
Figure 9. Flow chart for manufacturing phosphor films. (a) Adding encapsulant to a beaker. (b) Adding phosphors to a beaker and mixing fully. (c) Coating phosphor films on the glass substrate. (d) Curing in the oven. (e) Peeling phosphor films off from the glass substrate.
Photonics 07 00126 g009
Figure 10. (a) Comparison of multi-particle method simulated and experimental results for the haze. (b) Equipment used in this experiment. (c) Re-scattering and re-absorption when the concentration is 0.218 g/cm3. (d) Re-scattering and re-absorption when the concentration is 1.583 g/cm3. (e) Comparison of 0.1 g/cm3 phosphor films when the thickness is 0.1, 0.2, and 0.5 mm. (f) The radius distribution for the phosphor particles.
Photonics 07 00126 g010
Publisher’s Note: MDPI stays neutral with regard to jurisdictional claims in published maps and institutional affiliations.

