1. Introduction
Optical phased arrays (OPAs) manipulate the distribution of optical power in the far field by controlling the phase of light emitted by multiple spatially separate transmit apertures. By precisely controlling the relative optical phase at the output of the array, OPAs can be used to deliver a large amount of optical power to a specific location in the far-field (e.g., for directed energy applications [
1]); and rapidly steer the interfered beam within its field-of-regard without the use of moving parts (e.g., for solid-state light detection and ranging (LiDAR) [
2], adaptive optics [
3], free-space laser communications [
4], satellite interferometry [
5], and materials processing [
6]).
Various coherent beam combining techniques have been developed and include locking of optical coherence by single-detector electronic-frequency tagging (LOCSET) [
7,
8,
9,
10]; hill climbing algorithms such as stochastic parallel gradient descent (SPGD) [
11,
12]; direct heterodyne phase locking [
13,
14,
15]; and phase intensity mapping (PIM) [
16,
17].
The coherent beam combining technique presented here uses frequency-offset phase-locking (e.g., Ref. [
14]) to actively stabilize the relative phase of multiple independent follower lasers to a single free-running leader laser at a specific offset frequency. We refer to this as a leader-follower laser configuration. One advantage of this architecture is the ability to arbitrarily define the offset frequencies between follower lasers, enabling it to support both coherent and spectral beam-combining. Another advantage is the use of internal sensing [
18,
19,
20,
21], which allows the output wavefront phase of the array to be measured and stabilized without external sampling optics. The use of follower lasers instead of power amplifiers also provides additional benefits since it is possible to control the output phase of each emitter using a combination of fast (e.g., piezoelectric) and slow (thermal) control signals, alleviating the issue of voltage wrapping encountered with electro-optic modulators (EOMs).
This article begins with an overview of the offset phase-locked OPA’s design in
Section 2, followed by details of its implementation both optically and in digital signal processing in
Section 3 and
Section 4, respectively.
Section 5 presents the analytic transfer function model used to analyse the control system and optimise gain parameters. An analysis of experimental results is presented in
Section 6.
2. Design
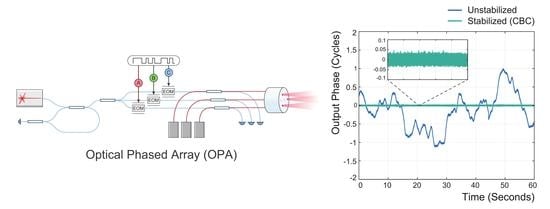
The architecture of an idealized internally sensed OPA of frequency-offset phase locked lasers is shown in
Figure 1. Light from a free running continuous wave laser is separated into two paths. The first (upper arm in the figure) is split into multiple channel (three are shown for illustrative purposes), each connected to a waveguide electro-optic modulator used to encode the phase of the light with a pseudo-random bit sequence (PRBS) for digitally enhanced heterodyne interferometry [
22]. The second path serves as a reference local oscillator for return path detection.
Optical fiber couplers with highly asymmetric power splitting ratios combine light from the three follower lasers with the PRBS encoded light exiting the EOMs. The asymmetric couplers may be, for example, configured such that 1% of the light from each follower laser interferes with 99% of the PRBS encoded light at a dedicated forward path (FP) photodetector. The remaining 99% of the light produced by the follower lasers travels directly to the optical head where it propagates into free space along with 1% of the low-power PRBS encoded light. When light exits the OPA, a small fraction (∼4%) is reflected back into the fiber from the final surface of the optical head due to Fresnel reflection. This reflected light travels in the reverse direction back towards the asymmetric fiber couplers, where 99% of it is guided towards the follower laser and extinguished by an optical isolator. The remaining 1% of the back-reflected light in each channel passes through the EOM where its phase is encoded with a pseudo-random bit sequence for the first time. The phase-encoded back-reflection is then interfered with the unshifted reference local oscillator at a high-bandwidth return path photodetector.
The forward and return path photodetectors are necessary to sense the phase contributions of all uncommon optical path lengths in the optical system [
18]. A measurement of the phase in each optical path length allows the relative phase of each emitter to be stabilized at the output of the array. The signal at each of the forward path detectors is produced by the interference of the follower laser and phase encoded electric fields and has the form
where the index
n represents the emitter number,
is the amplitude,
is the angular heterodyne frequency,
is the beat-note phase (which represents the phase difference between the two arms of the interferometer at the asymmetric fiber coupler), and
is the modulation depth of the binary pseudo-random bit sequence
delayed by
. When the modulation depth
, the identity
can be applied to simplify Equation (
1), where the equation
maps
to
:
The signal at the return path photodetector is the sum of the back-reflected signals
interfering with the reference local oscillator
where the index
n indicates the emitter number,
is the amplitude of the heterodyne interference of the
n’th emitter at the return path photodetector, and
represents the beat-note phase of the
n’th emitter.
The signals at each photodetector are digitized by analog-to-digital converters (ADCs). The digitized signals are then decoded with copies of the pseudo-random bit sequence
for each emitter at the correct delay. The frequency and phase of the decoded signals are measured using digitally implemented phasemeters to derive feedback control signals for relative path length stabilization. A comprehensive analysis of the performance and scalability of digitally enhanced interferometry is presented in [
23], which suggests that this sensing technique could be used to support an optical phased array with potentially hundreds of emitters.
The control system used to stabilize the relative output phase of the OPA has two stages: (i) forward path stabilization; and (ii) return path stabilization. High bandwidth ‘fast’ feedback is actuated using each follower laser’s piezo-electric transducers (PZTs). For fiber lasers, fast feedback can be actuated via direct control of the laser’s drive current. Slow feedback is actuated via thermal control. The use of a single actuator for fast control allows the use of a controller that accepts a linear combination of forward and return path phase error signals to control the phase of each emitter. Digital feedback for each emitter is converted into an analog voltage by a digital-to-analog converter (DAC).
2.1. Optical Phase at the Forward and Return Path Photodetectors
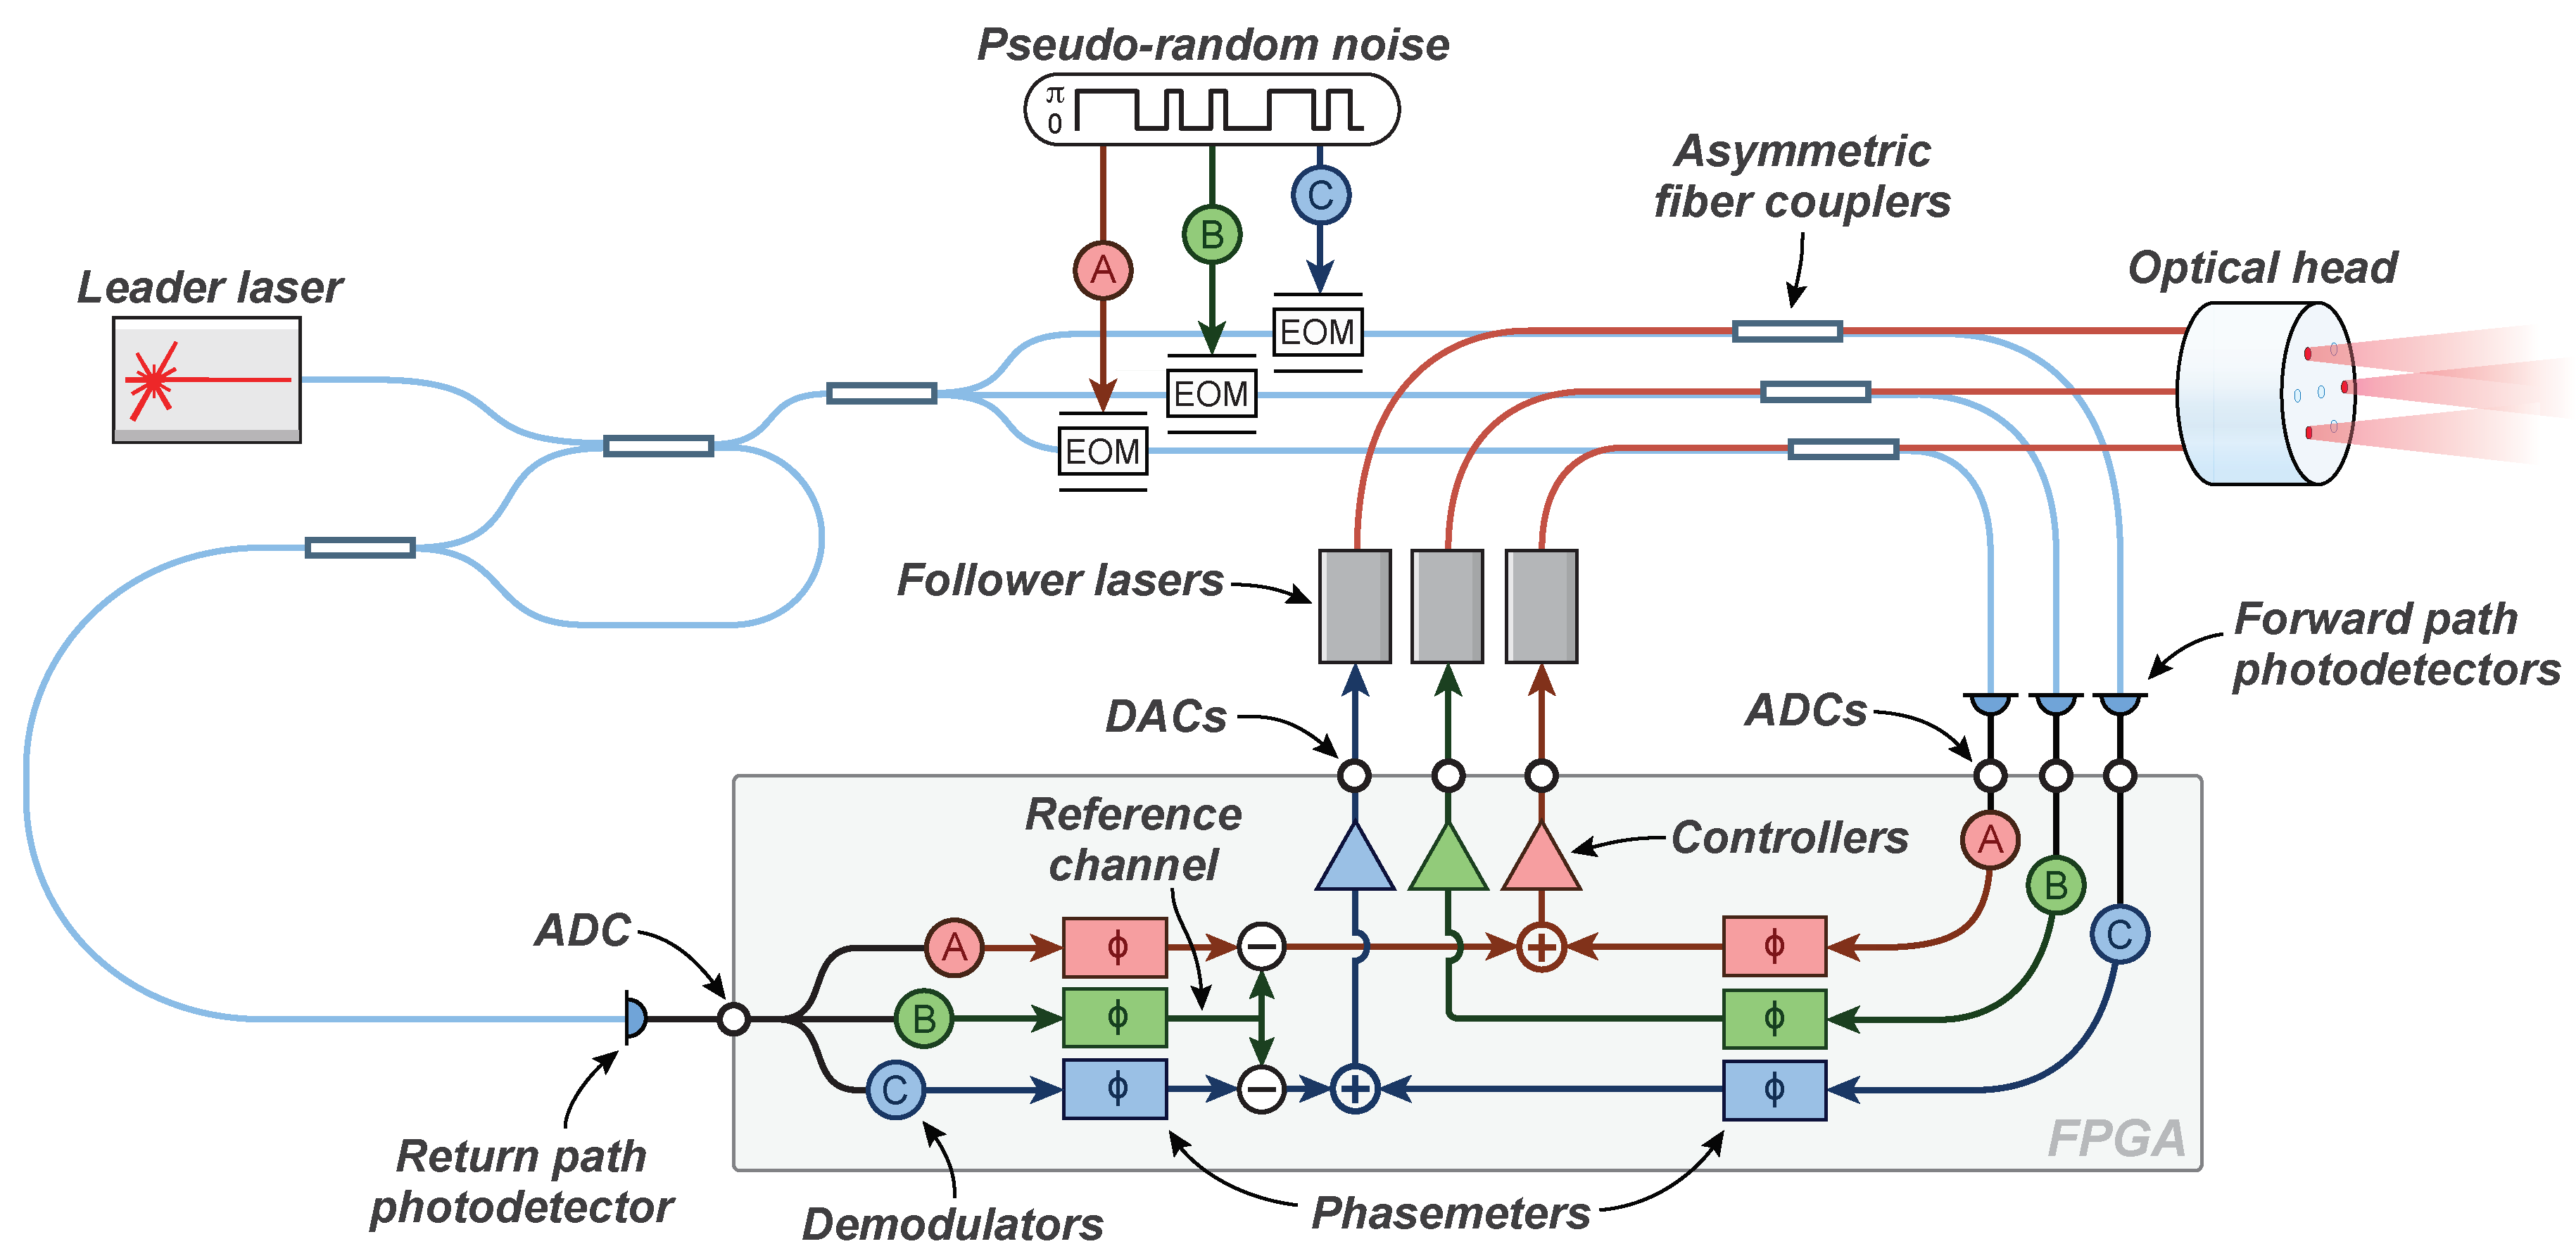
The simplified two emitter optical system shown in
Figure 2 and
Figure 3 illustrates the various phase contributions
from each of the optical path lengths travelled by the light on its way to the forward and return path photodetectors. The beat-note phase measured at the two forward path photodetectors is:
The phase of each channel measured at the return path photodetector is:
Stabilizing the relative phase of each laser at the asymmetric fiber couplers with sufficiently high gain forces
and
to be equal to zero. Thus:
However, this only stabilizes the relative path lengths up to the asymmetric coupler, and does not take into account the round-trip phase contributions and .
Substituting Equations (
4) and (
5) into Equations (
2) and (
3) respectively provides the return path phase when the forward paths are locked:
The relative phase difference of the return path interferometers is then
where
and contains the information needed to stabilize the remaining uncommon optical path lengths. Combining
with the forward path error signals
and
enables the relative path lengths of both emitters to be stabilized at the array’s output, satisfying the requirements for coherent beam combining:
2.2. Frequency-Offset Phase Locking
Frequency-offset phase locking is a technique used to stabilize the relative phase of two or more lasers at an offset frequency. It is similar in principle to the operation of a phase-locked loop in that their primary functions are to: (1) detect the phase difference between two oscillators; and (2) update the phase of one of the oscillators to minimize their relative phase error. Offset phase-locked interferometers are also referred to as optical phase-locked loops [
14].
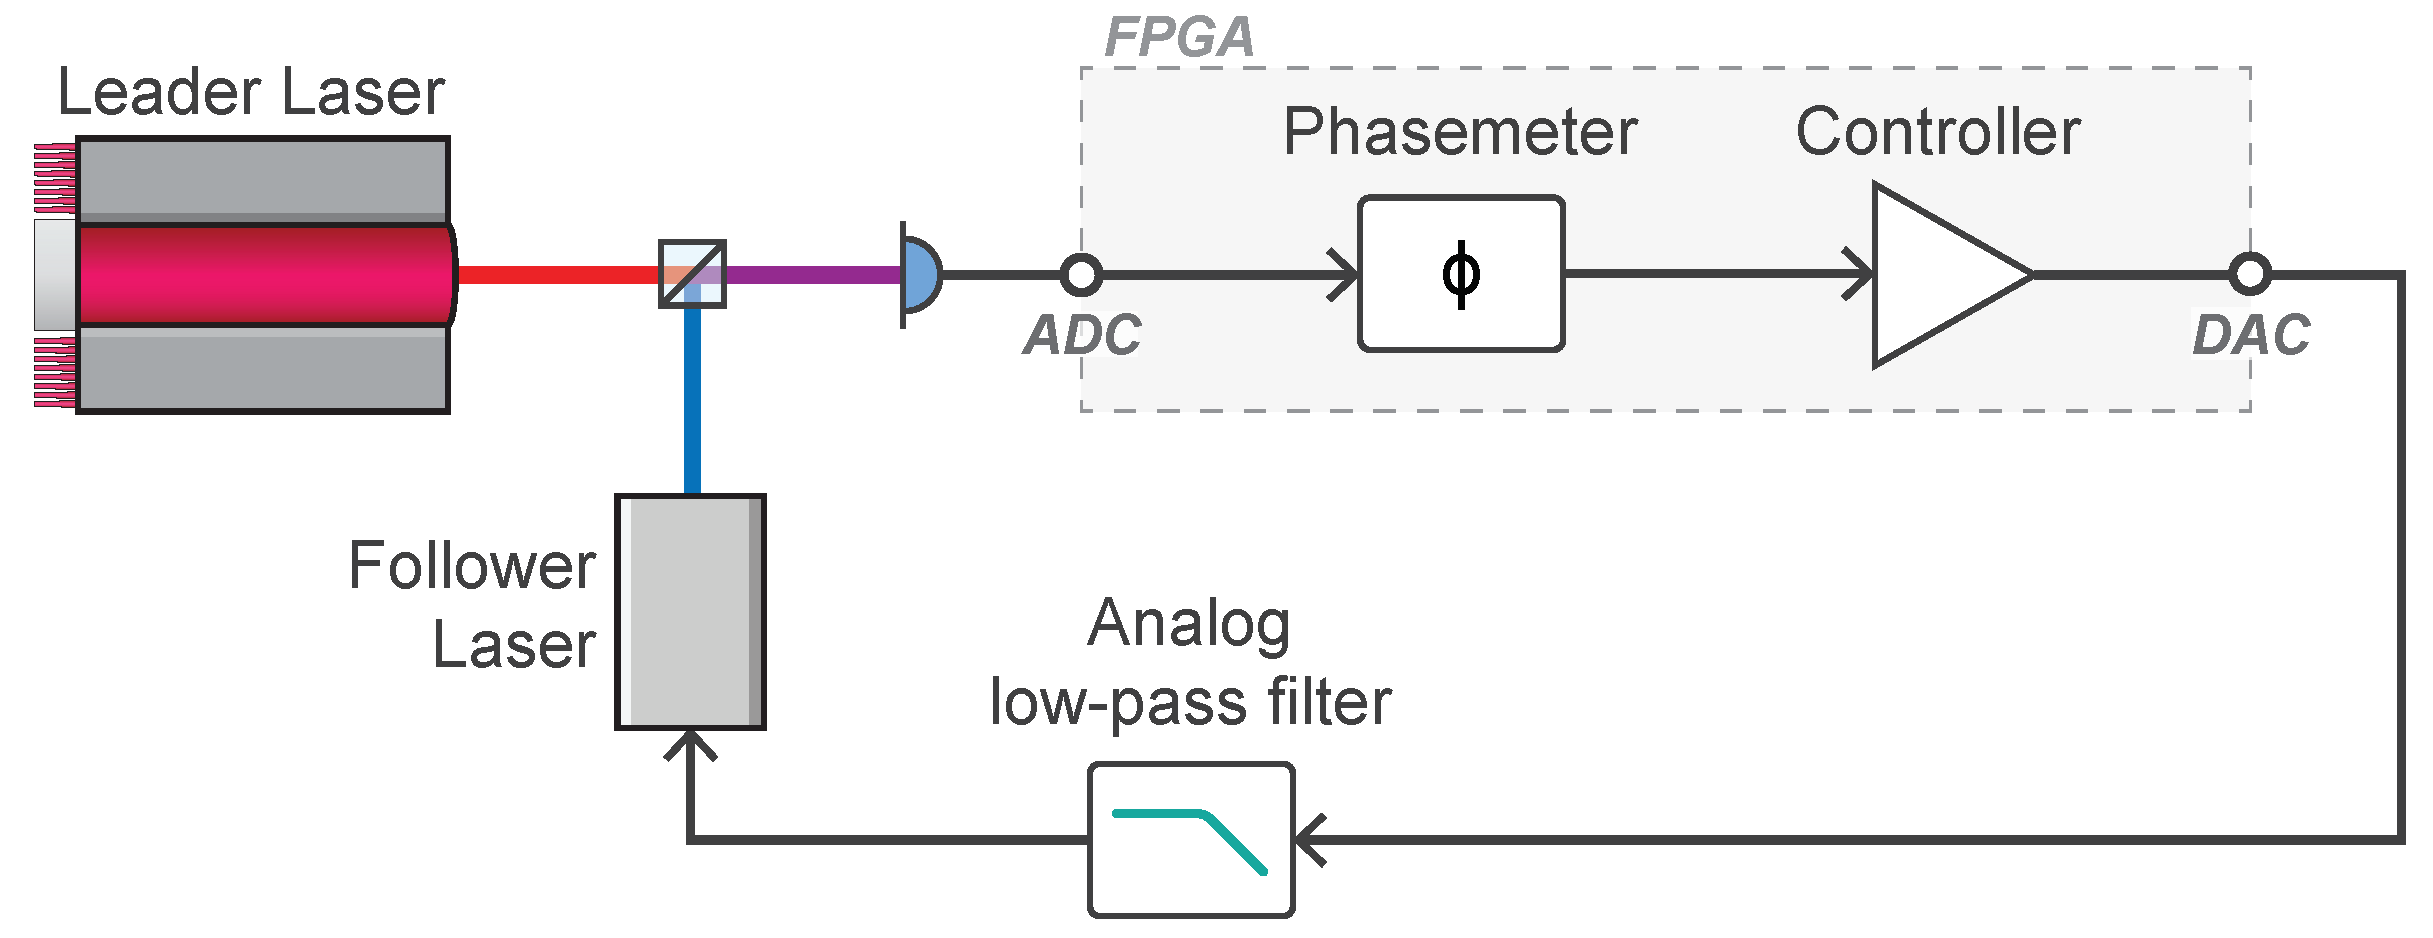
A simplified diagram of an offset phase-locked interferometer is shown in
Figure 4. Light from a leader laser is interfered with a follower laser at a photodetector to generate a heterodyne beat-note at their difference frequency. The beat-note is digitized using an ADC. The phase of the heterodyne beat-note is measured using a phasemeter to produce an error signal proportional to the phase difference between the leader and follower lasers at the beamsplitter. This phase error signal is passed through a controller to generate a feedback control signal that is subsequently converted into an analog voltage by a DAC. The control signal actuates the follower laser’s frequency to stabilize its phase relative to the leader.
3. Optical Implementation
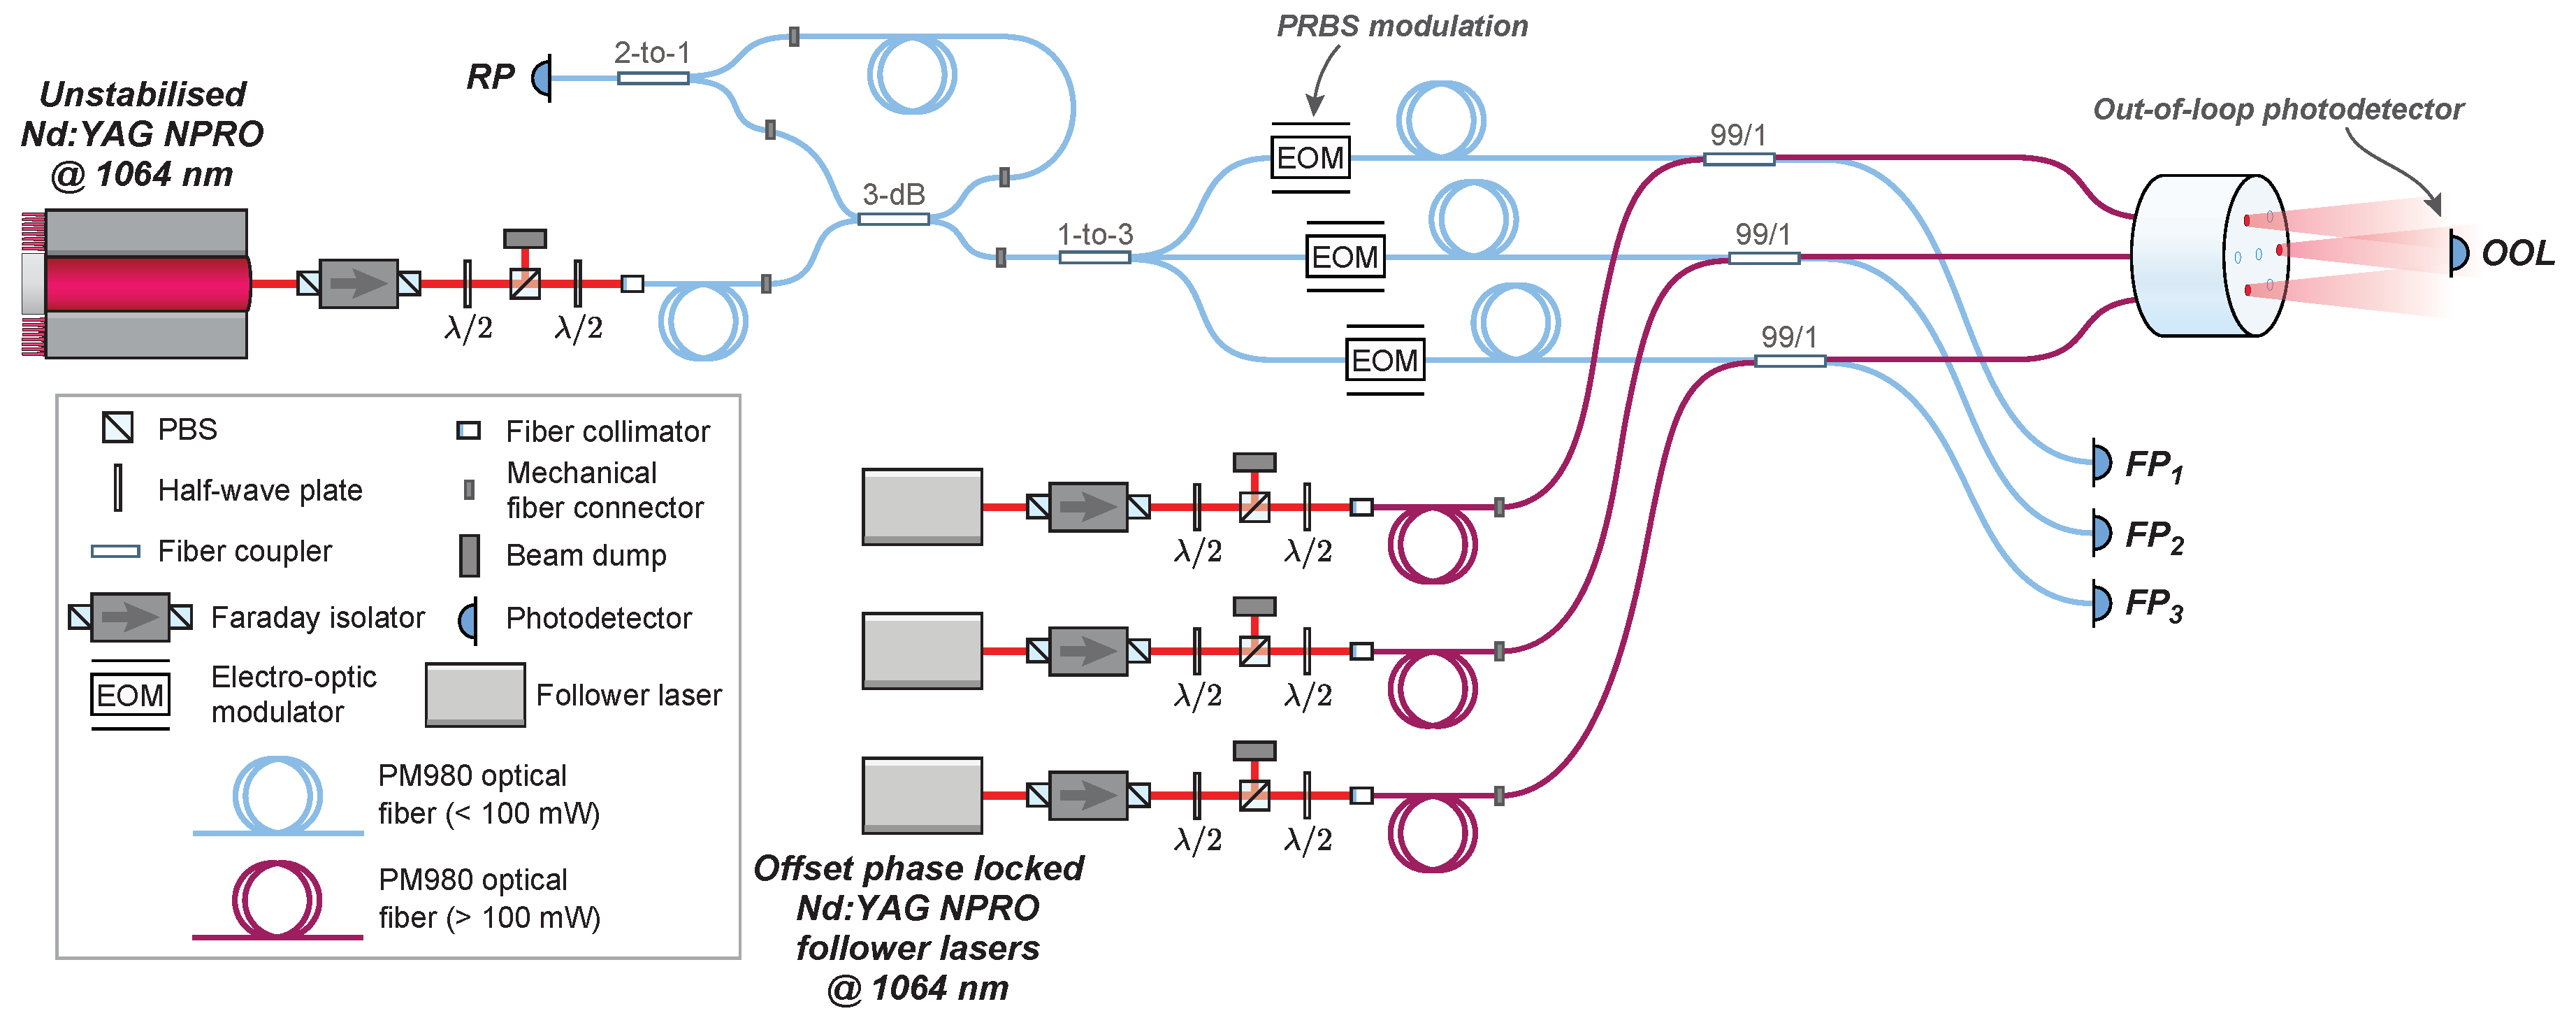
The offset phase-locked OPA was demonstrated experimentally and characterized using the optical configuration shown in
Figure 5.
Four free-space Nd:YAG NPRO lasers with a fundamental wavelength of 1064 nm were used in this experiment: one leader and three followers. Four lasers were used in this experiment due to limited availability of hardware. It should be noted that the sensing and control architecture presented here has the potential to support hundreds of emitters [
23]. The free-running laser frequency noise of the four lasers is proportional to the inverse of the Fourier frequency with a magnitude of
kHz
at 1 Hz. Light from each laser was coupled from free-space into polarization maintaining fiber using fiber collimators. Half-wave plates were used to align the polarisation of each laser to the slow-axis of the fiber. A half-wave plate and polarizing beam-splitter was used to control the amount of optical power entering each fiber. The fiber-coupled power for each of the follower lasers was set to 150 mW to demonstrate the architecture’s ability to operate at optical powers exceeding the damage threshold of the EOMs, which in this system was 100 mW.
In this configuration, it is possible to phase-lock each follower laser to the leader at an arbitrary offset frequency. This allowed us to: (1) generate heterodyne beat-notes at an out-of-loop photodetector for direct out-of-loop measurements of the OPA’s output phase stability using independent phasemeters; and (2) stabilize the OPA without using digitally enhanced heterodyne interferometry, providing an important baseline from which to gauge the impact that DEHI has on .
The heterodyne beat-notes produced by the interference of the three emitters in the far field were detected using a commercial NewFocus 1811FC 125 MHz free-space photodetector (labelled OOL in
Figure 5) placed approximately 10 cm from the optical head, beyond the Rayleigh range of the OPA’s bare fiber apertures. A microlens array can be used to reduce the divergence of the coherently combined beam and increase fill factor. Fiber-coupled NewFocus 1811 photodetectors were used to detect the interference at the return path (RP) and forward path (FP
, FP
, and FP
) detection points. A rail-mounted beam-scan (not shown in
Figure 5) was used to measure the 1D intensity profile of the coherently combined beam at various distances.
Without digitally enhanced heterodyne interferometry, the light from each channel is isolated at photodetectors FP, FP, FP, and RP by demodulating the digitized photodetector voltages at the heterodyne beat-note frequencies produced by the interference of the follower lasers.
Polarization maintaining fiber couplers with an asymmetric splitting ratio are used to (1) merge the high- and low-power sections of the optical system; (2) maximise the power delivered from each follower laser to the far field; and (3) protect sensitive optical components (e.g., electro-optic modulators, photodetector) from damage due to excessive optical power. In general, higher laser powers require greater asymmetry. In this experiment, commercially available fiber couplers with a splitting ratio of 99/1 were used. The couplers were fusion-spliced to the electro-optic modulators and optical head assembly to minimize scattering and loss.
The frequency of each laser was tuned over a range of approximately 30 GHz by changing the temperature of the laser crystal with a voltage to the laser’s thermal input. The thermal tuning coefficient for each laser was measured to be between and GHz/K, where the change in temperature due to an applied voltage is 1 K/V. The thermal actuation bandwidth for all four lasers is less than 1 Hz.
Fast tuning of laser frequency was achieved by applying a voltage signal to the laser’s PZT input. Each laser’s PZT tuning coefficient was measured to be between 1 and 3 MHz/V with a bandwidth of approximately 100 kHz.
4. Digital Signal Processing
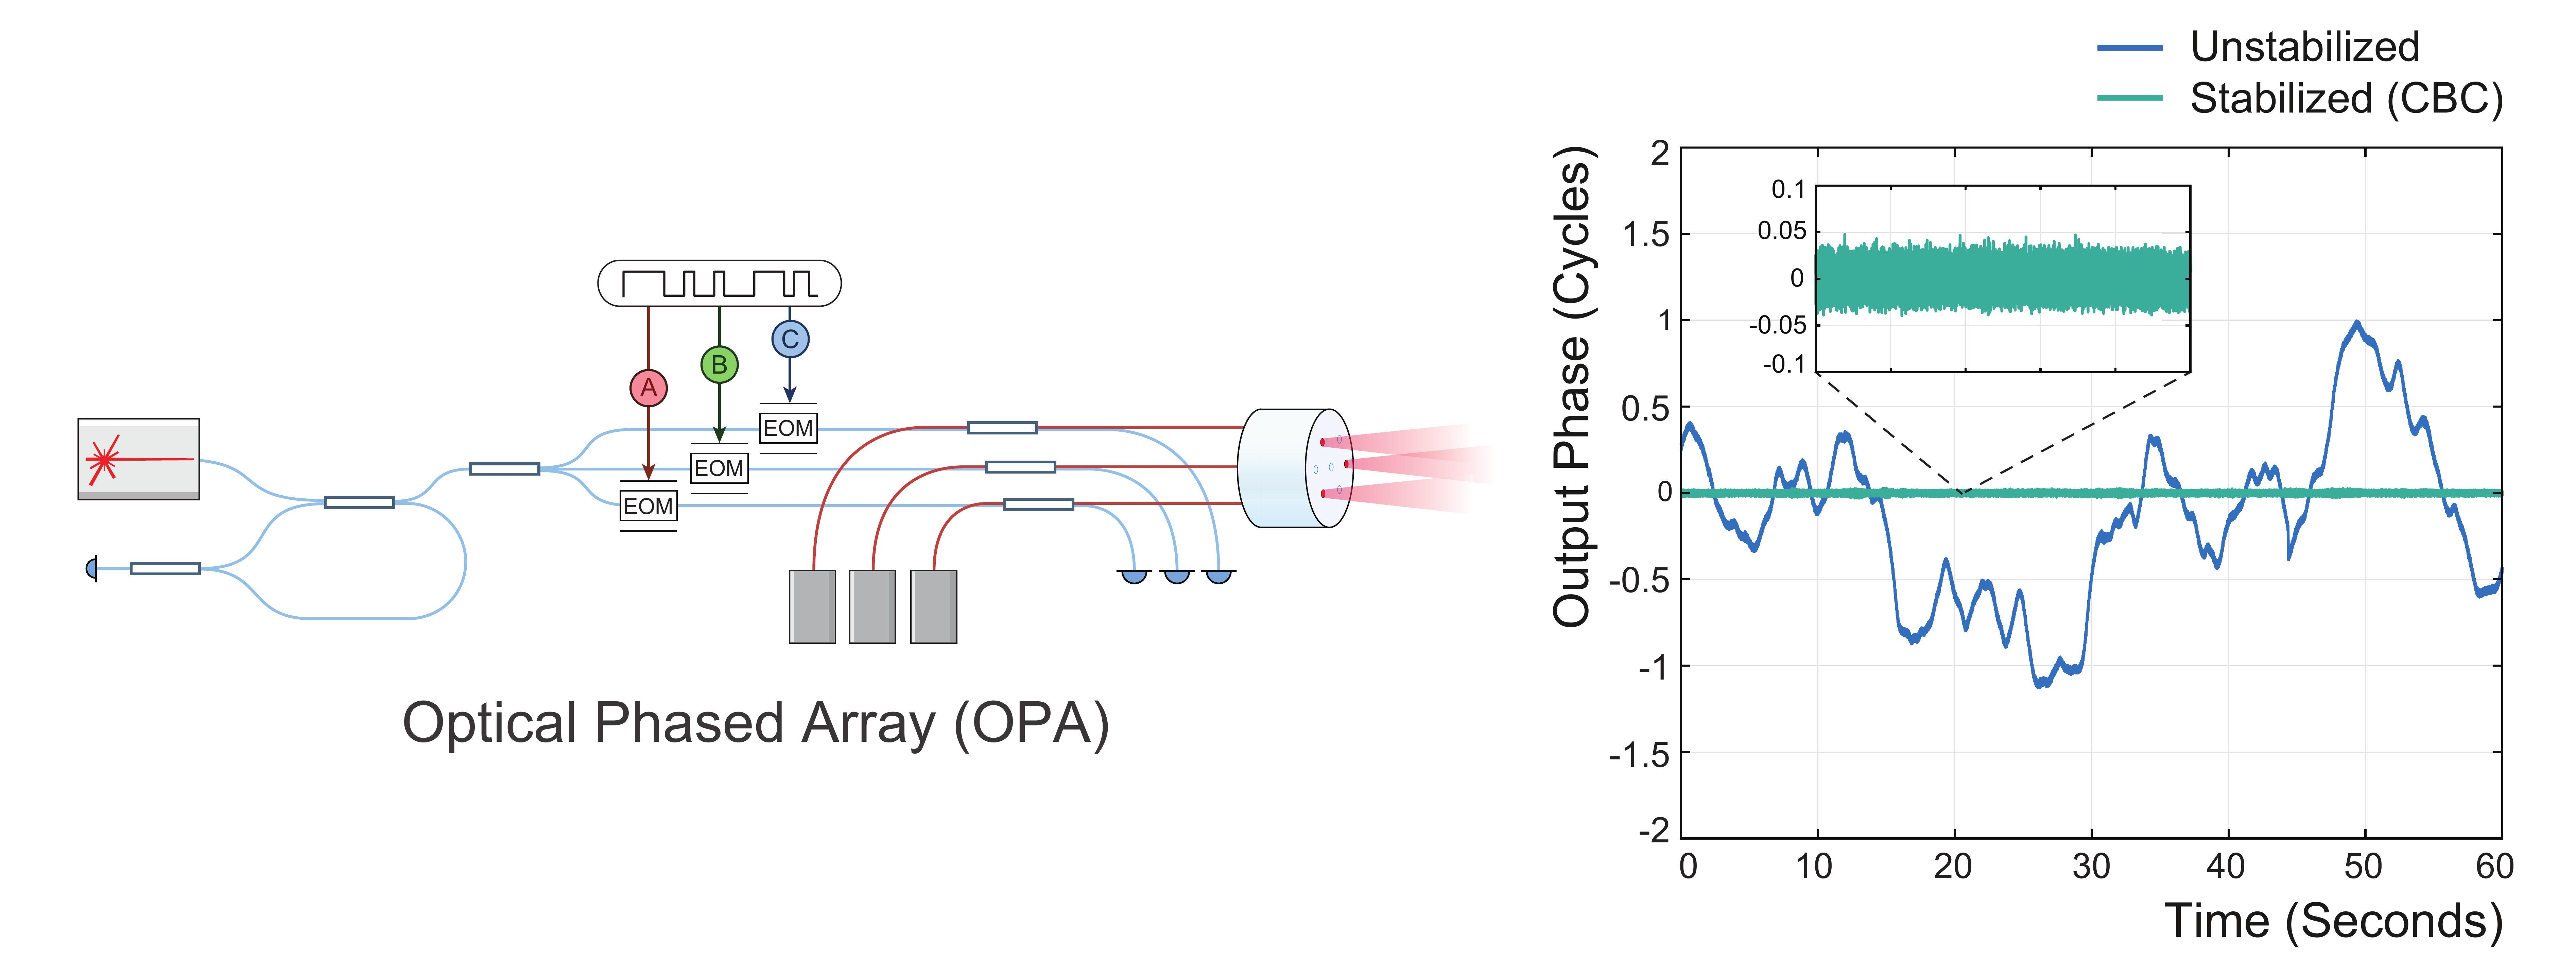
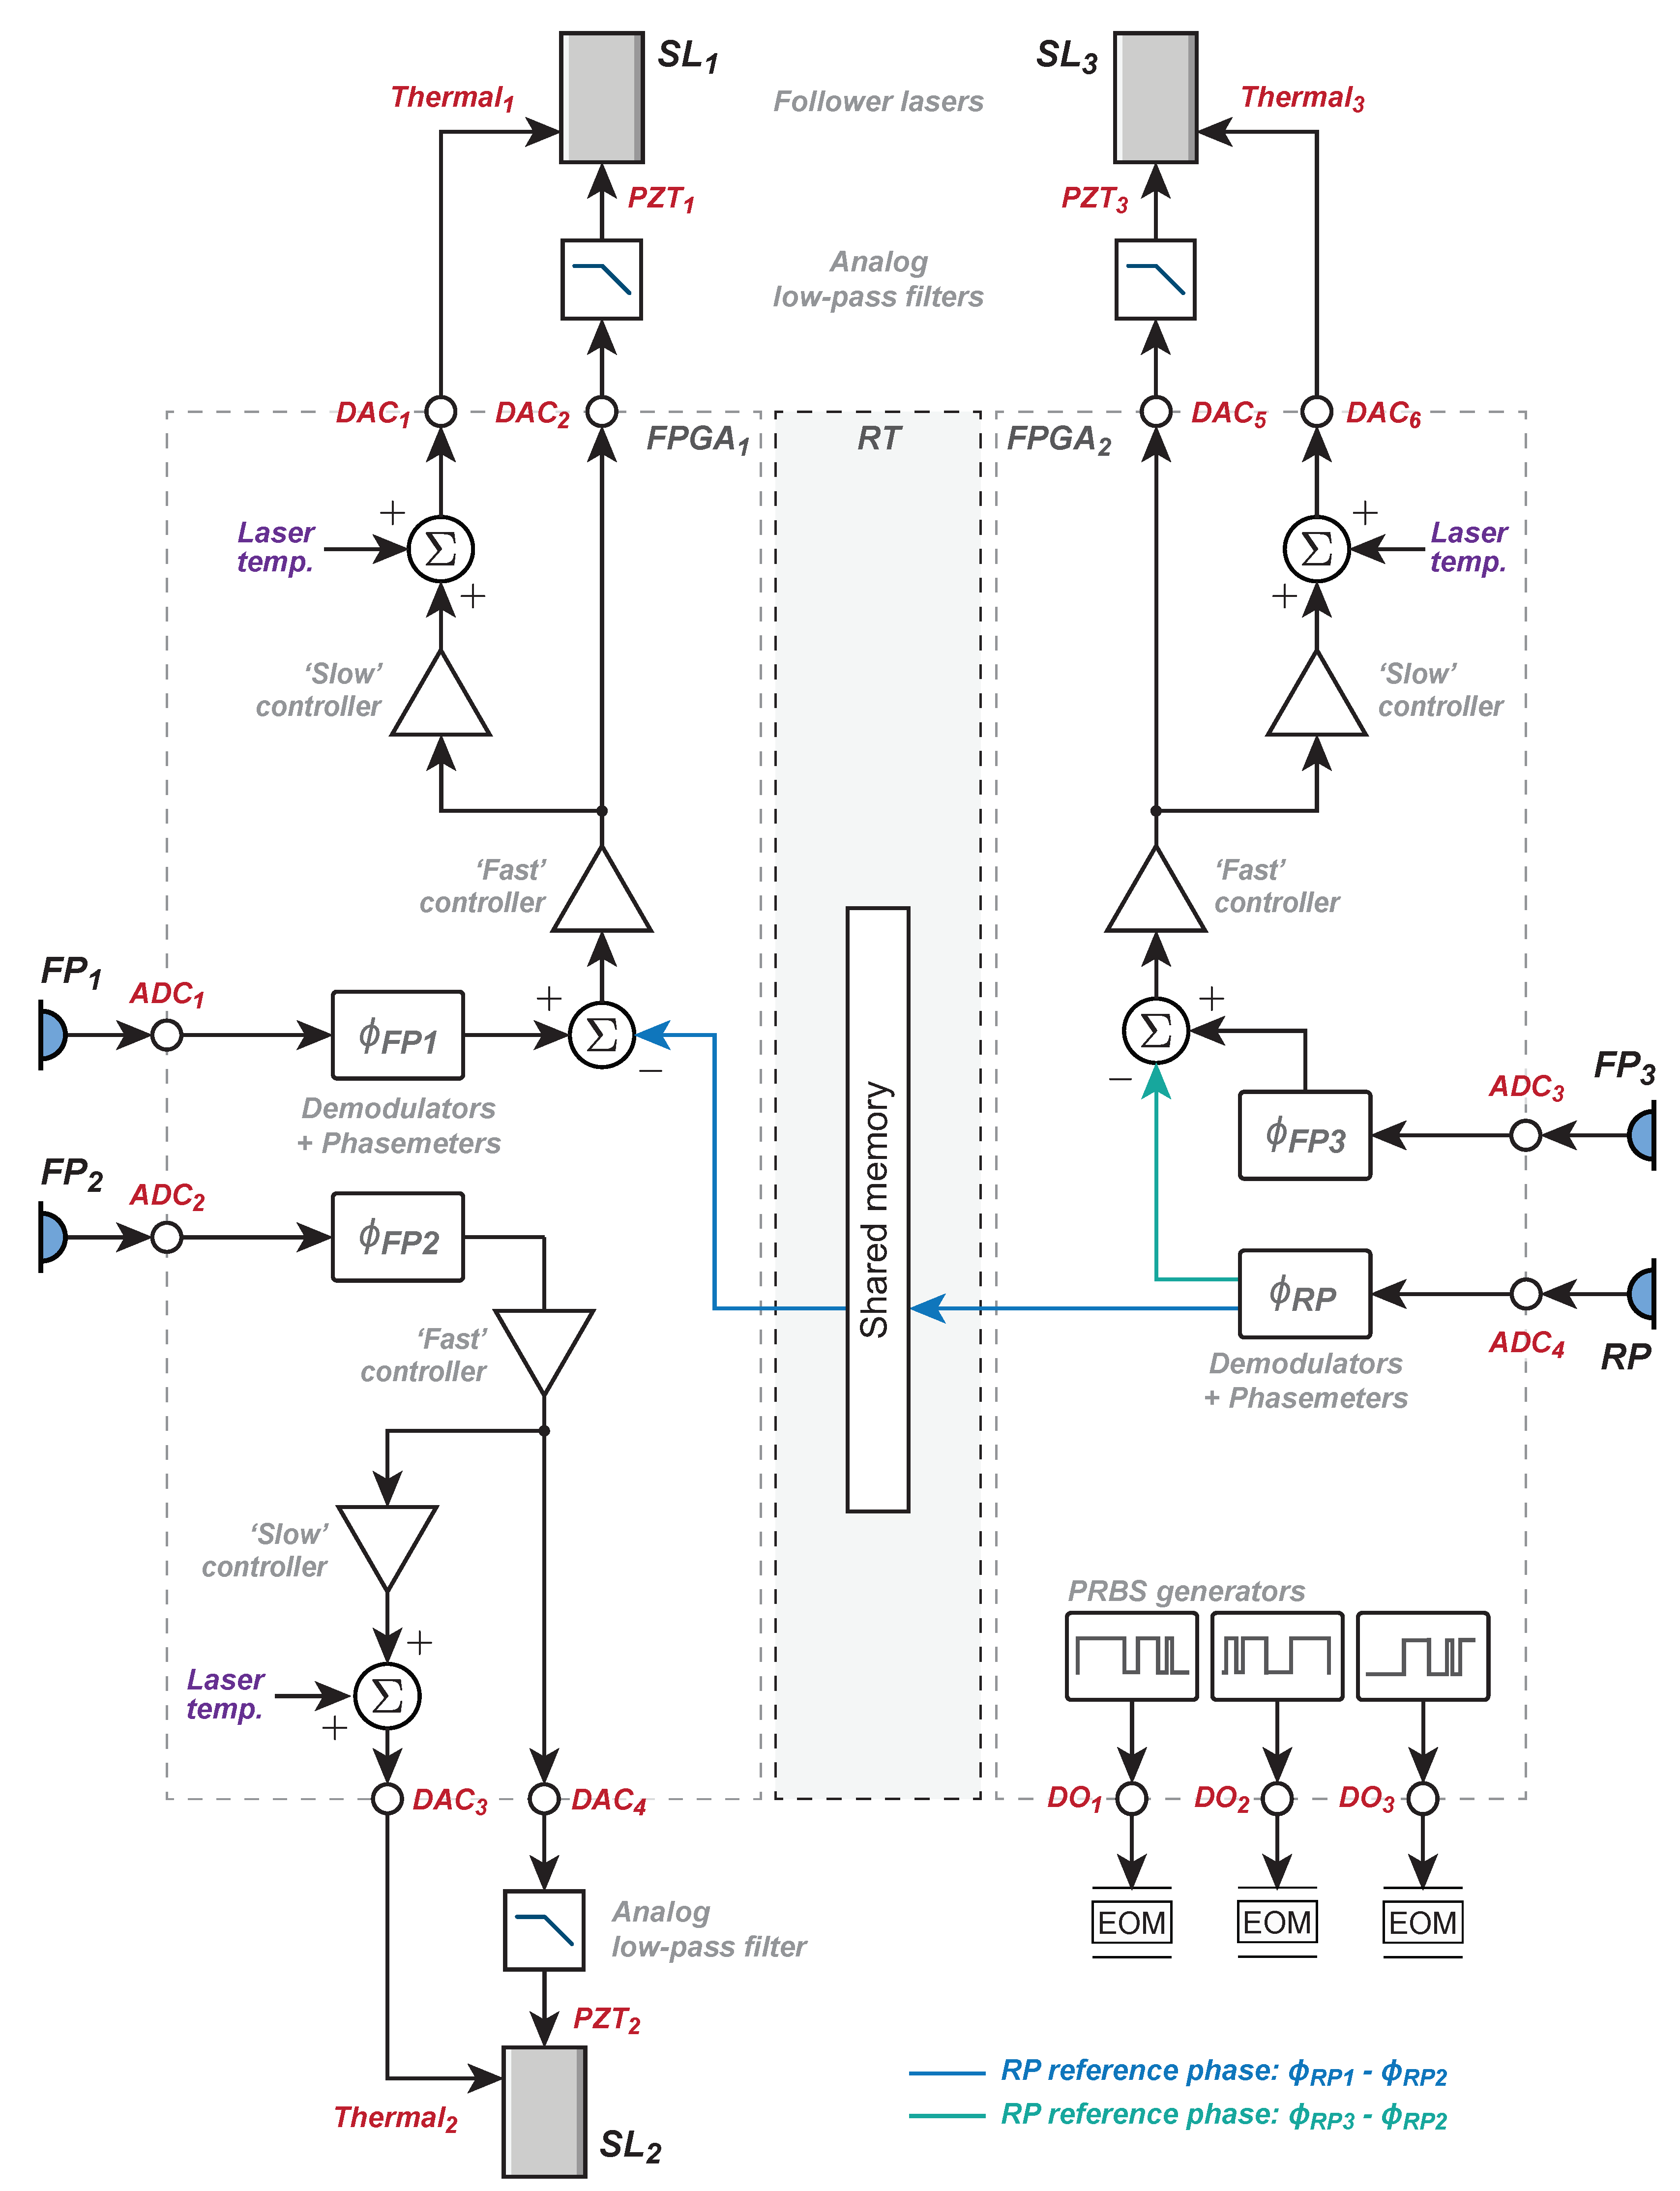
The measurement and feedback control system used to stabilize the relative output phase of the offset phase-locked OPA was implemented using two field-programmable gate arrays (FPGAs) as shown in
Figure 6. Two FPGAs (National Instruments PXI-7852Rs) were required in this experiment, as they each supported a maximum of two 40 MSa/s ADCs.
The heterodyne beat-notes produced by each photodetector were digitized using 16-bit ADCs at a sampling frequency of 40 MSa/s. The digitized signals were decoded with delay-matched pseudo-random bit sequences. Digitally implemented phase-locked loops [
20,
24] were used to measure the phase of the decoded signals. The phase of the second follower laser SL
is the reference from which the return path phase errors (highlighted blue and green in
Figure 6) are calculated.
The measured phase leaving the two forward path phasemeters (
and
) is combined with the phase error signals produced by the return path phasemeters (highlighted blue and green in
Figure 6), producing the error signals needed to stabilize the relative output phase of the array. The combined error signals are passed through ‘fast’ controllers to generate feedback control signals, which were converted into analog voltages using 16-bit, 1 MSa/s DACs. Each fast feedback DAC is connected to a single-pole low-pass filter with a cutoff frequency of 3 kHz to suppress high-frequency noise produced by the DACs, which includes harmonic distortion, glitch noise, and quantization noise. The low-pass filtered control signals were connected directly to each laser’s piezoelectric (PZT) actuator inputs.
Slow controllers are used to provide long term stability by preventing the fast PZT control signals from exceeding the ±10 V range of the DACs in response to large frequency errors. Large, slow frequency disturbances are thus corrected by the slow controller, whereas lower magnitude, high frequency disturbances are corrected by the fast controller. The slow controller derives its error signal from the output of the fast controller, essentially providing more gain at low frequencies to compensate for large frequency disturbances that would otherwise overwhelm the fast controller’s actuation range. Slow feedback control signals were converted into analog voltages using 16-bit 1 MSa/s DACs. The slow controller feedback signal is combined with a manually tuneable laser temperature control in digital signal processing, allowing each laser’s frequency to be manually tuned to produce interference beat-notes within the 125 MHz bandwidth of the photodetectors.
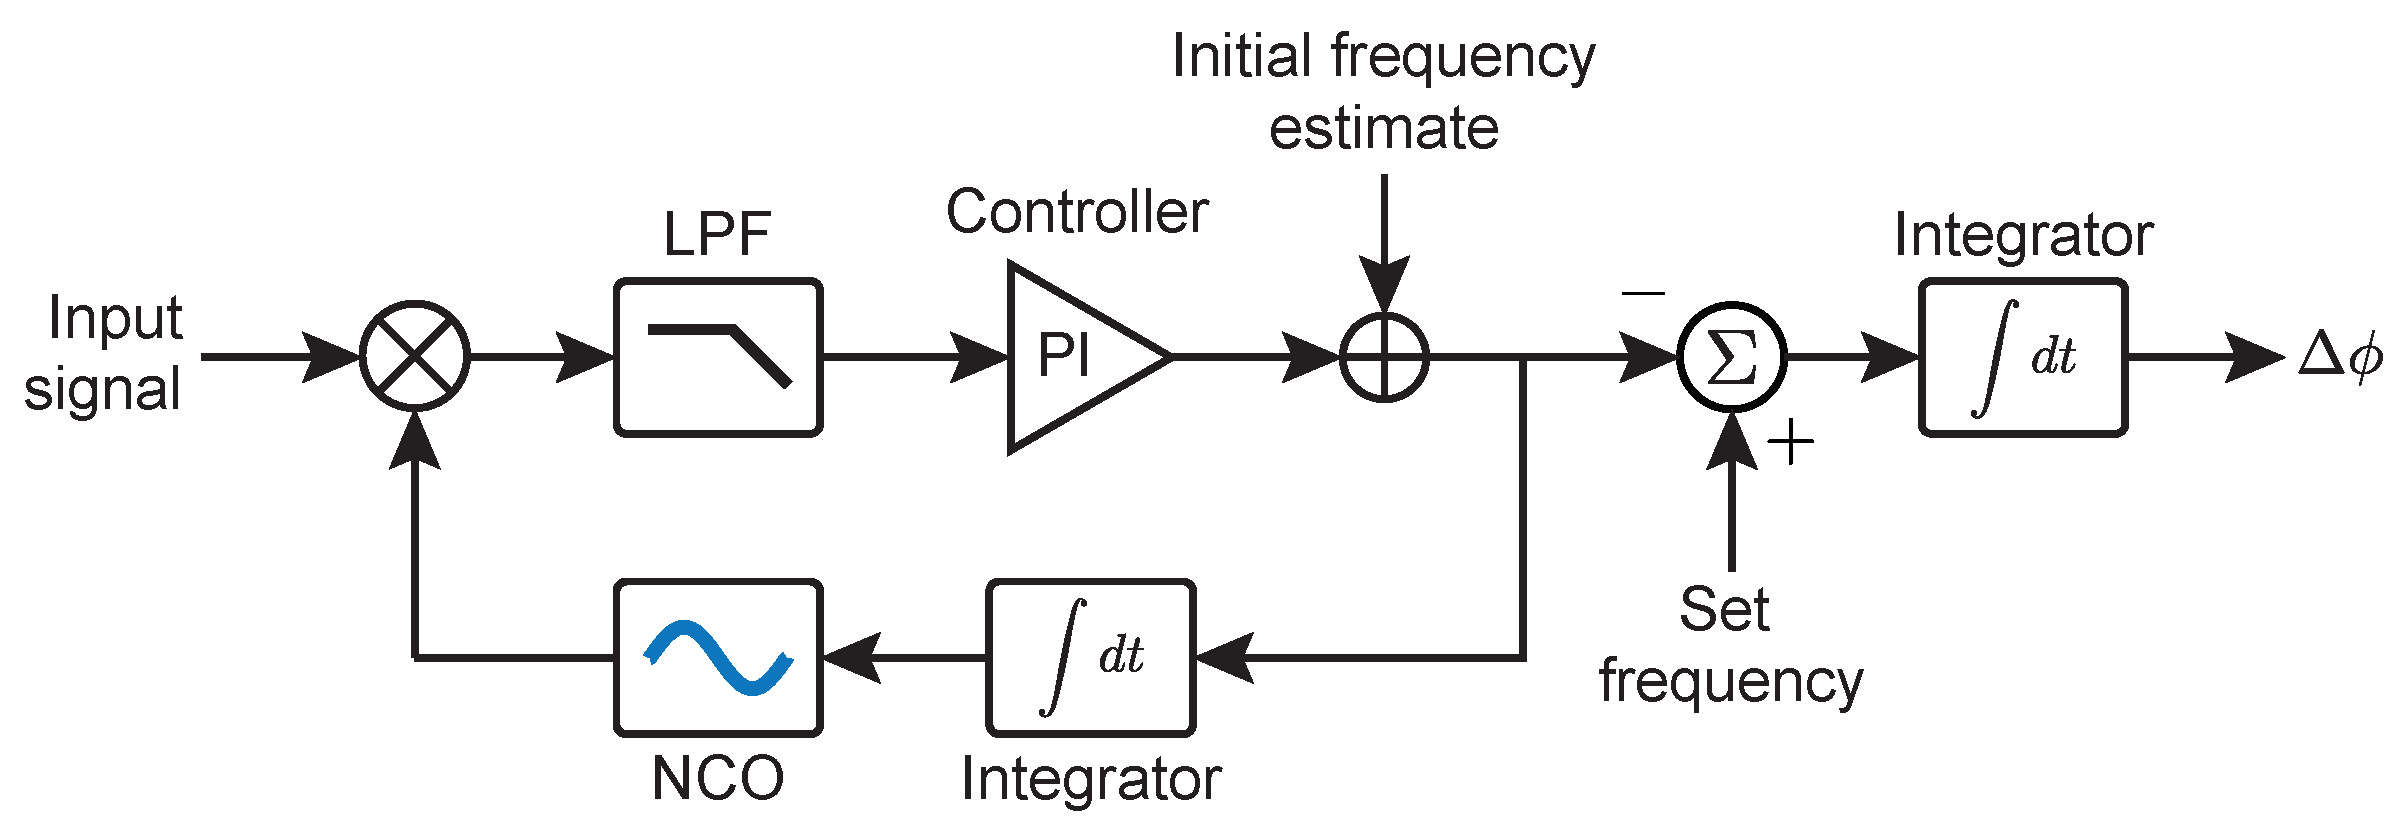
Phasemeter Implementation for Frequency-Offset Phase Locking
In frequency-offset phase locking, the phase error
is measured with respect to the desired offset frequency,
. If the absolute frequency of the measured heterodyne beat-note is
, then the absolute phase error with respect to
is:
In this system, the phase error
is measured using a digitally implemented phase-locked loop (shown in
Figure 7). The absolute frequency of the measured heterodyne beatnote
is subtracted from the desired offset frequency
and then integrated to produce the phase error signal.
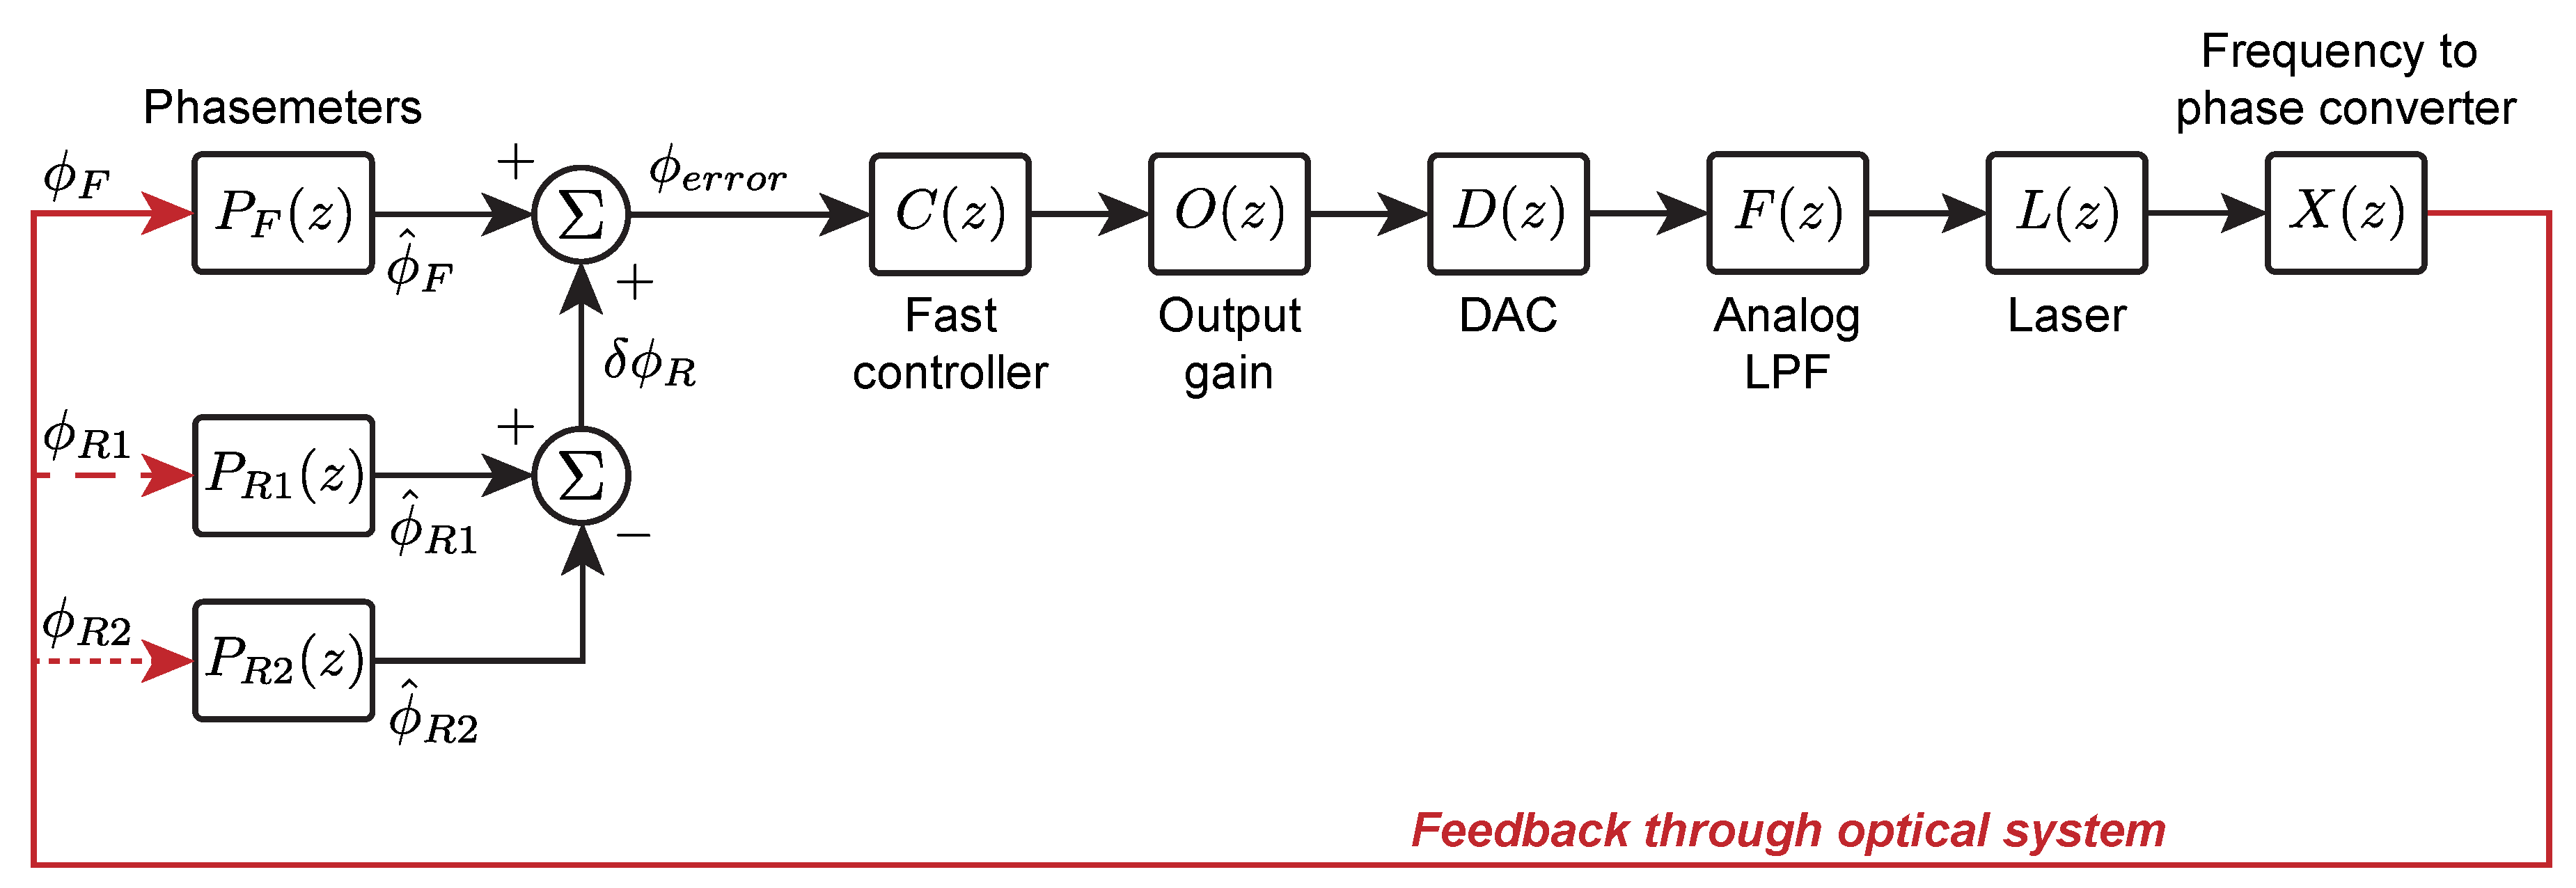
5. Transfer Function Model
The transfer function model shown in
Figure 8 was created to simulate and analyze the frequency-offset phase-locked OPA’s open-loop gain under different loop conditions (e.g., phase-locked loop bandwidth and frequency-offset phase locked loop controller gains).
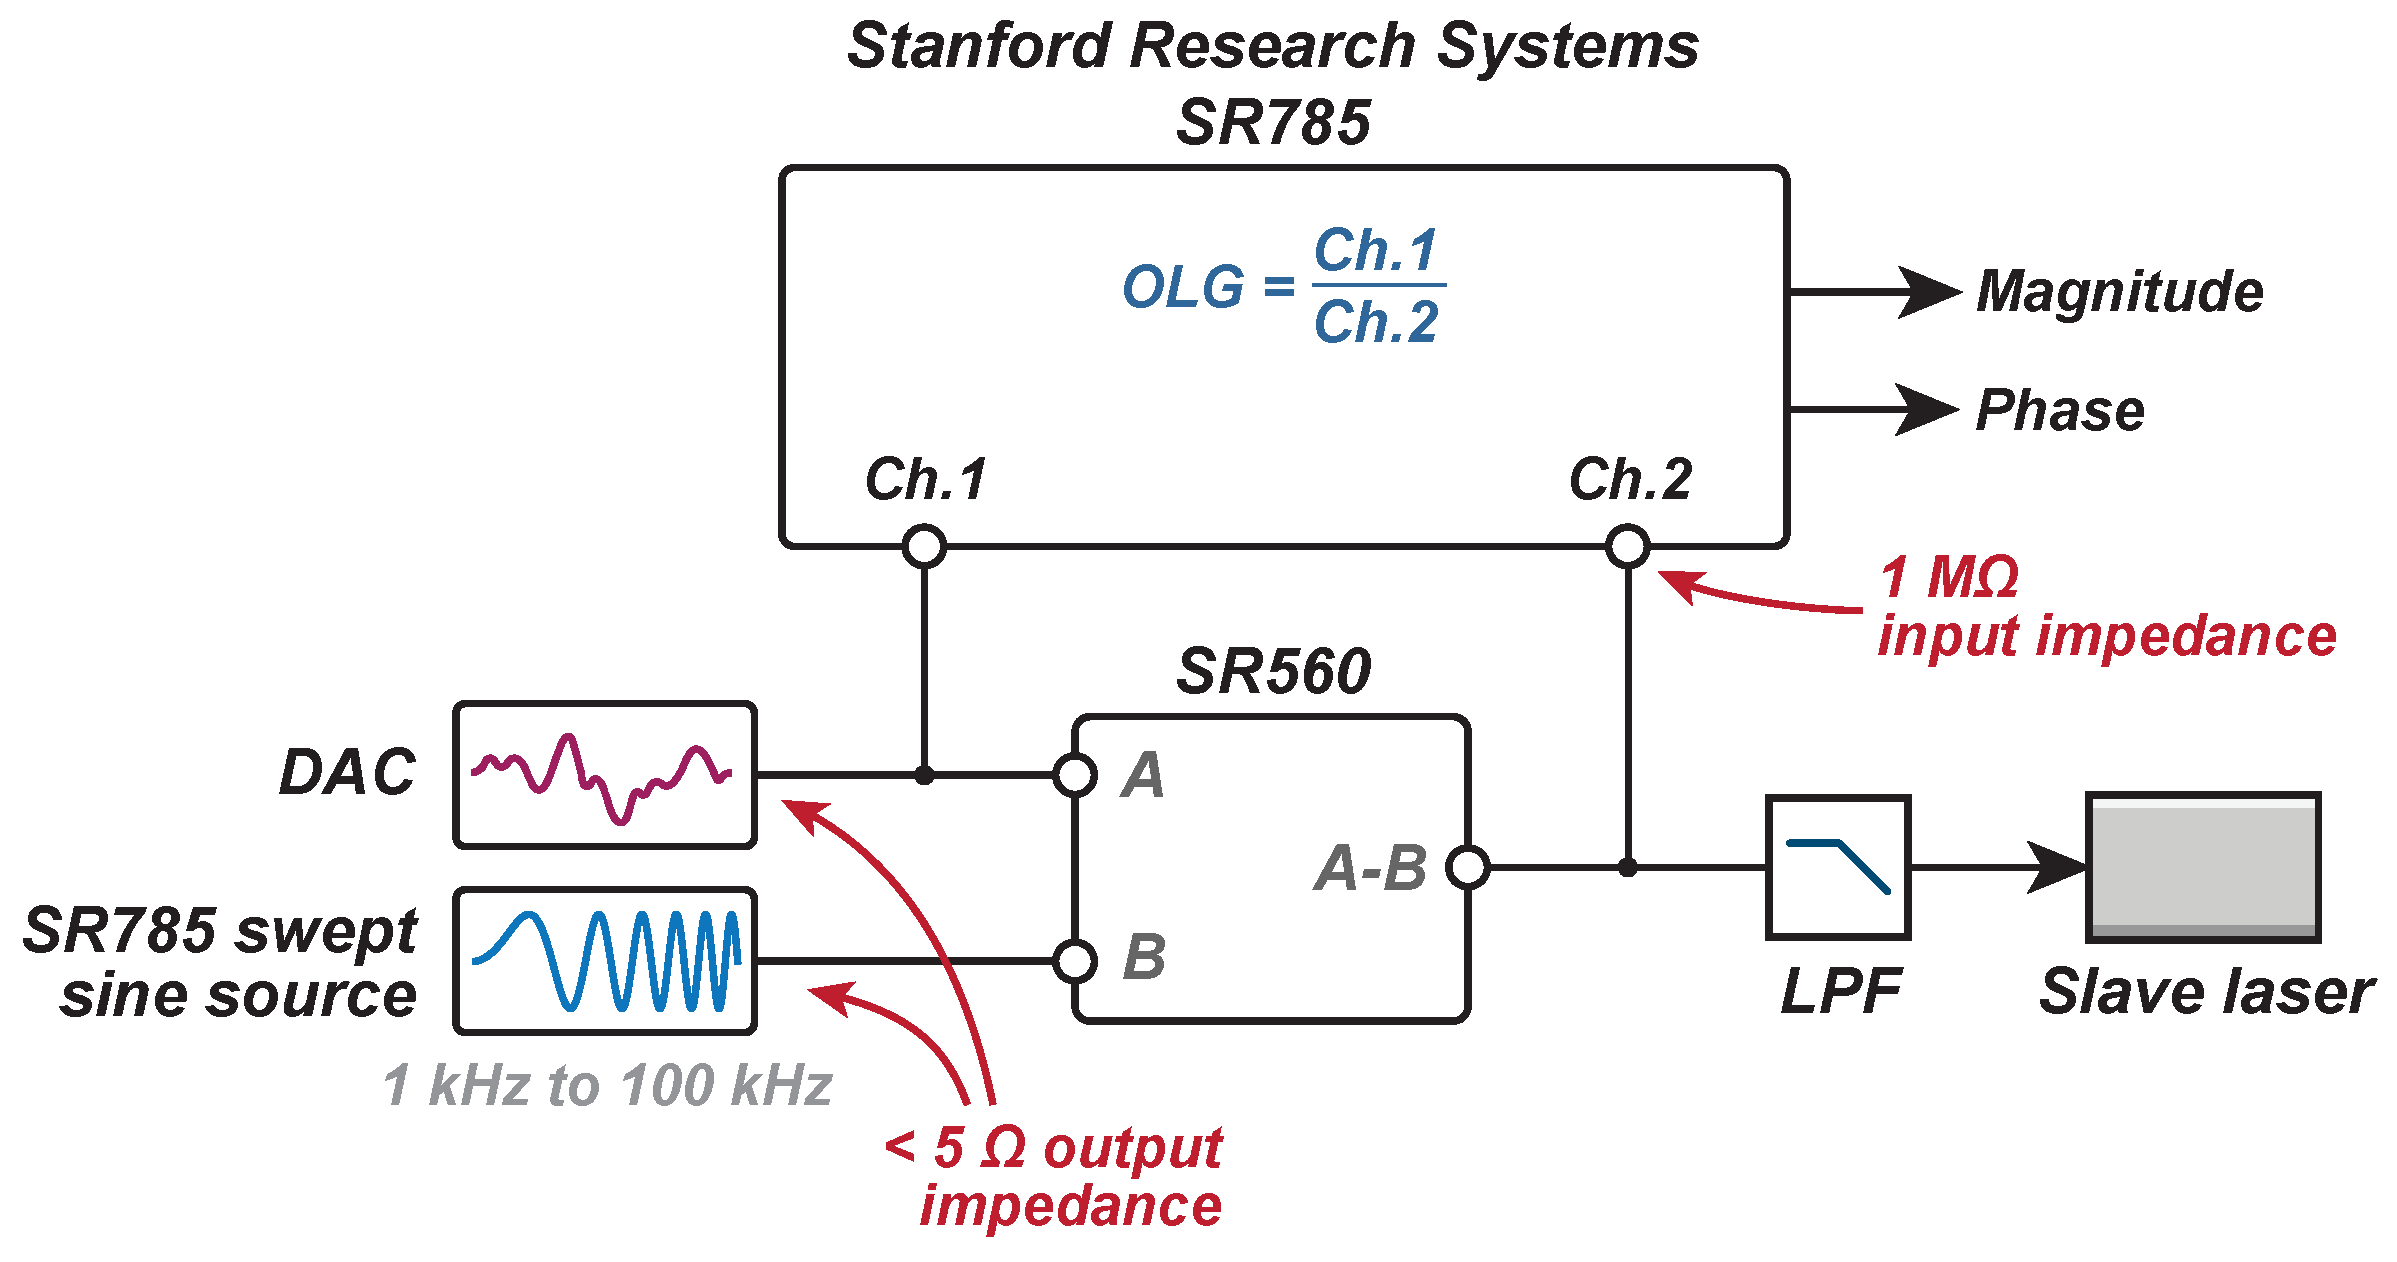
A network analyzer (Stanford Research Systems SR785) and low-noise pre-amplifier (Stanford Research Systems SR560) were used to measure the OPA’s open-loop gain using the experimental setup shown in
Figure 9. For this measurement, the Mephisto NE2000 was the leader and the Prometheus NE20 was the follower.
A 50 mV swept-sine wave with a sweep range of 1 kHz to 100 kHz was generated by the SR785 and added to the voltage signal produced by the DAC using the SR560 as a summing junction. The summed output of the SR560 was connected directly to the analog low-pass filter to close the loop. The outputs from the DAC and SR560 were connected into channels 1 and 2 on the SR785 using tee-junctions. The voltage drop resulting from the tee-junctions was negligible as the SR785 has a high input impedance (>1 M) relative to the low impedance outputs of the SR785’s swept-sine source and DAC (<5 ).
This arrangement introduces a disturbance into the loop that the control systems acts to suppress by generating a corrective voltage signal at the DAC, which was measured on channel 1 of the SR785. The suppressed signal leaving the SR560 is then measured on channel 2. Dividing the correction signal (channel 1) by the suppressed signal (channel 2) produces a measurement of the system’s open-loop gain.
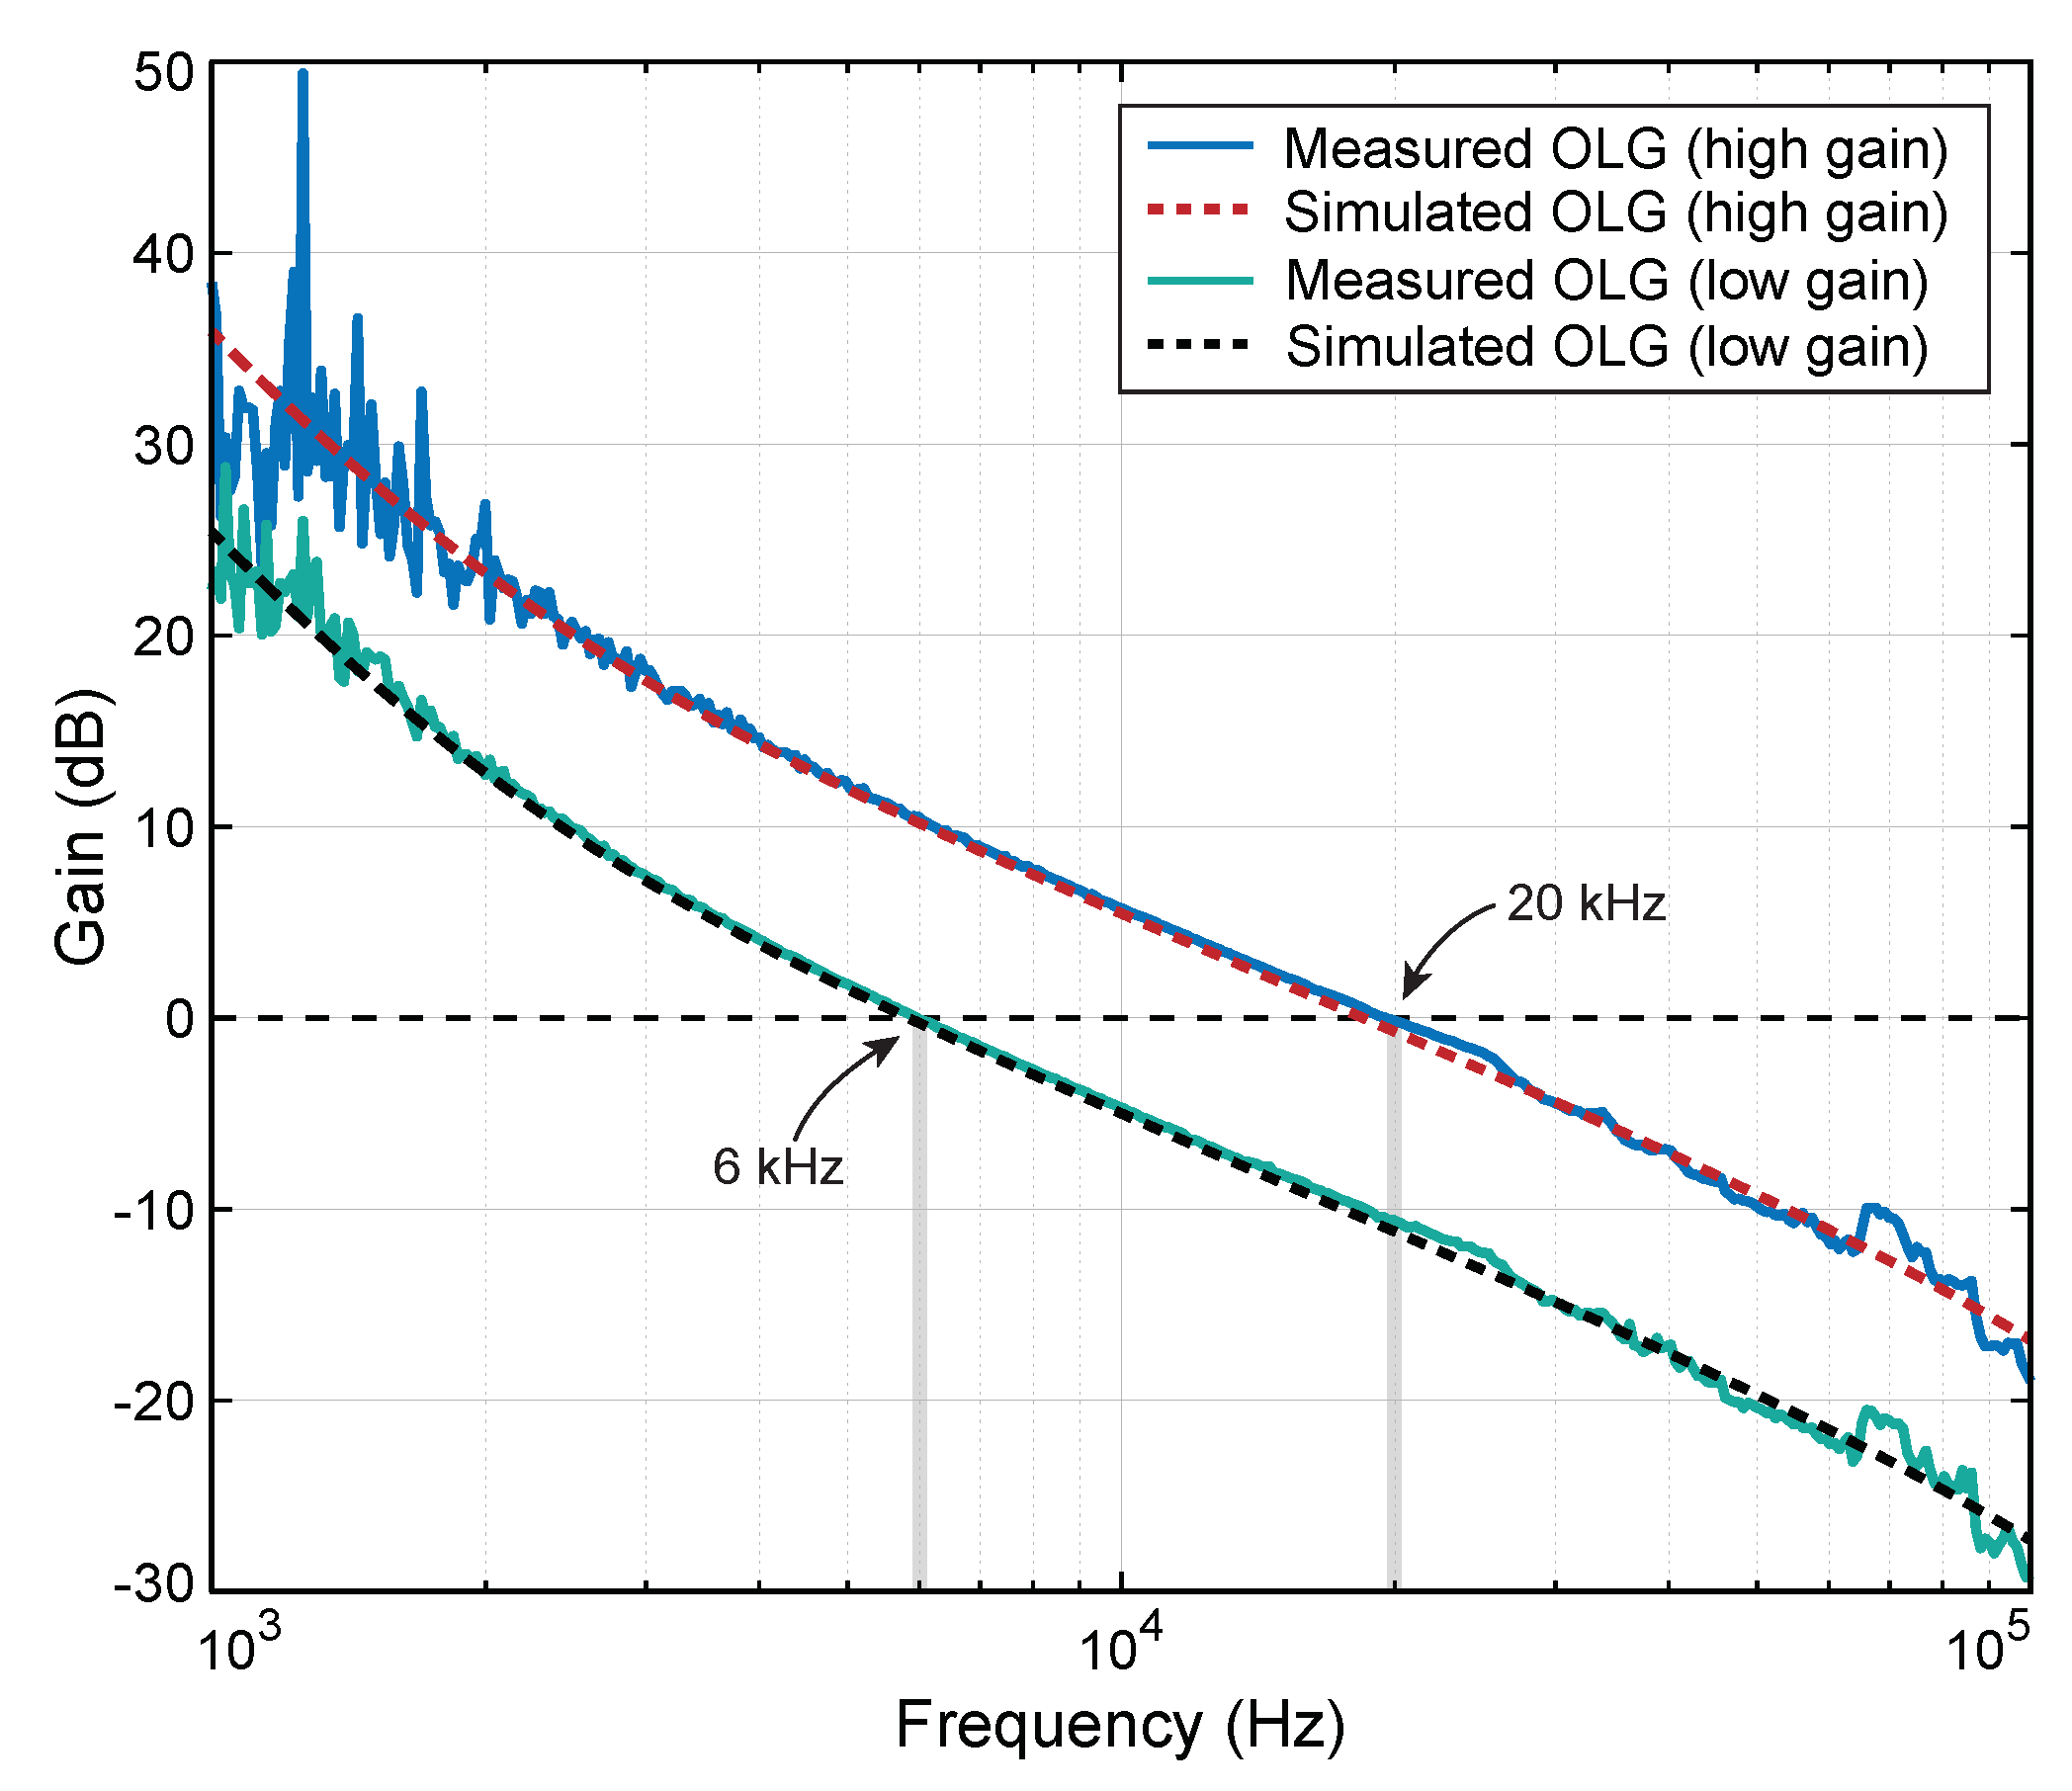
The simulated and measured open-loop gains are shown in
Figure 10. The fast controller gains were configured to produce unity gain frequencies at 6 kHz and 20 kHz. The measurements agree well with simulation above 2 kHz. The noise in the measured data below 3 kHz is due to the strong suppression of the injected disturbance, as the controller has high gain at low frequencies, reducing the signal-to-noise ratio of the suppressed disturbance measured on channel 2.
6. Results and Analysis
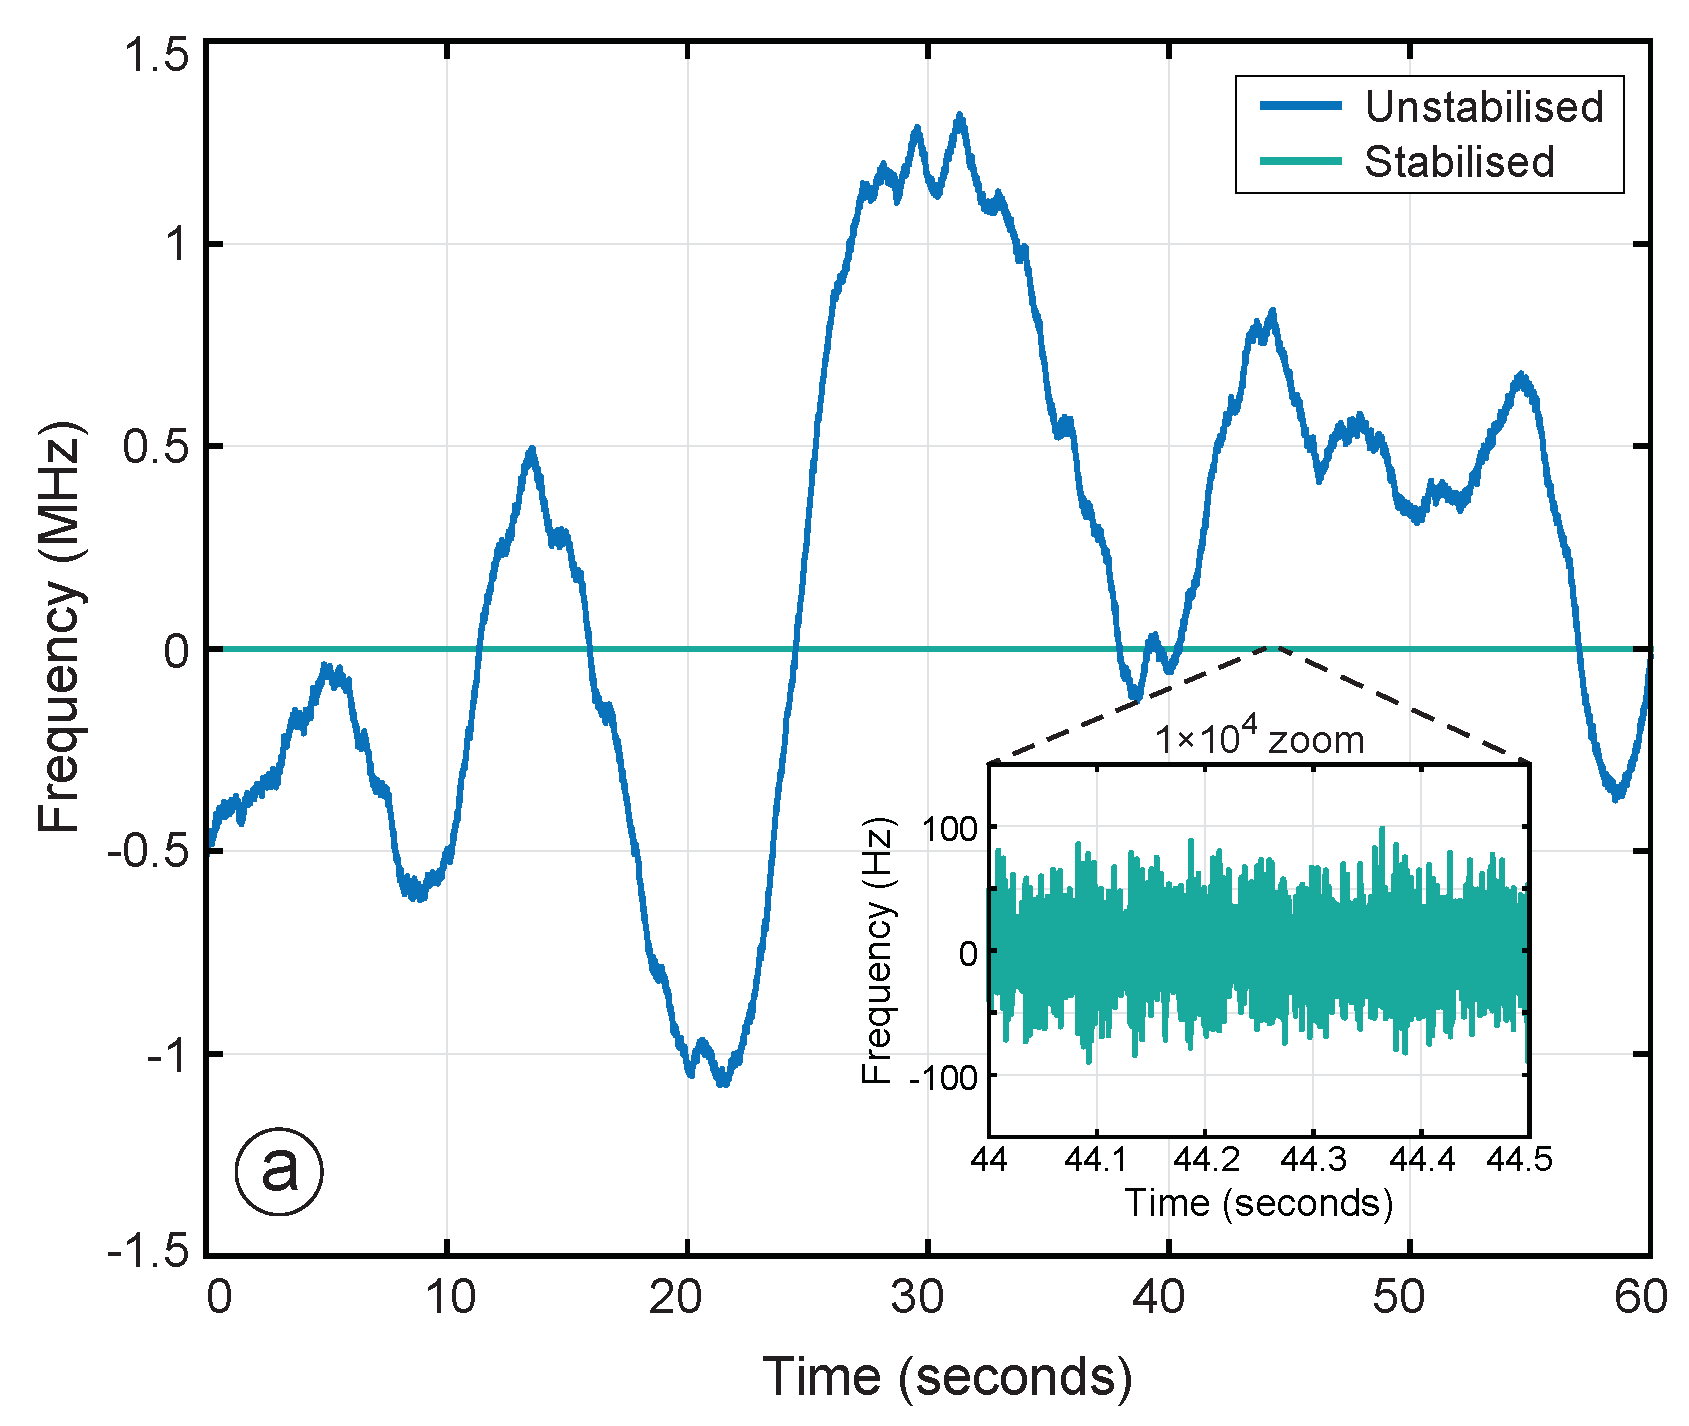
6.1. Relative Laser Frequency Stabilization
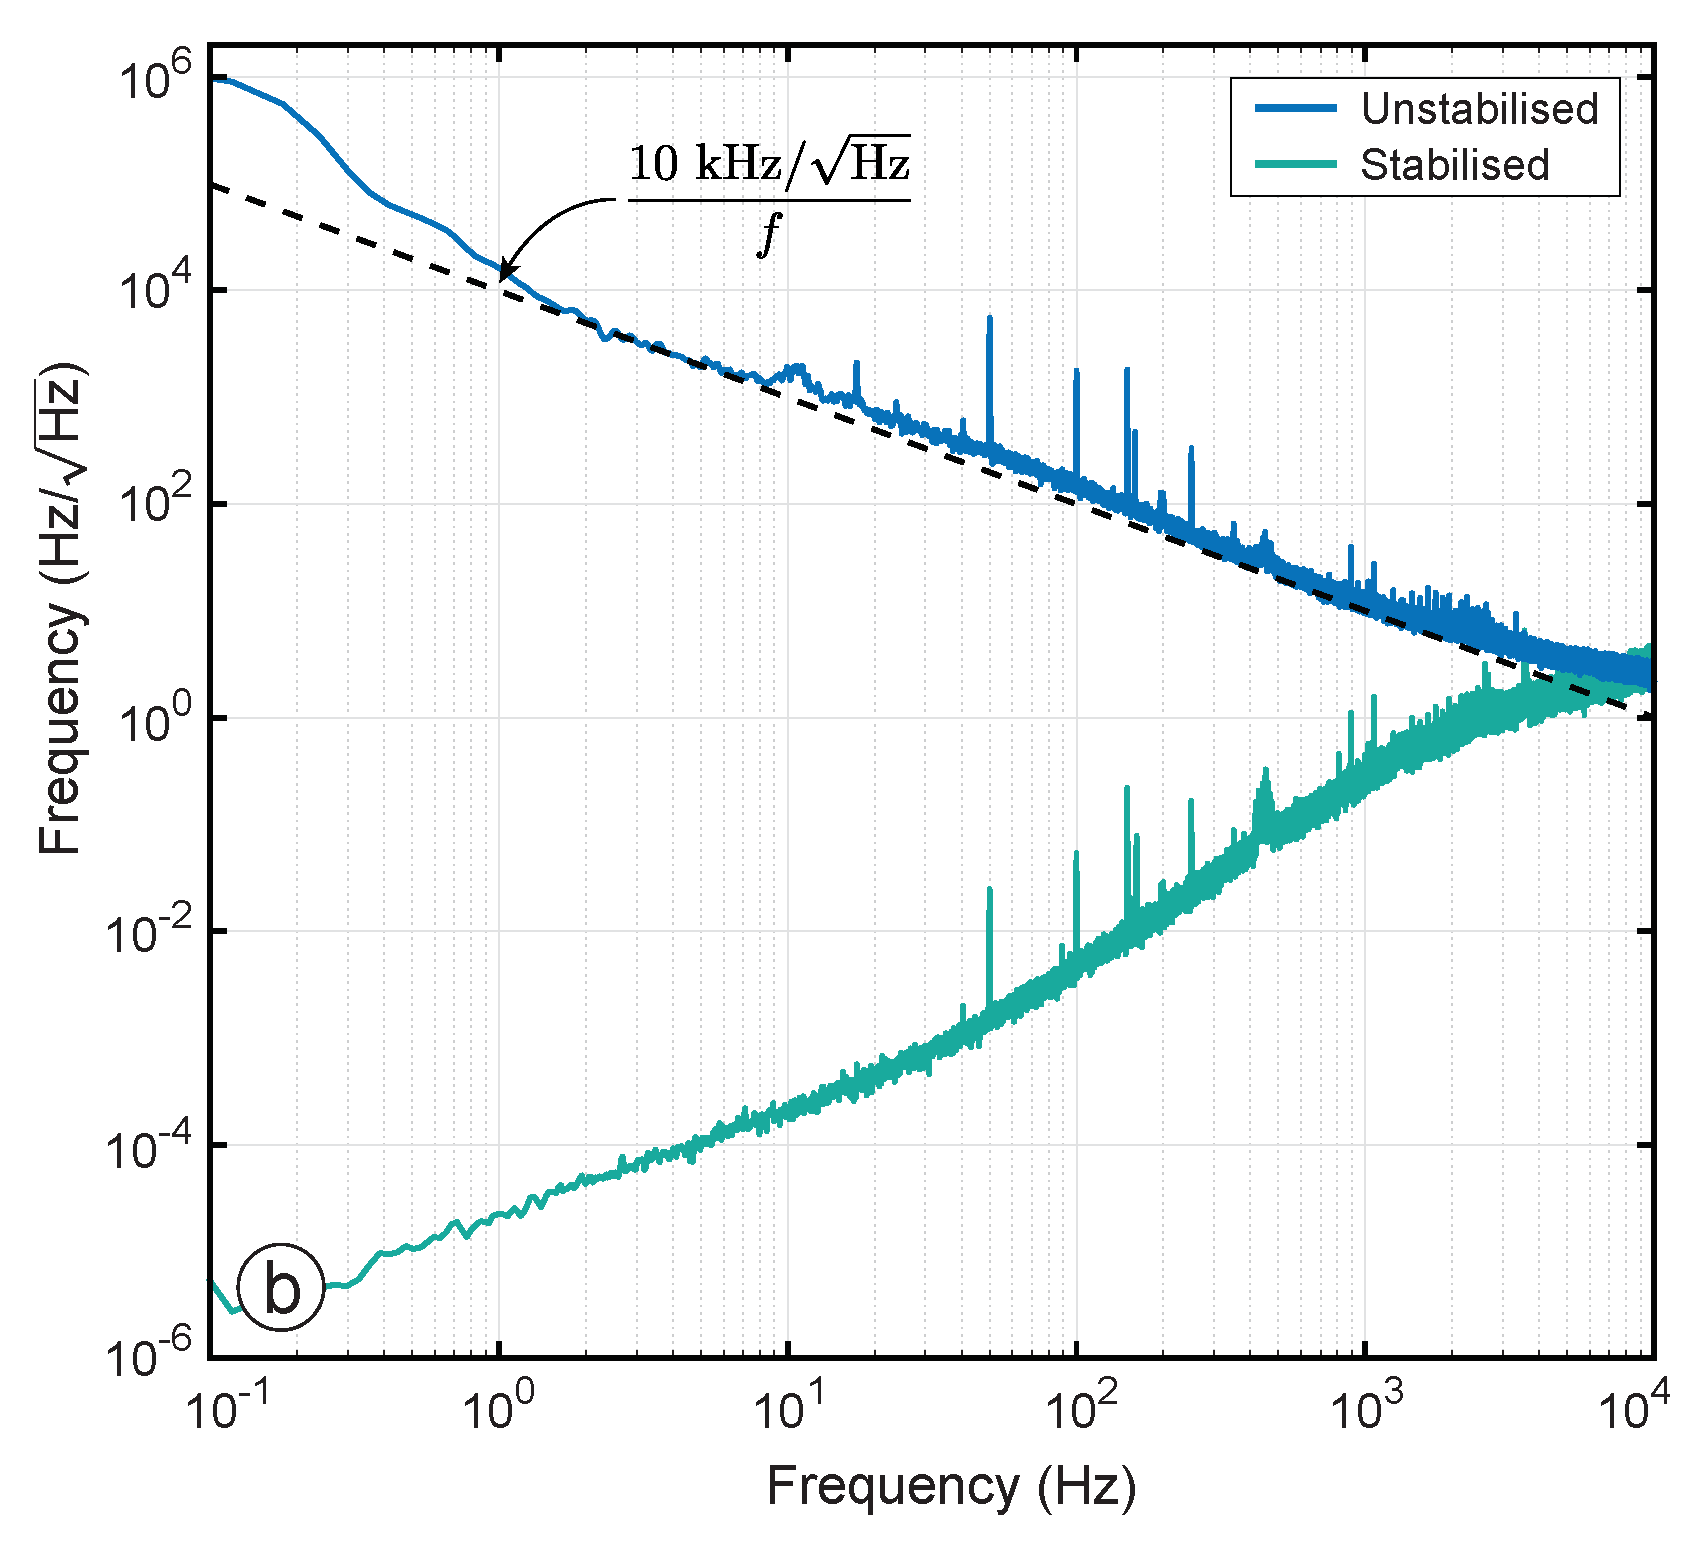
Frequency-offset phase locking was used to stabilize the relative laser frequency between the Mephisto NE2000 leader and Prometheus NE20 follower. The bandwidth of the controller was set to 10 kHz. The frequency error was recorded in-loop at the output of the phase-locked loop’s controller as shown in
Figure 7. Time series and root power spectral densities (RPSDs) of the measured free-running and stabilized relative laser frequency noise are shown in
Figure 11. The unstabilized frequency (blue) is consistent with each laser’s 10 kHz/
frequency noise specification. The stabilized laser frequency (green) demonstrates in-loop suppression of more than eight orders of magnitude at 1 Hz.
6.2. RMS Output Phase Stability
The frequency-offset phase-locked OPA’s RMS output phase stability was measured using the experimental setup shown in
Figure 5. By offsetting the relative frequencies of the follower lasers, it was possible to directly measure the phase of the heterodyne beat-note produced by their interference at an external photodetector. Whilst this measurement introduces a frequency difference between the emitters, it maintains the OPA’s output phase coherence. The measurement is performed out-of-loop to capture the true relative phase error between the two emitters, as neither the forward or return path photodetectors can provide this information. The follower lasers were set to 4, 8, and 10 MHz relative to the leader, producing heterodyne beat-notes at 2, 4, and 6 MHz at the out-of-loop photodetector.
The out-of-loop phase error
was initially measured without digitally enhanced heterodyne interferometry to provide a baseline from which to gauge the effect digitally enhanced heterodyne interferometry has on
. Without DEHI, signals were isolated at the return path photodetector by demodulating them at their beat-note frequency. The time series and root-power spectral density of
measured without DEHI are shown in
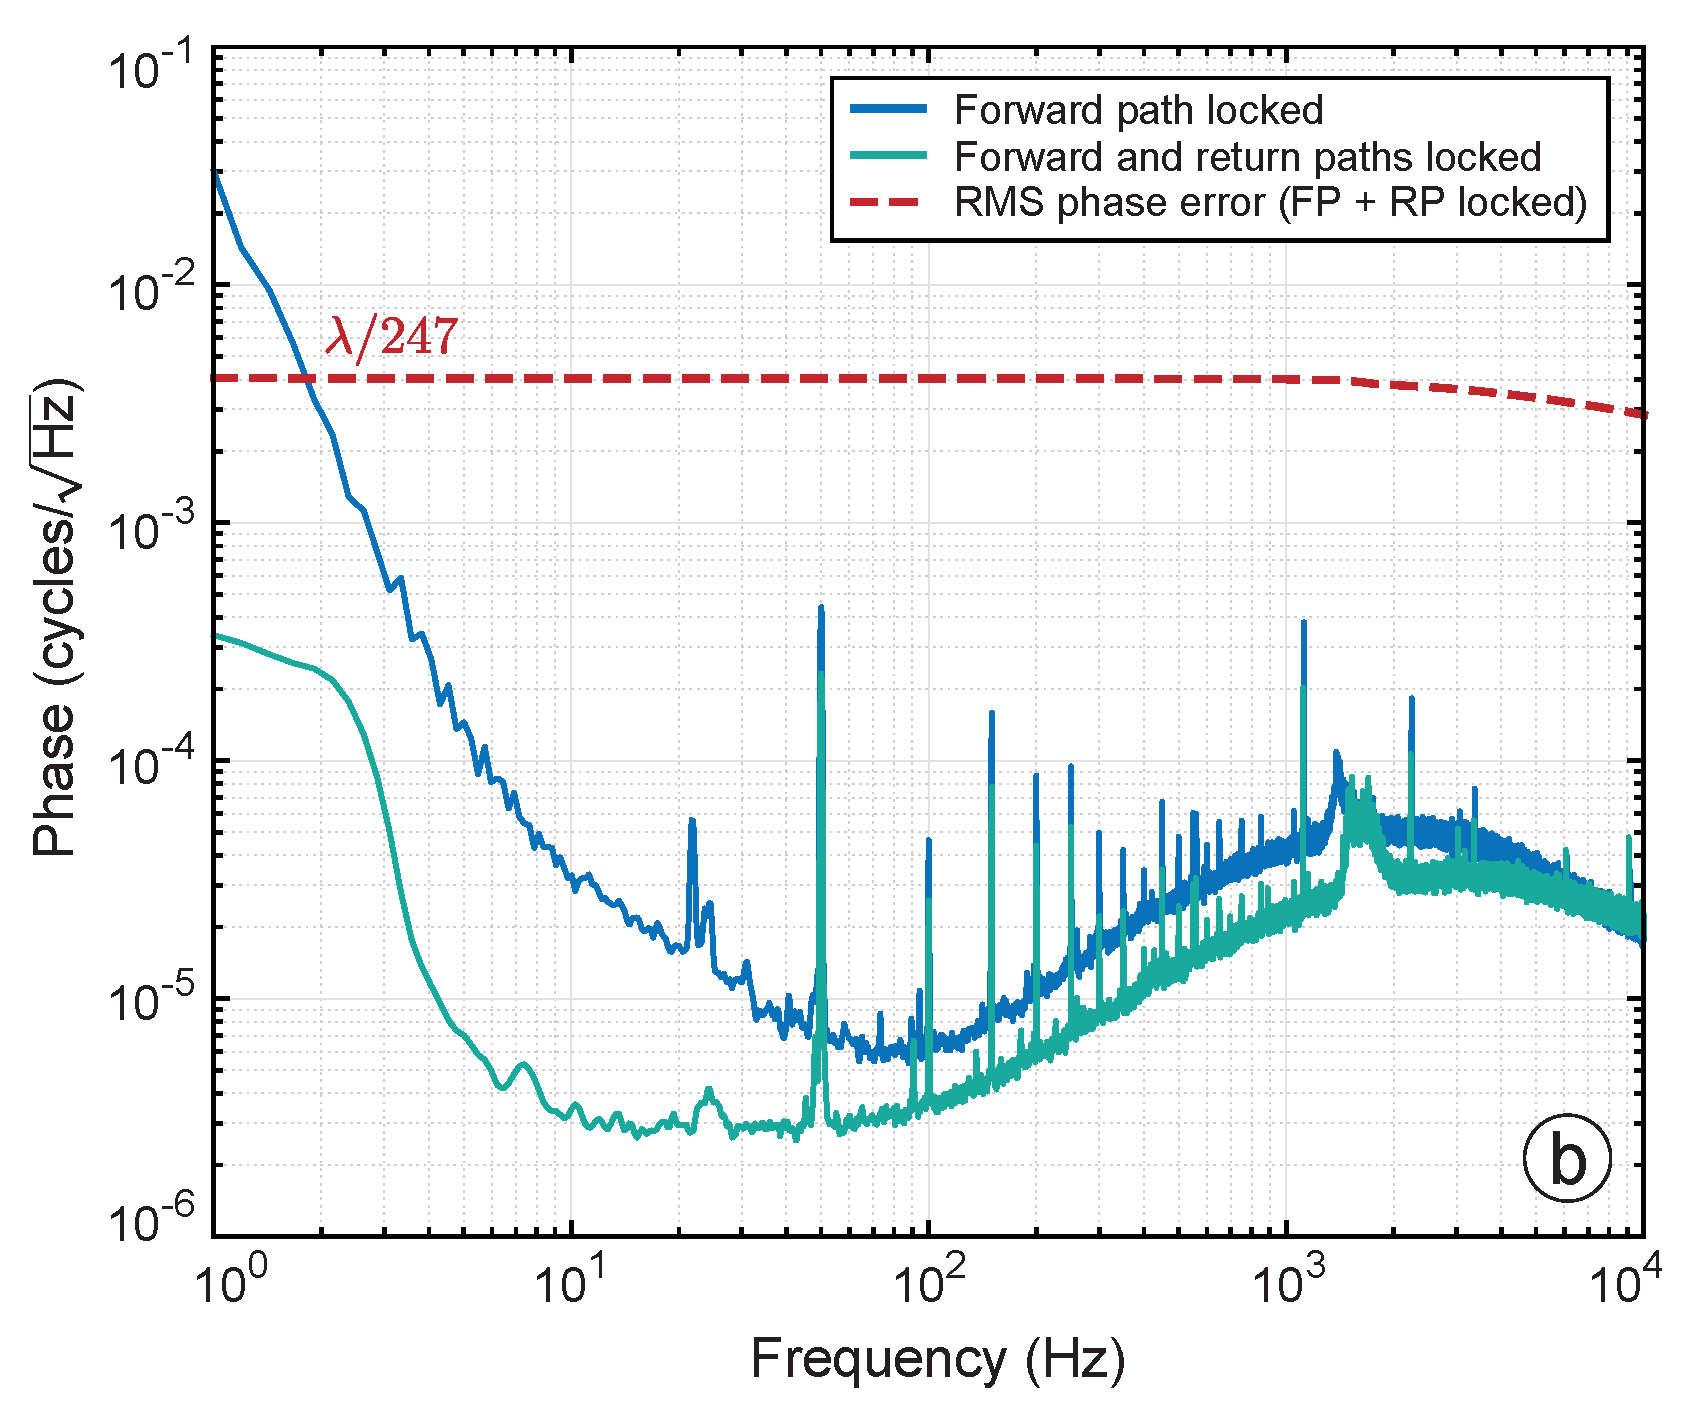
Figure 12. Results of the same measurement performed with DEHI using a 15-bit pseudo-random bit sequence are shown in
Figure 13. The out-of-loop phase was recorded at a rate of 32.250 kHz with second order cascaded integrator-comb anti-aliasing filters.
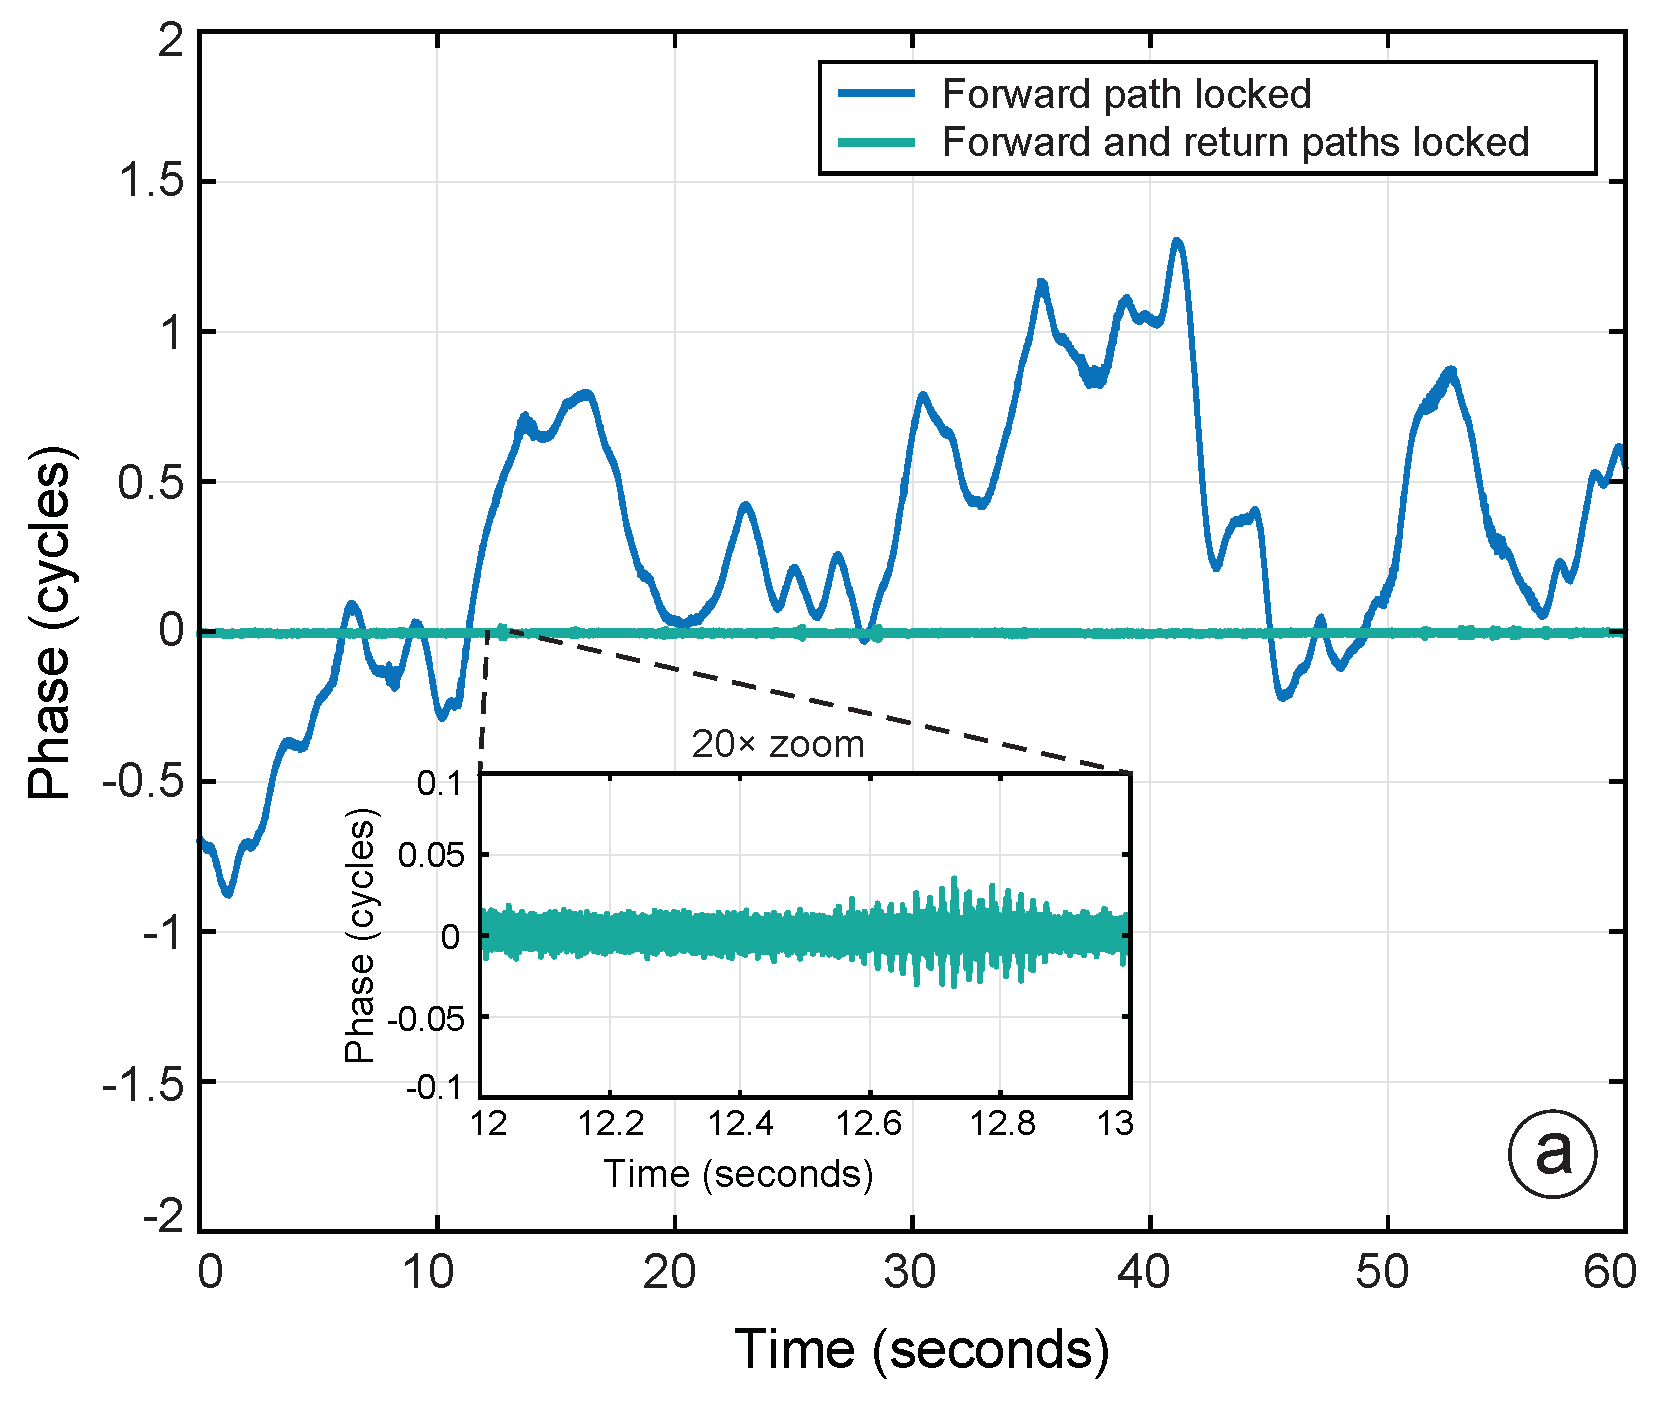
Two measurements are presented in each figure: (1) when the forward path phase error is locked (blue); and (2) when both the forward and return path phase errors are locked (green). The time series data when both controllers are locked has been shifted to appear at zero phase for clarity. None of the time-series data have been de-trended.
When the forward path controllers are locked (blue), the OPA’s output phase fluctuates randomly due to fiber noise (caused by random fluctuations in optical path length and refractive index within the glass fiber, visible below 10 Hz) and laser frequency noise (coupled by macroscopic optical path-length differences between the two emitters, visible between 10 and 100 Hz). The remaining uncontrolled lengths of fiber are stabilized when the return path controller is activated (as described in
Section 2.1).
The root power spectral density of the fully stabilized output phase error in
Figure 12b reveals the out-of-loop noise floor without digitally enhanced heterodyne interferometry. When DEHI is used, there is a dramatic increase in harmonic distortion visible in
Figure 13b caused by imperfect decoding of the 15-bit pseudo-random bit sequence. The distortion in
Figure 13b consists of harmonics separated by 1.221 kHz, equal to the code-repetition rate of the
element long pseudo-random bit sequence (40 MHz /
kHz). The controller’s attempt to suppress residual PRBS noise results in it being imposed onto the output phase of each emitter. The effects of residual PRBS noise may be mitigated in the future by selecting appropriate length sequences and demodulation filter parameters as described in Ref. [
23].
The RMS phase error for each measurement was calculated at a bandwidth of 15.625 kHz for a period of 1 second. The RMS phase error without DEHI was calculated to be , limited by the bandwidth of the offset phase lock controller. The RMS output phase error with DEHI using a 15-bit code was measured to be , limited by residual PRBS noise caused by imperfect decoding.
The ‘hill’ visible between 100 Hz and 10 kHz in each RPSD is the noise-floor of the optical phase-locked loop’s controller. The noise shelf present in
Figure 12b below 6 Hz is typical of cyclic phase noise caused by parasitic interference at one of the photodetectors, which could have been caused by scattered light, a partial reflection, or interference in an orthogonal polarisation. The reduced amplitude of the noise shelf in
Figure 12b suggests partial suppression by the 15-bit PRBS, consistent with cyclic phase noise caused by a low amplitude reflection in optical fiber that was suppressed by digitally enhanced heterodyne interferometry. Cyclic noise did not appear to degrade the RMS output phase error, which was instead limited by residual PRBS noise at higher frequencies.
6.3. Intensity Scaling and Fringe Visibility
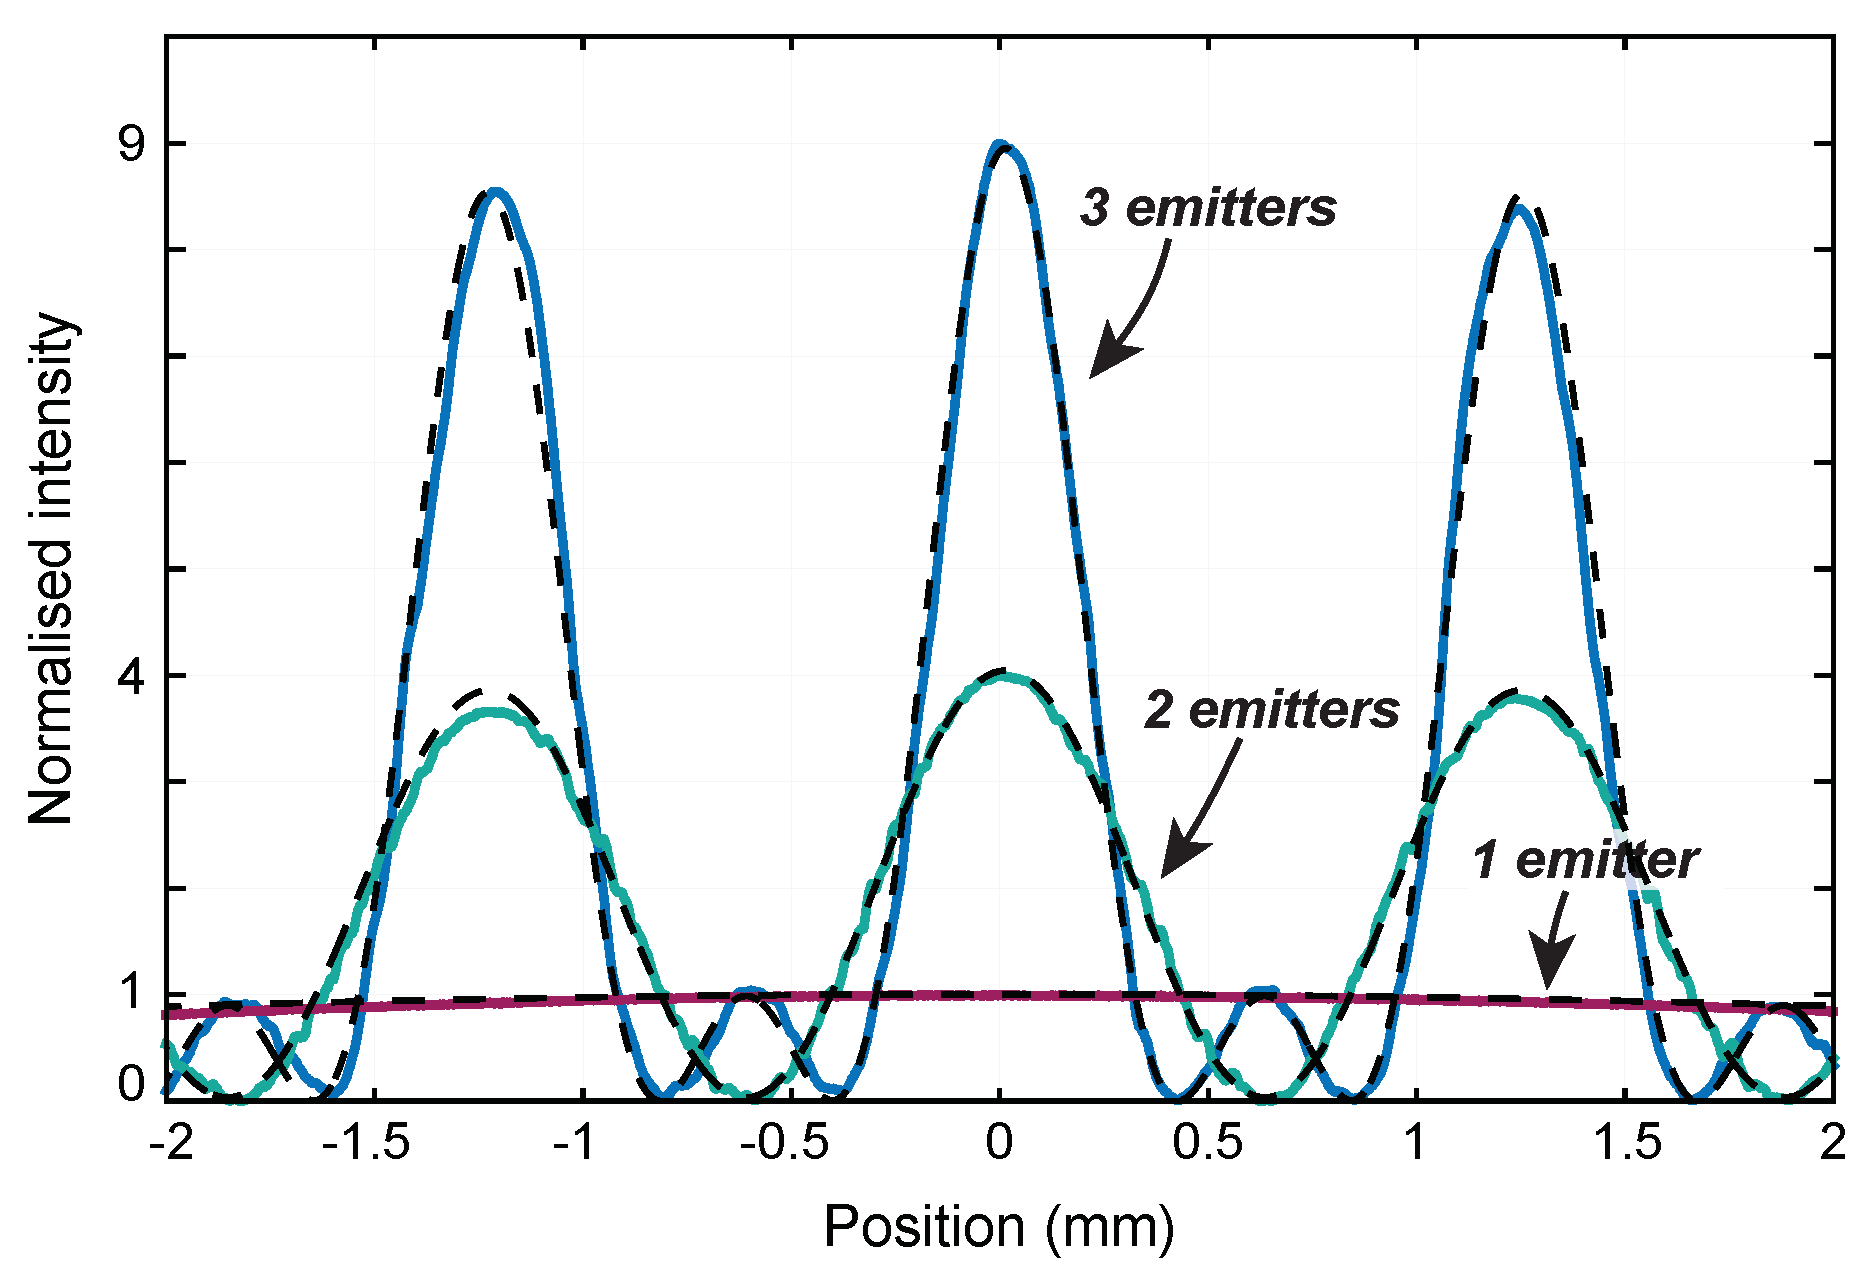
The 1D far field intensity of the offset phase-locked OPA was measured using a beam-profiler for one, two, and three emitter configurations at a distance of 30 ± 0.5 cm. The measured and simulated intensities are shown in
Figure 14, normalised to the average peak intensity of a single emitter. The simulation assumed a fiber separation of 250
m, equal emitter power, and a projection range of 30 cm.
The peak intensities of the central interference lobes in
Figure 14 scale quadratically with the number of emitters. Fringe visibility was calculated to be 100% and 99.5% for two and three emitter configurations respectively, indicating strong far field coherence consistent with an output RMS phase stability of
. The measured results agree well with simulation presented as dashed lines. Reference [
23] suggests that the high far-field coherence demonstrated here could be maintained for potentially hundreds of emitters using a digitally enhanced heterodyne interferometry sensing scheme.
The position of the central interference lobe can be steered in the far-field by controlling the phase of individual emitters in the array as described in Ref. [
25].
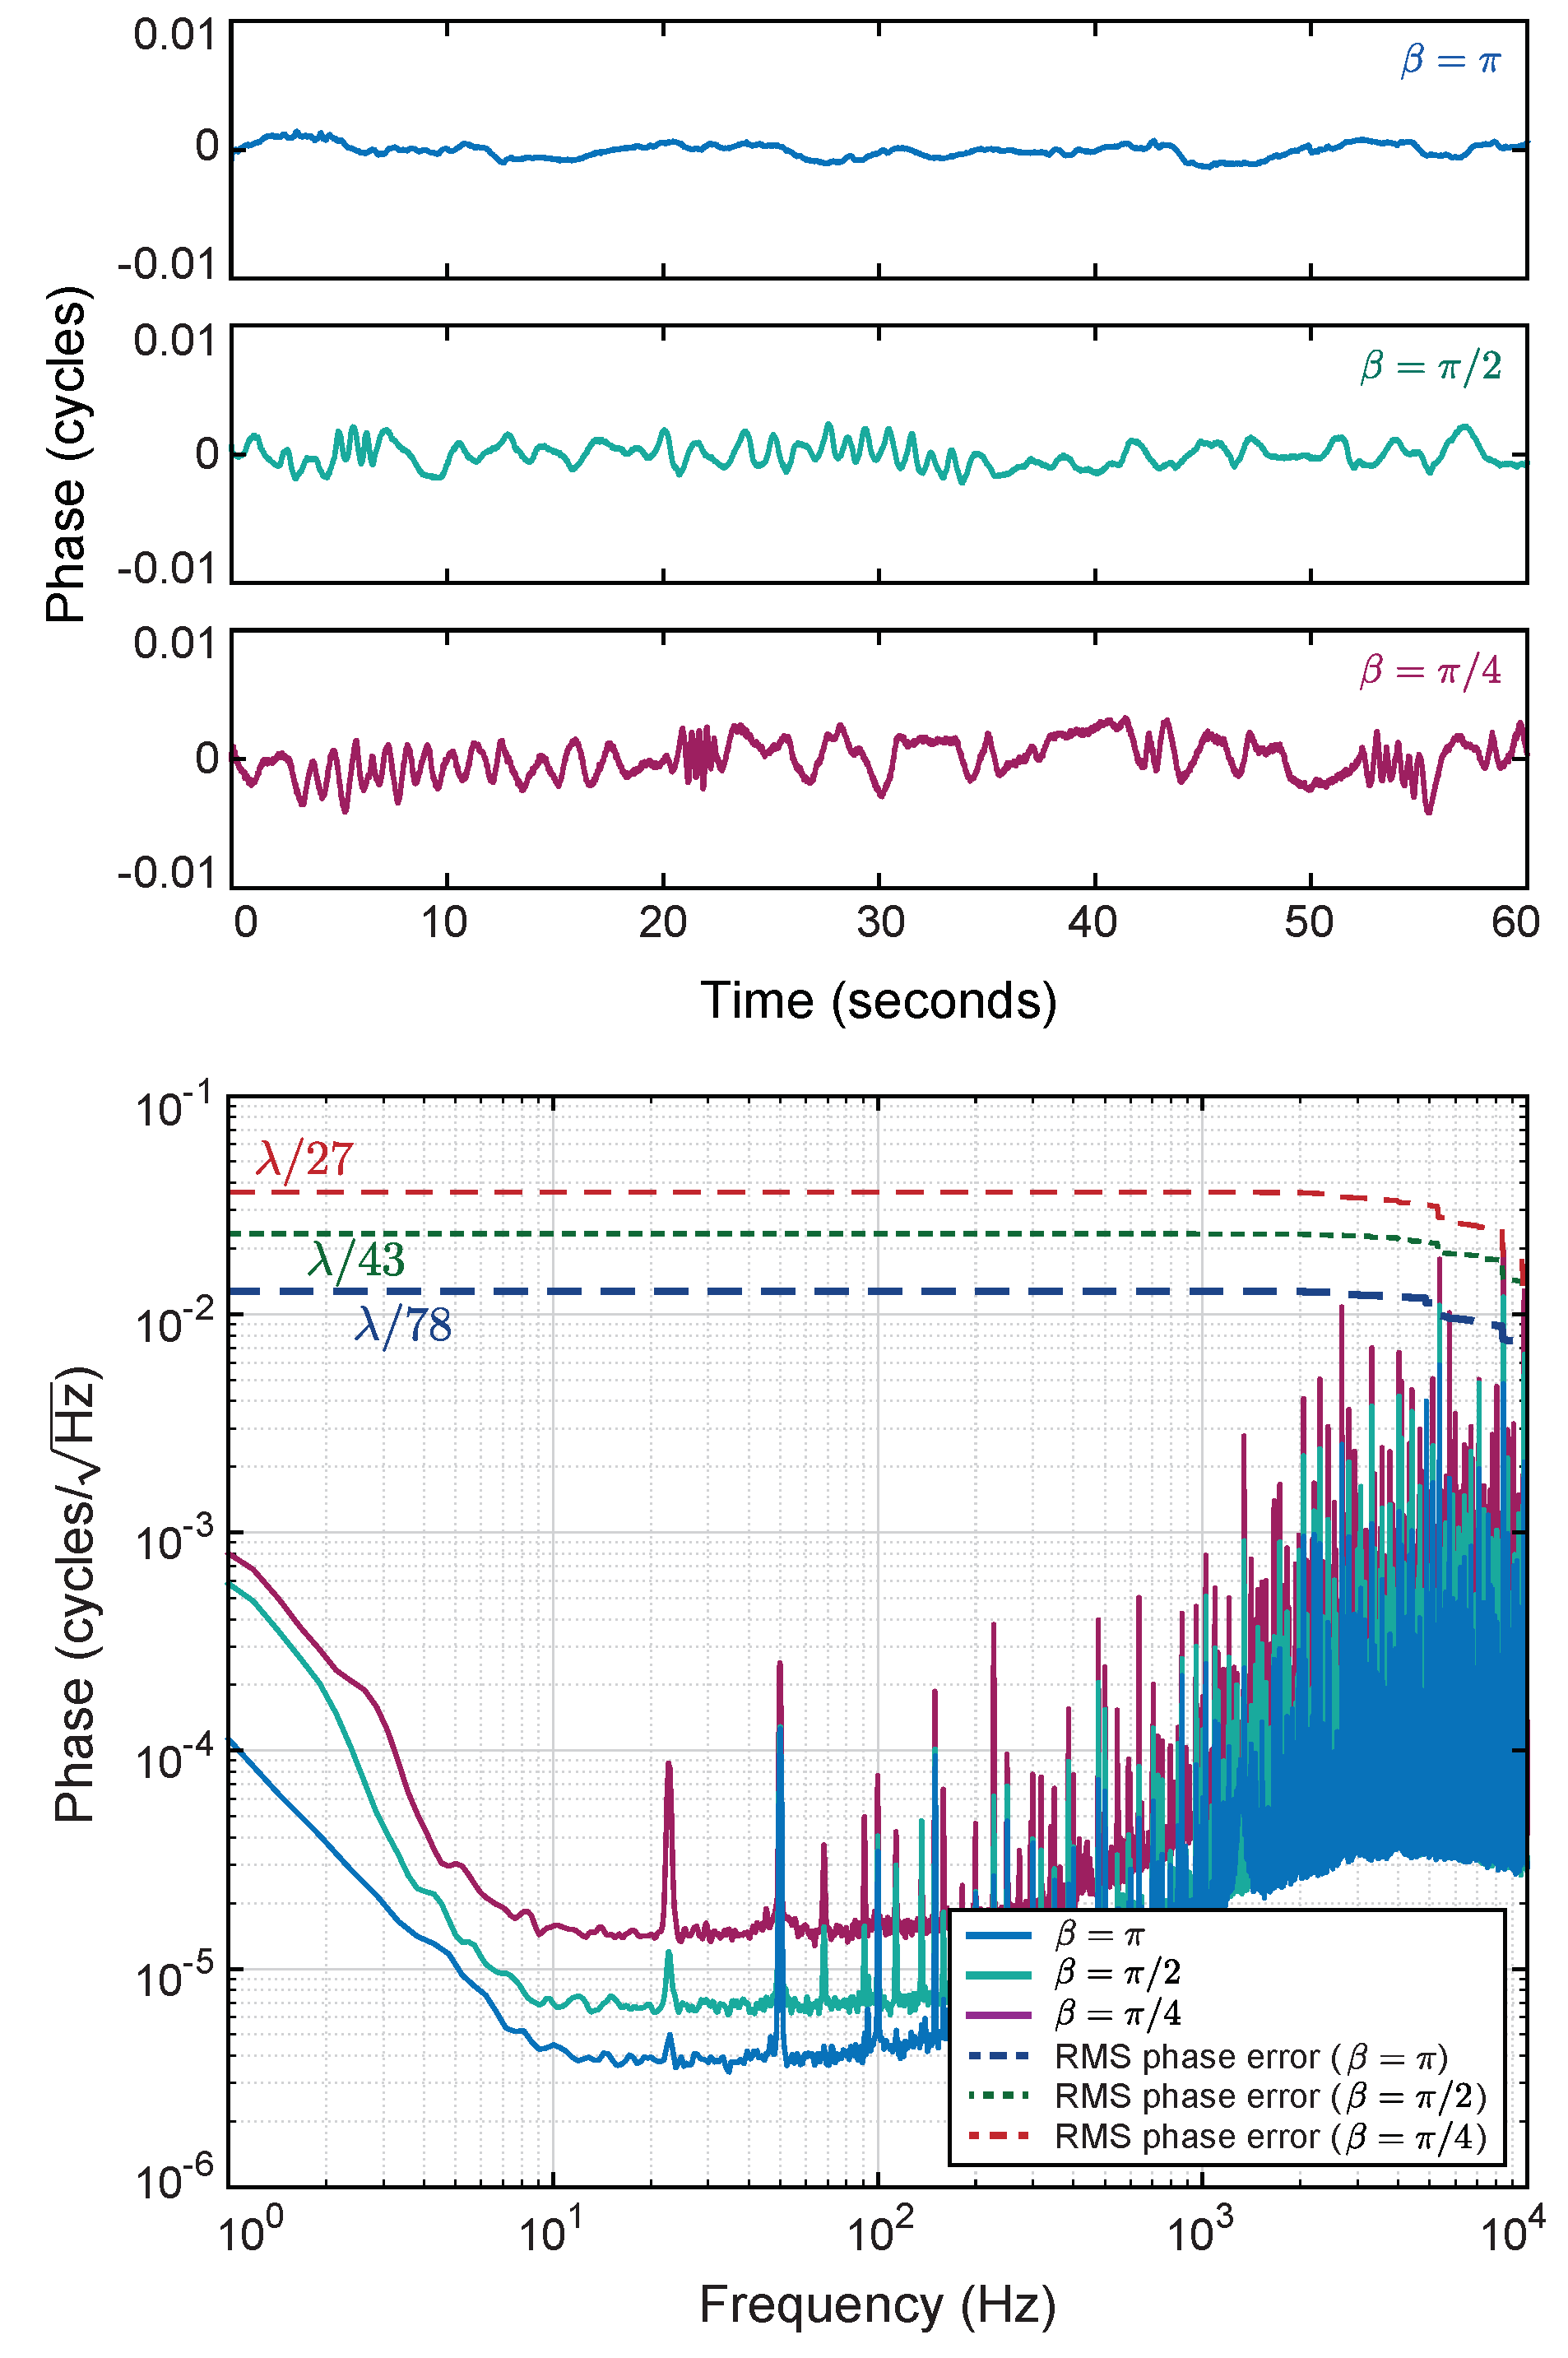
6.4. Effect of PRBS Modulation Depth on Output Phase Stability
An advantage of the offset phase-locked OPA architecture over the proof-of-concept presented in Ref. [
19] is that it enables DEHI to be implemented at the optimal
modulation depth without de-cohering the interfered beam in the far field. In fact, operating the OPA at modulation depths other than
degrades performance by introducing more residual PRBS noise into the control system due to imperfect decoding. This effect was demonstrated experimentally by recording the out-of-loop phase error for modulations depths
,
, and
. The results are shown in
Figure 15.
The time series data for each measurement have been low-pass filtered to reveal underlying cyclic phase noise that increases in magnitude with increasing modulation depth. This observation supports the suggestion that the noise-shelf below 10 Hz is due to cyclic phase noise caused by parasitic interference somewhere in the interferometer. DEHI’s suppression of inter-channel cross-talk diminishes with decreasing modulation depth, which explains why the amplitude of the cyclic phase noise increases when and .
The RPSDs in
Figure 15 reveal an increasing white noise-floor (between 10 and 100 Hz), as well as a significant increase in harmonic distortion (visible above 1 kHz) as modulation depth decreases. Both of these effects are caused by imperfect decoding which reduces signal-to-noise ratio and introduces higher amplitude residual PRBS noise into the control system. It is therefore important that the PRBS modulation depth be set as close to
as practically possible in order to maximise
, which degrades to
when
.
7. Conclusions
We have presented a technique for coherently combining multiple free-running follower lasers based on frequency-offset phase locking. Digitally enhanced heterodyne interferometry was used to discriminate individual reflections interfering at a single photodetector in digital signal processing. High-dynamic range phase-locked loops were used to measure the phase of each emitter’s Fresnel reflection, allowing the system to function without the need for external sampling optics. The technique was demonstrated experimentally using a tiled-aperture optical phased array, in which the RMS output phase stability was measured to be over a 16.125 kHz bandwidth. Fringe visibility of the far field interference pattern was measured to be 100% and 99.5% for two and three emitter configurations respectively, indicating extremely high coherence in the far field. Recent advances in digitally enhanced heterodyne interferometry suggest that this high level of far-field coherence could be maintained for large scale optical phased arrays with potentially hundreds of emitters.
Author Contributions
Conceptualization, L.E.R., R.L.W., D.A.S. and C.S.; methodology, L.E.R., R.L.W. and D.A.S.; software, L.E.R.; validation, L.E.R. and R.L.W.; formal analysis, L.E.R. and R.L.W.; investigation, L.E.R. and R.L.W.; resources, D.A.S. and C.S.; writing—original draft preparation, L.E.R.; writing—review and editing, L.E.R., R.L.W. and D.A.S.; supervision, R.L.W and D.A.S.; project administration, D.A.S. and C.S.; funding acquisition, D.A.S. and C.S. All authors have read and agreed to the published version of the manuscript.
Funding
This research was funded by Australian Research Council Linkage Project 130101138.
Acknowledgments
This research was supported by the Cooperative Research Centre for Space Environment Management (SERC Limited) through the Australian Government’s Cooperative Research Centre Programme.
Conflicts of Interest
The authors declare no conflict of interest.
Data Availability
The data that support the findings of this study are available from the corresponding author upon reasonable request.
References
- McNaught, S.J.; Asman, C.P.; Injeyan, H.; Jankevics, A.; Johnson, A.M.; Jones, G.C.; Komine, H.; Machan, J.; Marmo, J.; McClellan, M.; et al. 100-kW Coherently Combined Nd:YAG MOPA Laser Array. In Proceedings of the Frontiers in Optics 2009/Laser Science XXV/Fall 2009 OSA Optics & Photonics Technical Digest, Baltimore, MA, USA, 31 May–5 June 2009; p. FThD2. [Google Scholar] [CrossRef]
- Poulton, C.V.; Yaacobi, A.; Cole, D.B.; Byrd, M.J.; Raval, M.; Vermeulen, D.; Watts, M.R. Coherent solid-state LIDAR with silicon photonic optical phased arrays. Opt. Lett. 2017, 42, 4091–4094. [Google Scholar] [CrossRef]
- Weyrauch, T.; Vorontsov, M.; Mangano, J.; Ovchinnikov, V.; Bricker, D.; Polnau, E.; Rostov, A. Deep turbulence effects mitigation with coherent combining of 21 laser beams over 7 km. Opt. Lett. 2016, 41, 840–843. [Google Scholar] [CrossRef]
- Cao, J.; Zhao, X.; Liu, W.; Gu, H. Performance analysis of a coherent free space optical communication system based on experiment. Opt. Express 2017, 25, 15299–15312. [Google Scholar] [CrossRef]
- Abich, K.; Abramovici, A.; Amparan, B.; Baatzsch, A.; Okihiro, B.B.; Barr, D.C.; Bize, M.P.; Bogan, C.; Braxmaier, C.; Burke, M.J.; et al. In-Orbit Performance of the GRACE Follow-on Laser Ranging Interferometer. Phys. Rev. Lett. 2019, 123, 031101. [Google Scholar] [CrossRef] [PubMed] [Green Version]
- Shekel, E.; Vidne, Y.; Urbach, B. 16 kW single mode CW laser with dynamic beam for material processing. In Proceedings of the Fiber Lasers XVII: Technology and Systems, San Francisco, CA, USA, 3–6 February 2020; International Society for Optics and Photonics. Dong, L., Ed.; SPIE: Bellingham, WA, USA, 2020; Volume 11260, pp. 267–272. [Google Scholar] [CrossRef]
- Shay, T.M. Theory of electronically phased coherent beam combination without a reference beam. Opt. Express 2006, 14, 12188–12195. [Google Scholar] [CrossRef] [PubMed]
- Shay, T.M.; Benham, V.; Baker, J.T.; Ward, B.; Sanchez, A.D.; Culpepper, M.A.; Pilkington, D.; Spring, J.; Nelson, D.J.; Lu, C.A. First experimental demonstration of self-synchronous phase locking of an optical array. Opt. Express 2006, 14, 12015–12021. [Google Scholar] [CrossRef] [PubMed]
- Ma, P.; Zhou, P.; Su, R.; Ma, Y.X.; Liu, Z. Coherent polarization beam combining of eight fiber lasers using single-frequency dithering technique. Laser Phys. Lett. 2012, 9, 456–458. [Google Scholar] [CrossRef] [Green Version]
- Flores, A.; Dajani, I.; Naderi, N.; Anderson, B.; Ehrenreich, T.; Holten, R.; Rowland, K.; Sanchez, A. Coherent Beam Combining and Nonlinear Suppression of Multi-Kilowatt All-Fiber Amplifiers. In Proceedings of the Frontiers in Optics 2016, Rochester, NY, USA, 17–21 October 2016; Optical Society of America: Washington, DC, USA, 2016; p. 5. [Google Scholar] [CrossRef]
- Yu, C.X.; Augst, S.J.; Redmond, S.M.; Goldizen, K.C.; Murphy, D.V.; Sanchez, A.; Fan, T.Y. Coherent combining of a 4 kW, eight-element fiber amplifier array. Opt. Lett. 2011, 36, 2686–2688. [Google Scholar] [CrossRef]
- Oermann, M.R.; Carmody, N.; Hemming, A.; Rees, S.; Simakov, N.; Swain, R.; Boyd, K.; Davidson, A.; Corena, L.; Stepanov, D.; et al. Coherent beam combination of four holmium amplifiers with phase control via a direct digital synthesizer chip. Opt. Express 2018, 26, 6715–6723. [Google Scholar] [CrossRef]
- Augst, S.J.; Fan, T.Y.; Sanchez, A. Coherent beam combining and phase noise measurements of ytterbium fiber amplifiers. Opt. Lett. 2004, 29, 474–476. [Google Scholar] [CrossRef]
- Satyan, N.; Liang, W.; Kewitsch, A.; Rakuljic, G.; Yariv, A. Coherent Power Combination of Semiconductor Lasers Using Optical Phase-Lock Loops. IEEE J. Sel. Top. Quantum Electron. 2009, 15, 240–247. [Google Scholar] [CrossRef] [Green Version]
- Goodno, G.D.; McNaught, S.J.; Rothenberg, J.E.; McComb, T.S.; Thielen, P.A.; Wickham, M.G.; Weber, M.E. Active phase and polarization locking of a 1.4 kW fiber amplifier. Opt. Lett. 2010, 35, 1542–1544. [Google Scholar] [CrossRef] [PubMed]
- Kabeya, D.; Kermene, V.; Fabert, M.; Benoist, J.; Desfarges-Berthelemot, A.; Barthelemy, A. Active coherent combining of laser beam arrays by means of phase-intensity mapping in an optimization loop. Opt. Express 2015, 23, 31059–31068. [Google Scholar] [CrossRef] [PubMed]
- Kabeya, D.; Kermène, V.; Fabert, M.; Benoist, J.; Saucourt, J.; Desfarges-Berthelemot, A.; Barthélémy, A. Efficient phase-locking of 37 fiber amplifiers by phase-intensity mapping in an optimization loop. Opt. Express 2017, 25, 13816–13821. [Google Scholar] [CrossRef] [PubMed]
- Roberts, L.E.; Ward, R.L.; Francis, S.P.; Sibley, P.G.; Fleddermann, R.; Sutton, A.J.; Smith, C.; McClelland, D.E.; Shaddock, D.A. High power compatible internally sensed optical phased array. Opt. Express 2016, 24, 13467–13479. [Google Scholar] [CrossRef] [PubMed]
- Roberts, L.E.; Ward, R.L.; Sutton, A.J.; Fleddermann, R.; de Vine, G.; Malikides, E.A.; Wuchenich, D.M.R.; McClelland, D.E.; Shaddock, D.A. Coherent beam combining using a 2D internally sensed optical phased array. Appl. Opt. 2014, 53, 4881–4885. [Google Scholar] [CrossRef]
- Roberts, L.E. Internally Sensed Optical Phased Arrays. Ph.D. Thesis, Research School of Physics and Engineering, The Australian National University, Canberra, ACT, Australian, 2016. [Google Scholar]
- Bowman, D.J.; King, M.J.; Sutton, A.J.; Wuchenich, D.M.; Ward, R.L.; Malikides, E.A.; McClelland, D.E.; Shaddock, D.A. Internally sensed optical phased array. Opt. Lett. 2013, 38, 1137–1139. [Google Scholar] [CrossRef]
- Shaddock, D.A. Digitally enhanced heterodyne interferometry. Opt. Lett. 2007, 32, 3355–3357. [Google Scholar] [CrossRef]
- Sibley, P.G.; Ward, R.L.; Roberts, L.E.; Francis, S.P.; Shaddock, D.A. Crosstalk reduction for multi-channel optical phase metrology. Opt. Express 2020, 28, 10400–10424. [Google Scholar] [CrossRef]
- Shaddock, D.; Ware, B.; Halverson, P.G.; Spero, R.E.; Klipstein, B. Overview of the LISA Phasemeter. AIP Conf. Proc. 2006, 873, 654–660. [Google Scholar] [CrossRef] [Green Version]
- Gozzard, D.R.; Roberts, L.E.; Spollard, J.T.; Sibley, P.G.; Shaddock, D.A. Fast beam steering with an optical phased array. Opt. Lett. 2020, 45, 3793–3796. [Google Scholar] [CrossRef] [PubMed]
Figure 1.
Idealized frequency-offset phase locked optical phased array using digitally enhanced interferometry and internal sensing. Three emitters are shown for clarity. The use of digitally enhanced interferometry enables this technique to support an arbitrarily large number of emitters.
Figure 1.
Idealized frequency-offset phase locked optical phased array using digitally enhanced interferometry and internal sensing. Three emitters are shown for clarity. The use of digitally enhanced interferometry enables this technique to support an arbitrarily large number of emitters.
Figure 2.
Forward path phase contributions from each unique length of fiber in the optical system. For clarity, only two fibers are shown.
Figure 2.
Forward path phase contributions from each unique length of fiber in the optical system. For clarity, only two fibers are shown.
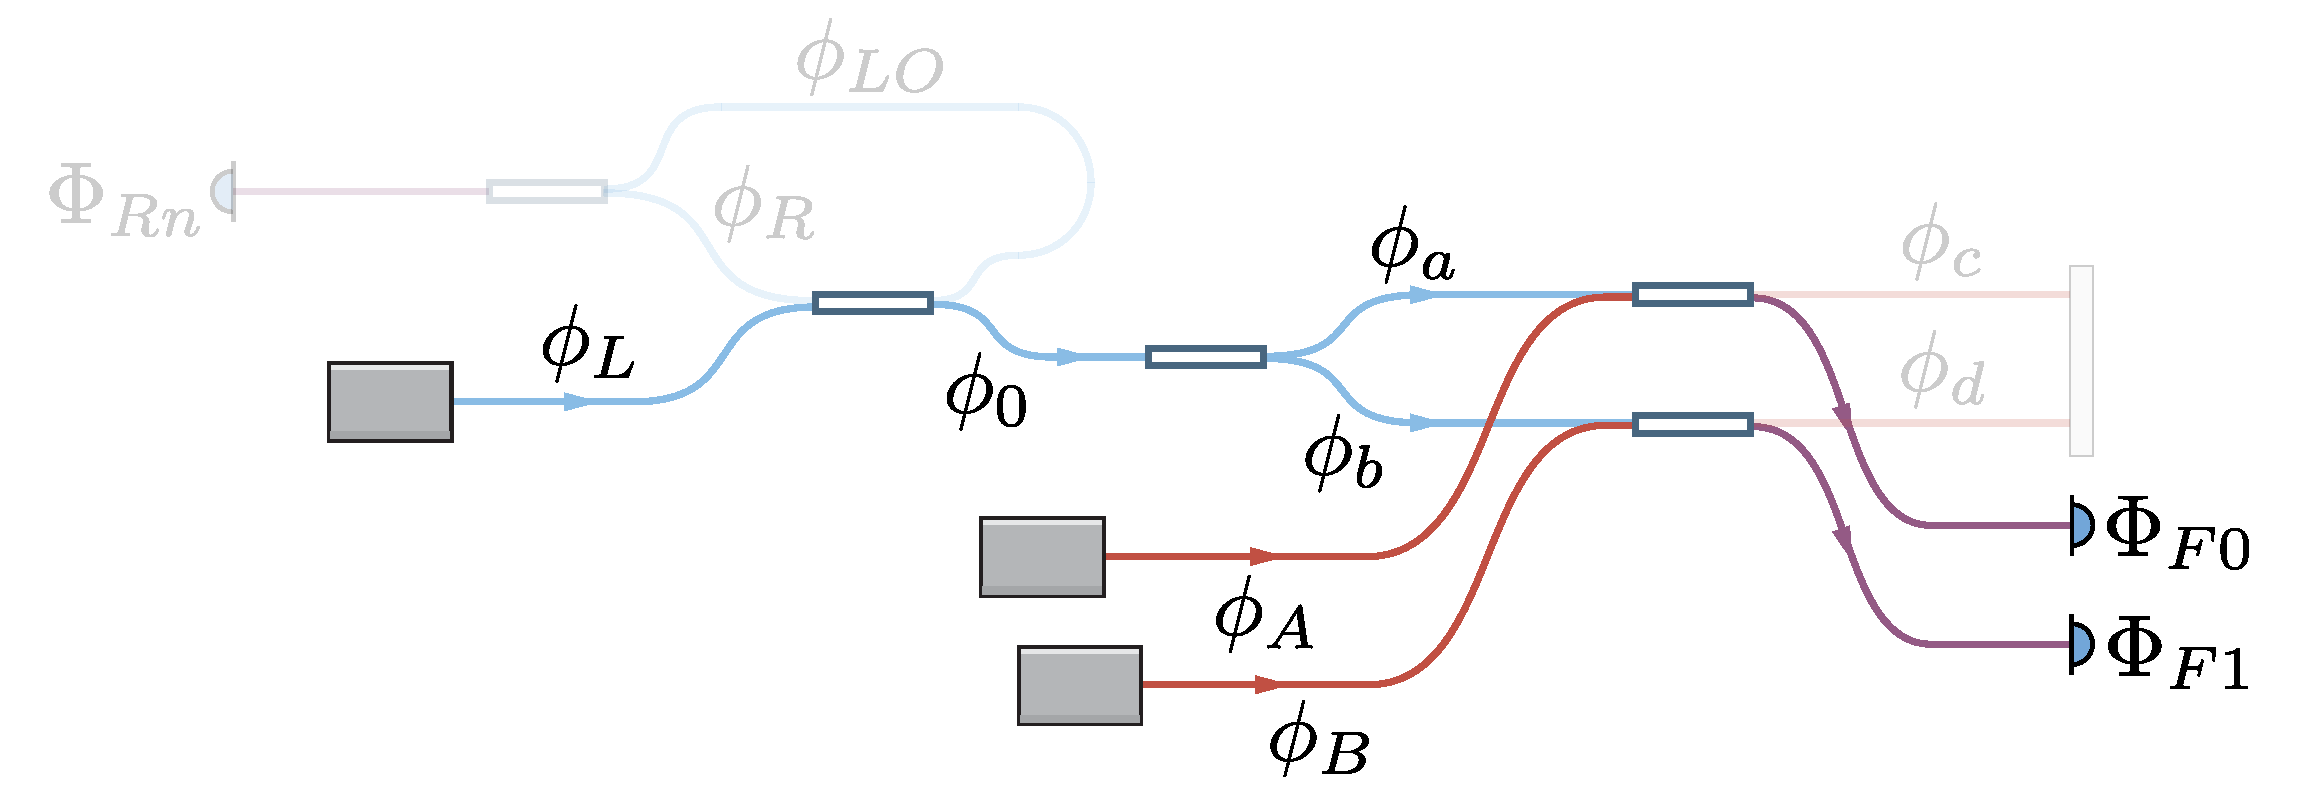
Figure 3.
Return path phase contributions from each unique length of fiber in the optical system. For clarity, only two fibers are shown.
Figure 3.
Return path phase contributions from each unique length of fiber in the optical system. For clarity, only two fibers are shown.
Figure 4.
Illustration of the optical and FPGA implemented digital signal processing systems used to offset phase-lock two lasers.
Figure 4.
Illustration of the optical and FPGA implemented digital signal processing systems used to offset phase-lock two lasers.
Figure 5.
Experimental configuration of the optical system used to characterize the offset phase-locked OPA.
Figure 5.
Experimental configuration of the optical system used to characterize the offset phase-locked OPA.
Figure 6.
Digital signal processing architecture for the offset phase-locked OPA showing the shared allocation of DSP resources between two FPGAs. The FPGAs’ clocks are phase-locked to a common 10 MHz reference. Data are transferred from one FPGA to the other via shared memory administered by a real-time (RT) computer.
Figure 7.
Modified phase-locked loop used to calculate phase error with respect to a desired offset frequency, .
Figure 7.
Modified phase-locked loop used to calculate phase error with respect to a desired offset frequency, .
Figure 8.
Linear transfer function model of the offset phase-locked OPA’s control system.
Figure 8.
Linear transfer function model of the offset phase-locked OPA’s control system.
Figure 9.
Experimental setup used to measure the open-loop gain of the offset phase-locked OPA’s control system.
Figure 9.
Experimental setup used to measure the open-loop gain of the offset phase-locked OPA’s control system.
Figure 10.
Measured (solid) and simulated (dashed) open-loop gain of the offset phase-locked OPA’s control system for high and low gains.
Figure 10.
Measured (solid) and simulated (dashed) open-loop gain of the offset phase-locked OPA’s control system for high and low gains.
Figure 11.
Free-running (unstabilized) and stabilized laser frequency measured in-loop. The controller stabilizes laser frequency noise at a bandwidth of up to approximately 10 kHz as expected.
Figure 11.
Free-running (unstabilized) and stabilized laser frequency measured in-loop. The controller stabilizes laser frequency noise at a bandwidth of up to approximately 10 kHz as expected.
Figure 12.
(a) Time series measurements of when the OPA is forward path locked (blue), and fully locked (green) without DEHI. The inset shows the zoomed-in behaviour of when fully locked. (b) RPSD of the measurements shown in (a); the noise-shelf at frequencies below 10 Hz is typical of cyclic phase noise introduced by parasitic interference somewhere in the optical system. The RMS phase error was calculated to be at 1 Hz, limited by noise at frequencies beyond 1 kHz.
Figure 13.
(a) Time series measurements of when the OPA is forward path-locked (blue), and fully locked (green) using DEHI with a 15-bit PRBS. The inset shows the zoomed-in behaviour of when fully locked. (b) RPSD of the measurements shown in (a). The harmonic distortion visible in (b) is caused by residual PRBS noise introduced by the decoder. The RMS phase error was calculated to be at 1 Hz, limited by harmonic distortion introduced by imperfect decoding of the 15-bit PRBS.
Figure 14.
Measured (solid) and simulated (dashed) far field interference profiles for one, two, and three emitter configurations. The beam profiler was located 30 ± 0.5 cm from the OPA.
Figure 14.
Measured (solid) and simulated (dashed) far field interference profiles for one, two, and three emitter configurations. The beam profiler was located 30 ± 0.5 cm from the OPA.
Figure 15.
Time-series’ and RPSDs of the OPA’s measured output phase for different PRBS modulation depths. The time measurements shown in the upper panel have been low-pass filtered to reveal the underlying cyclic phase noise.
Figure 15.
Time-series’ and RPSDs of the OPA’s measured output phase for different PRBS modulation depths. The time measurements shown in the upper panel have been low-pass filtered to reveal the underlying cyclic phase noise.
| Publisher’s Note: MDPI stays neutral with regard to jurisdictional claims in published maps and institutional affiliations. |
© 2020 by the authors. Licensee MDPI, Basel, Switzerland. This article is an open access article distributed under the terms and conditions of the Creative Commons Attribution (CC BY) license (http://creativecommons.org/licenses/by/4.0/).


