1. Introduction
Mid-IR (MIR) absorption spectroscopy is an extremely effective tool for detection of molecular trace gases [
1,
2,
3]. It is well appreciated that the MIR spectral wavelength range stretching from 3 µm to 10 µm contains a wealth of strong fundamental vibrational absorption bands of different molecular gases, and therefore is suitable for trace gas sensing applications, such as environmental monitoring, biomedical diagnostics, and control of toxic industrial chemicals [
4]. For example, the detection of gases, such as CH
4, CO
2, NO
2, SO
2, and NH
3, at the level of parts per billion (ppb) plays an essential role in environmental and agricultural monitoring.
Ammonia is the third most abundant nitrogen-containing compound in the atmosphere, playing an essential role in the nitrogen cycle [
5]. It is mostly used in agricultural activities to manufacture fertilizers such as ammonium phosphate, ammonium nitrate, and ammonium sulphate. Ammonia is also used for the synthesis of many pharmaceuticals and commercial cleaning products. Besides pollution effects, ammonia can cause health hazards with brief exposure to concentrations greater than 1500 parts per million (ppm) [
6]. The typical concentration of ammonia in atmosphere or in human exhaled breath is in the range from parts per billion to part per trillion by volume. Therefore, there is a need for sensitive detection of ammonia in the atmosphere and monitoring its levels for environmental and medical purposes. In the MIR region, the earliest and recent investigations on NH
3 were mostly focused in the study of the rotational-vibrational transition bands in the wavelength range of 1.5 µm to 3 µm by using high-resolution spectroscopic analysis techniques [
7,
8,
9,
10,
11,
12]. More recently, the highly sensitive detection of part per billion of the ν2 fundamental vibrational band of NH
3 around 10.3 µm was reported [
13,
14,
15,
16,
17]. Although the absorption lines of NH
3 are very strong in the wavelength region centered at 10 µm, this region is affected substantially by the interference of CO
2 absorption lines. Therefore, there is a need to explore another wavelength region over which the absorption lines of NH
3 present stronger absorption than in the 10 µm region. Interestingly, the region centered at 6.6 µm has strong absorption lines which are additionally free of the interference of CO
2. Unfortunately, in this region, water absorbs strongly, making the region less explored. Only Maithani et al. reported, in 2018, high resolution and high-sensitive spectroscopic analysis of NH
3 centered at 6.2 µm [
18]. Therefore, further work is needed in the wavelength ranges between 5 and 7 µm where strong absorption lines of fundamental and combinational vibrational bands of ν4 and ν2 are located. Exploring these absorption bands allows alternative measurements as well as spectroscopic studies with excellent performance and higher sensitivity [
19,
20]. Furthermore, this wavelength region is suitable in spectroscopic applications in medicine and biology for the detection of proteins [
21,
22]. Moreover, the spectral region around 6.8 µm is very important for the high-precision spectroscopic measurement of the hyperfine structure of muonic hydrogen and contains the footprints of several important unsaturated hydrocarbons such as isoprene [
23,
24,
25].
Many techniques based on direct and indirect absorption spectroscopy of atoms and molecules in gas phase have been developed in order to achieve a sensitive and accurate measurement of trace gases [
26,
27,
28]. Among direct absorption techniques, the cavity ring-down spectroscopy (CRDS) technique has proven high sensitivity and accuracy due to its independence of laser noise [
29,
30,
31,
32,
33,
34]. The CRDS differs from the other techniques because it uses a time-based measurement to perform the absorption spectrum of the gas, rather than traditional intensity-based absorption techniques. In CRDS, the light from a laser source is confined in a high-finesse optical cavity in order to increase the effective absorption path length significantly. Moreover, beyond the detection technique, tunable and high power light sources operating in MIR wavelength region are needed in order to have high selectivity as well as high-sensitivity for precise and quantitative analysis. Quantum cascade lasers (QCLs) are the ideal sources for gas sensing in this wavelength region. QCLs are unipolar intersubband lasers in which the radiative transitions occur in one band and involve a single type of carrier, namely electrons. The first QCL was demonstrate in 1994 by Faist and al [
35]. Research in this field is continuously expanding and gives today, laser sources covering the entire mid-infrared and terahertz spectral region for sensitive detection of molecular species. QCLs offer high power, high spectral performance, and a reliable, coherent light source. A stringent single-mode emission and superior wavelength stability as required for trace gas sensing are met by distributed feedback (DFB)-QCLs [
36,
37,
38,
39].
The goal of this work was to build a high-resolution pulsed-CRDS sensor to measure molecular trace gases, first using ammonia as a test sample in a well-controlled environment and exploring the spectral region with wavelengths near 6.8 µm. The sensor is based on a pulsed DFB-QCL operating around 6.8 µm which match well with the ν4 fundamental vibrational band of ammonia centered at 1468.898 cm−1. In order to reduce the partial interference of NH3 and H2O lines in this wavelength range, the CRDS, which is based on a 50-cm-long optical cavity, was preliminarily evacuated by a turbo molecular pump. A part per billion level of detection sensitivity was reached using an optical path length of 226 m.
The design of this system, with its tunability and high spectral performance, allows a straightforward extension to important remote gas sensing applications involving other gas molecules with absorption bands falling within the same interval.
2. Theory
The CRDS technique was first introduced in 1988 [
29] and is based on measurement of the decay rate of light trapped and bouncing repeatedly inside a high finesse optical cavity. When a laser pulse is transmitted into the cavity, it will gradually leak out of the cavity at each reflection through the highly reflecting mirrors. The intensity of the light transmitted through the output mirror decays exponentially with a time constant as [
27]:
where
I0 is the initial detected light intensity and
τ is the time constant named ring-down time. The ring-down time is the time for which the intensity reaches 1/e of
I0.
The general ring-down time
τ is then given by:
where
L is the distance between the mirrors,
R is the mirror reflectivity,
c is the speed of light,
is the frequency-dependent absorption or scattering cross-section for each transition of each species,
is the line-integrated number density, and the sum is over all species inside the cavity.
In an empty cavity, the sum term vanished and the ring-down time
τ0 depends only on the mirror reflectivity, the distance between the mirrors and the speed of the light.
For the gas phase samples, the scattering can be neglected as compared to the absorption. Moreover, if the gas species are homogeneous, the ring-down time can be written as follow.
where
is the absorption coefficient of species at frequency
.
The absorption coefficient of the sample present in the cavity is obtained by fitting Equations (3) and (4).
The sensitivity of the CRDS technique depends on the measurement precision of the ring-down time and is given by:
where
is the standard deviation of the empty cavity ring-down time,
is the absorption cross-section at the absorption wavelength, and
N is the number density of the molecule.
3. Experimental Setup
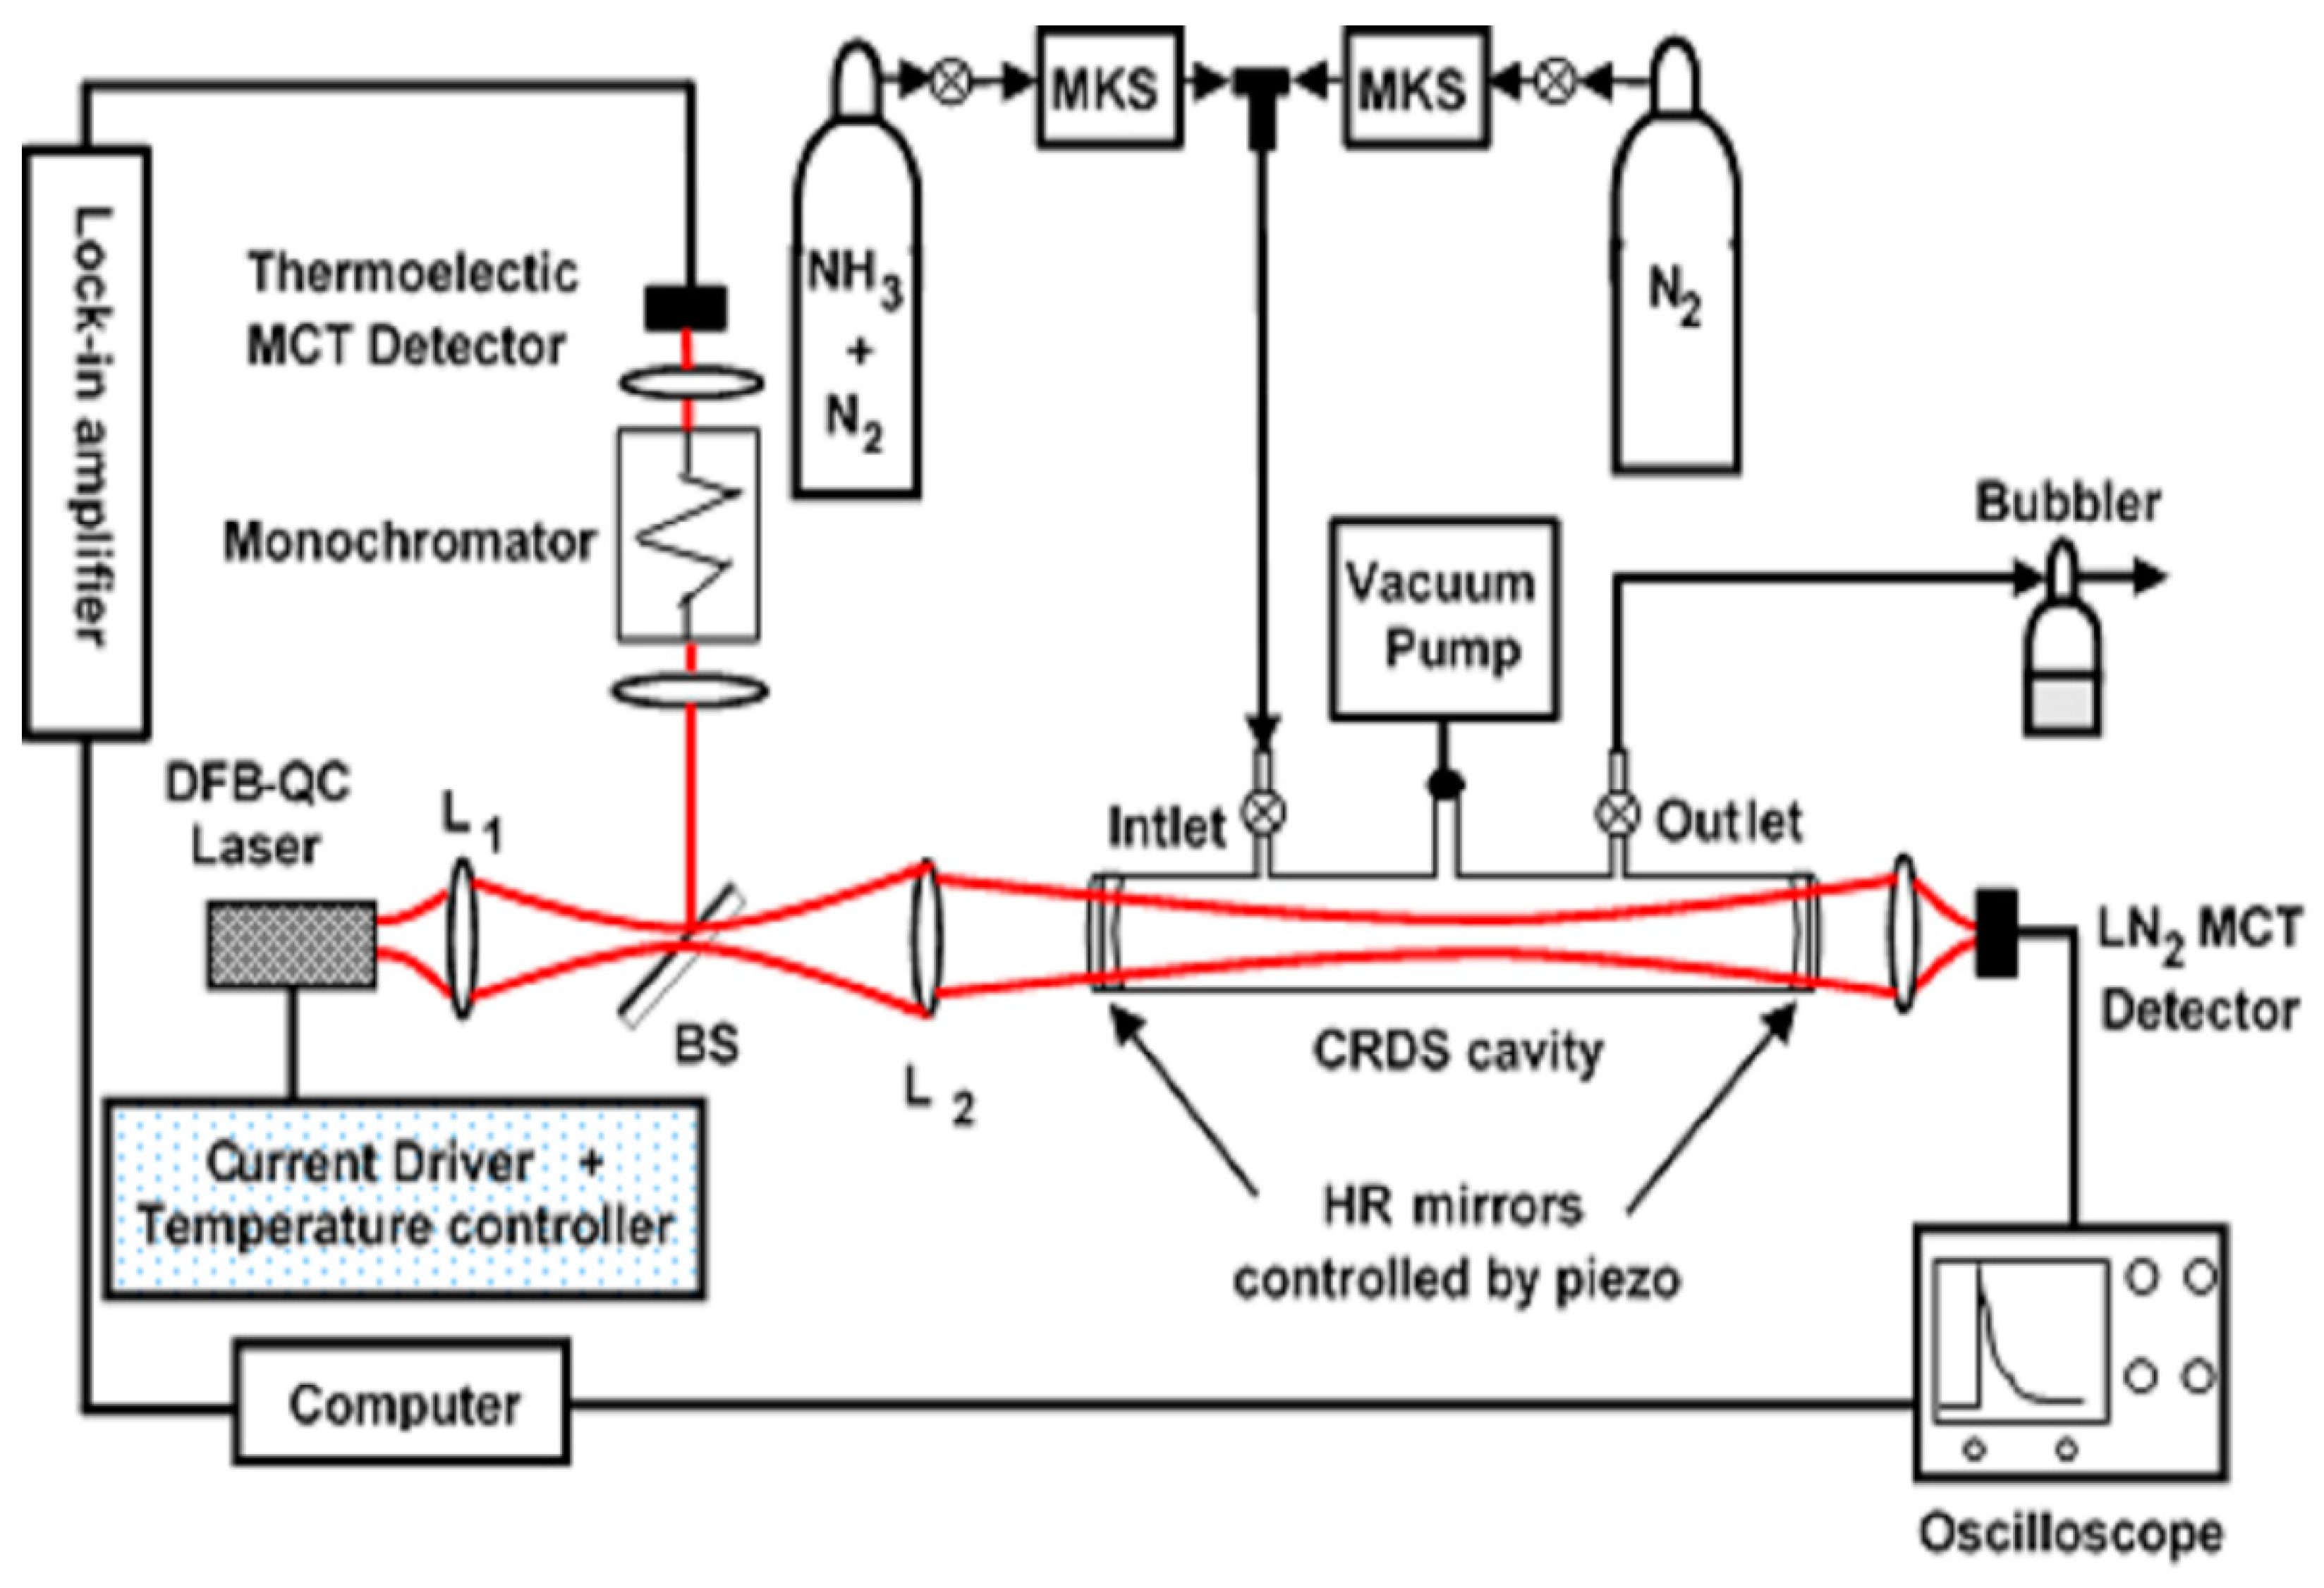
The schematic representation of the experimental set-up is shown in
Figure 1. The cryogenic DFB-QCL is mounted on a sample holder with a liquid nitrogen-cooled cryostat to achieve the required temperature range. The cryostat (OptistatDN-V, Oxford Instruments) is controlled by an external PID temperature controller (ITC503, Oxford Instruments). Therefore, it is possible to stabilize the temperature of the probe mount very accurately (0.1 K) in the range of 77–500 K. In order to operate the cryostat properly, good vacuum conditions (10
−4 mbar) are necessary to avoid thermal dissipation, vapor condensation and freezing of the bath’s outer chamber. A turbomolecular pump backed by a membrane pump (ILMVAC CD160) is used to achieve proper vacuum conditions. This pump can create a vacuum up to 10
−7 mbar. The laser was operated in a pulsed mode and driven by a pulser (LDD-TPG 228, Alpes Lasers) with pulse widths ranging from 50 ns to 200 ns and laser drive current from 1 to 2.3 A.
The optical cavity is part of a quartz-coated vacuum chamber and consists in two identical plano-concave mirrors of 1 m radius of curvature and 25.40 mm diameter separated by 50 cm (d = 50 cm) apart (Los Gatos Research, Inc., Mountain View, CA, USA). The reflection coefficient of the mirrors at 6.80 µm is 99.8% (II-VI INFRARED, R = 99.8% at 6.8 µm). The mirrors are made of a ZnSe substrate, with anti-reflection coatings on the plane sides and dielectric coatings on the concave surfaces. Each mirror can be adjusted by using an assembly of three piezoelectric actuators (15 microns of piezo-electric travel from 0–150 V, MDT693A Piezo Controller).
A pulsed DFB-QC laser emitting around 6.80 µm (Alpes Laser, #sb 1486 DN) was used. The DFB-QCL was operated at a repetition rate of 200 kHz and 100 ns pulse width (2% duty cycle), allowing us to scan the wavenumber range from 1465.11 to 1474.88 cm−1 by changing the operating temperature from 80K to 180K. The maximum average output power of 20 mW was achieved at 2% duty cycle. For the mode-matching between the laser beam and the cavity mode, we have used antireflection-coated lenses of Ge (L1) and CaF2 (L2) with focal lengths of 25.4 mm and 200 mm, respectively. Between the two lenses, the laser beam is divided into two parts by a beamsplitter (BS). One part of the beam goes directly into the CRDS cavity and the second part to the monochromator (MS257, MODEL 77700A, SPECTRA PHYSICS) for the real-time measurement of the wavelength. The output signal from the monochromator is focused into a thermoelectric HgCdTe photovoltaic detector (VIGO PVMI-10.6) which is connected to a lock-in amplifier (SIGNAL RECOVERY 7280 DSP) and a 2 GHz oscilloscope (WaveRunner 6200A, LeCroy). The lock-in amplifier is triggered with the QC-laser trigger and is used for extracting the signal from the VIGO detector. The output light of the cavity is focused by a Ge plano-convex lens of 25.40-mm-diameter and 25.40 mm focal length into a liquid-nitrogen-cooled HgCdTe photovoltaic detector (Cryogenic HgCdTe detector, Kolmar-model KMPV11-0.5-J2, 20 MHz bandwidth, sensing area of 0.5 × 0.5 mm). The output signal from the detector is connected to a LeCroy WaveRunner 6200 A digitizing oscilloscope (5 GS/s sample rate, 2 GHz bandwidth and 8 bits vertical resolution) and a Gage CompuScope high speed digitizer card (GaGe CS 12100, 12 bit, 100 MS/s) mounted on a standard computer. The exponential decay signal was captured with Gage card and processed using LGR’s proprietary pre-processor and (least-squares) fitting algorithms wrapping in LabVIEW software. The alignment of the whole optical system and the calibration of the monochromator were performed using a green laser operating at 532 nm wavelength.
The initial part of our work consisted in the optimization of the mode matching between the laser beam and the optical cavity. To facilitate the longitudinal mode matching, we first performed a simulation based on the ray-transfer matrix to find the best positions of the lenses and cavity mirrors that could allow us to match the beam waist to the cavity waist at the middle of the cavity.
Subsequently, the end mirror of the cavity was approximately placed at the calculated position from the front of the QCL laser. A green laser passing through a pinhole located in the place of the first mirror was used to adjust the mirror. The PZT actuators of the end mirror were adjusted to ensure the overlapping of the feedback light from the mirror with the pinhole aperture. Then, the lenses L1 and L2 were placed at the calculated positions. Thereafter, the PZT actuators of the front mirror of the cavity were adjusted roughly by hand to have a smooth single-exponential CRDS decay and the PZT actuator controllers (from the center voltage of the controller, 75 V) of L2 and the two mirrors were activated. The voltage of controllers was adjusted to have the smoothest decay and to improve the value of the initial intensity of the CRDS decay, which is expected to guarantee also the best longitudinal mode matching. It was estimated that the drifts on resonant cavity mode are negligible during our measurement time; in fact, during the measurement time (after each mode matching setting) typical temperature variations of less than 1 degree Celsius were observed. Taking into account that the thermal expansion coefficient of the quartz-coated cavity is in the order of 10−6 K−1, and that cavity mode spacing of the cavity (FSR) is about 300 MHz, the corresponding frequency shift of the cavity mode, due to a 1-degree temperature change, would be less than 200 Hz, i.e., much smaller compared to the theoretical cavity linewidth (), which is 191 kHz.
4. Results
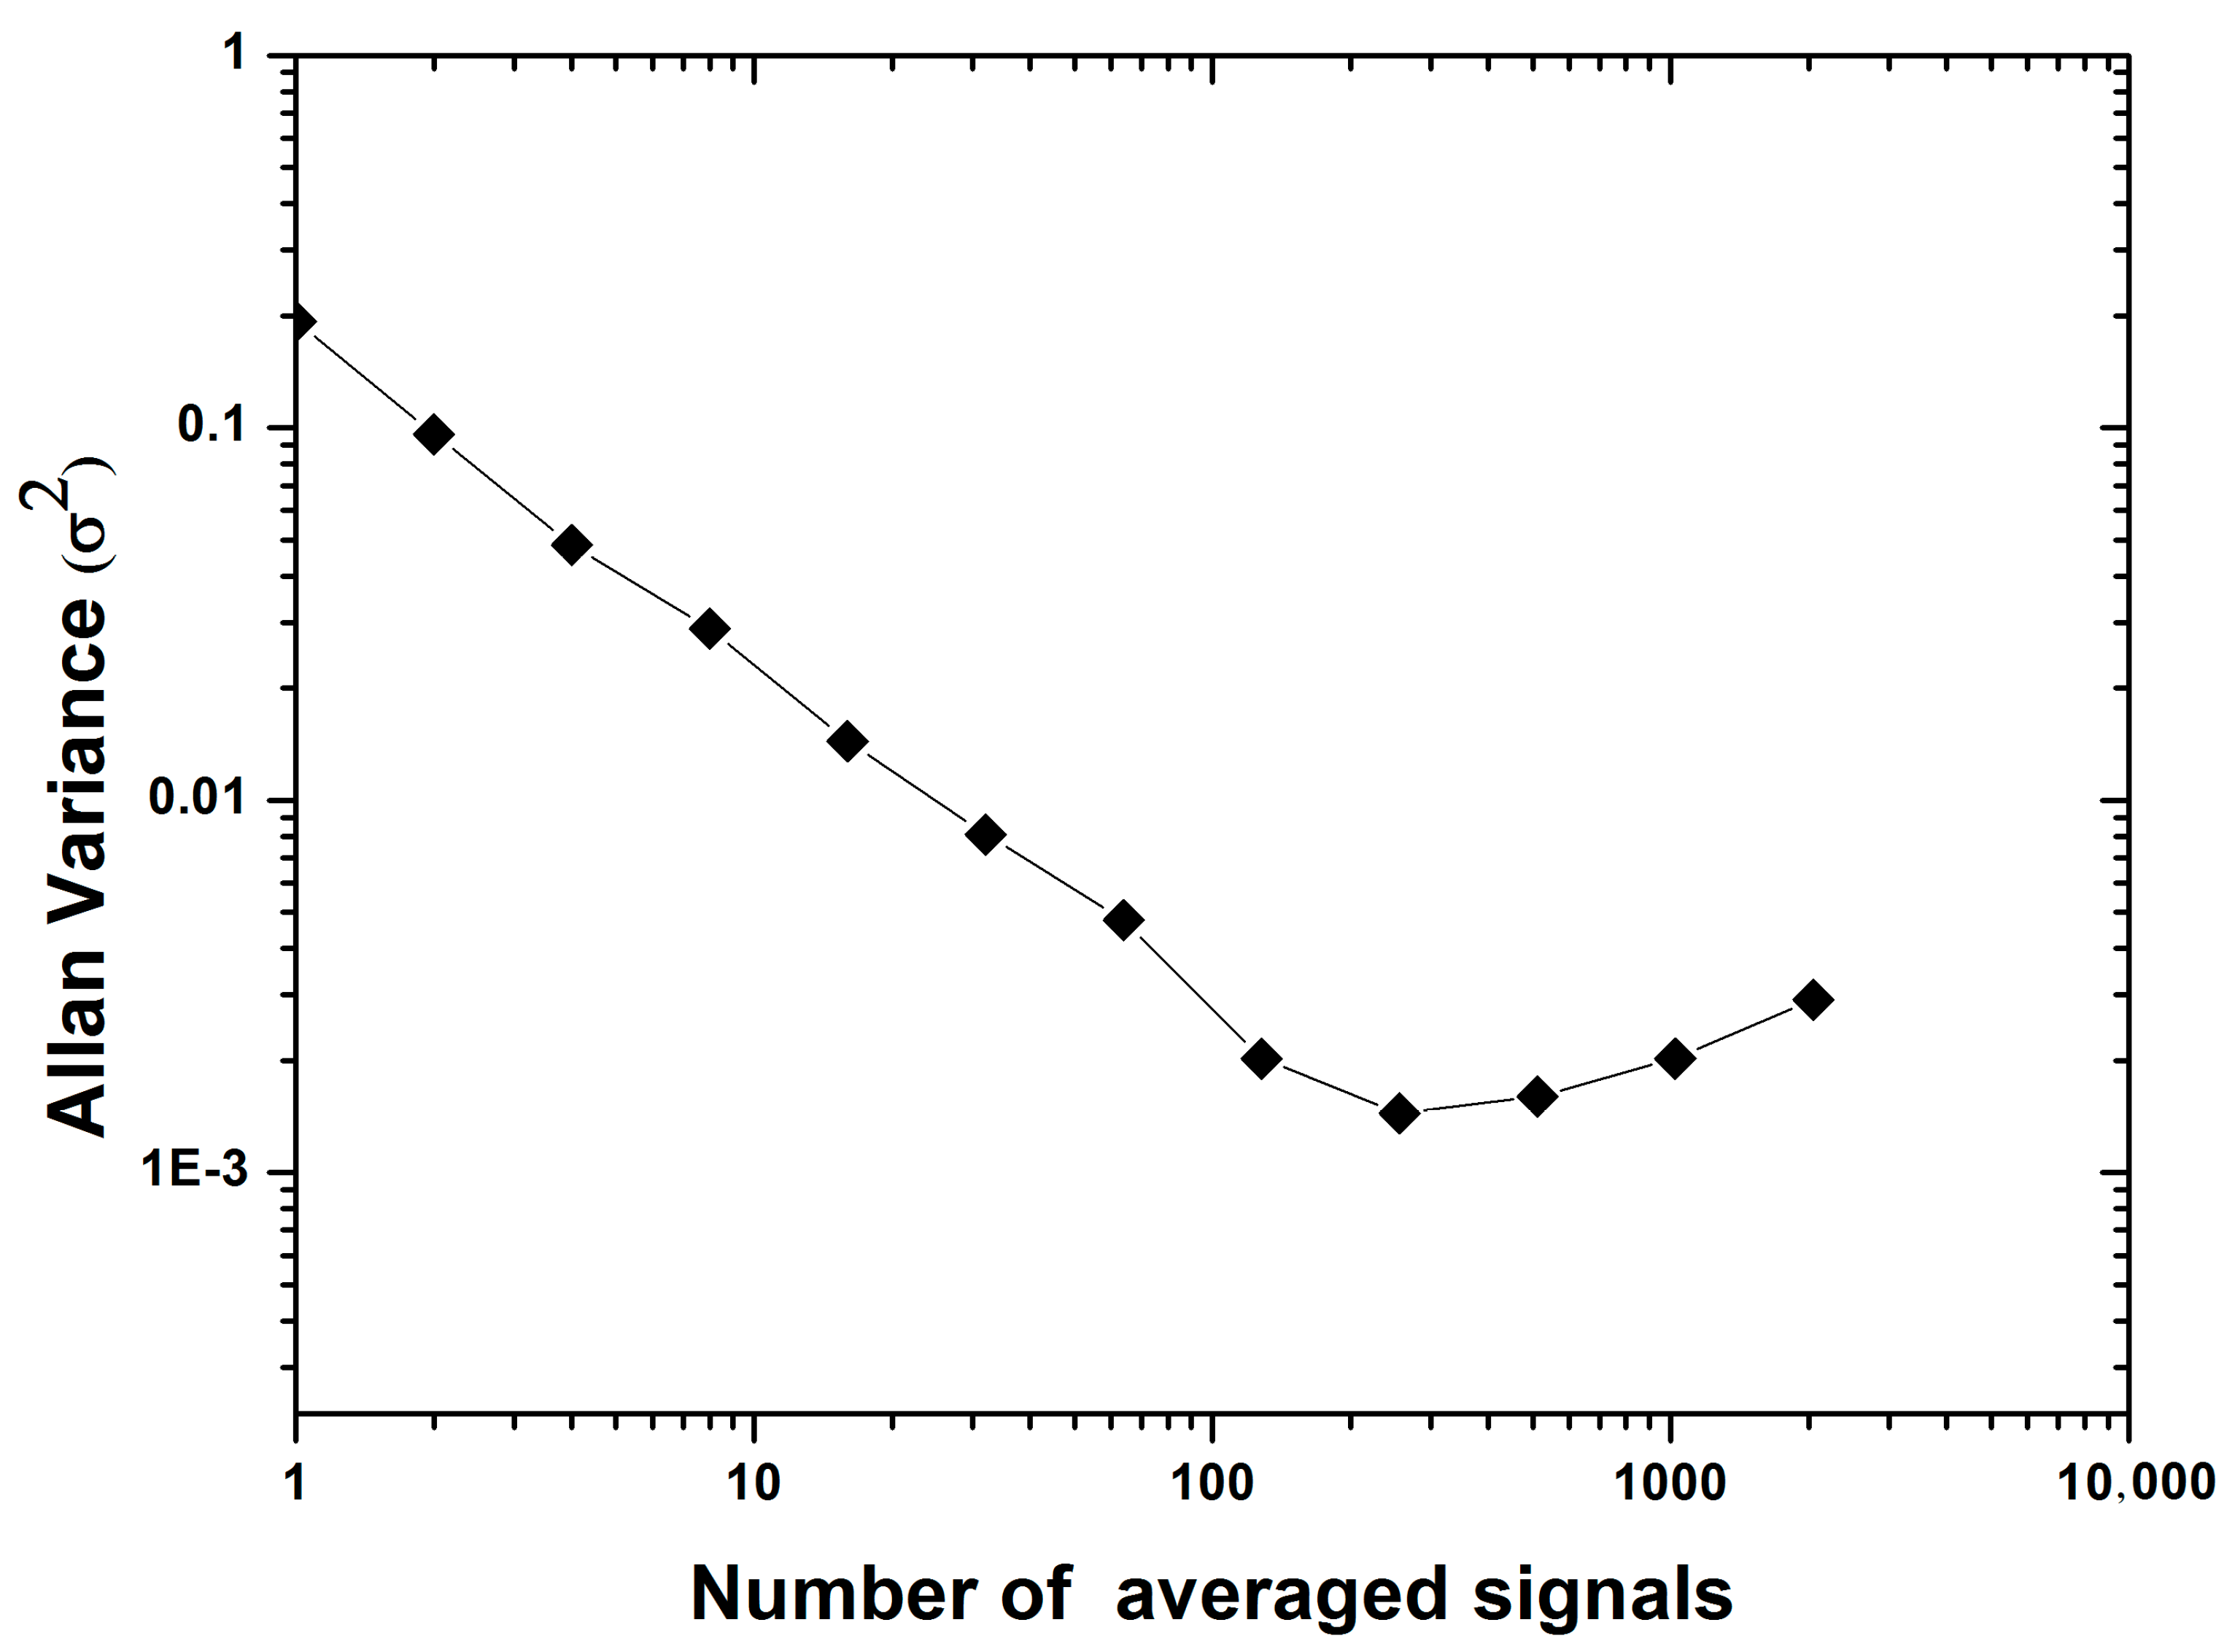
The stability of the optical cavity was analyzed by means of an Allan variance test to find the optimized time for averaging the measurement. For this purpose, decay signals were recorded for different amounts of signal averaging, from 1, 2, 4, 8, 16, 32, 64, 128, 256, 512, 1024, and 2048 averaged decays.
Figure 2 shows the Allan variance of the empty cavity ringdown (
τ0) as function of the number of the averaged decays [
26]. The log-log plot of the Allan variance shows that the Allan variation decreases with increasing averaging (due to the fact that noise decreases with more data averaging) up to an optimum value of 256 averaging decays, then increases due to temperature changes, electronic components effects, or other possible factors. From
Figure 2, we infer that the optimal sensitivity occurs with the averaging of 256 decays.
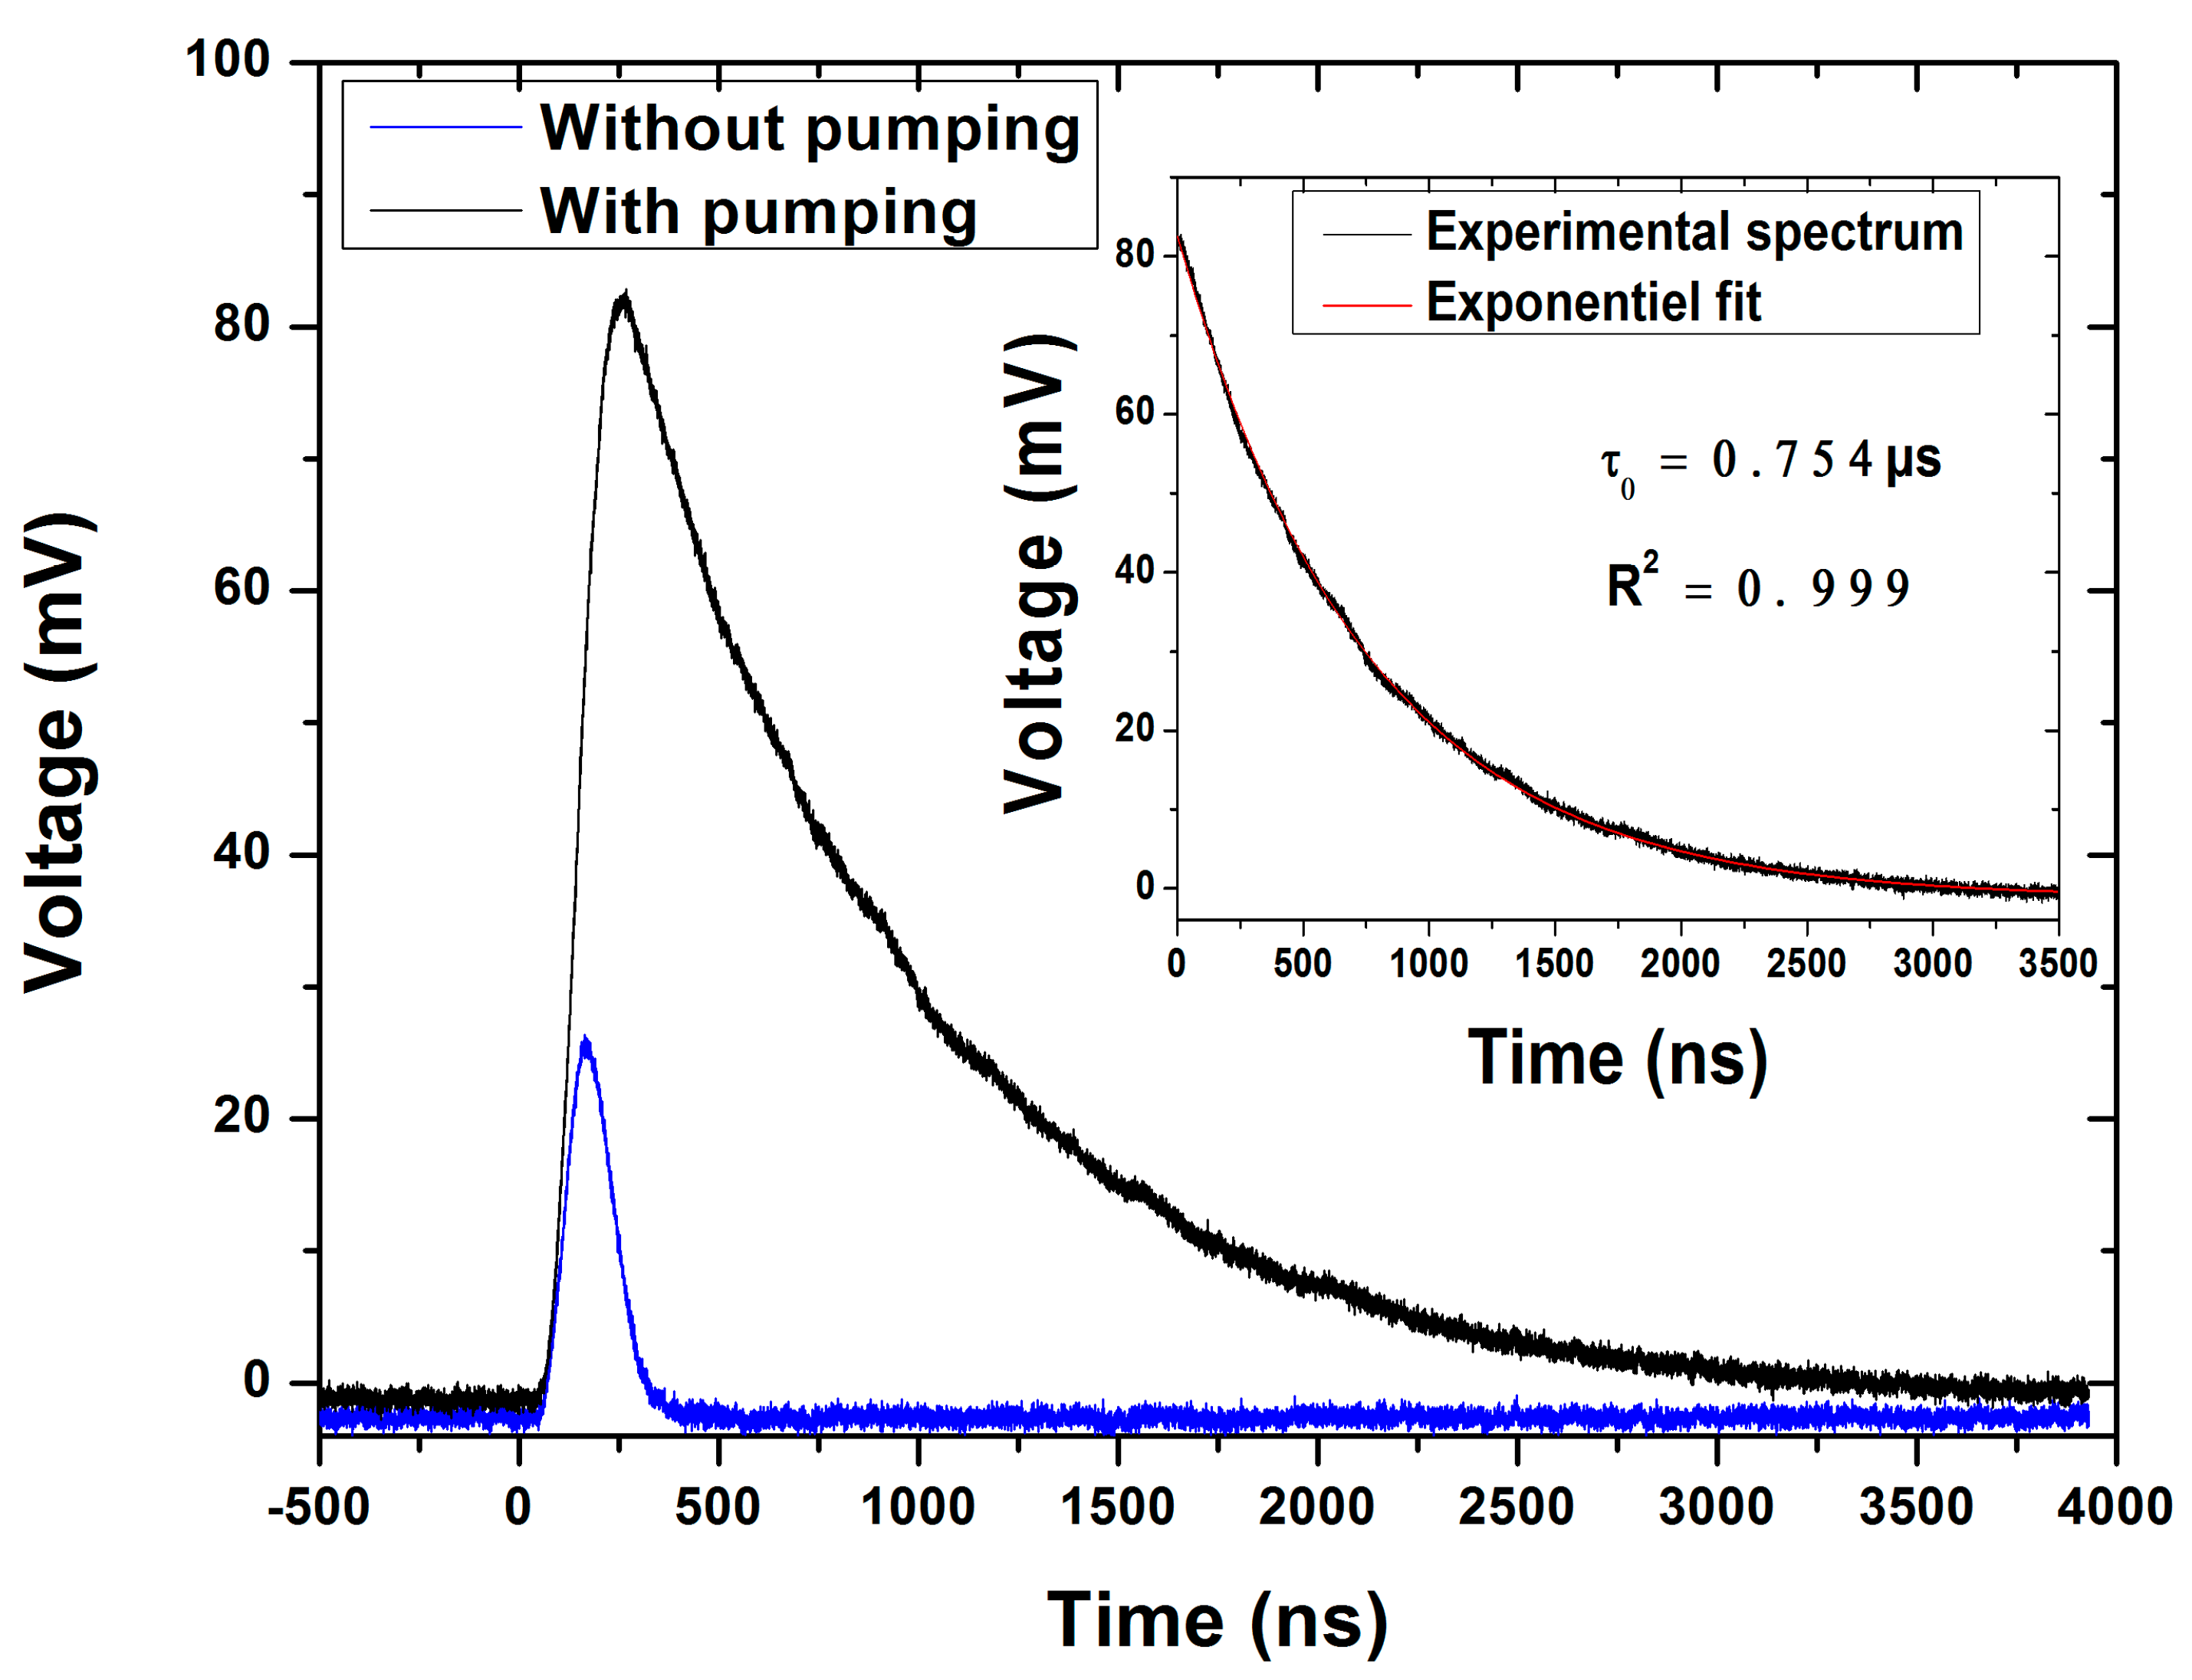
Figure 3 shows the ring-down decay recorded with 256 shots averaging at the wavenumber of 1470.58 cm
−1 (6.80 µm) for the evacuated cavity at a pressure around 10
−7 mbar (black color). The portion before the surge part of the signal is the baseline signal of the detector and is used to determine the offset. The surge part corresponds to the laser pulse injection into the CRDS cavity. The decay curve is used to calculate the ringdown time
τ. The ringdown time was calculated by fitting the experimental data to an exponential decay function
, where
A is the initial intensity of the light and
B is the DC offset of the detector. A value of
τ0 = 754.30 ns was calculated corresponding to an effective mirror reflectivity of 99.77% and an effective optical path length
of 226 m. This experimental value of the reflection coefficient fits well with the reflection coefficient value range given by the supplier,
R = 99.8% (±0.15 %) at 6.8 µm. Based on this ringdown time value the cavity linewidth
) was estimated to be 211 kHz and the finesse of the optical cavity (
) to be 1421.
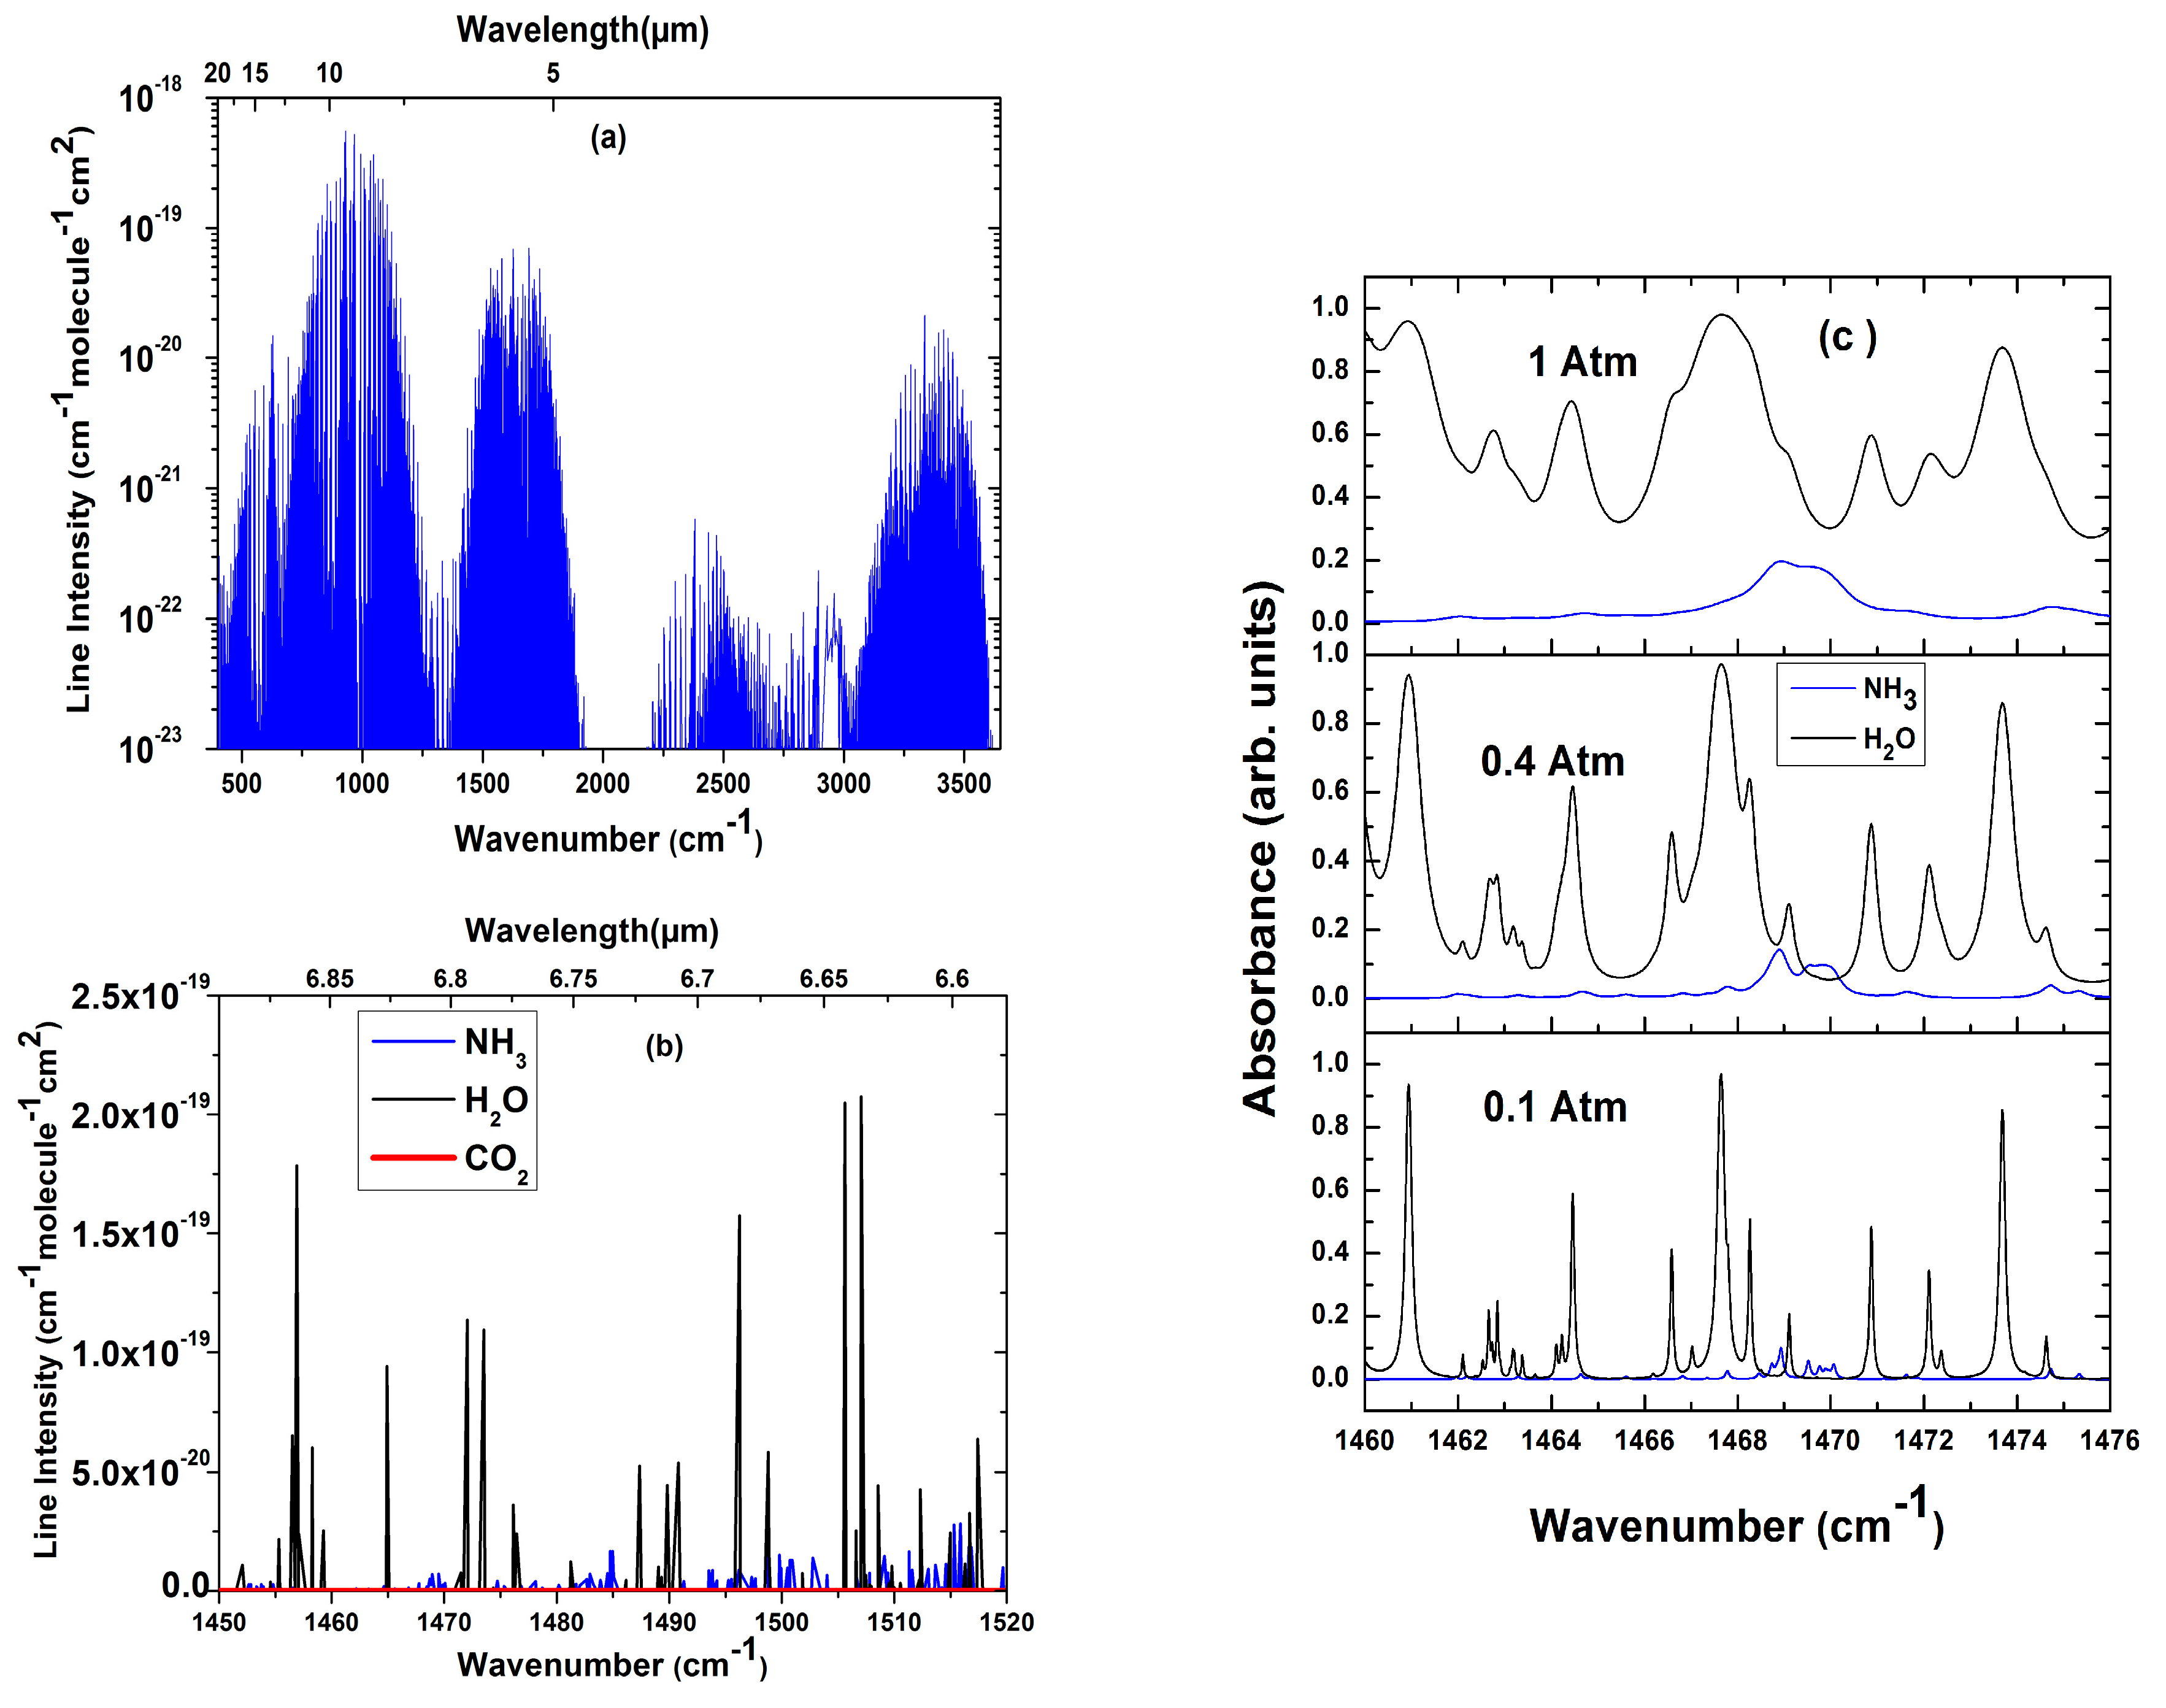
Figure 4a shows the simulated spectral lines obtained from HITRAN database of NH
3 in the MIR spectral region covering 500.00–3500.00 cm
−1 [
4]. The ν4 fundamental vibrational band of NH
3 centered at 1500 cm
−1 (6.6 µm) shows intense lines but remains less attractive due to the strong absorption of water (H
2O) in this region (
Figure 4b). However, this region has advantage for gas analyses because is free from CO
2 interference. The absorption feature centered on 1468.898 cm
−1 was chosen for our studies.
Figure 4c shows the simulation of the absorption spectra of NH
3 (23 ppm) and H
2O (5%) for an optical pathlength of 226 m and a temperature of 296 K for three different pressures, i.e., 1, 0.4, and 0.1 Atm, in the wavenumber range between 1460 cm
−1 and 1476 cm
−1. It is worth observing in
Figure 4c that the pressure induced broadening of the spectral line. The challenge is to operate the gas sensor setup at a pressure closer to 1 Atm in order to use this device in normal atmospheric condition for spectroscopy. From the figure, it is clear that the overlapping of the bands is pressure dependent and that, reducing the pressure, the NH
3 and H
2O lines will reduce the level of overlapping due to the decreasing of the baseline of the H
2O absorption. A pressure of 0.4 Atm was chosen for our work in order to reduce the water absorption baseline as well as the broadening of the ammonia spectrum. To reduce the partial interference between NH
3 and H
2O at this pressure, a turbo molecular pump backed by a membrane pump (ILMVAC CD160) was used to pump the optical cavity to reach a proper vacuum prior to measurement. After that a constant flow of nitrogen (N
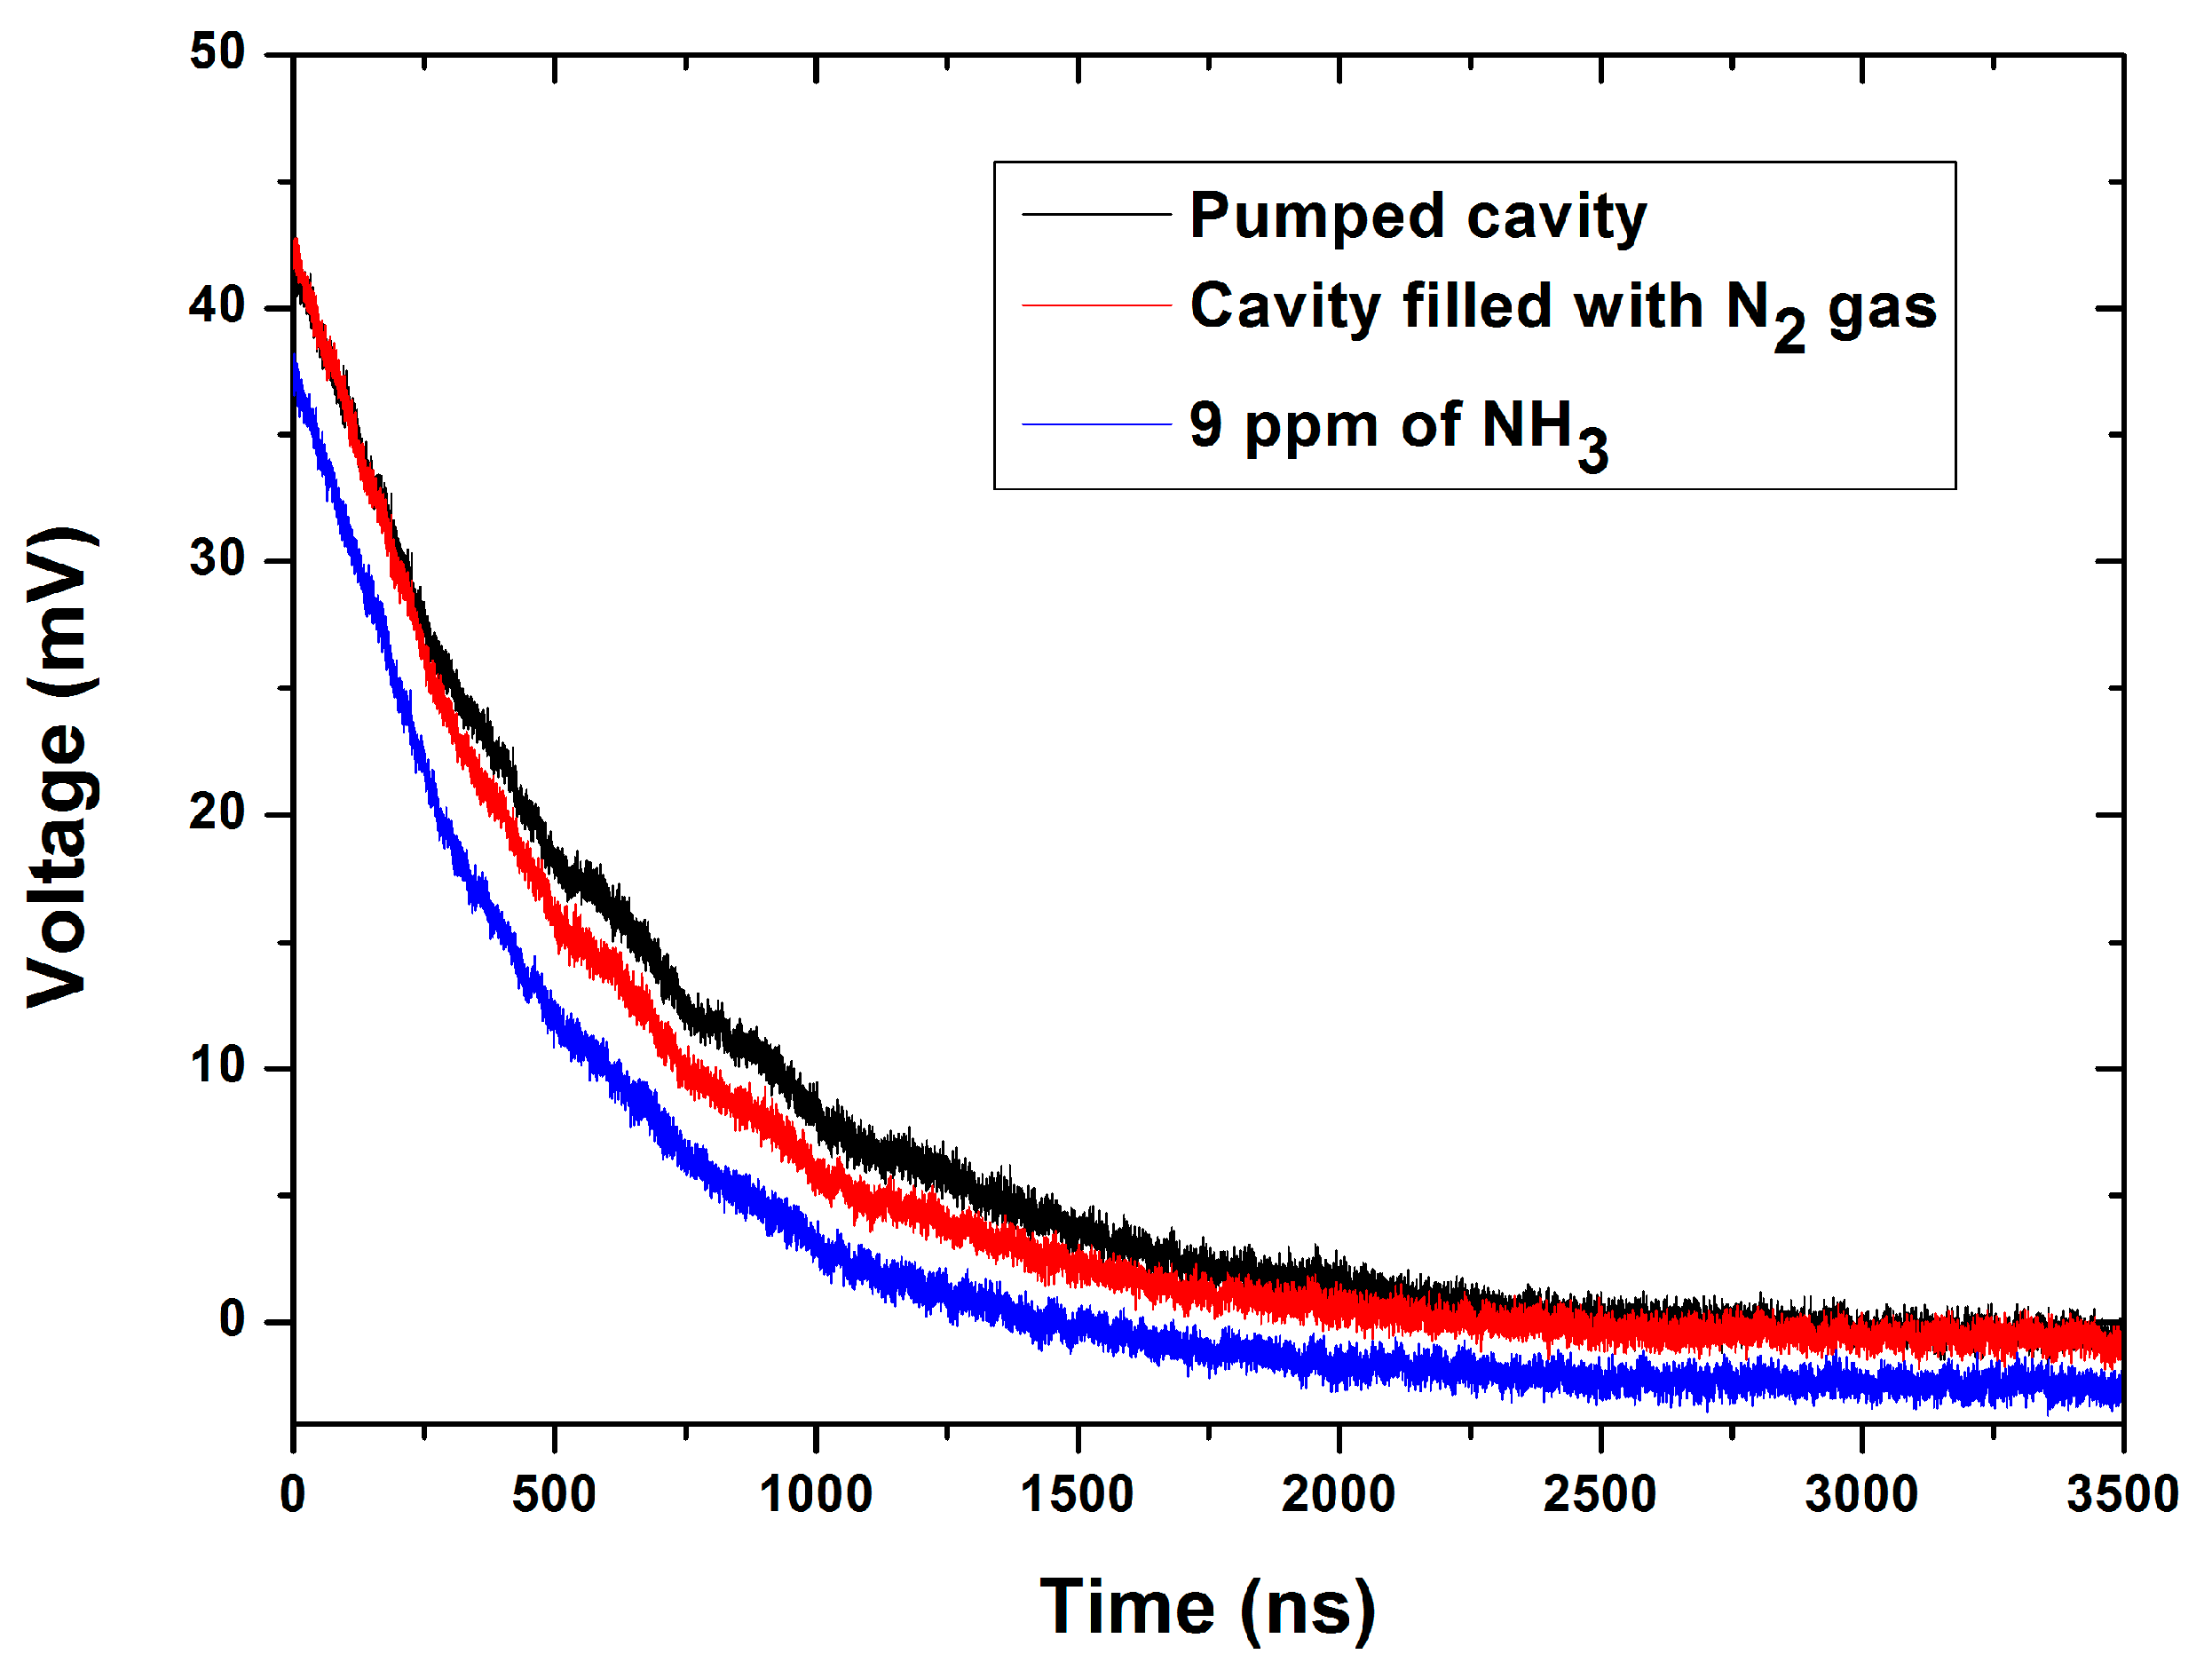
2), was used to additionally purge, was left through the cavity. Finally, a constant flow of nitrogen-ammonia mixture at a specific concentration was generated using a gas dilution system. First, an ammonia gas 100 ppmvol with 1.9 ppmvol uncertainty (produced by SIAD SpA) was diluted with nitrogen at a pressure of 0.4 Atm. Needle valves were used to control the ammonia and nitrogen flow to reach a given concentration. Two mass flow meters (MKS) were used to read the flow rates for these gases. Samples with different concentrations of ammonia flowed continuously through the cavity. For monitoring the gas flow, a bubbler was placed at the outlet of the cavity. A comparison between CRDS signal without pumping and the signal obtained after evacuating (
Figure 3), showed a drastic improvement of the signal since the interference from water vanished. Decay times of 0.754 µs and 0.074 µs were calculated for the pumped and not pumped cavity, respectively.
In order to record the spectrum of ammonia, the QCL was tuned from 1467.163 cm
−1 to 1470.395 cm
−1 by changing the laser heat-sink temperature from 134 K to 166 K with a tuning rate of −0.101 cm
−1K
−1. Spectra of different concentration of ammonia 9, 17, 23, 28, and 33 ppm were recorded. For each measurement, the cavity was emptied and then filled again with different concentrations of NH
3 gas at the same pressure. The CRDS signal obtained with the pure N
2 gas in the chamber was used as the blank signal.
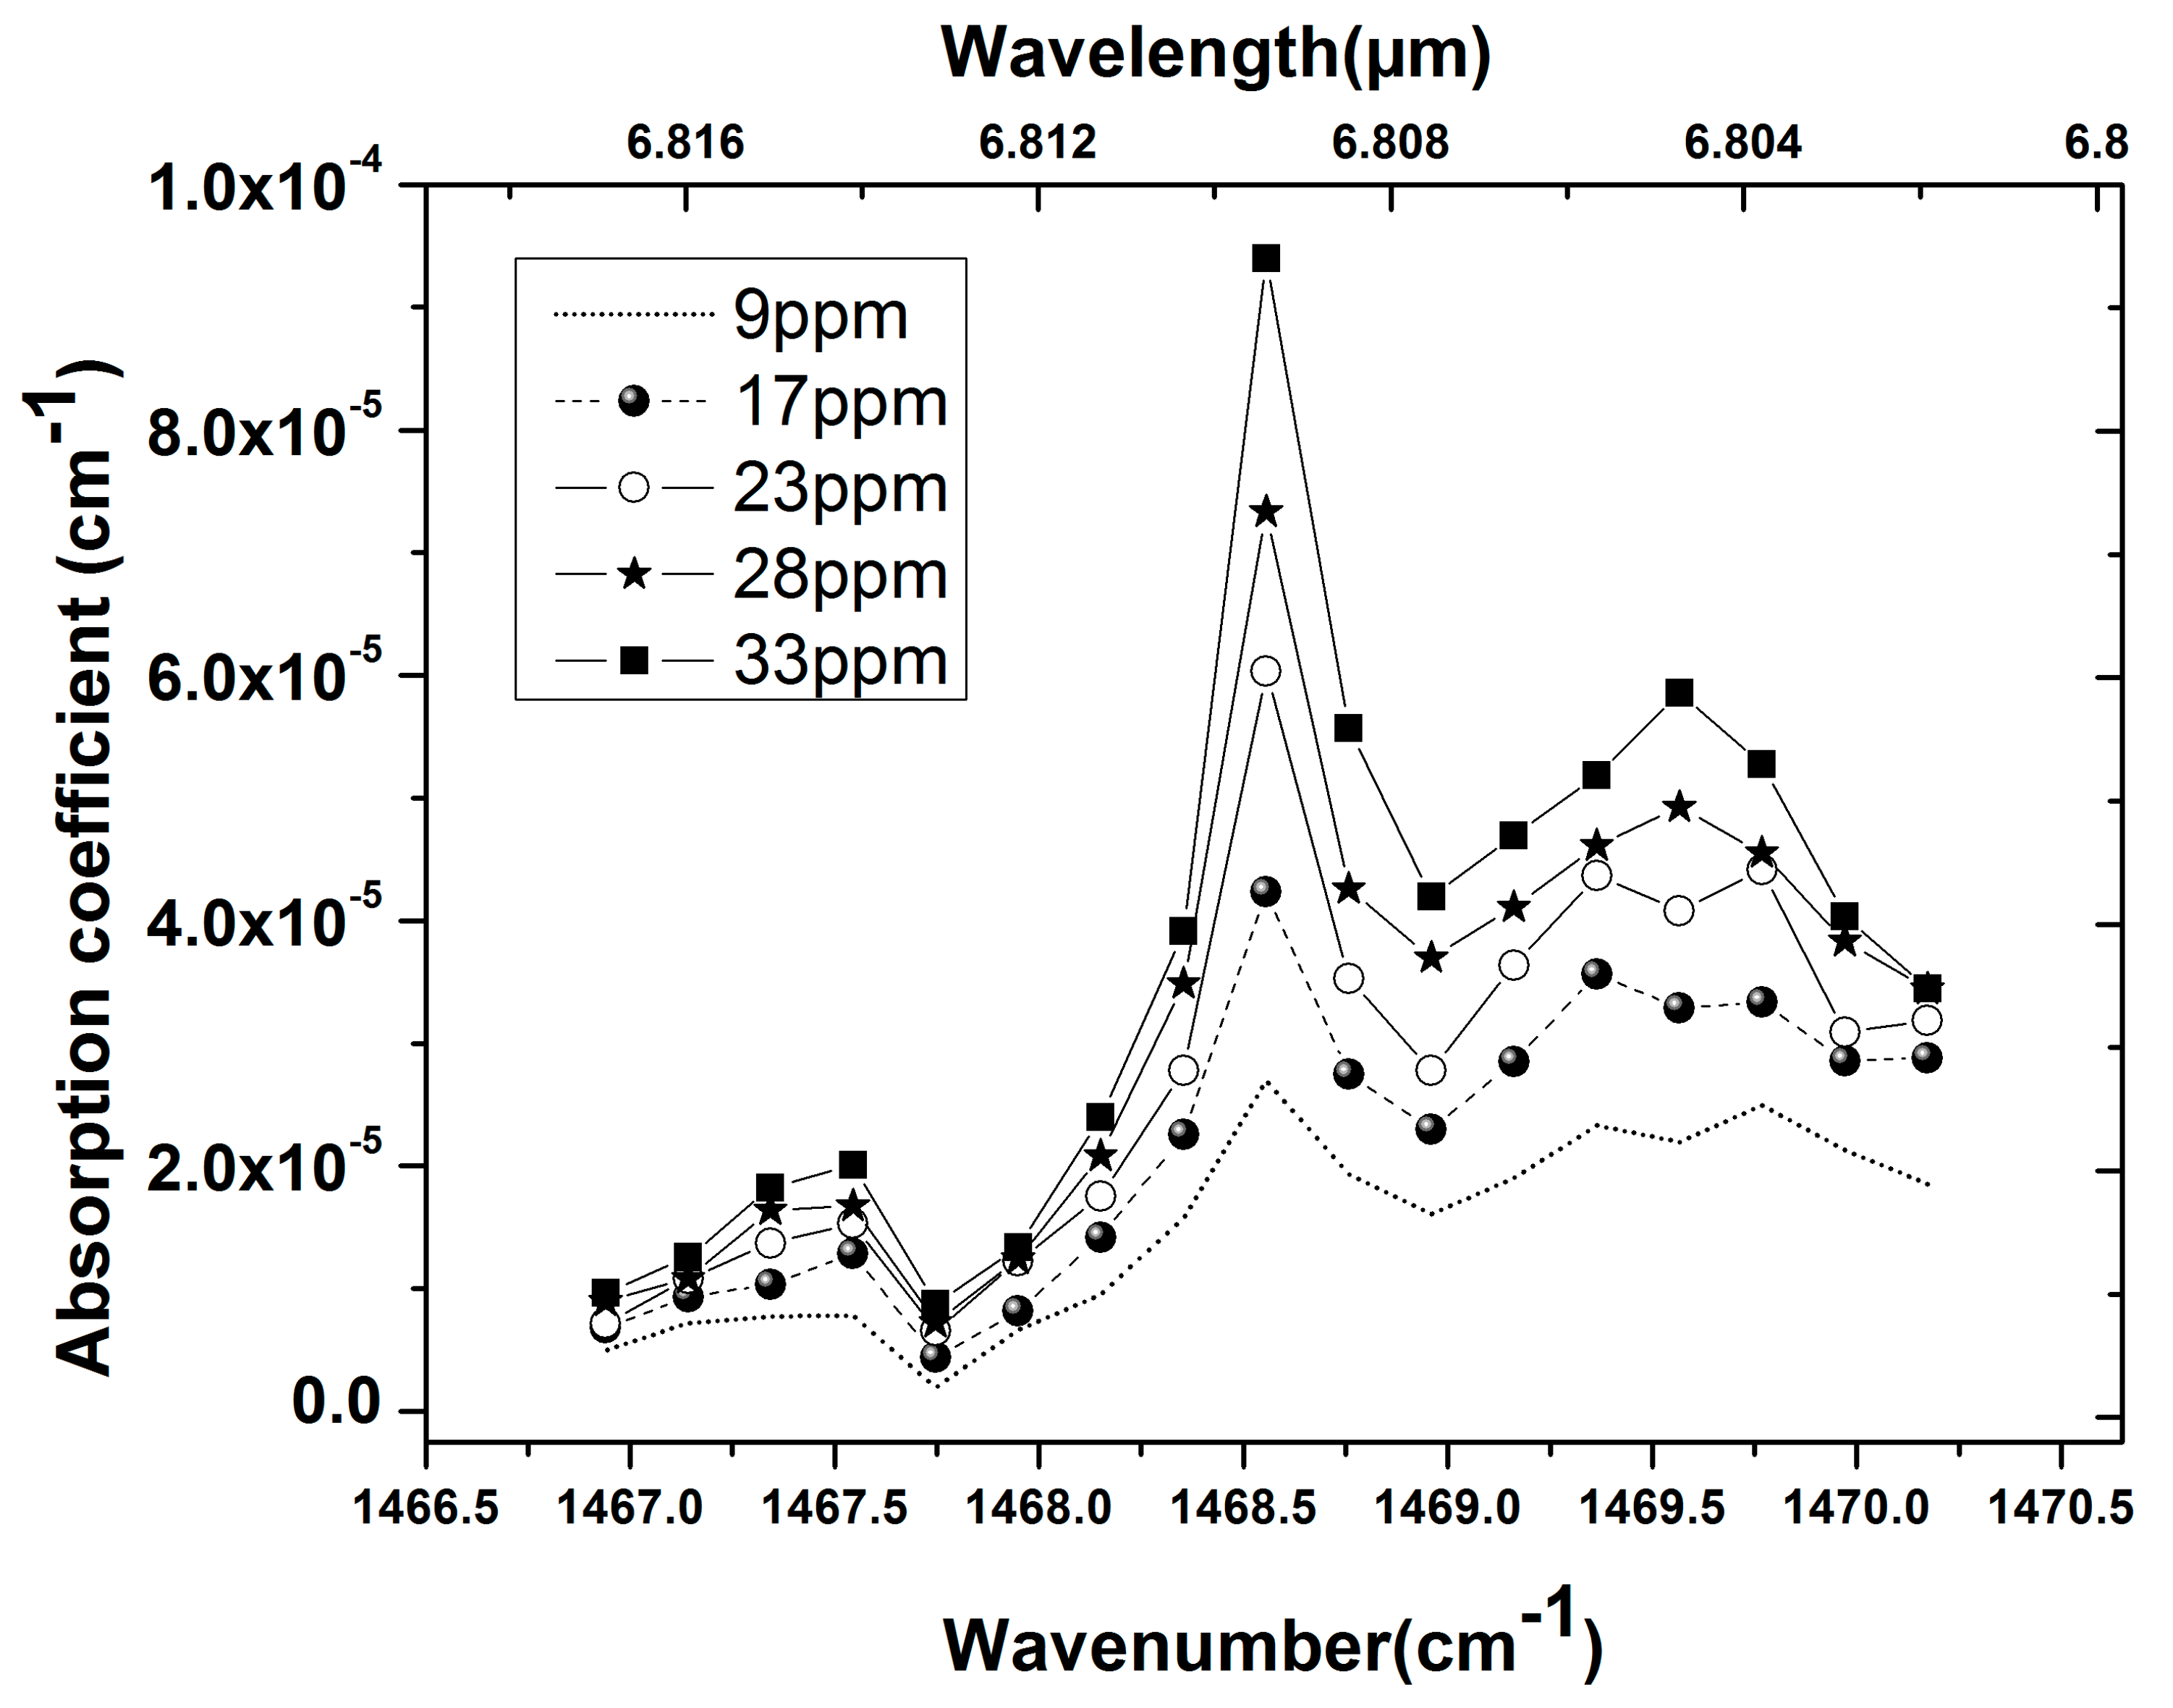
Figure 5 shows the CRD decays measured from the pumped cavity, the cavity filled with nitrogen, and a 9 ppm concentration of ammonia in the cavity. The spectra measured at various concentration of ammonia from 9 to 33 ppm are shown in
Figure 6. The absorption coefficients were calculated from Equation (5). For the data-acquisition, 256 ringdown events were averaged for each measurement. After some testing, we found that the time taken for having a constant NH
3 flow in the cavity is about 115 s. So, the signal was averaged and recorded over the measurement time of 120 s. The repeatability was verified by performing the measurement three times. The relative standard deviation of the decay time at different wavenumbers is in the range of 0.05% to 0.1%.
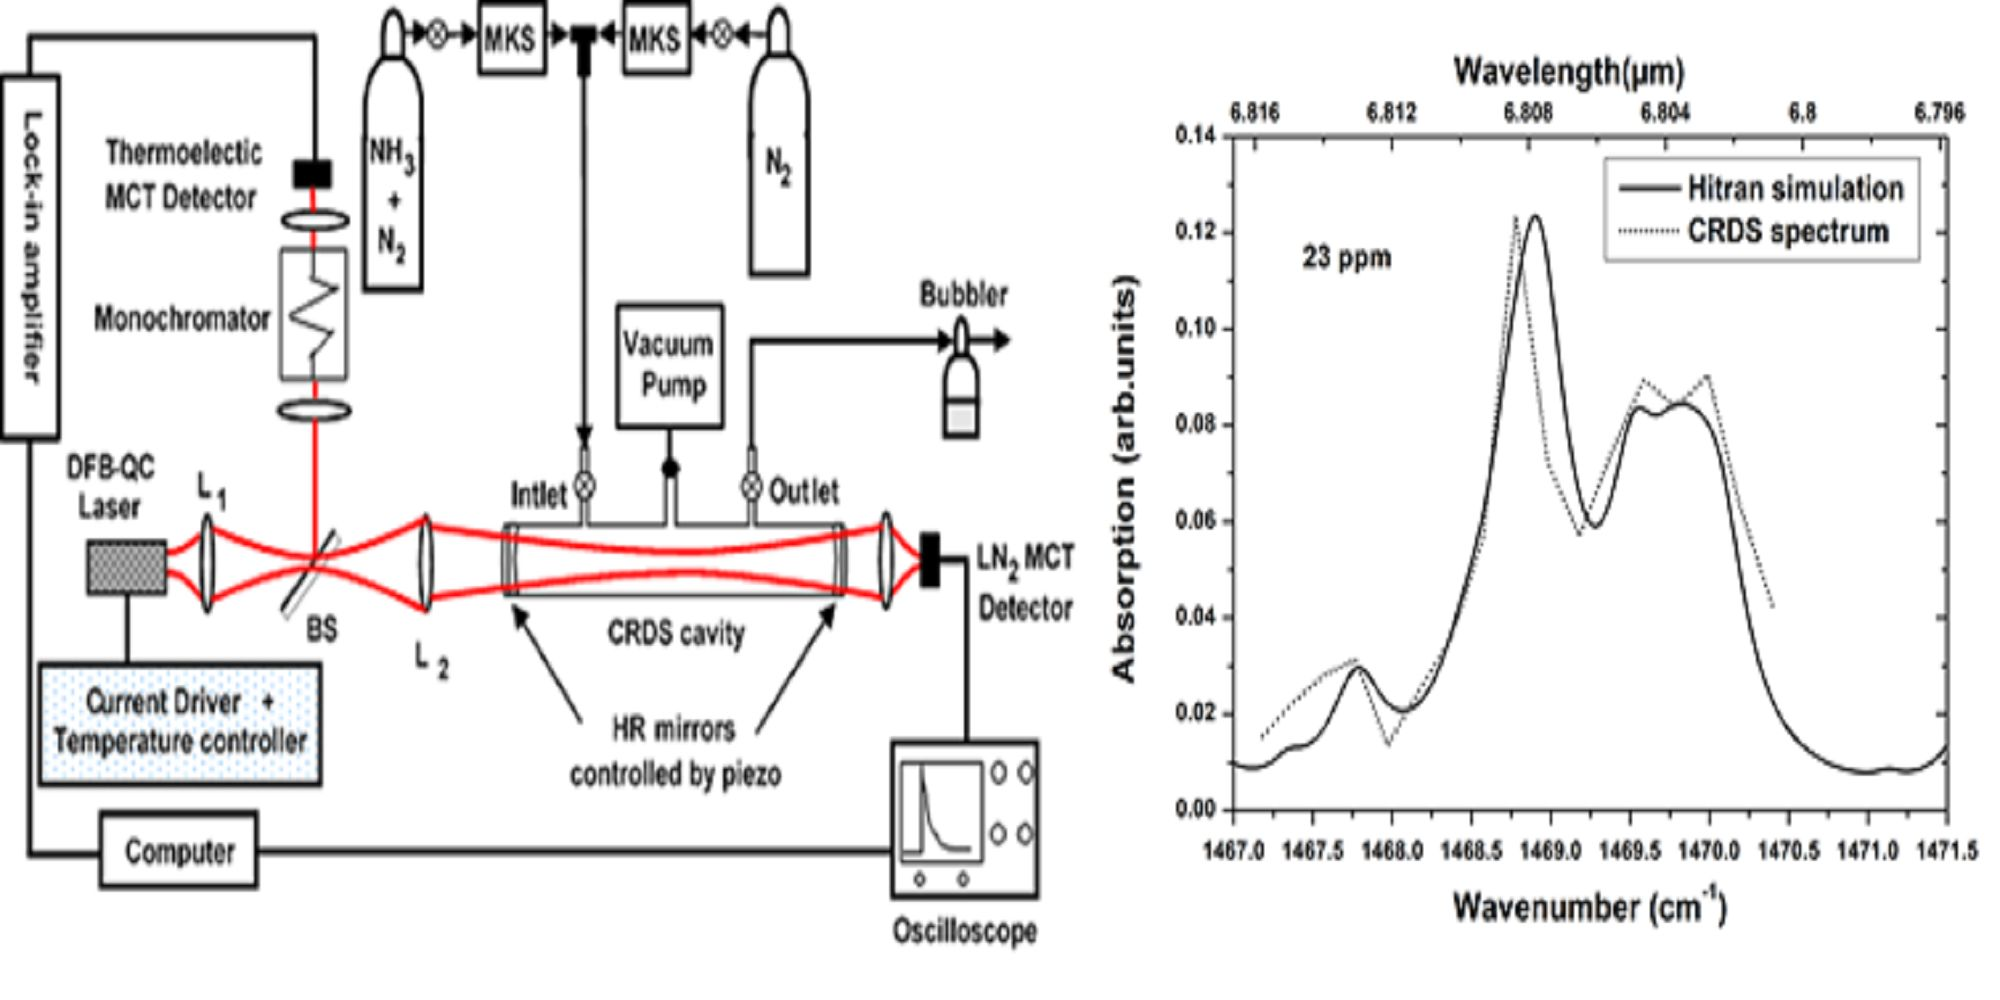
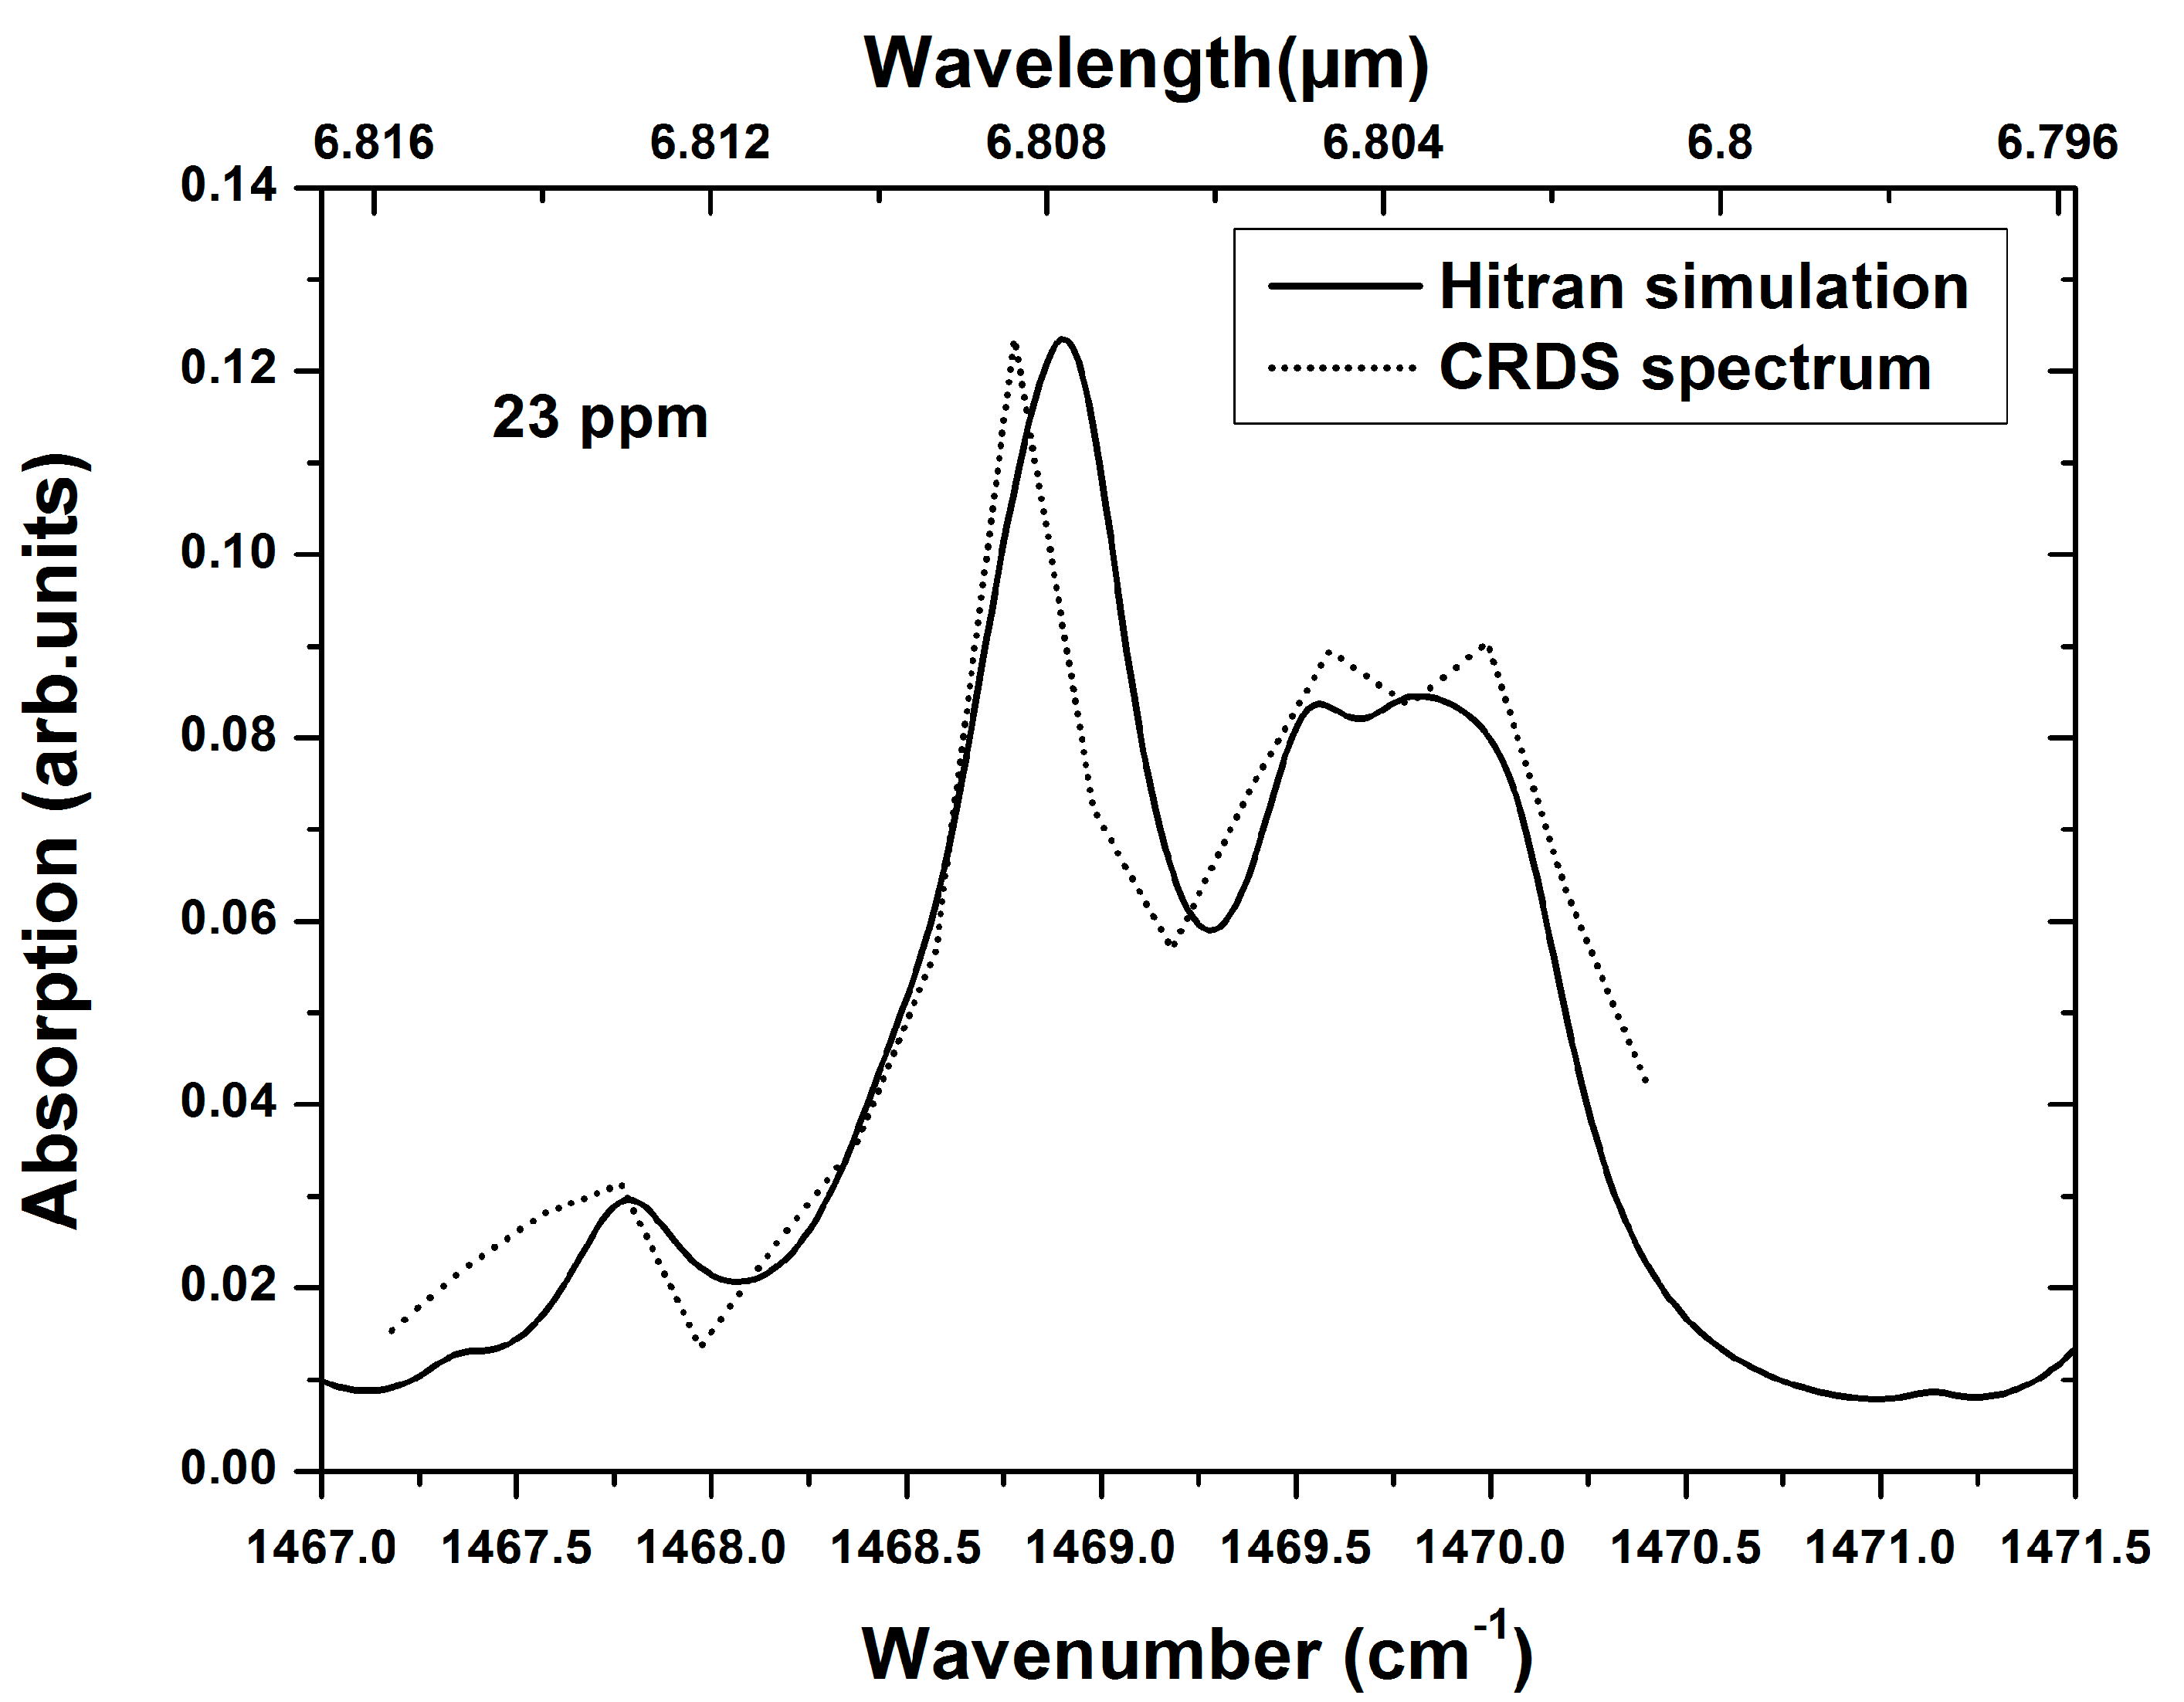
Figure 7 shows a comparison of NH
3 spectrum obtained at 23 ppm with a simulated spectrum from the HITRAN database under same experimental conditions, i.e., 0.4 Atm pressure and 296 K temperature.
The limiting sensitivity of the setup was calculated from Equation (6) by . The absorption cross-section of ammonia at 1468.736 cm−1 wavenumber, is 2.3 × 10⁻²⁰ cm2 molecule−1. At this wavenumber, a decay time with the relative standard deviation of was calculated corresponding to a minimum detectable absorption coefficient () of 2.21 × 10⁻⁸ cm−1. Using this value and ideal gas law, a detection limit of nine parts per billion by volume is obtained at room temperature and a pressure of 0.4 atmosphere.
6. Conclusions
We have developed a cavity ring-down spectroscopic sensor for trace gas detection using a pulsed DFB QC laser emitting in the region around 6.8 µm. The system was demonstrated to be a high-resolution spectrometer able to analyze experimentally the absorption line of the ν4 fundamental vibrational band of ammonia centered at 1468.898 cm−1 (6.807 µm). A comparison between our CRDS measurements and the HITRAN database spectra shows good qualitative agreement. With the sensor employed, and a 50-cm-long optical cavity with mirrors of 0.998 reflectance, we were able to demonstrate the detection of ammonia with a sensitivity of 9 ppbv and a 120 s measurement time. This test result shows that a pulsed laser-based-CRDS coupled with a cavity reflecting mirrors of 99.8% can be used as a highly sensitive chemical sensor.
In perspective, the sensitivity can be improved by performing detection using an optical cavity with higher reflectivity mirrors (R > 99.9) and lower gas concentrations. The work opens new possibilities in this unexplored spectral region because the high sensitivity detection of gases will be of substantial interest for several remote gas sensing applications in atmospheric chemistry, climate studies, as well as in biomedical research and diagnostics by measuring the release of relevant volatile compounds. Fundamental rovibronic absorption bands of a variety of gas molecules fall within this interval, such as water vapor, nitrous oxide, nitrogen oxide, nitrogen dioxide, methane, ethane, sulfur oxide, ammonia, hydrogen sulfide, nitric acid, and several others.

 ,
, 


