1. Introduction
Optical phased array (OPA) is a diffraction-based technology used to generate narrow optical beams that can be steered nonmechanically by modulating the amplitudes and phases of the OPA elements [
1,
2,
3]. Owing to its advantages, including its light weight, small size, and nonmechanical beam steering, OPA technology has attracted considerable attention and has been adopted in numerous applications, such as free-space optical communications [
4,
5,
6], light detection and ranging (LIDAR) [
7], three-dimensional holography [
8], and in biomedical imaging [
9]. In the OPA configuration, the optical beam of each OPA element is fed by optical light sources, which are typically lasers. The optical sources are modulated by external optical components, such as amplitude/phase modulators [
3,
10,
11]. In other OPA configurations, the laser arrays are frequency-locked to coherent optical signals by using either electro-optical phase locked loops or an optical injection-locking technique, whereby the optical signals are directly modulated to achieve phased-array optical signals without the use of an external modulator [
3,
12,
13]. The latter OPA configurations have various advantages when compared with the former OPA configurations, including compactness, low loss, and low power consumption [
12,
13].
The key performance indicators of OPA systems include the steering angle, scanning speed, power consumption, efficiency, and the spatial beam quality, which is affected by unwanted side lobes [
8,
14,
15]. The previously reported OPA technologies exhibit a steering angle of ~80°, beam widths as narrow as ~0.03°, and scanning speed of a few nanoseconds, which allow their ready use in real field applications. Among the performance indicators, the side-lobe level (SLL)—defined as the ratio of the side lobe power to the main lobe power of a far-field radiation pattern—is one of the important performance indicators for the OPA used in real-field applications. The SLLs are reported to be relatively high, approximately equal to −12 dB [
10,
11,
12,
13]. The required SLL for practical applications is expected to be 30 dB to prevent unwanted effects, such as false target indications and interference signals [
1,
3]. Consequently, significant reduction of the SLL is fundamental to ensure high performance of OPA applications in high-fidelity areas, such as in the military, medicine, and communications [
4,
5,
6,
7,
8,
9].
Herein, we propose the application of a novel amplitude profile to the OPA elements by using the optical amplitude (AM) and phase modulation (PM) of optically injection-locked (OIL) semiconductor lasers to increase the SLL reduction as well as to achieve beam steering with increased frequency stability. The proposed OPA uses a master laser (ML) and a slave laser (SL) array to construct the OIL laser configurations. The SL array is frequency-locked to the single ML. The injection- locking parameters, detuning frequency, and injection ratio between the ML and each SL are changed to achieve the desired AM and PM.
We first introduce the concept of the active OPA configuration based on the OIL laser. We calculate the required profile of the amplitude and phase distributions of the optical elements to achieve an increased SLL reduction. The optical signal of each OPA element that enables the required amplitude and phase profile can be generated by controlling the injection-locking parameters between the ML and SL. The process is presented in detail by introducing the relationship between the injection-locking parameters and injection-locked amplitude/phase in the injection-locking map. Finally, we demonstrate a theoretical improvement of the OPA far-field pattern based on OIL laser arrays with the amplitude profile of a Taylor window function. The OIL-based OPA with the amplitude profile of a Taylor window function yielded a considerably low SLL value of 30 dB, which exhibited a reduction of >16 dB when compared with the uniform amplitude profile case. The optical beam profile of the OIL-based OPA maintained an enhanced reduction in the SLL performance during beam scanning. Consequently, the reduced SLL performance and high power efficiency achieved with the simple OPA configuration support the viewpoint that amplitude and phase modulation of OIL lasers can expedite the use of OPA in current real field applications, such as free-space communication, imaging, and LIDAR [
4,
5,
6,
7,
8,
9].
2. Active OPA Based on an OIL Laser
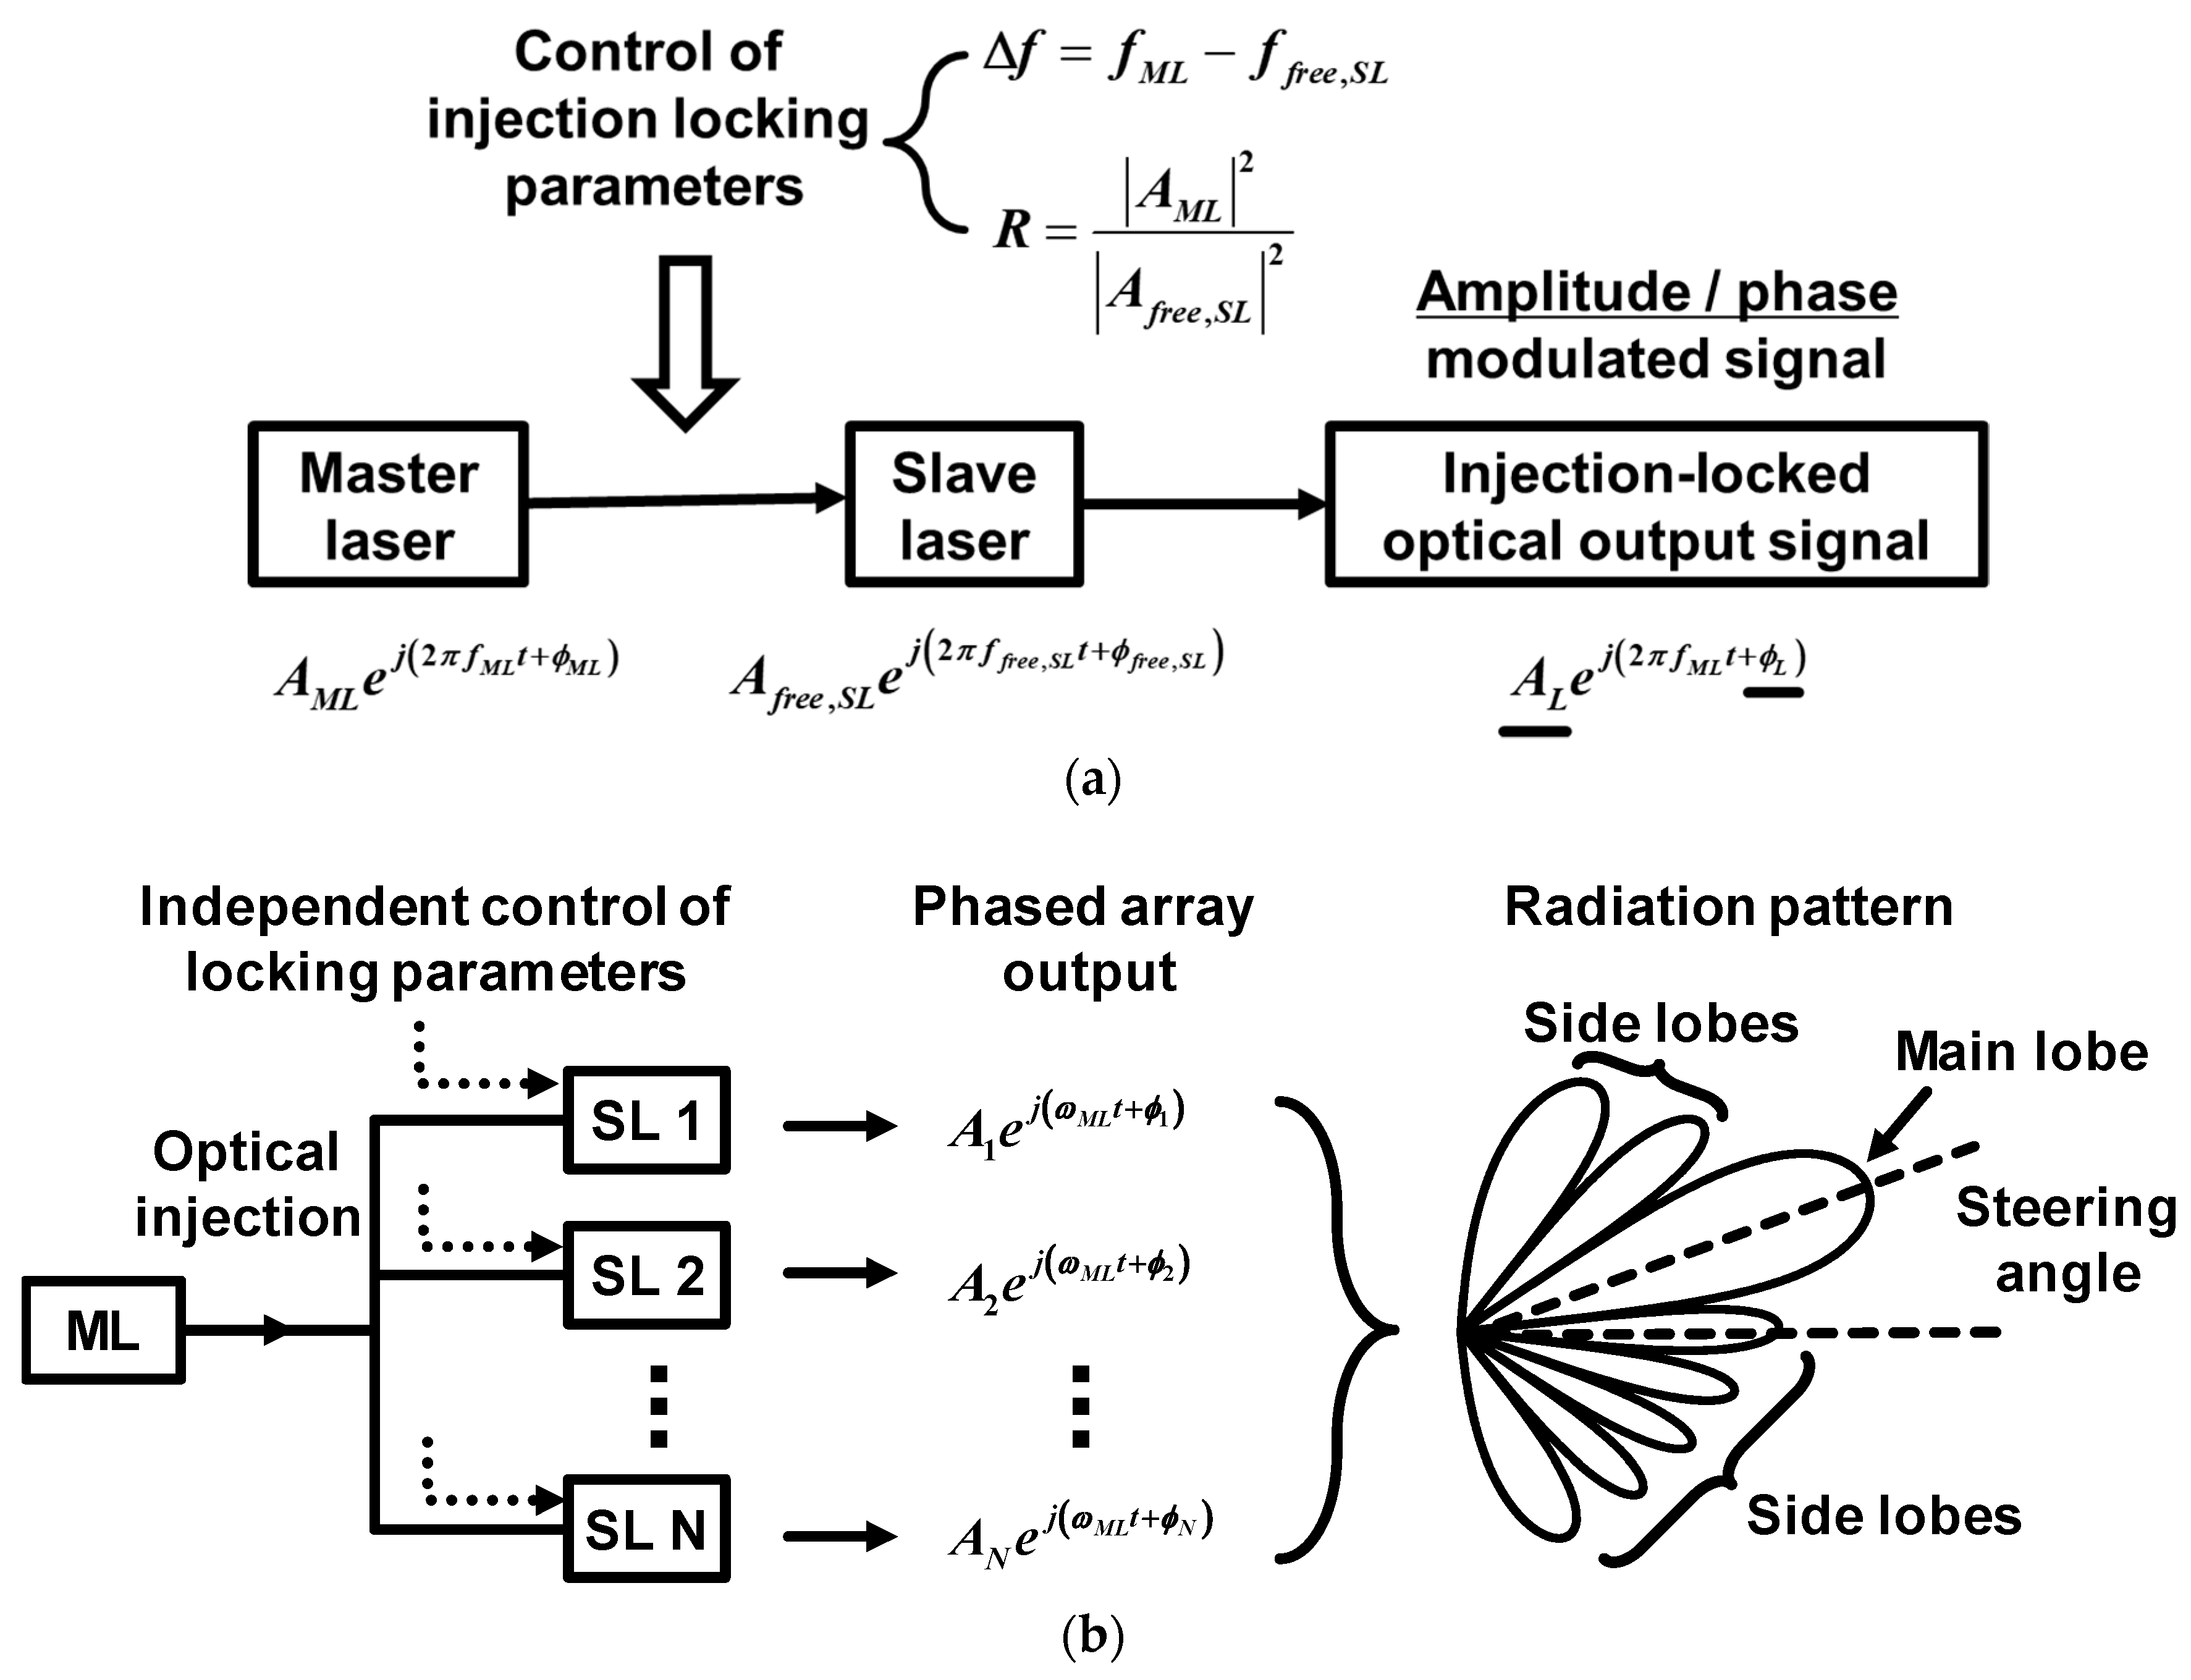
Figure 1a shows the schematic of the optical amplitude/phase modulation based on the OIL laser. The OIL laser configuration consists of two lasers, namely, the ML and SL. The optical signal of the ML with a field amplitude
, frequency
, and an optical phase, are injected to the SL. When the two injection-locking parameters, namely the detuning frequency (
) and injection ratio (
), are properly controlled within the stable locking regime, the SL output yields the injection-locked output at the same frequency as the ML frequency
with a locked phase
and a field amplitude
, respectively [
16,
17]. The notations
,
, and
denote the frequency, field amplitude, and photon number of the free-running SL, respectively, while
and
are the frequency and photon number of the ML, respectively. Both the field amplitude
and phase
of the injection-locked output signal are functions of the two injection-locking parameters. Therefore, they can be modulated concurrently by controlling the injection-locking parameters. One of the injection-locking parameters, the injection ratio
, can be changed using various methods. These include the use of injection power control based on the insertion of the optical amplifier or attenuator in front of the SL, the use of direct power control of the ML, and the use of direct power control of the SL. The other injection-locking parameter, the detuning frequency
, can be changed by varying the optical frequency of the ML
or the free-running frequency of the SL
. For example, the free-running lasing frequency of the SL can be tuned by controlling the SL temperature at a constant ML frequency, which changes the detuning frequency
. We reported previously that the two locking parameters can be simultaneously controlled by changing the bias current of the semiconductor SL because both the output power and lasing frequency of the free-running SL are functions of the bias current of the semiconductor SL [
16,
17,
18]. The AM and PM can be achieved with a high optical output power based on the direct AM of the SL without the use of external amplitude and phase modulators [
18]. The AM/PM optical signal configuration based on the physics of the OIL semiconductor laser is presented in
Figure 1a.
Based on the advantages of the OIL semiconductor laser for OPA applications, such as its AM, PM, and the frequency-locking capabilities, we propose a novel active OPA, namely the OIL-based OPA, as shown in
Figure 1b. The OIL-based active OPA is composed of a single ML and an array of amplitude-modulated SLs. The optical signal of the ML with field amplitude
, frequency
, and optical phase
is injected into the SL arrays to produce frequency-locked optical signals at the ML frequency of
. By changing the injection-locking conditions (e.g. applying the appropriate bias current to each SL element), the corresponding injection-locking parameters between the ML and each SL element can be controlled within a stable locking range. The amplitude
and phase
of each OPA element can be controlled by the locking-parameters to produce the desired profiles of the phase and amplitude distributions of the OPA elements. Consequently, a narrow and steerable optical beam can be achieved by the spatially constructive interference of the AM/PM signals between the phased array elements.
Figure 1b also shows the far-field pattern of the OIL–OPA, which consists of one main lobe and many side lobes. Owing to the high-power characteristic of the OPA elements along with strong injection-locking capability and direct modulation of the SL array, the proposed active OIL–OPA configuration exhibits high power efficiency as well as enhanced field pattern property owing to SLL reduction, as discussed in the following section.
3. Results
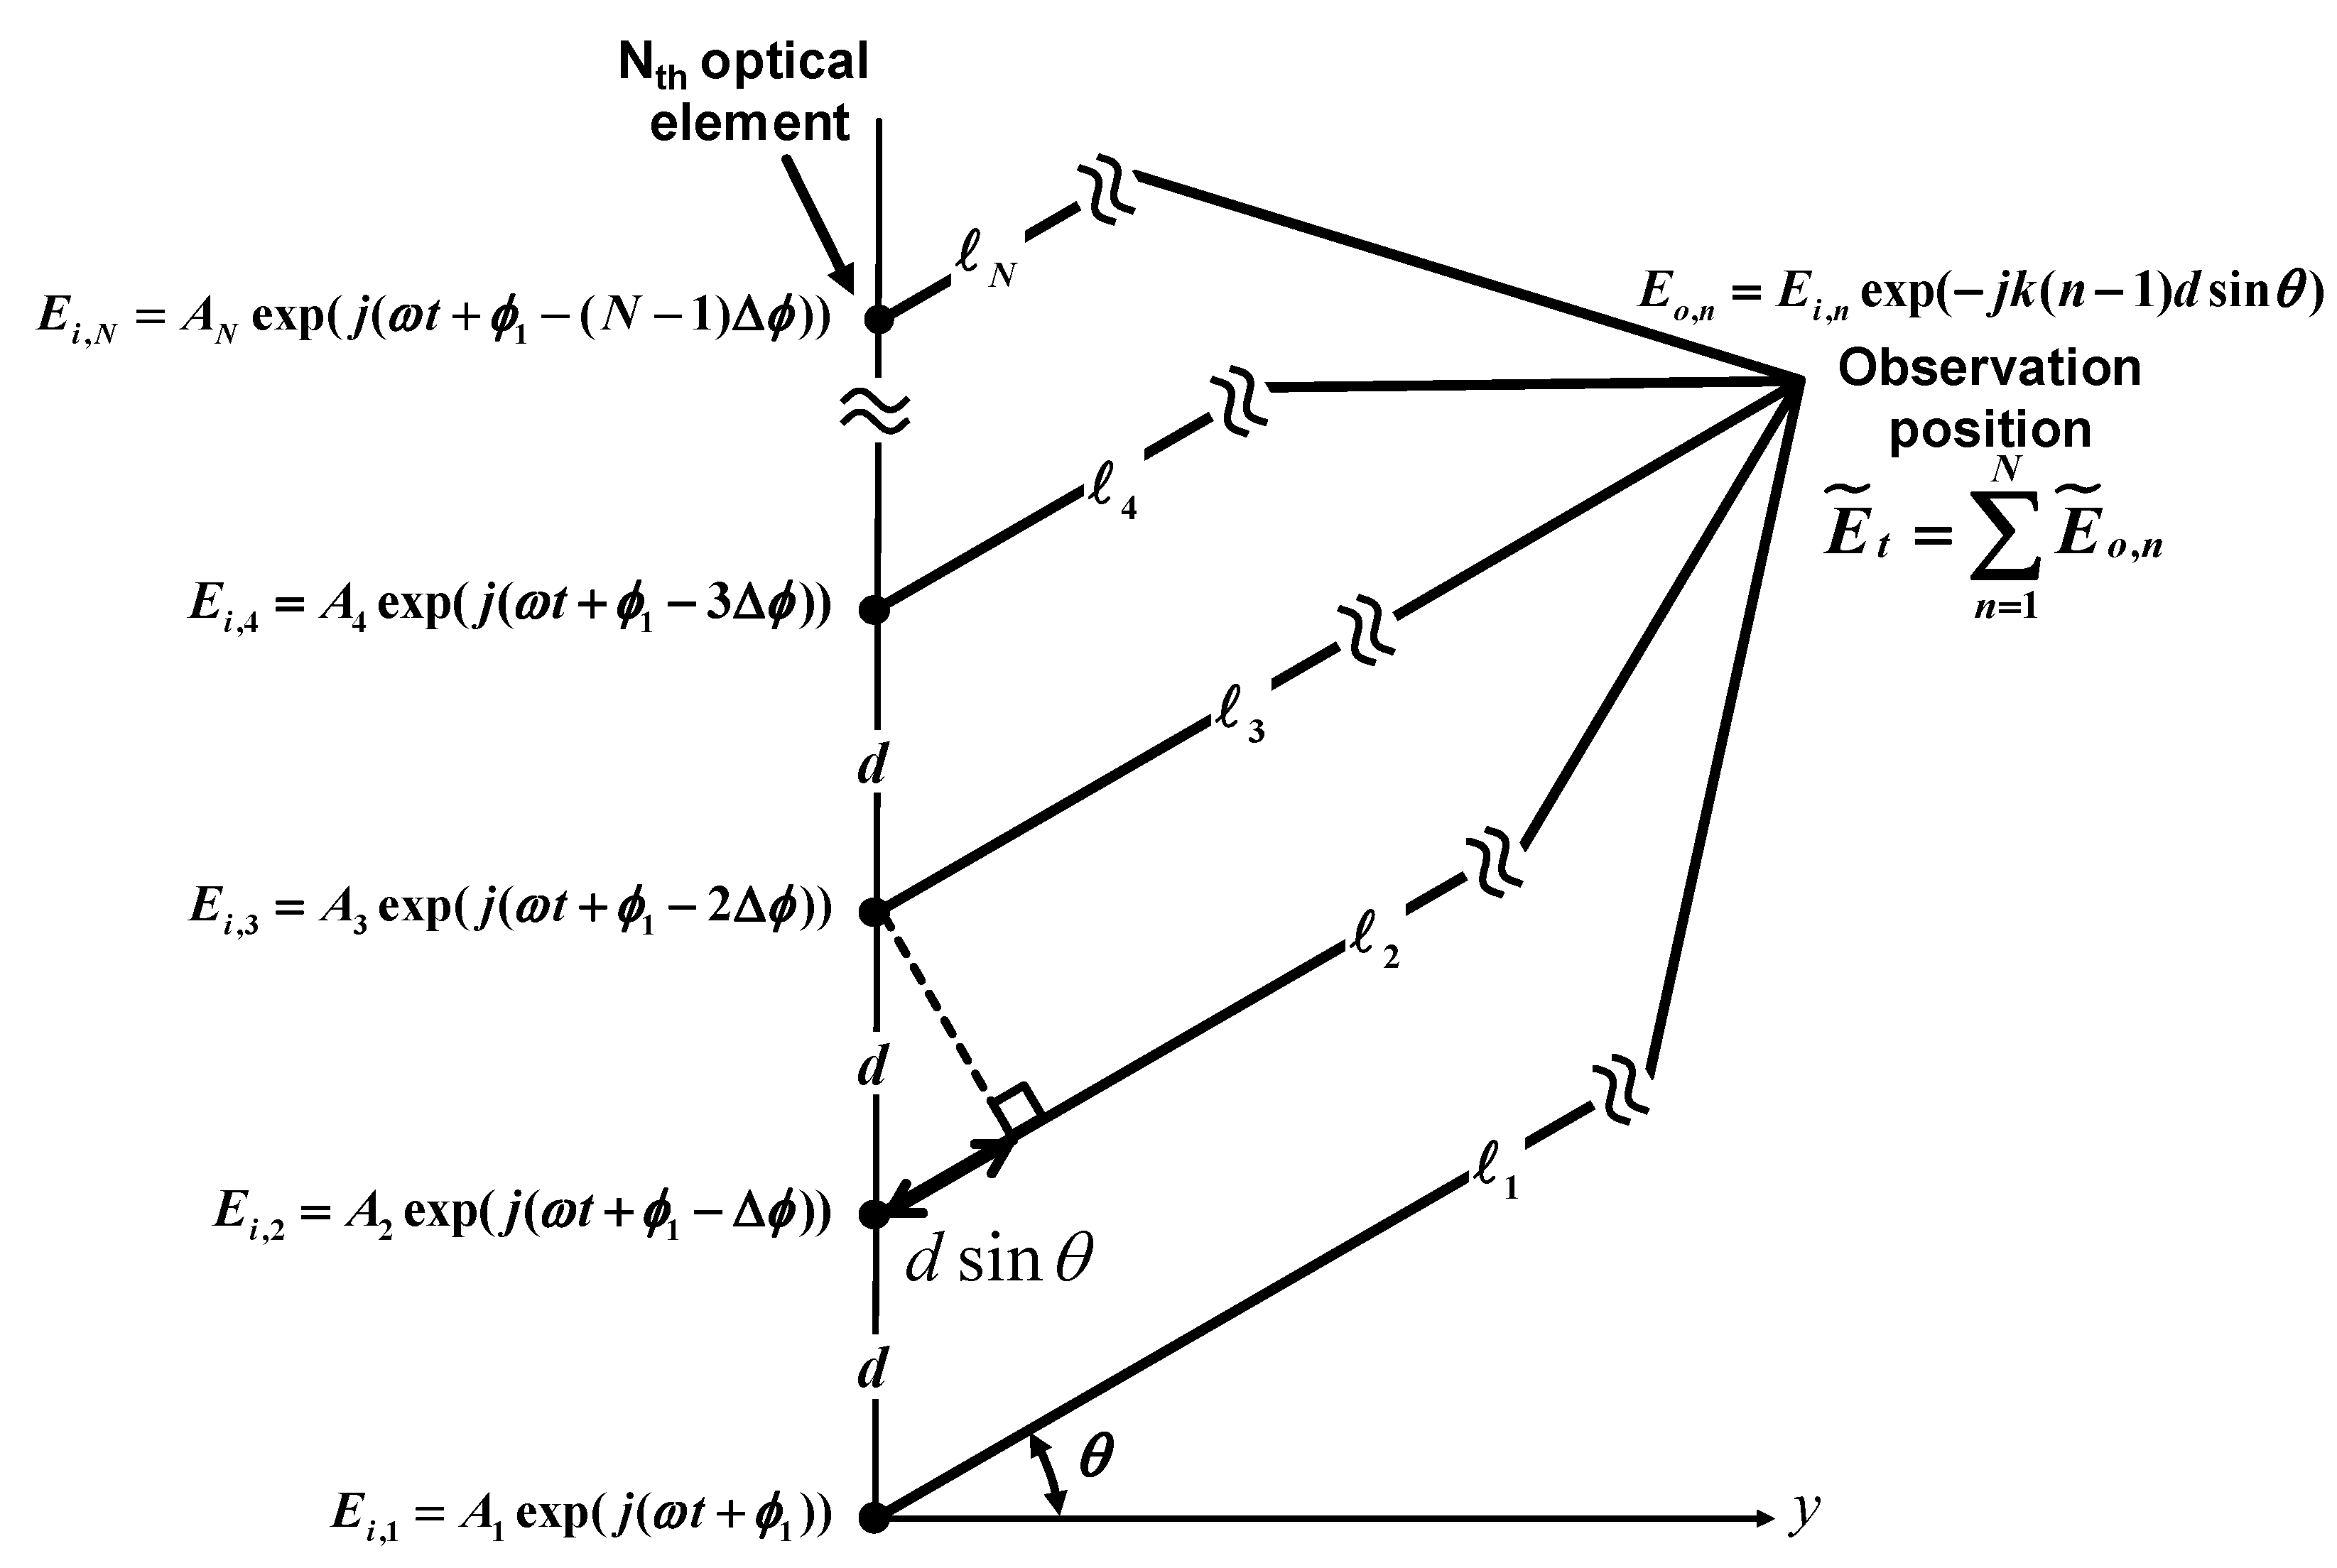
Figure 2 shows the schematic of the construction of the far-field radiation pattern of the OPA elements. The OPA structure consists of an array of N optical elements such that the optical signal of the n-th element is expressed as
where
is the optical field of the n
th element at the OPA position,
is the wave number,
(
) is the distance from the n
th array element to the observation point,
is the optical field amplitude of the n
th element,
is the optical angular frequency,
is the optical phase of the n
th element,
is the phase difference between two elements,
is the distance between two elements, and the steering angle
is the angle between the observation direction and the perpendicular component of the OPA axis (i.e., the y-axis in
Figure 2). The total field expression of the N-element OPA at a far (observation) position is obtained as
where the array factor (
) is defined as
Equation (2) shows that the far-field radiation pattern can be tailored by the
. Equation (3) shows that the
depends on the element field amplitude
, element number
, distance
, and phase difference
. This also shows that the element field amplitude
yields a finite Fourier transform relation with the
in which the element field amplitude
can be written in terms of a window-function in the form of [
19],
Equation (3) shows that SLL, which is the one of the important performance indicators, exhibits a strong dependence on the distribution of the element field amplitude
. By choosing the appropriate window function
for the amplitude distribution
of the array elements, we can obtain the far-field radiation patterns with enhanced SLL performances.
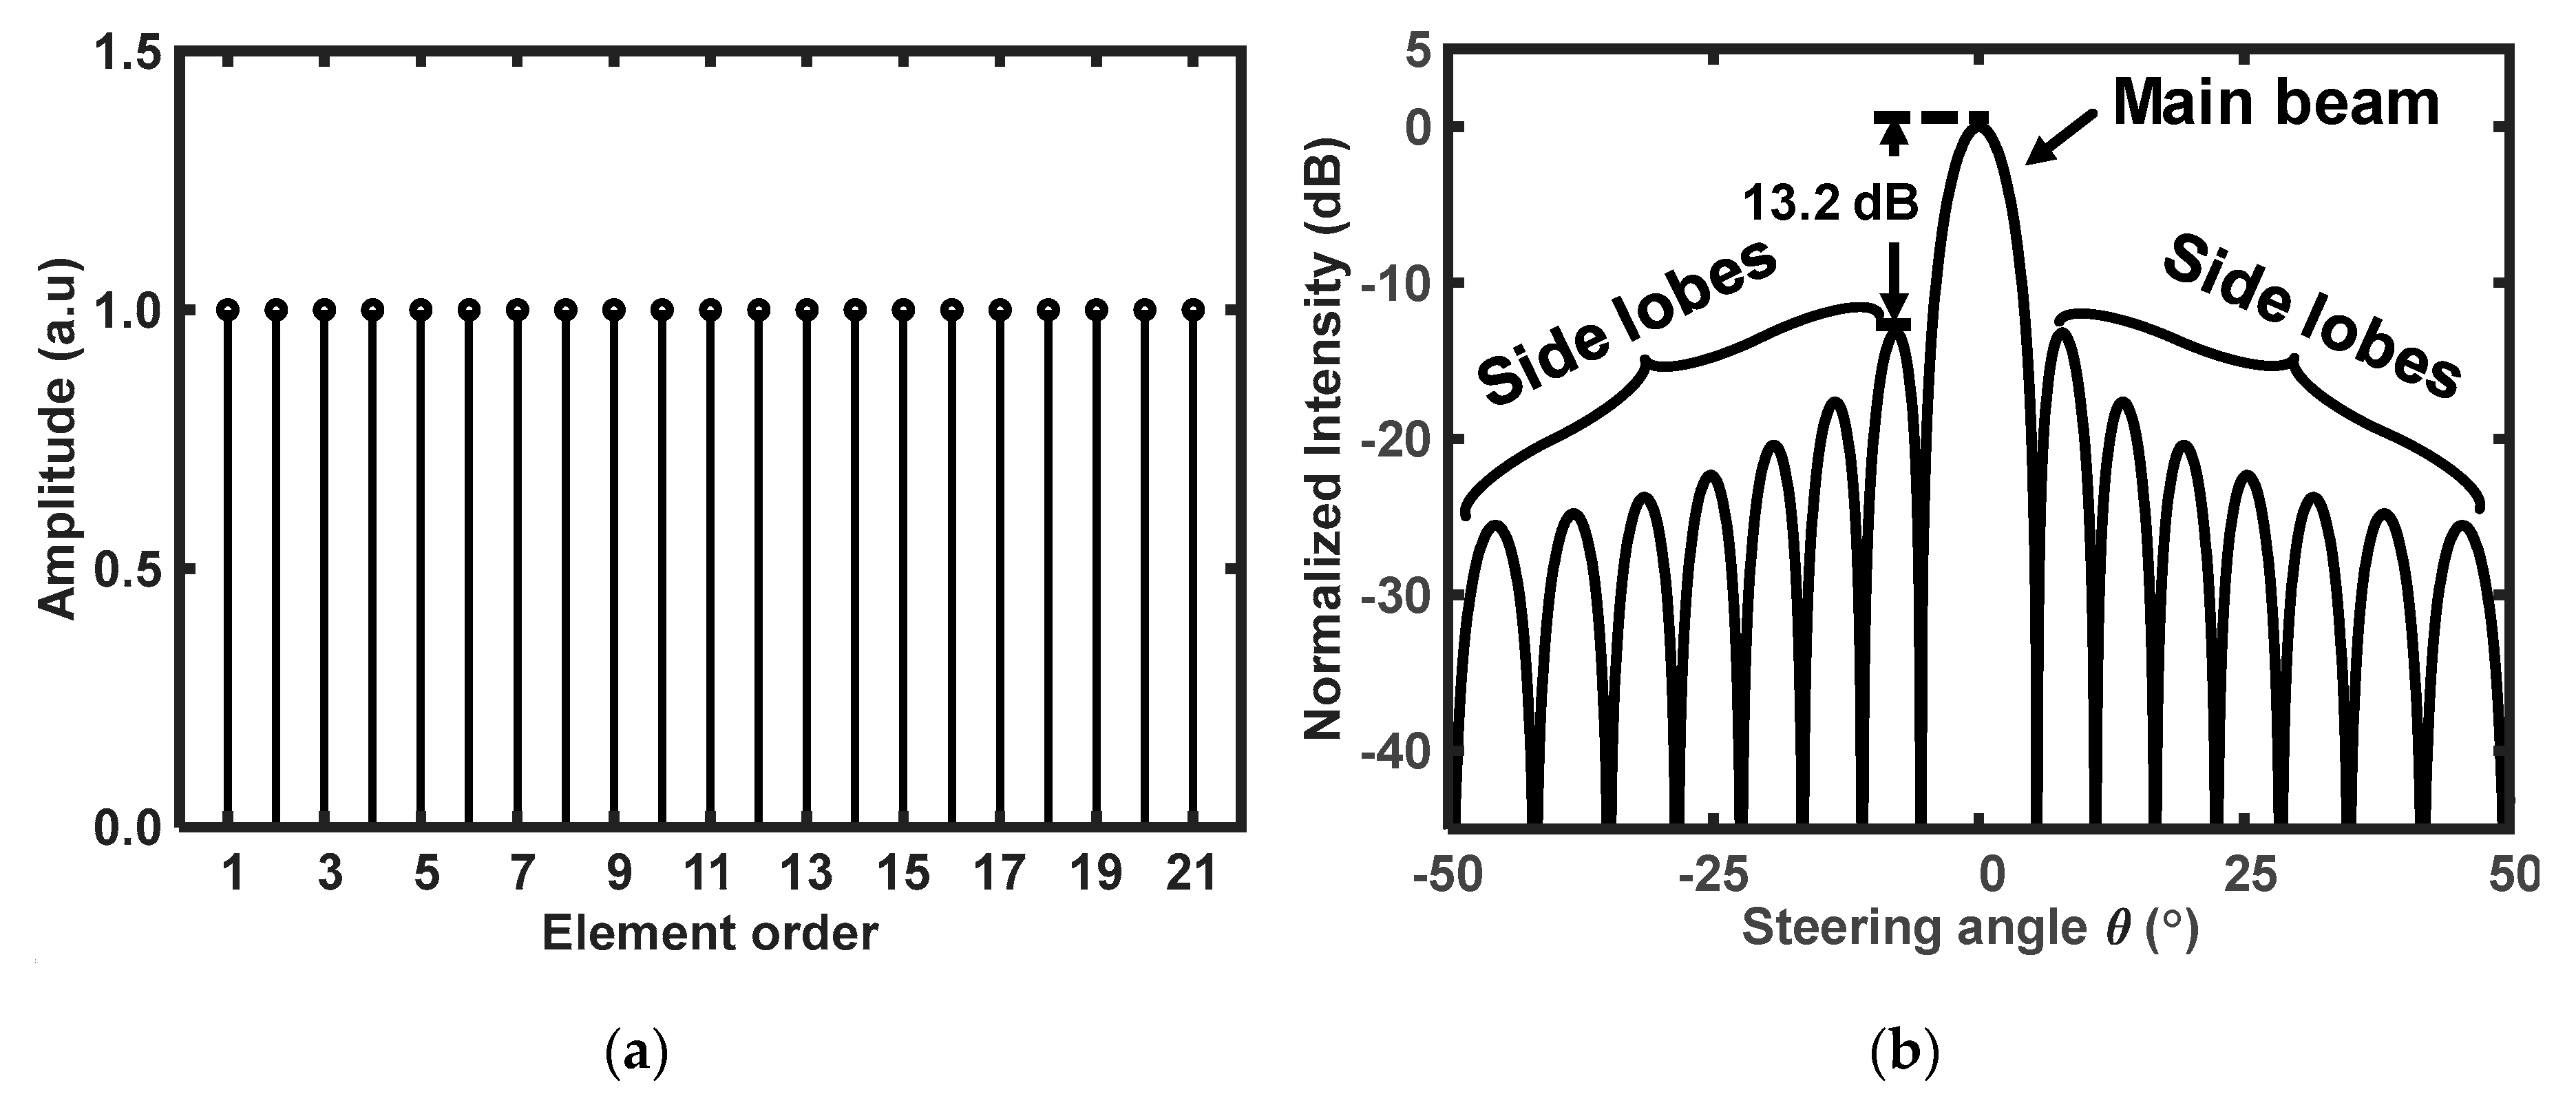
Figure 3a shows the distribution of the rectangular window functions of the 21 OPA elements in which all the relative amplitudes are equal.
Figure 3b shows its Fourier transform (plotted based on a decibel scale), which is identical to the far-field radiation pattern of the OPA. The distance
between successive elements is set to be equal to half the optical wavelength, and the phase difference
is set at 0°.
Figure 3b shows the far-field radiation pattern of the OPA, which consists of a main lobe at the same angle as the maximum
position as well as other side lobes. The steering angle
of the main beam is
Equation (5) shows that the steering angle can be changed by controlling the phase difference between the OPA elements. Equation (5) shows that only one maximum value of the AF exists in the
range of [−90°,90°] when the distance between two adjacent elements is not larger than half a wavelength.
Figure 3b shows the high SLL of −13.2 dB, which limits the OPA performance.
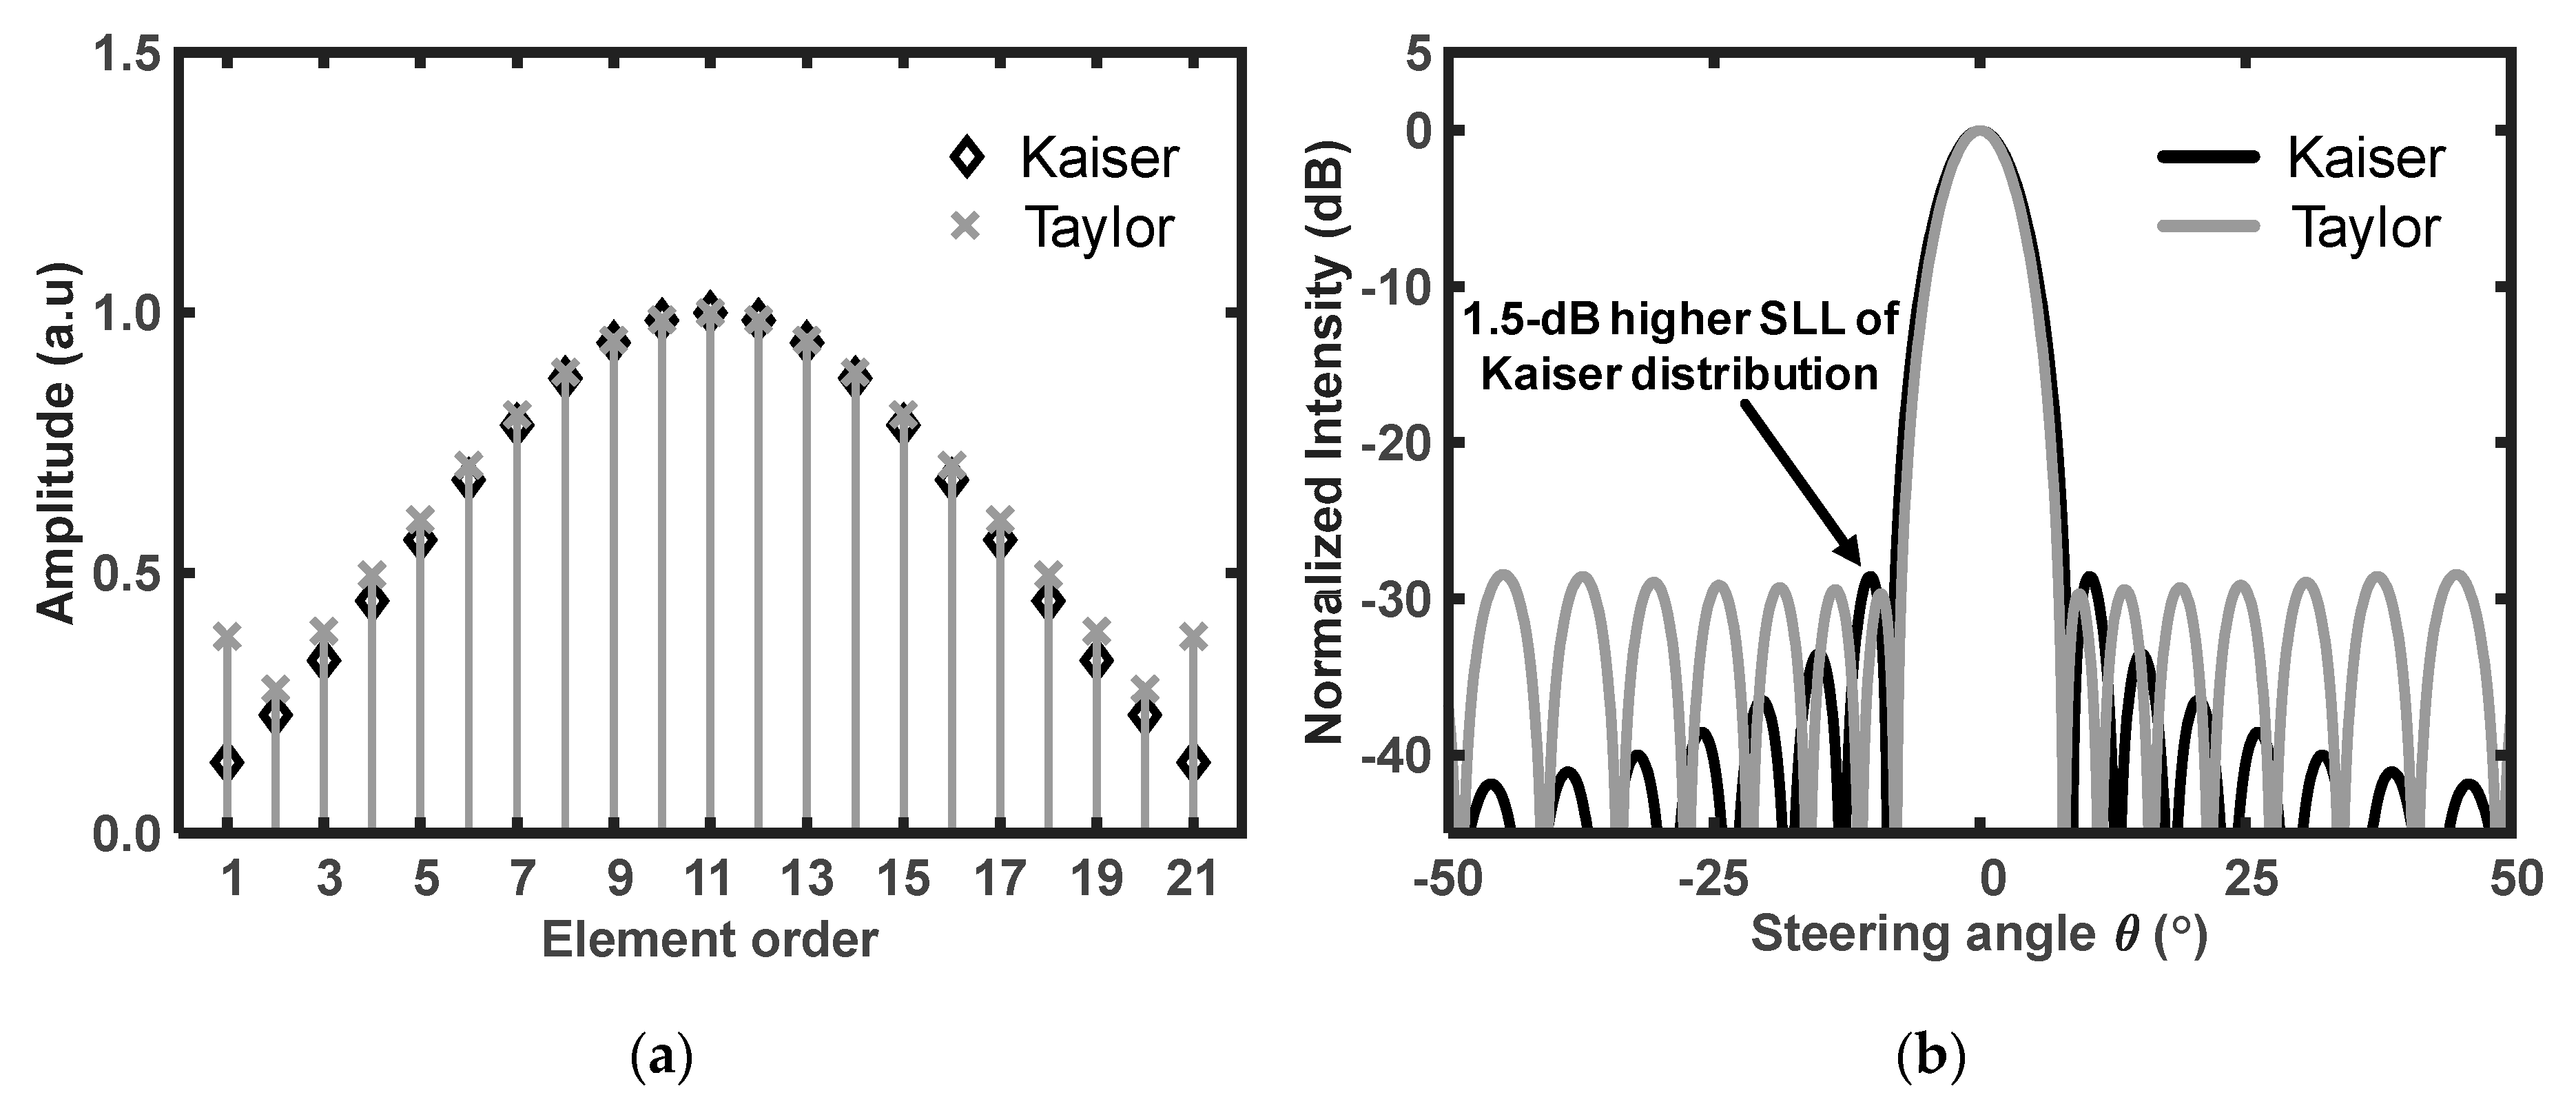
Herein, we introduce the Kaiser and Taylor windows [
20,
21], which can select specific SLL profiles to achieve the reduction of the SLL.
Figure 4a shows the distribution of the element field amplitudes of the Kaiser and Taylor windows, the amplitude distributions of which are gradually tailed off to the edges. The Taylor window profile exhibits slightly increased amplitude profiles at the edges compared with the Kaiser window.
Figure 4b shows the patterns of the Kaiser and Taylor windows. The target SLL is −30 dB. Both patterns exhibit significantly lower SLL than that of the rectangular window. The SLL adjacent to the main lobe in the case of the Kaiser window is slightly higher than that in the case of the Taylor window. Although the difference in the levels of the adjacent side lobes is small, the Taylor window is a more appropriate selection for the field amplitude distribution
for the reduction of the SLL of the OPA pattern because the adjacent side lobes affect the OPA performance considerably.
We propose the OPA configuration with the desired window function to achieve an improved SLL reduction performance. This is based on the AM/PM of the OIL semiconductor laser by controlling the injection-locking parameters. The PM in each SL element can produce the desired
for beam steering, and the AM in each element can produce the desired field amplitude distribution
for the SLL reduction. Both the PM and AM processes can be simultaneously achieved in each SL by properly adjusting the injection-locking parameters. The relationship between the AM/PM amount and the injection-locking parameters is simulated based on the standard coupled-rate equations. The equations exhibit a dependence on the amplitude and phase of the OIL laser in the cases of the two injection-locking parameters, detuning frequency
and injection ratio
, as described in [
16,
17,
18],
where
,
, and
are the photon number, phase, and carrier number of the injection-locked SL, respectively. Additionally,
(
) is the detuning angular frequency,
is the linear gain,
is the transparency carrier number of the free running SL,
is the photon decay rate,
is the carrier decay rate,
is the field coupling ratio between the ML and SL, and
is the linewidth enhancement factor of the laser. To achieve the desired amplitude
and phase
, we directly controlled the bias current of the SL that is represented in Equation (8) by means of the number of electrons
. The angular frequency difference between the ML and SLs
also affects the phase of the injection-locked SLs, as described below [
18].
and
where
and
are the steady-state photon and carrier numbers.
Therefore, the injection-locking equations listed above explain that the desired amplitudes and phases of the OPA elements can be achieved by varying the injection-locking parameters [
16,
17,
18].
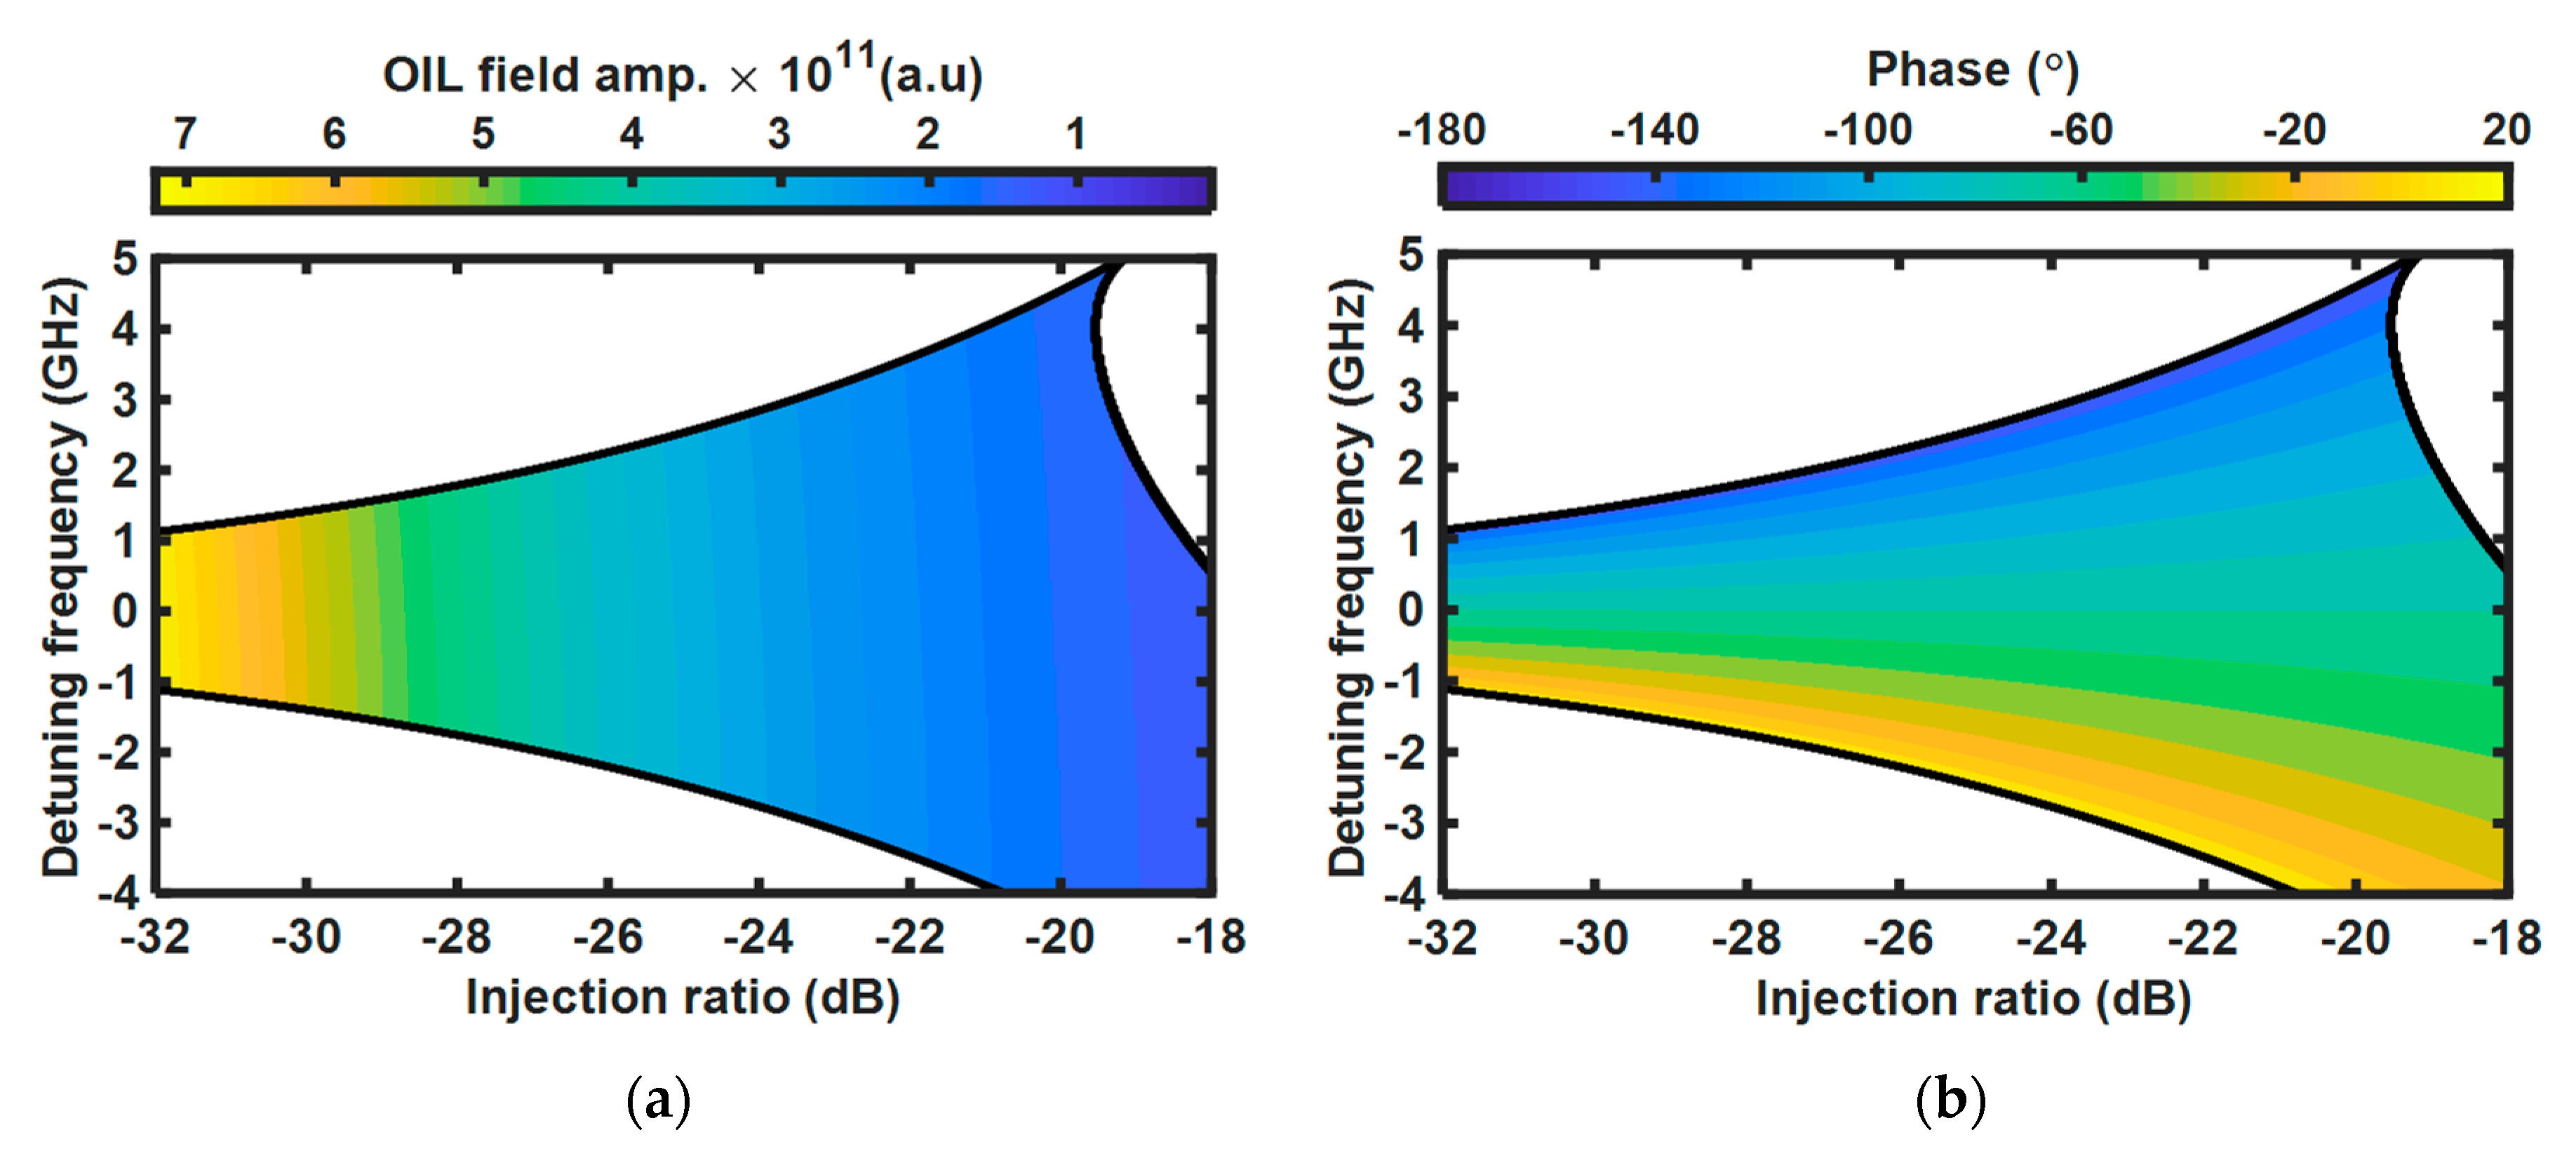
Figure 5 shows the injection-locking maps as a function of the detuning frequency and injection ratio. The stable locked regime in which the output signal is in steady state is depicted as a colored region. The injection-locking simulation parameters are listed in
Table 1. The amplitude of the OIL laser as a function of the injection parameters of the SL is shown as a color scale map in
Figure 5a. This map shows that the amplitude of the OIL laser can be modulated by controlling the two injection-locking parameters. Similarly, the color scale map in
Figure 5b represents the phase shift of the injection-locked laser as a function of the injection-locking parameters. Any pair of the two injection-locking parameters, i.e., the injection ratio and detuning frequency, corresponds to specific positions on the map. Consequently, we can concurrently achieve the desired AM and PM of the SL by simultaneously controlling the relevant injection-locking parameters. It is noted that in real applications, the precise look-up tables for each OIL-OPA element, which reveal the relationship between the locking conditions and the amplitude/phase of the injection-locked SL, should be experimentally investigated.
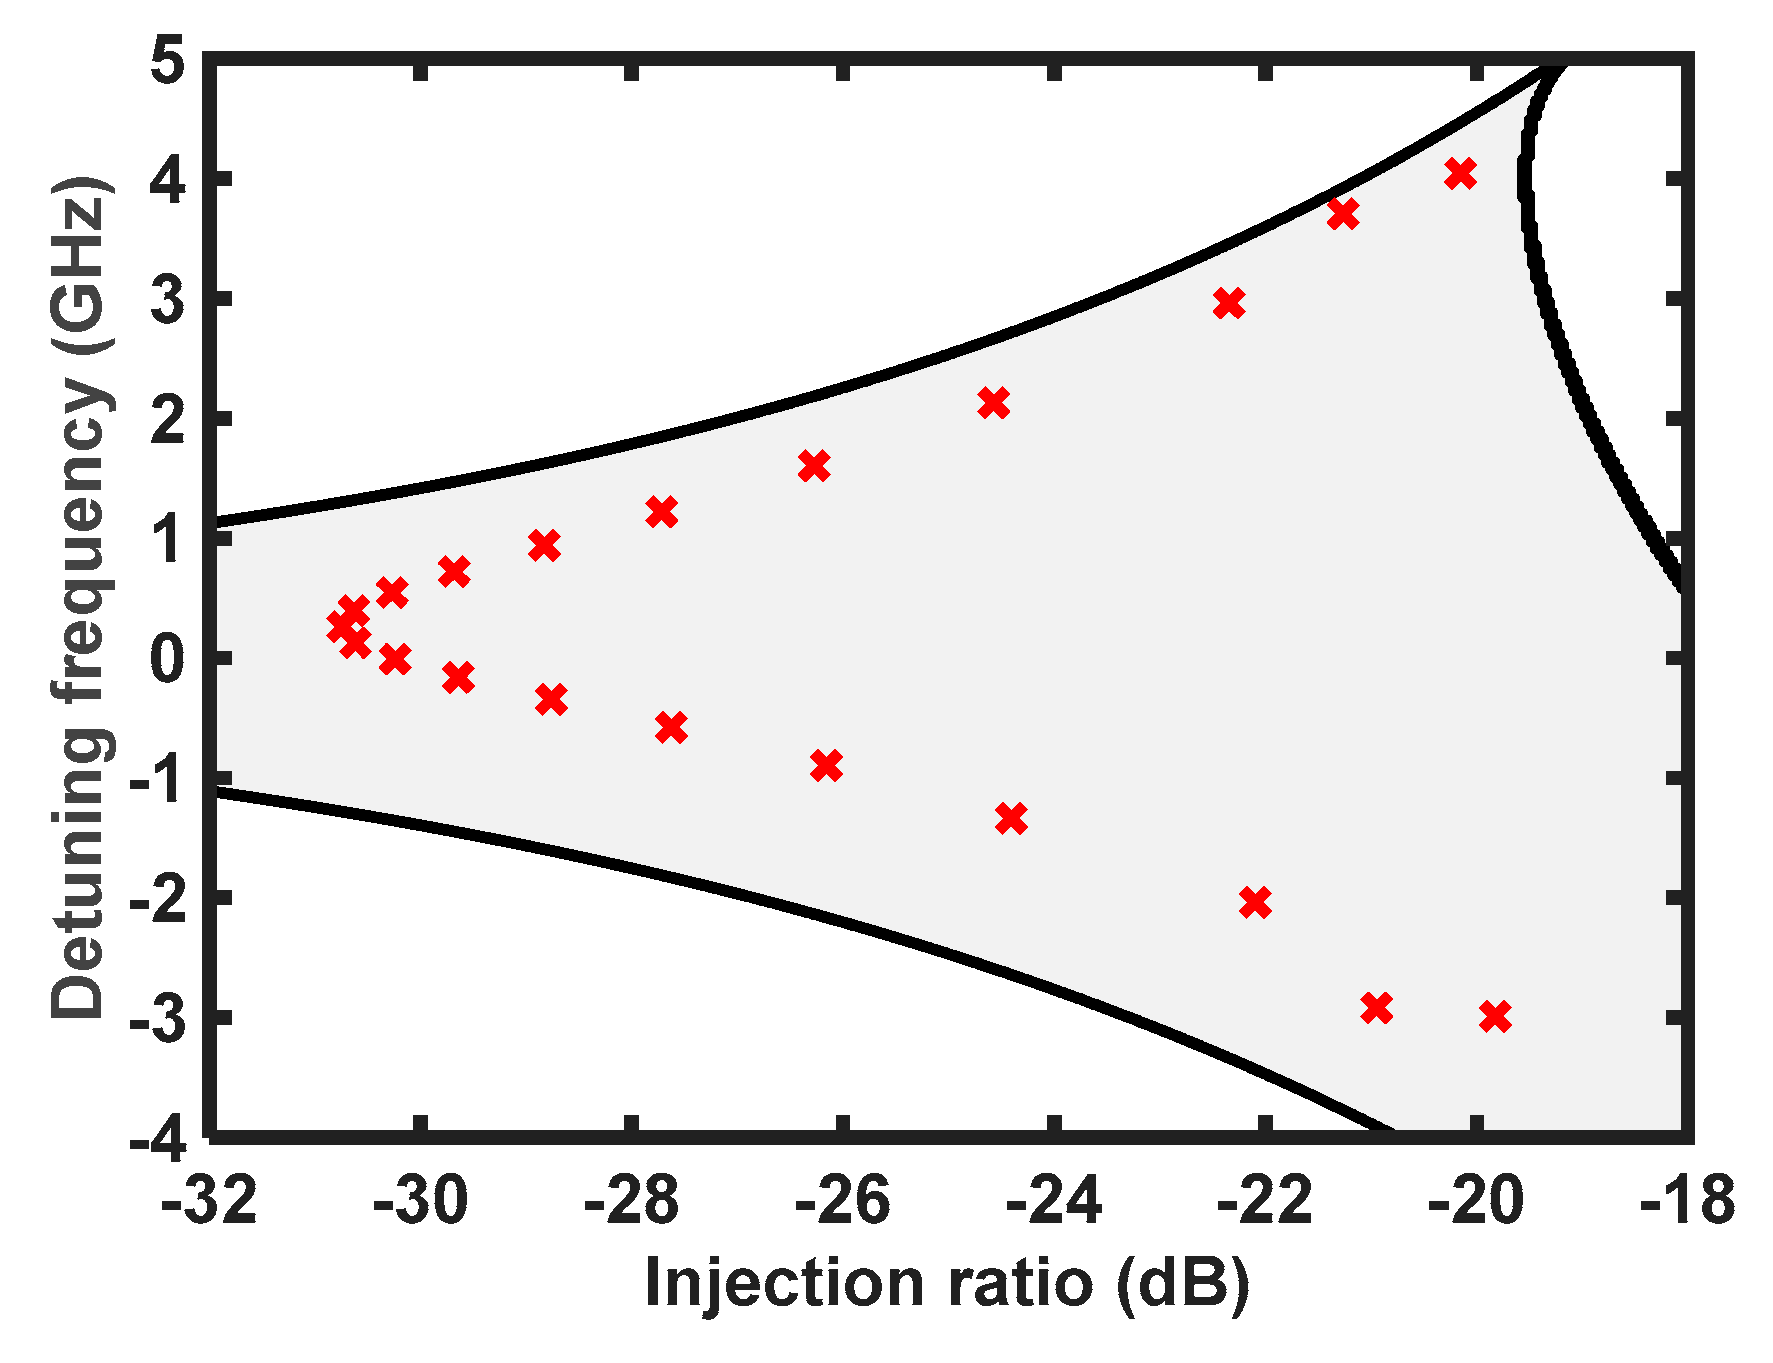
Figure 6 shows the distribution of the 21 elements of the OIL–OPA on the injection-locking map as a function of the detuning frequency and injection ratio. Each pair of the optical field amplitude and phase for an SL can be obtained by the corresponding pair of the detuning frequency and injection ratio, as shown in
Figure 5. Therefore, by properly choosing the combination of the two injection-locking parameters, we can achieve the desired optical field amplitude distributions
and the desired phase distributions of
(=
) for the 21 OPA elements.
Figure 6 explains that the injection-locking parameters of the 21 elements of the OIL–OPA should be set at the cross-mark positions to achieve the Taylor distribution of the amplitude distribution (as that shown in
Figure 4a) and the target phase difference
between the adjacent elements.
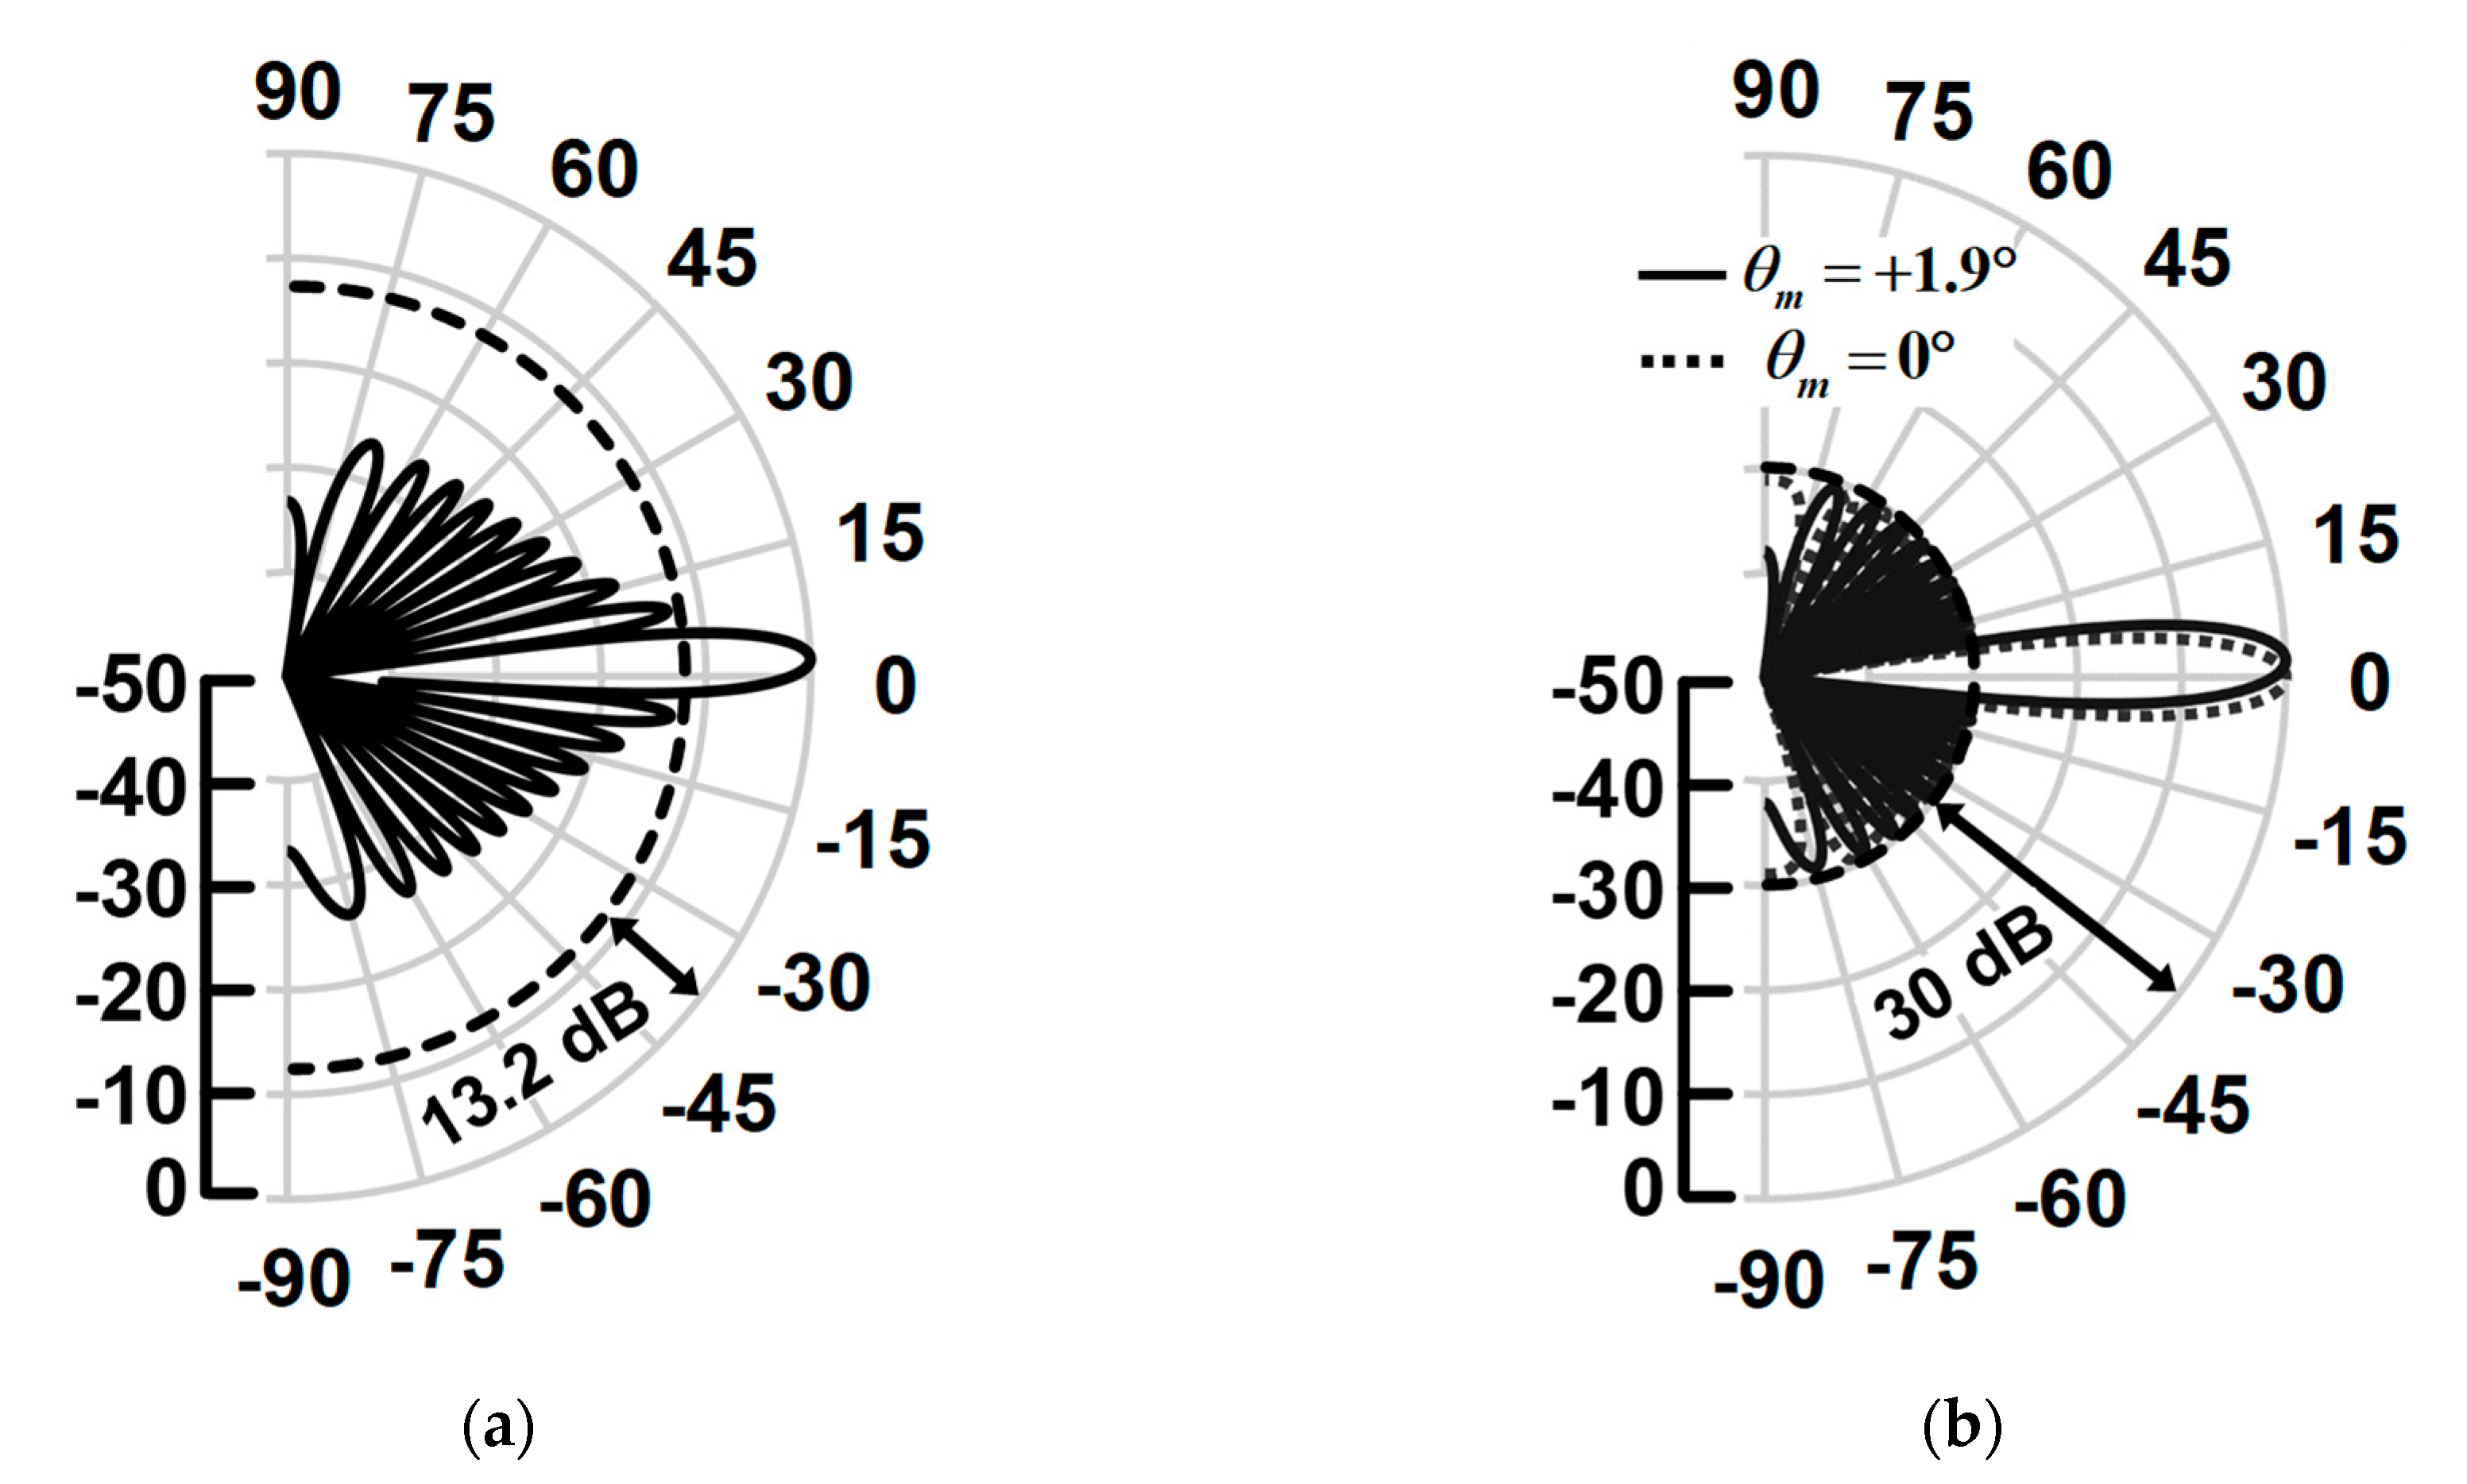
Figure 7a shows the far-field radiation pattern of the OPA without the control of the AM distribution (i.e., uniform distribution) for
and the corresponding steering angle of
. It exhibits an SLL of −13.2 dB.
Figure 7b shows the enhanced far-field radiation patterns of OPA based on the use of the Taylor window distribution according to the locking condition control of the OIL laser, as described in
Figure 6. The calculation was performed for the beam angles of
and
. By achieving the appropriate injection-locking condition for each OPA element (as shown in
Figure 6), we achieved OPA far-field radiation patterns with a low SLL of −30 dB, which corresponds to a reduction of >16 dB when compared with the uniform amplitude profile case for beam steering.
The proposed OIL–OPA technique enables the high fidelity of the OPA beam patterns because of the reduced SLL as well as the other optical beam quality improvements, such as laser chirp reduction, narrow beam performance, and relative intensity noise reduction, which are the inherent advantages of the OIL laser.


