3.1. Experimental Results
Using the setup of
Figure 2, we first measured the static characteristics of the studied SRL. The output power of the two directional modes is shown in
Figure 3 as a function of the laser injection current (without pumping the SOAs in the FOF arms). The threshold current of this device was 34 mA. For all currents not too far above threshold, the power in the two directional modes was roughly equal, showing that this SRL always operates in the bidirectional regime [
13], which indicates that there was a substantial amount of backscattering in SRLs fabricated on the used platform. For some laser bias currents, the SRL emitted in a single longitudinal mode, but for most values of the laser injection current, the laser emitted multiple longitudinal modes. The longitudinal mode spacing was measured to be 0.2 nm. The DBRs in the FOF arms have a peak intensity reflection of 0.58 and a reflection bandwidth of 2 nm. In [
11] we have shown that a sufficiently large amount of feedback in either of the FOF channels resulted in single longitudinal mode operation, that the wavelength of the emitted mode could be changed by changing the DBR center reflection wavelength, and that this wavelength could be fine-tuned using the phase shifters in the FOF arms.
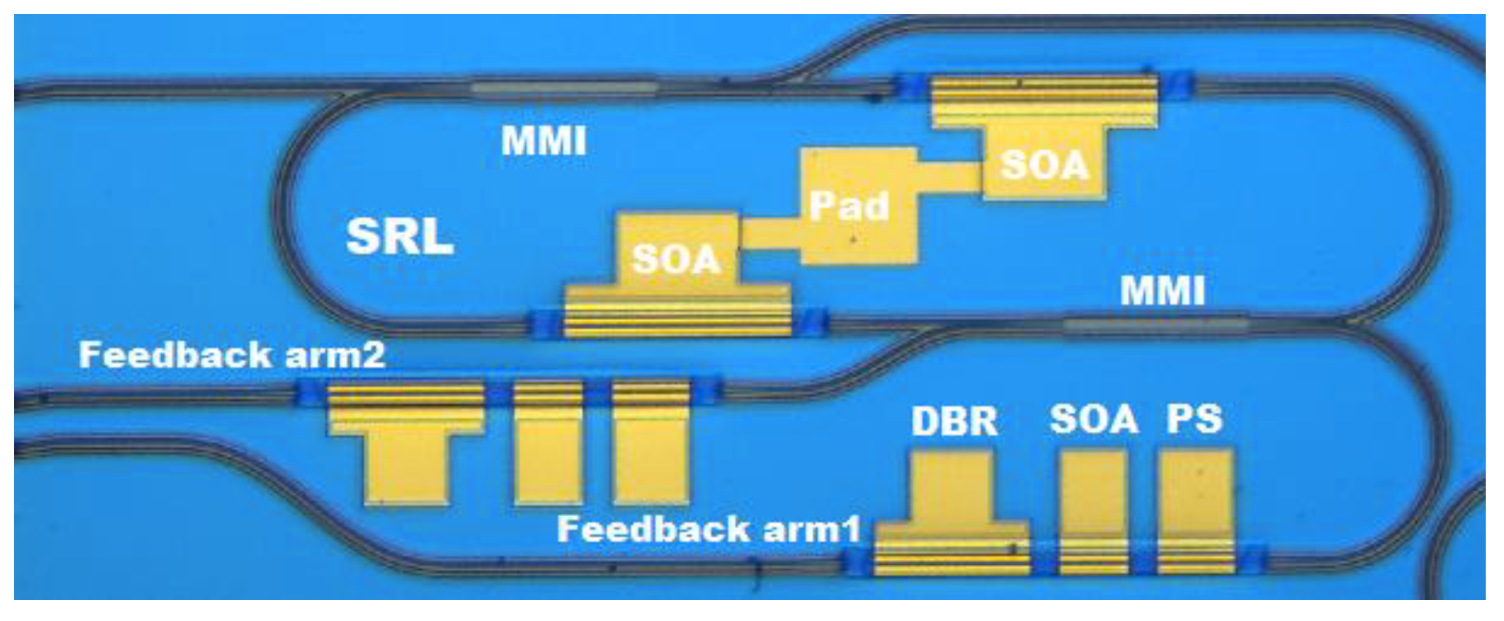
If we only applied FOF in one of the arms, the FOF had an additional effect that made the SRL somewhat unidirectional. This is illustrated by the measurement shown in
Figure 4, where we plot the power in the two directional modes as a function of the current I
SOA1 injected in the SOA of FOF arm 2 in
Figure 1. The laser current I
laser was kept constant, as shown in
Figure 4, at a value of 60 mA. For low values of I
SOA1, most power was emitted in the CW direction. But as I
SOA1 was ramped up, the power in the CCW direction gradually increased at the expense of the power in the CW direction. This is to be expected from the feedback configuration used in this experiment as the FOF in feedback arm 2 coupled light from the CW direction into the CCW direction. The power distribution over the two directional modes is further detailed at the right-hand side of
Figure 4, where we plot the ratio between the power in the CCW direction and the power in the CW direction. This so-called directional mode suppression ratio (DMSR) increased most strongly when I
SOA1 increased from 0 to 11 mA, and then continued to increase at a slower pace for still higher values of I
SOA1.
Based on
Figure 4, we identified three interesting bias points (indicated by the black arrows) at which we wanted to investigate the sensitivity to COF. The first bias point, BP1, corresponds to I
SOA1 = 0 mA, as in that case there was no FOF and we measured the feedback sensitivity of the SRL itself. The second bias point, BP2, that we would further investigate corresponds to I
SOA1 = 11 mA, as in this case the FOF clearly favored the CCW directional mode. Finally, the third selected bias condition, BP3, corresponds to I
SOA1 = 30 mA and in this case the directional mode suppression ratio was greatest. For BP2 and BP3, the SRL emitted a single longitudinal mode whose wavelength of 1551.555 nm was determined by the reflection spectrum of the DBR in feedback arm 2. For BP1, the output of the SRL was also single-mode but the emission wavelength of 1538.405 nm was determined by the gain maximum.
Next, we measured time traces of the intensity in the CCW direction for different values of the current I
SOA2 injected in the external SOA. We first calibrated the amplification of the external amplifier by measuring the power transmitted through the external SOA as a function of its bias current (while keeping the laser current I
laser and the FOF current I
SOA1 constant). For small values of I
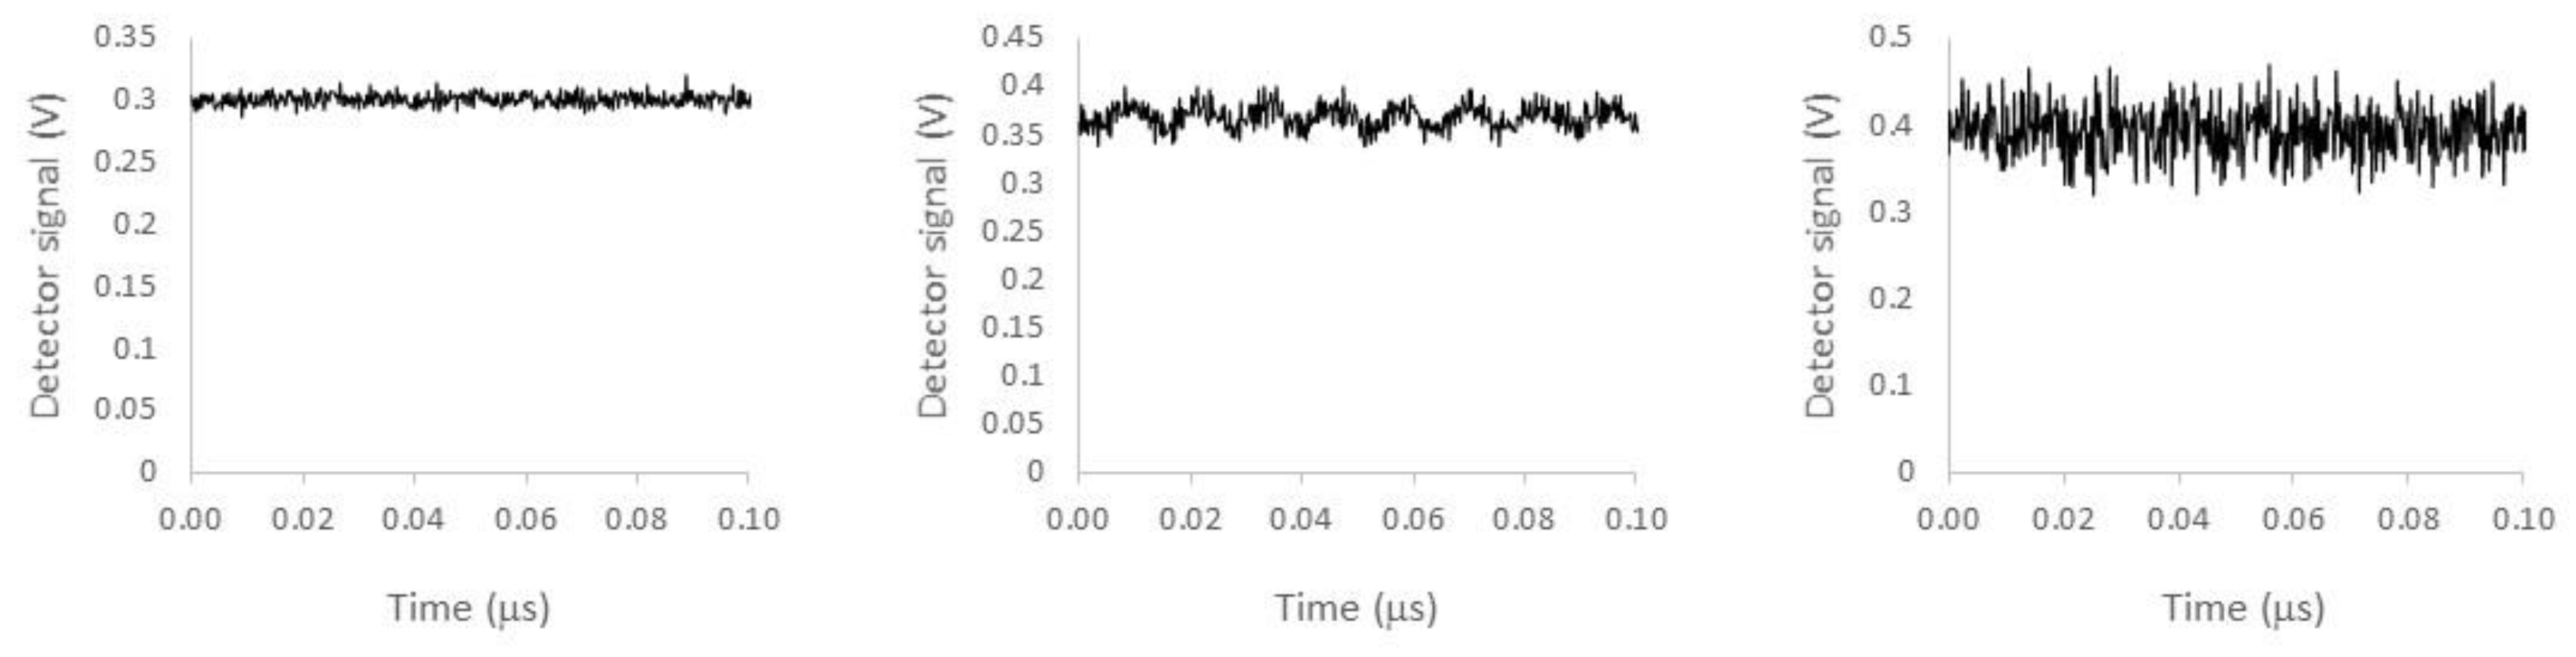
SOA2, the CW intensity was rather constant with some noise-induced fluctuations around the steady state. This is illustrated in
Figure 5 (left) at a setting (I
laser, I
SOA1, I
SOA2) = (60 mA, 11 mA, 500 mA). Increasing I
SOA2 eventually led to undamping of the relaxation oscillations as illustrated in
Figure 5 (middle) for (I
laser, I
SOA1, I
SOA2) = (60 mA, 11 mA, 600 mA). This marks the onset of the COF-induced dynamics. For larger values of the COF strength, the feedback-induced dynamical fluctuations became stronger and more complex as illustrated in
Figure 5 (right) for (I
laser, I
SOA1, I
SOA2) = (60 mA, 11 mA, 700 mA).
In order to quantify the strength of the feedback-induced dynamics in a simple way, we used the following metric: we extracted the rescaled STD as the ratio between the standard deviation of the laser intensity fluctuations σlaser and the mean value of the detector signal. Calculating this ratio is equivalent to rescaling the time traces such that the average value of the detector signal is equal to one. We performed this rescaling of the STD to make the extracted values independent of the average power coupled to the read-out fiber. The noise of the oscilloscope and the photo-detector are compensated for when extracting the value of σlaser from the time traces by assuming that the noise of these sources is Gaussian and is independent from the fluctuations in the laser’s intensity. To perform this compensation, we measured a time trace of the detector signal (using the same oscilloscope settings as when measuring the laser’s intensity) without optical input to the detector. From this time-trace, we determined the standard deviation σdet of the detector and oscilloscope noise (the mean value of the detector and oscilloscope noise was measured to be close to zero). Using the standard deviation σtimetrace extracted from the intensity time trace, we estimate the standard deviation of the intensity fluctuations σlaser to be .
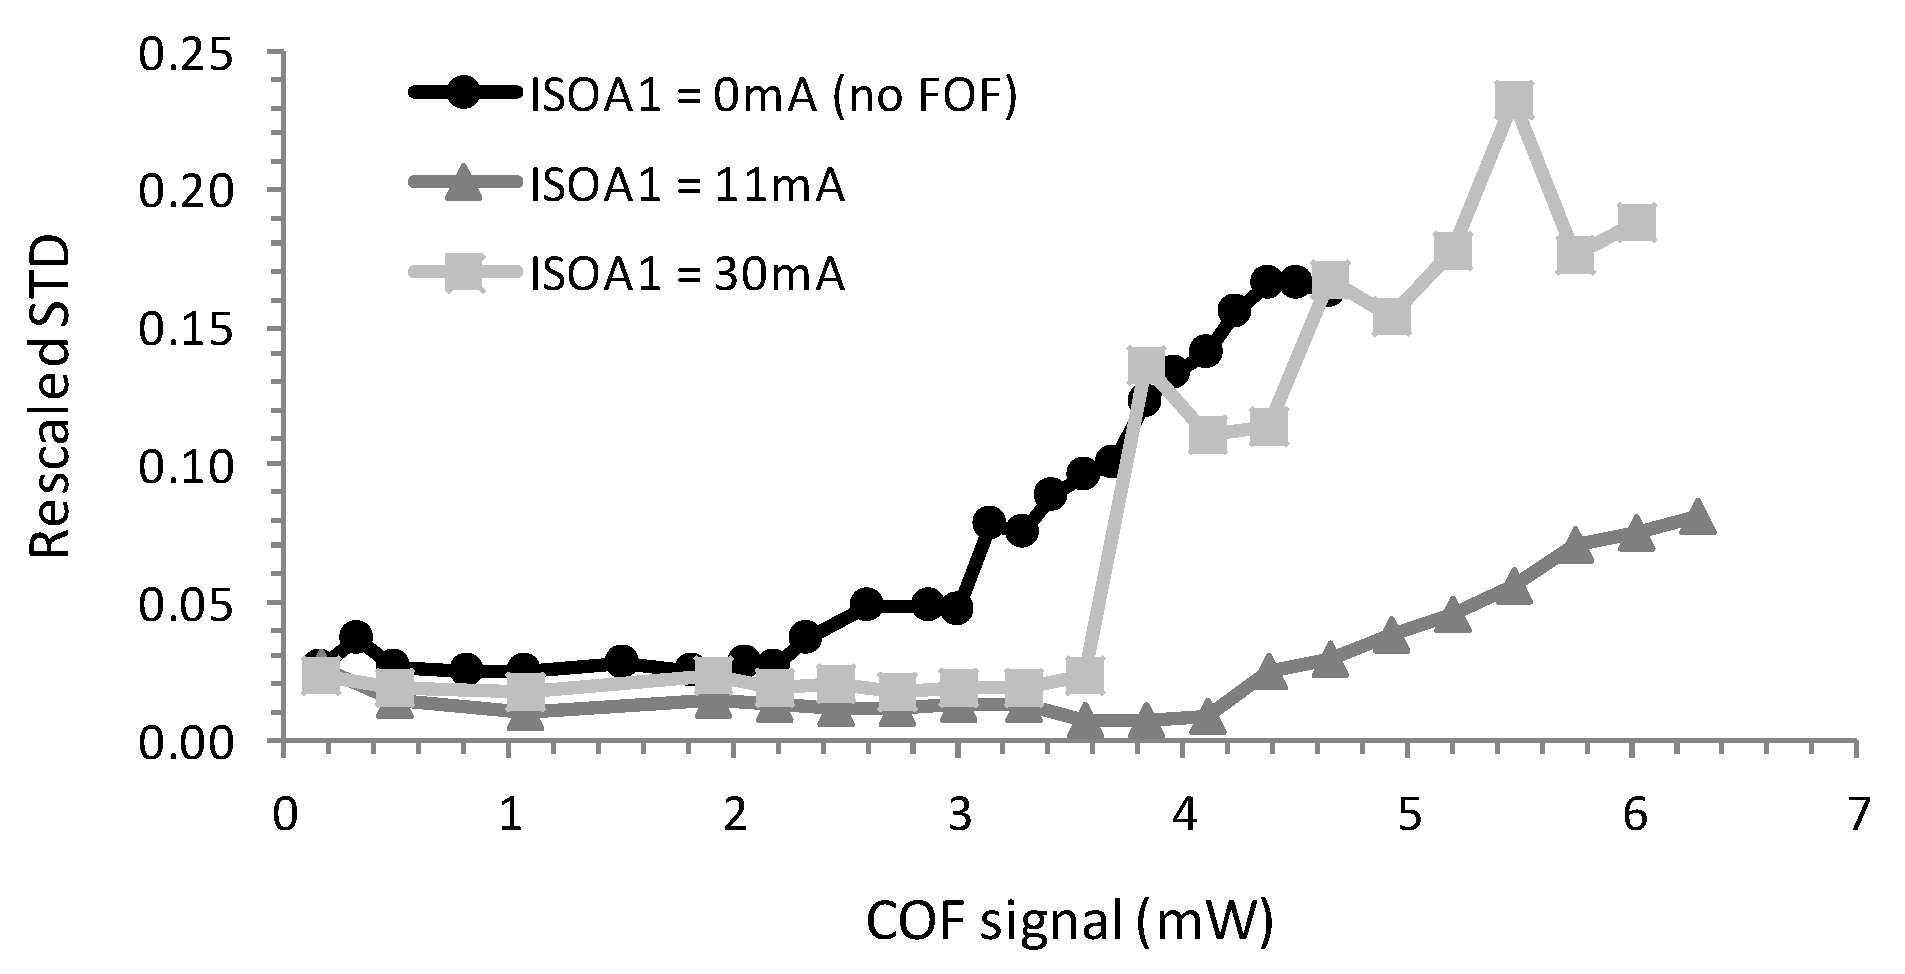
In
Figure 6 we plot the value of the rescaled STD for the three bias conditions BP1, BP2 and BP3 mentioned above. The COF signal strength, plotted on the horizontal axis of
Figure 6, was changed by changing I
SOA2 and was obtained by measuring the optical power after the splitter in
Figure 2 when the feedback loop was open. For each of the bias conditions, the STD was small for small values of the COF strength, as there were not yet any feedback-induced dynamics in the time traces. When increasing the COF strength, we can see in
Figure 6 that the onset of the feedback-induced dynamics was lowest for bias condition BP1, i.e., without FOF to stabilize the laser. When FOF was applied (see measurements for BP2 and BP3 in
Figure 6), the onset of the COF dynamics was shifted to larger values of the feedback strength, but this shift was not large for BP2 and BP3: the shift in the onset when comparing BP1 to BP2 was roughly a factor of 2 and was thus rather modest as compared to the suppression of feedback dynamics in strongly unidirectional SRLs [
7,
8]. Moreover, when increasing the FOF strength from BP2 to BP3, we actually observed a slight drop in the onset of the COF dynamics. The experiments thus show only a limited effectiveness of the proposed FOF scheme to suppress these dynamical fluctuations, and this effectiveness is furthermore dependent on the exact value of the applied FOF strength. The reason behind these observations will be clarified based on numerical simulations of the system in
Section 3.2.
3.2. Results from Numerical Simulations
Using the rate-equations that have been introduced in
Section 2.3, we performed a series of numerical simulations that mimic the experiments described above. In these simulations we set the normalized injection current to 1.2 and we selected particular values for the FOF and COF strengths in order to simulate time-traces of the directional powers. We remark here that we have obtained similar behavior for other values of the pump strength. From these time traces, we then extracted the STD of the intensity fluctuations in a similar manner to that used in the experiments represented in
Figure 6. We show in
Figure 7 (left) the simulated time traces when the strength of the COF was
= 0.4 ns
–1 (as this is a good setting to show the effect of the FOF on the onset of the laser dynamics). In the red time trace of
Figure 7 (left), FOF was not used whereas the FOF strength was set to 2 ns
–1 in the blue time trace of
Figure 7 (left). Using FOF, the intensity fluctuations in the time trace became smaller as compared to the case without FOF. We also notice that the average intensity in the CCW direction increased due to the FOF, as it enhances the CCW mode (see also
Figure 4). As a result, the rescaled STD was smaller for the trace in
Figure 7 (left) corresponding to
= 2 ns
–1.
The rescaled STD of the time traces was measured in the experiments to be 0.02. We used this value to estimate D
0 to be 2 × 10
−6 ns
−1 in order to find the same rescaled STD in the simulations without COF. Similarly to the experiments, we started by calculating the mean value and the STD of the time traces without FOF (
= 0 ns
−1). We increased the strength of the COF by increasing
from 0 to 1.0 ns
−1 in steps of 0.05 ns
−1 while the rest of the parameters were fixed (
= 0 ns
−1). Next, we repeated the calculations of the mean value and the STD of the time traces, but this time with FOF by setting
to 3 ns
−1, 5 ns
−1 and 8 ns
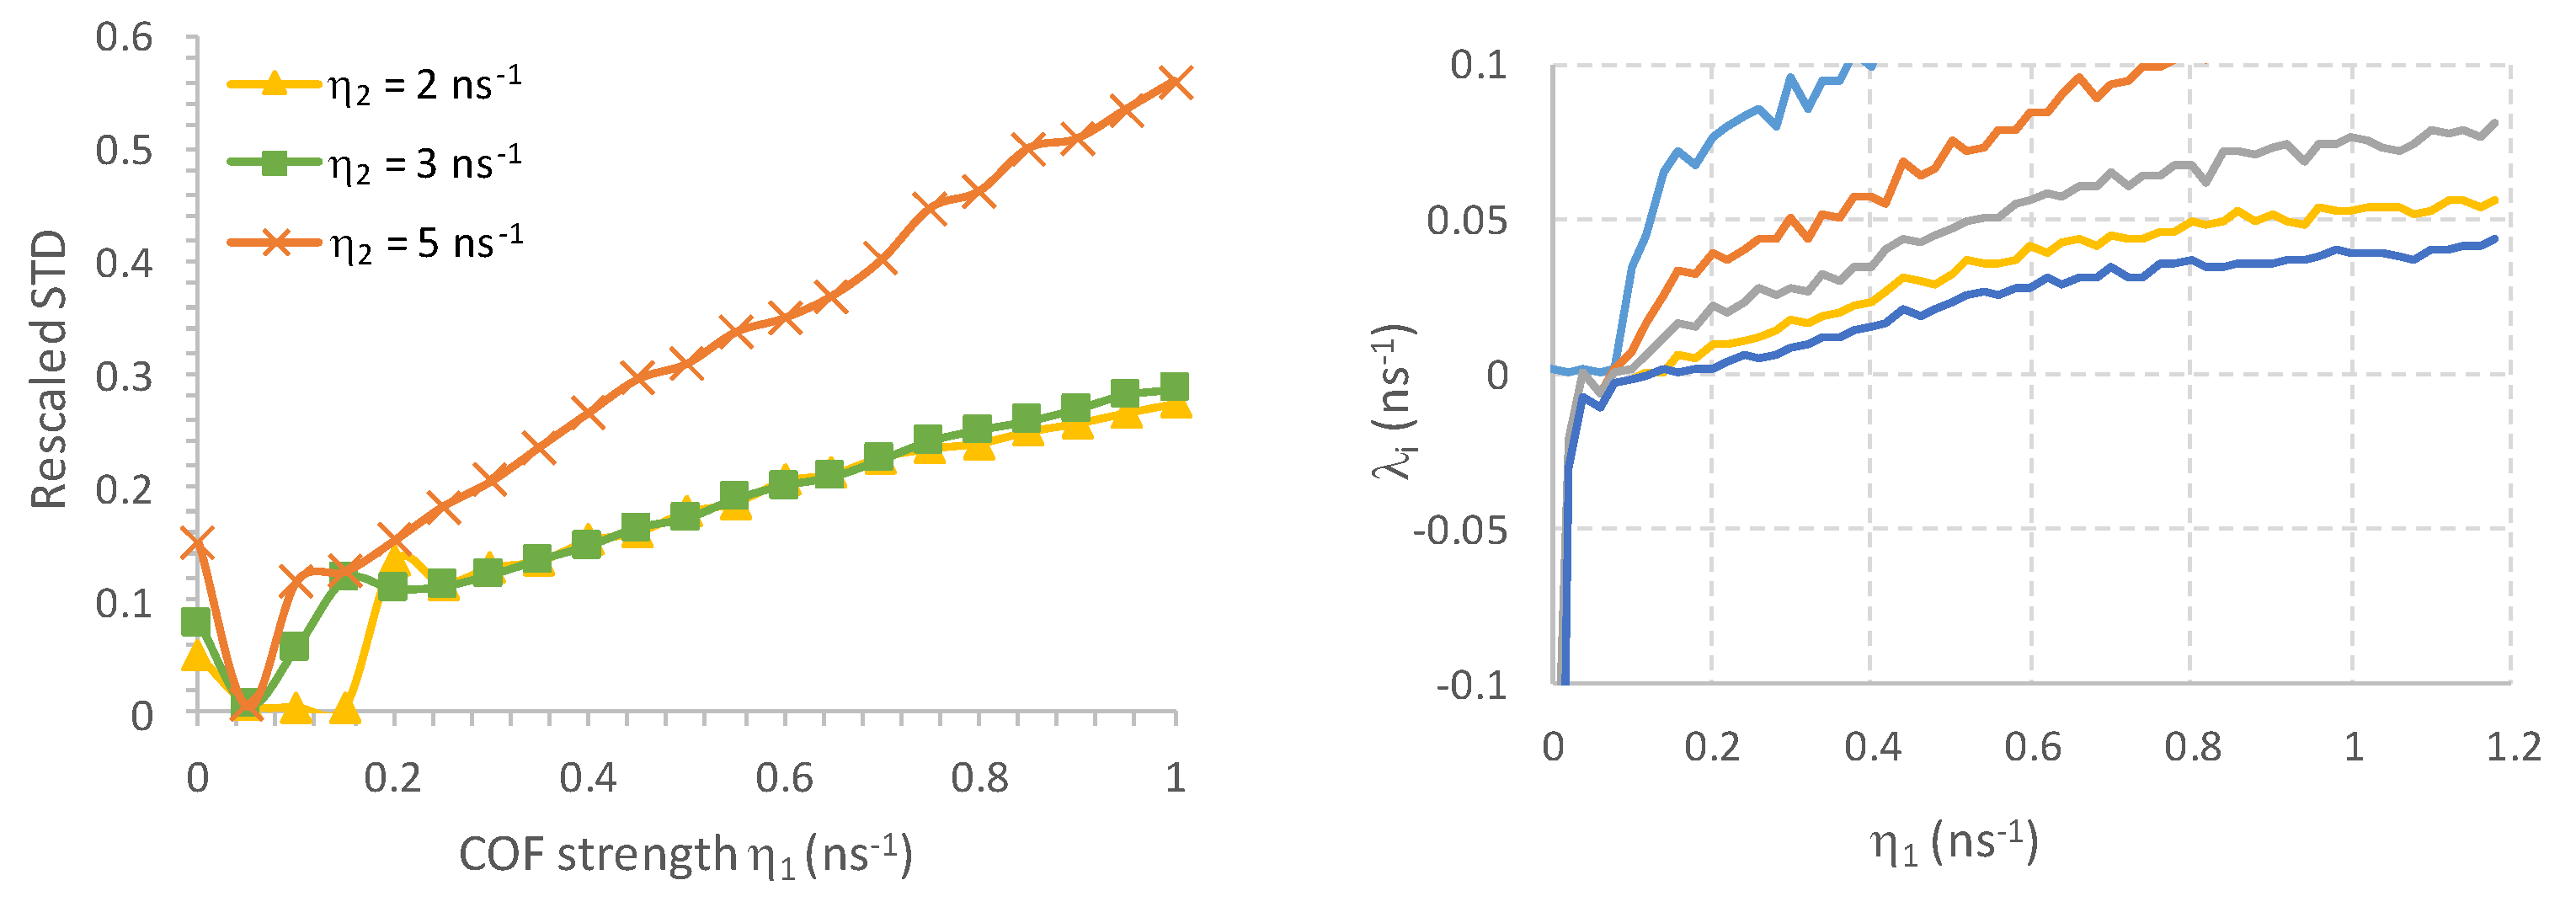
−1, while the rest of parameters were kept unchanged. We plot the rescaled STD from the simulations in
Figure 7 (right) as a function of the COF strength
. At low values of the COF strength, the STD is relatively small and remains approximately constant when changing the COF strength. The onset of COF-induced dynamics is visible in these curves as the point at which the STD starts to rapidly increase with increasing COF strength. Similarly to the experiments, the onset happened first for the laser without FOF around
= 0.2 ns
−1. When FOF was applied, the onset first shifted to larger COF strengths, but this shift is albeit rather limited. When further increasing the FOF strength, the onset of the dynamics shifted erratically and we did not observe a continuous increase in the onset. These numerical results thus agree qualitatively with our experimental trends and observations discussed in
Section 3.1, and show that the FOF scheme presented in
Figure 1 does not really help to reduce the COF-induced dynamics.
To further elucidate the stabilizing effect of the FOF on the SRL’s dynamical behavior, we computed and analyzed the so-called Lyapunov exponents, λ
i, from the model described in Equations (1)–(3) without noise (setting
D = 0). By studying the Lyapunov spectrum, we tried to understand how FOF influences both the stability and complexity of the chaotic dynamics that might have arisen. For the computation of the Lyapunov exponents, we applied the ideas of Farmer [
20] to our case. Specifically, we integrated the corresponding delay differential equations with an Euler method. This converts the original delay differential equations in a map. We computed the Lyapunov exponents of this map. Only a finite portion of the infinite set of λ
i can be determined by such a numerical analysis. In
Figure 8, we present the five largest Lyapunov exponents vs. the COF strength η
1. Due to the field nature of the equations, one exponent will always be zero. If only the maximal exponent is zero, the SRL will be emitting in a continuous wave. If two exponents are zero, while the others are all negative, the laser output will be periodic. If more exponents are zero, the dynamics can correspond to either periodic or quasi-periodic behavior. Once the maximal Lyapunov exponent becomes positive, the SRL will be operating chaotically. From
Figure 7 (right) and
Figure 8 (left), in the case of no filtered feedback, the increase of the STD around
= 0.1 to 0.4 ns
–1 can be attributed to a bifurcation from continuous wave emission to periodic oscillations. It is only later, after a regime of quasi-periodic behavior, that the laser became chaotic (around
= 0.8 ns
–1). With FOF (
= 3.0 ns
–1), in
Figure 8 (middle), below
= 0.7 ns
–1, the SRL with filtered feedback was continuously lasing except for some very small windows of periodic behavior. While this seems to indicate that the SRL would be more stably lasing, the negative Lyapunov exponents were now much smaller in amplitude. This indicates that the SRL would be much easier to destabilize due to noise, for example. The bifurcation to chaotic behavior hardly moved and still appeared at feedback strengths around
= 0.8 ns
–1. However, its accompanying positive Lyapunov exponents were increased significantly, indicating a more complex and less damped dynamical chaotic behavior. For
= 8.0 ns
–1 (
Figure 8 (right)), it is clear that the large region of chaos shifted to lower values of
(
≈ 0.4 ns
–1). Around
= 0.2 ns
–1, the laser was first destabilized as a small window of mildly chaotic behavior appeared (i.e., only one of the Lyapunov exponents was positive). This onset of chaotic oscillations corresponds to the abrupt change in the rescaled STD observed numerically in
Figure 7 (right) and experimentally in
Figure 6 for I
SOA1 = 30 mA. To conclude, with filtered feedback, the dynamical behavior of the SRL was altered considerably. For some values of the filtered feedback this led to a larger but less stable continuous wave regime and chaos which was more complex. Because of the larger continuous wave regime, the feedback sensitivity was somewhat reduced as compared to the device without FOF.


