Review

A Review of Intrinsic Optical Imaging Serial Blockface Histology (ICI-SBH) for Whole Rodent Brain Imaging

by
Joël Lefebvre
1,2,*,
Patrick Delafontaine-Martel
2 and
Frédéric Lesage
2,3,*
1
Big Data Institute, Institute of Biomedical Engineering, University of Oxford, Oxford OX3 7LF, UK
2
Institute of Biomedical Engineering, École Polytechnique de Montréal, Montréal, QC H3T 1J4, Canada
3
Research Center, Montreal Heart Institute, Montréal, QC H1T 1C8, Canada
*
Authors to whom correspondence should be addressed.
Photonics 2019, 6(2), 66; https://doi.org/10.3390/photonics6020066
Submission received: 30 April 2019 / Revised: 6 June 2019 / Accepted: 7 June 2019 / Published: 11 June 2019
(This article belongs to the Special Issue Neurophotonics – Optics for the Brain)

Abstract

:
In recent years, multiple serial histology techniques were developed to enable whole rodent brain imaging in 3-D. The main driving forces behind the emergence of these imaging techniques were the genome-wide atlas of gene expression in the mouse brain, the pursuit of the mouse brain connectome, and the BigBrain project. These projects rely on the use of optical imaging to target neuronal structures with histological stains or fluorescent dyes that are either expressed by transgenic mice or injected at specific locations in the brain. Efforts to adapt the serial histology acquisition scheme to use intrinsic contrast imaging (ICI) were also put forward, thus leveraging the natural contrast of neuronal tissue. This review focuses on these efforts. First, the origin of optical contrast in brain tissue is discussed with emphasis on the various imaging modalities exploiting these contrast mechanisms. Serial blockface histology (SBH) systems using ICI modalities are then reported, followed by a review of some of their applications. These include validation studies and the creation of multimodal brain atlases at a micrometer resolution. The paper concludes with a perspective of future developments, calling for a consolidation of the SBH research and development efforts around the world. The goal would be to offer the neuroscience community a single standardized open-source SBH solution, including optical design, acquisition automation, reconstruction algorithms, and analysis pipelines.

1. Introduction

Over the last decades, technological advances in imaging assisted the scientific community in linking functions to structures inside the brain. Neuroimaging modalities such as magnetic resonance imaging (MRI), diffusion MRI (dMRI), functional MRI (fMRI), positron emission tomography (PET), and others have revolutionized our understanding of the brain. These tools were used to study, among other investigations, brain metabolism and neurodegenerative diseases [1,2]. Alongside these modalities, neurophotonics methods were developed to observe the brain with optical means, providing better spatial and temporal resolutions [3,4]. Light–tissue interaction mechanisms that can be used to study biological tissues include reflection, refraction, absorption, scattering, and some nonlinear optical effects such as two-photon excitation fluorescence (TPEF), second- and third-harmonic generation (SHG and THG, respectively), and Raman scattering [5].
Despite the ubiquitous use of MRI and PET imaging in neuroscience, these techniques are not well-suited when it comes to studying the brain structure at a micrometer scale. This finer imaging resolution requirement arises in multiple neuroscience research fields. For example, it has been hypothesized that some neurodegenerative diseases could be related in part to brain microvascular pathologies such as microvascular dementia, microvascular incidents, endothelial disfunction, or mild cognitive diseases [6,7,8,9]. To test these hypotheses, neuroscientists need an imaging tool that enables the mapping of the neuronal tissue at micrometer scale across the whole brain. In the field of neurophotonics, a tool that meets this increasing resolution requirement is serial blockface histology (SBH). This technology combines a tissue-slicing apparatus with an optical microscope. The brain is sequentially sliced to reveal new tissue layers that are imaged with the microscope. The process is repeated until the whole sample has been imaged. Then, through advanced registration methods, the thousands of image tiles acquired are assembled into a single 3-D volume. The first automated SBH systems used fluorescent confocal microscopy and TPEF microscopy (TPEFm) [10,11,12]. These tools were an essential component of many high-profile neuroscience projects to map genome-wide gene expression [13] and to obtain a micrometer scale connectome in a whole mouse brain [14,15]. Building on the success of SBH, other groups have coupled this technique with intrinsic optical contrast imaging modalities (ICI). The main rationale motivating this effort is a reduction in tissue preparation complexity that leads to an improvement in serial histology acquisition times.
This paper is a review of SBH using intrinsic optical contrast with applications of this technology to image whole brains in 3-D. The first section describes the various optical contrast mechanisms of brain tissues. Some imaging modalities discussed include Optical Coherence Tomography (OCT), polarization-sensitive OCT (PS-OCT), Raman scattering techniques (Raman microscopy, Coherent Anti-stokes Raman Spectroscopy (CARS), and Stimulated Raman Spectroscopy (SRS)), intrinsic fluorescence and multi-photon microscopy without labeling, Second- and Third-Harmonic Generation (SHG/THG), and photoacoustic imaging. The second section of this paper deals with SBH for whole brain imaging. This section presents the main components of an SBH setup, ranging from tissue slicing and acquisition automation to data processing and reconstruction. The paper then concludes with a review of the two main applications of ICI-SBH reported in the literature: validation studies and the creation of multimodal brain atlases.

2. Intrinsic Optical Contrast Imaging (ICI) of Brain Tissue
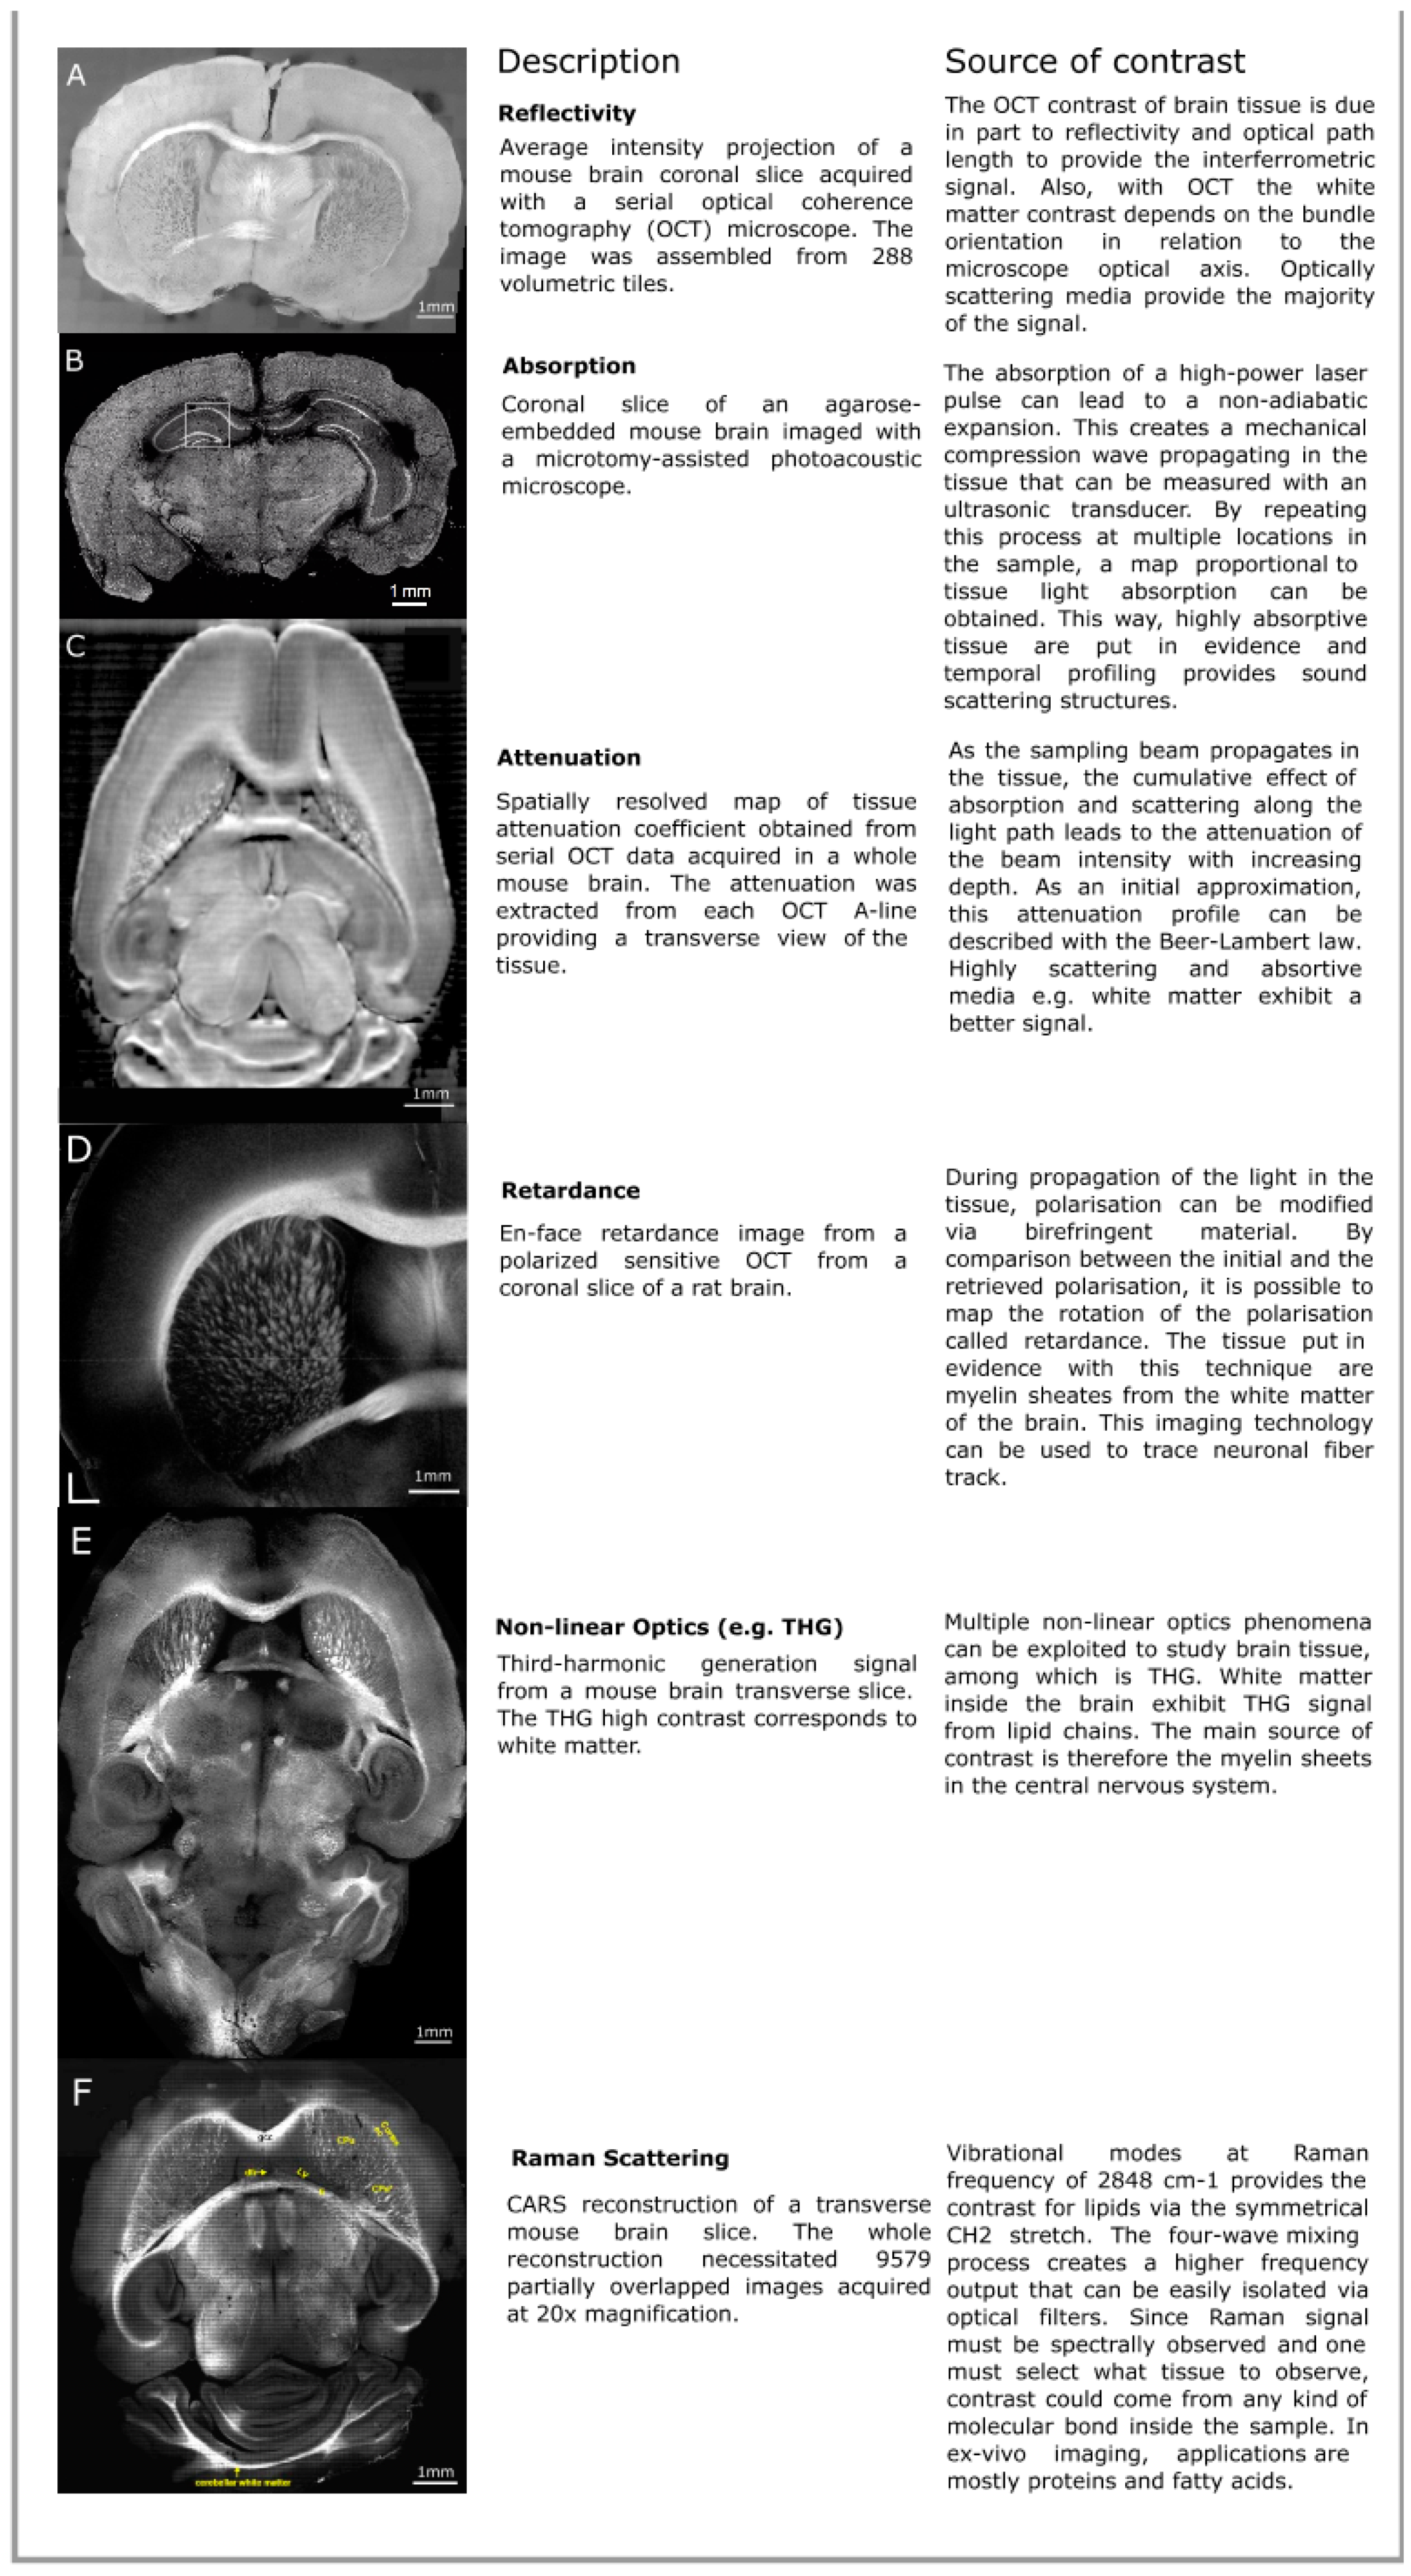
In this section, we review the distinct intrinsic optical contrast sources that can be exploited to image the brain. Representative brain images for each optical modality discussed in this section are illustrated in Figure 1. The light–tissue interactions presented are reflectivity and scattering, absorption, birefringence, nonlinear optical processes such as second- and third-harmonic generation, and Raman scattering. For comparison purposes, more details about the different imaging techniques are provided in Table 1.

2.1. Reflectivity

The index of refraction, defined as the factor that changes the velocity of light in a sample, is affected by biological components such as phospholipids and proteins and mainly by the water content. For the brain, neuron and glial cell microstructures modify the local refractive index and cause a deflection of the light at interfaces between two different tissue components [29]. The interface between two regions having different indices of refraction will cause a reflection and a transmission of light following Fresnel’s equations. These interfaces can be imaged with interference-based imaging modalities such as OCT. Moreover, changes in a refractive index can provide valuable information on the internal compositions of a sample and can give insight about diseases or medical conditions, e.g., damage of brain tissue or macular abnormalities [30,31].
To understand interference imaging, one can consider a Michelson–Morley interferometer as an intuitive OCT technique. Instead of using mirrors to create the interferometric pattern, the reference arm contains a mirror but the second arm contains the biological sample to study. Then by moving the reference arm, scattering components inside the tissue will reflect the incoming light and create an interferometric signal. However, to obtain an interferometric signal, one must consider the travelled path in the tissue; the signal will be retrieved where the two arms will correspond to the same path length. This technique enables deep-tissue imaging with near infrared light and can be engineered to work with different OCT configurations, for example, spectral-domain OCT (SDOCT). SDOCT uses spectral encoding of the interferometric signal to recreate the complete reflectivity map of the tissues via inverse Fourier transform [21]. The gathering of this structural information, combined with SBH, enables the complete 3-D reconstruction of biological samples such as mouse brains and can even yield information on the neuronal fiber bundles orientation. Indeed, neuronal fibers perpendicular to the optical axis will reflect light more efficiently and act as a greater scattering component than fibers parallel to the optical axis. With careful image processing, one can retrieve the fiber bundle orientation and add complimentary information in the white matter structure.

2.2. Attenuation

As mentioned above, the index of refraction is an important physical parameter to describe light interaction with matter. In addition to the real component describing the refractive index, this complex parameter also bears an imaginary part representing the light absorption. Physical processes contributing to the absorption include heat generation [32,33], with others leading to the reemission of light, e.g., fluorescence. Light attenuation is due to the combination of absorption and scattering, a process that occurs with microscopic changes of the refractive index throughout a tissue [34,35]. The attenuation caused by tissue is typically described by the Beer–Lambert law which stipulates that the loss of intensity will follow an exponential decrease with the length travelled. However, the mathematical modeling of the attenuation differs between coherent imaging and noncoherent imaging. In noncoherent imaging, the scattering events can be taken into consideration by a modified Beer–Lambert law contributing to an intensity reduction of the signal received, e.g., in TPFM. On the other hand, coherent imaging relies on the phase of the scattering light to be unchanged. During scattering events, light will tend to lose its coherence, degrading furthermore the intensity of the signal. Moreover, multiple scattering events can contribute to a back scattered signal, increasing the detected signal. This effect must be considered inside the mathematical expression of the attenuation in coherent modalities, e.g., in OCT [36].
As discussed above, optical absorption by a tissue causes a signal decrease. If a high energy pulse of light is absorbed by a tissue, energy transferred in the process does not only produce heat or deterioration of the sample but can also induce nonadiabatic expansion. The concept of using light absorption to create a mechanical wave in a sample has the advantage to combine the ultrasonic resolution and the high contrast due to light absorption [37]. With this effect, it is possible to create a mechanical wave inside the sample and to retrieve, via a transducer, the pressure wave created via absorption of high energy light. The contrast retrieved with photo-acoustics microscopy (PAM) is a map proportional to the absorption [17]. Applications of PAM for brain imaging include brain injury monitoring by monitoring the absorptivity of selected tissue [38,39], brain inflammatory responses monitoring in fetal rats [40], and tumor monitoring [41,42].

2.3. Birefringence

During propagation, light polarization can also be modified via interactions with the biological sample. In birefringent materials, the refractive index is dependent on polarization. An input beam with polarization that is not aligned with the orthogonal fast and slow axes or in a media with randomly distributed birefringent tissue will see its polarization modified as it propagates due to the accumulation of phase retardation, causing an elliptic polarization of the propagated beam [43]. In biological samples, birefringent effects arise from repetitive anisotropic structures such as tendons and their collagen fibers [44] or myelin sheaths containing multilayered membranes of lipids, mostly glucocerebroside and the myelin basic protein (MBP), for a correct structural formation [45]. Depending on the distance traveled by light, there will be an accumulated retardance of the slow-axis polarization, hence the name of the signal. Separating the received light in each polarization, the measurement of the birefringence of the sample is possible. This technique combined with OCT, called polarized sensitive OCT (PS-OCT) microscopy, was used to observe retardance in biological tissues such as coronary arteries where the contrast arises from collagen fibers in the coronary walls or in the fibrous cap of a thrombus [46,47], in retinal imaging where the intracellular structure of the melanosomes in the retinal pigment epithelium depolarize the backscattered light [48,49], and in white matter of mouse brains where lipids with MBP create an anisotropic structure [19]. The dependence of white-matter birefringence on its orientation helped provide a ground truth when correlating with other imaging techniques such as diffusion tensor imaging (DTI) via magnetic resonance [50]. It was also used to observe Amyloid Beta plaques in Alzheimer’s disease mice brain models [51].

2.4. Nonlinear Optical Processes

Nonlinear optical phenomena also enable intrinsic imaging in biological tissues. The propagation of the light’s electric field creates a response in accordance with the sample electric susceptibility. This response is sensitive to the sample tridimensional structure and can be nonlinear with respect to the electric field. The light output can be generated at twice the frequency or even higher multiples [52]. The polarization density for a single frequency electric field is described as follows:
P = ϵ 0 [ χ ( 1 ) E i + χ ( 2 ) E i 2 + χ ( 3 ) E i 3 + ]
where χ(i) represent the electric susceptibility represented by a tensor and E is the electric field. By using ultrashort pulses of light, the generation of signals at a multiple of the input frequency will arise. The propagation of the generated field obeys the Helmholtz equation at the harmonic frequency of the interacting incoming electric field.
2 E + ϵ ( 1 ) c 2 δ 2 E δ t 2 =   1 ϵ 0 c 2   δ 2 P N L δ t 2
where ε(1) represents the relative permittivity of the propagation media, c is the speed of light, ε0 is the permittivity of empty space, E is the electromagnetic wave, and PNL corresponds to the nonlinear polarization density described by removing the first term of the expression in Equation (1). This leads to the generation of harmonics known as Second-Harmonic Generation (SHG) for signals with twice the frequency of the input or Third-Harmonic Generation (THG) for signals with three times the frequency of the input. Developments in harmonic generation imaging techniques have shed light on cellular structure, vascular morphology, or even membrane electric potential [26,53]. For SHG or THG to work, conditions inside the propagation media must be fulfilled. In the case of SHG, which is a three-wave mixing process, a condition of anisotropy of the media must be present in the sample for generation to occur [54,55]. An example where SHG is present is for biological tissues containing collagen proteins. The proteins exhibit SHG contrast due to the anisotropic structure of hydroxyproline, proline, and glycine. SHG contrast has also been used for the study of elastin networks [56]. On the other hand, THG contrast does not require anisotropic molecular structures. Thus, THG signals are more widely applicable in microscopy setups when structural information is needed [26].
The SHG and THG techniques use virtual molecular states in their underlying light-interaction mechanism. Another contrast source that can be measured within unlabeled tissue is absorption followed by fluorescence emission. The absorption can be linear (single photon) or nonlinear (two or more photons). The difference between SHG and the TPF are only in the relaxation mechanisms: For SHG, the excited state is virtual, and for TPF, it is a molecular energetic state. Once excited by the TPF technique, intermediary relaxation by heat, vibrations, or lower-energy-excited electronic levels will cause the final emitted fluorescent light to be at a lower energy than twice the incoming photons. Biological tissue can naturally exhibit a TPF signal even without labeling the technique for structures such as NADP-H and flavins or via three-photon fluorescence imaging, e.g., serotonin [22]. However, the relaxation processes also have decay characteristics. This, in turn, enables lifetime imaging via a time tagging of the received autofluorescence signal [57]. Applications of this contrast in histology include cell damage monitoring from UV A or NIR photostress via lifetime TPF of coenzymes [58], investigation of cerebral energy metabolism via lifetime TPF [59], or brain tumor detection [60].

2.5. Raman Scattering

Structural information on the brain can yield clues to the neuronal architecture, but chemical information can provide insight on the biological sample’s composition at the cellular level. Chemical information can be obtained exploiting the Raman effect. Similar to a scattering process, part of the incoming light energy is reemitted in a lesser energy state while the molecule remains at a higher vibrational state through Stokes Raman scattering [61,62,63]. The reemitted light can be compared with the input light, and a spectral band structure distinctive for each of the vibrational states that were excited can be observed. The spectrum is specific to each molecule since vibrational states are linked to the molecular structure. Furthermore, this process is reversible. When the molecule is in a higher vibrational state, it can release its energy to the interacting photon to enhance its energy, resulting in what is called Anti-Stokes Raman scattering. Microscopic techniques were developed to exploit this phenomenon. The most common use of Raman imaging is via spectroscopy and single point imaging. By observing the complete Raman spectrum of a sample, one can observe vibrational states of interest or use multiplexed data to create maps of chemical composition [64,65]. Nonlinear techniques can also provide Raman information in a four-wave mixing process such as CARS microscopy. By using stimulated emission with two high-power laser sources, a pump beam and a probe beam, one can promote the excitation of molecules in a certain vibrational state and measure the signal from the Anti-Stokes Raman process coming from the second excitation by the pump beam on the excited vibrational state. This technique will provide an output signal with a higher frequency than the input signal, and optical filters can ensure that only the CARS output is conserved during imaging sessions [66]. Raman information can also be obtained with a lock-in amplification of a stimulated Raman signal such as SRS. By using a pump and a probe beam with an energy difference equal to a Raman energy level, one can promote the excitation of a desired Raman level via stimulated emission. This effect will cause an intensity loss from the pump beam and an intensity gain for the probe beam. To detect the probe beam gain and to ensure a high signal-to-noise ratio, a modulation of the pump beam with an electro-optic modulator will provide the frequency for the lock-in amplification technique [67,68]. For the two last techniques mentioned, video-rate imaging is possible, enabling high throughput research in genetic screening [69], metabolic fingerprinting [70] or tumor detection [71]. More generally, Raman imaging techniques are useful in pharmacology to observe the deposition of drugs [72] in chemistry for purity evaluation [73] or, in the context of this paper, for microscopic imaging [74]. The application of this physical imaging principle has recently led to powerful tools to guide surgical extraction of brain tumors via a Raman probe [75,76,77] as well as chemical imaging of different regions of the brain [28,78].

3. Serial Blockface Histology

The main drawbacks of the aforementioned optical techniques are (1) the limited depth of penetration of light in tissue and (2) the nonspecific nature of the intrinsic optical contrast. The former is due to the attenuation of the sampling beam with increasing tissue depth. Whether the attenuation is due to scattering or absorption, the cumulative interactions along the light path will effectively limit the depth that can be imaged within the brain. The second limiting factor incurred by using the tissue’s intrinsic optical properties is the lack of specificity. Any brain structure traversed by the sampling beam contributes to the signal, not only the labeled structure of interest for a given imaging study. This results in a significantly lower contrast between the brain structures of interest and the surrounding tissue as compared to, for example, confocal microscopy using fluorescent dyes that only binds to specific sites. In addition, multiple contrast mechanisms can affect the measured signal for a given optical modality, all of which must be considered when interpreting the images. For example, in OCT, the contrast is mainly due to index-of-refraction changes between interfaces and, to a lesser extent, to backscattering. Furthermore, the backscattered intensity of myelinated fiber bundles was shown to be affected by the bundle angle with the sampling beam direction. Parallel fiber bundles appear darker as the surrounding tissue, as for bundles orthogonal to the microscope optical axis are brighter than their surroundings [16,79]. All these factors must be considered when analyzing OCT acquired brain images, and the same logic applies to other intrinsic optical modalities. Some of the strategies that have been developed over the years to help reduce the confounding factors and to simplify image interpretation are tissue clearing and mechanical slicing.
A variant of mechanical slicing and the main subject of this review is serial blockface histology. In this configuration, the microscope is coupled with a tissue-slicing apparatus and the brain is sectioned during the imaging experiment rather than prior to the imaging session. With SBH, the sample surface is first imaged with the microscope. To alleviate the limited field of view of many microscope setups, the sample is often placed on a kinetic stage. It is used to acquire a mosaic of images or volumes that are assembled into a single slice. Once the sample surface has been imaged completely, a small tissue layer is removed with the slicing apparatus, and the acquisition is performed again. The alternation of blockface imaging and cutting is repeated until the whole brain is acquired. The main advantages of SBH are the elimination of the complex registration of consecutive slices, the reduction of deformation and cutting-related damages, and the significantly simpler tissue preparation protocol if intrinsic optical contrast is used. A drawback of this method is that, in most systems, the brain slices are either destructed or discarded depending on the cutting apparatus employed. The development of a hybrid serial histology system, combining blockface histology and conventional histology, would be a major next step to allow direct comparisons of multiple modalities.
Most SBH systems use a vibratome to perform the tissue sectioning. This consists in a vibrating blade that sequentially removes a thin tissue layer in-between blockface imaging periods. This configuration uses a simplified tissue preparation protocol when compared to other serial imaging modalities. The brains are first perfused with formaldehyde to fix the tissue. Then, the brains are extracted from the skulls and embedded in agarose blocks for mechanical support during tissue slicing. The embedded samples are then oxidized to create covalent cross-links between the tissue and embedding medium and thus to prevent tissue separation during sectioning [12]. The agarose blocks are next placed in a water-filled container mounted onto a kinetic platform. The agarose blocks are fixed by either gluing them at the bottom of the container or by using custom-made 3-D printed holders [80]. A water-filled container is necessary to use a vibratome because this allows the slice to separate from the remaining block without necessitating manual removal. This slicing configuration was used with TPEFm [12,81,82,83], with OCT and PS-OCT [16,19,80,84,85,86], with PAM [17], and with CARS and THG [18,20,87].
There are other tissue sectioning methods that can be used for SBH. Some systems replace the vibrating blade by a diamond knife [11]. This approach is commonly used to prepare ultra-thin samples for serial blockface electron microscopy acquisitions [88,89]. Another system configuration uses the knife to section the tissue and to perform the imaging. This alternative method, called Knife-Edge Scanning Microscopy [90,91], enables the simultaneous sectioning and imaging of small animal brains. Finally, another alternative method is all-optical histology [10,92], wherein a femtosecond laser is combined to the imaging system and used to ablate small layers of tissue. This sectioning method result in irreversible tissue loss, whereas the tissue slices obtained vibratome-based approach can be collected for further imaging.

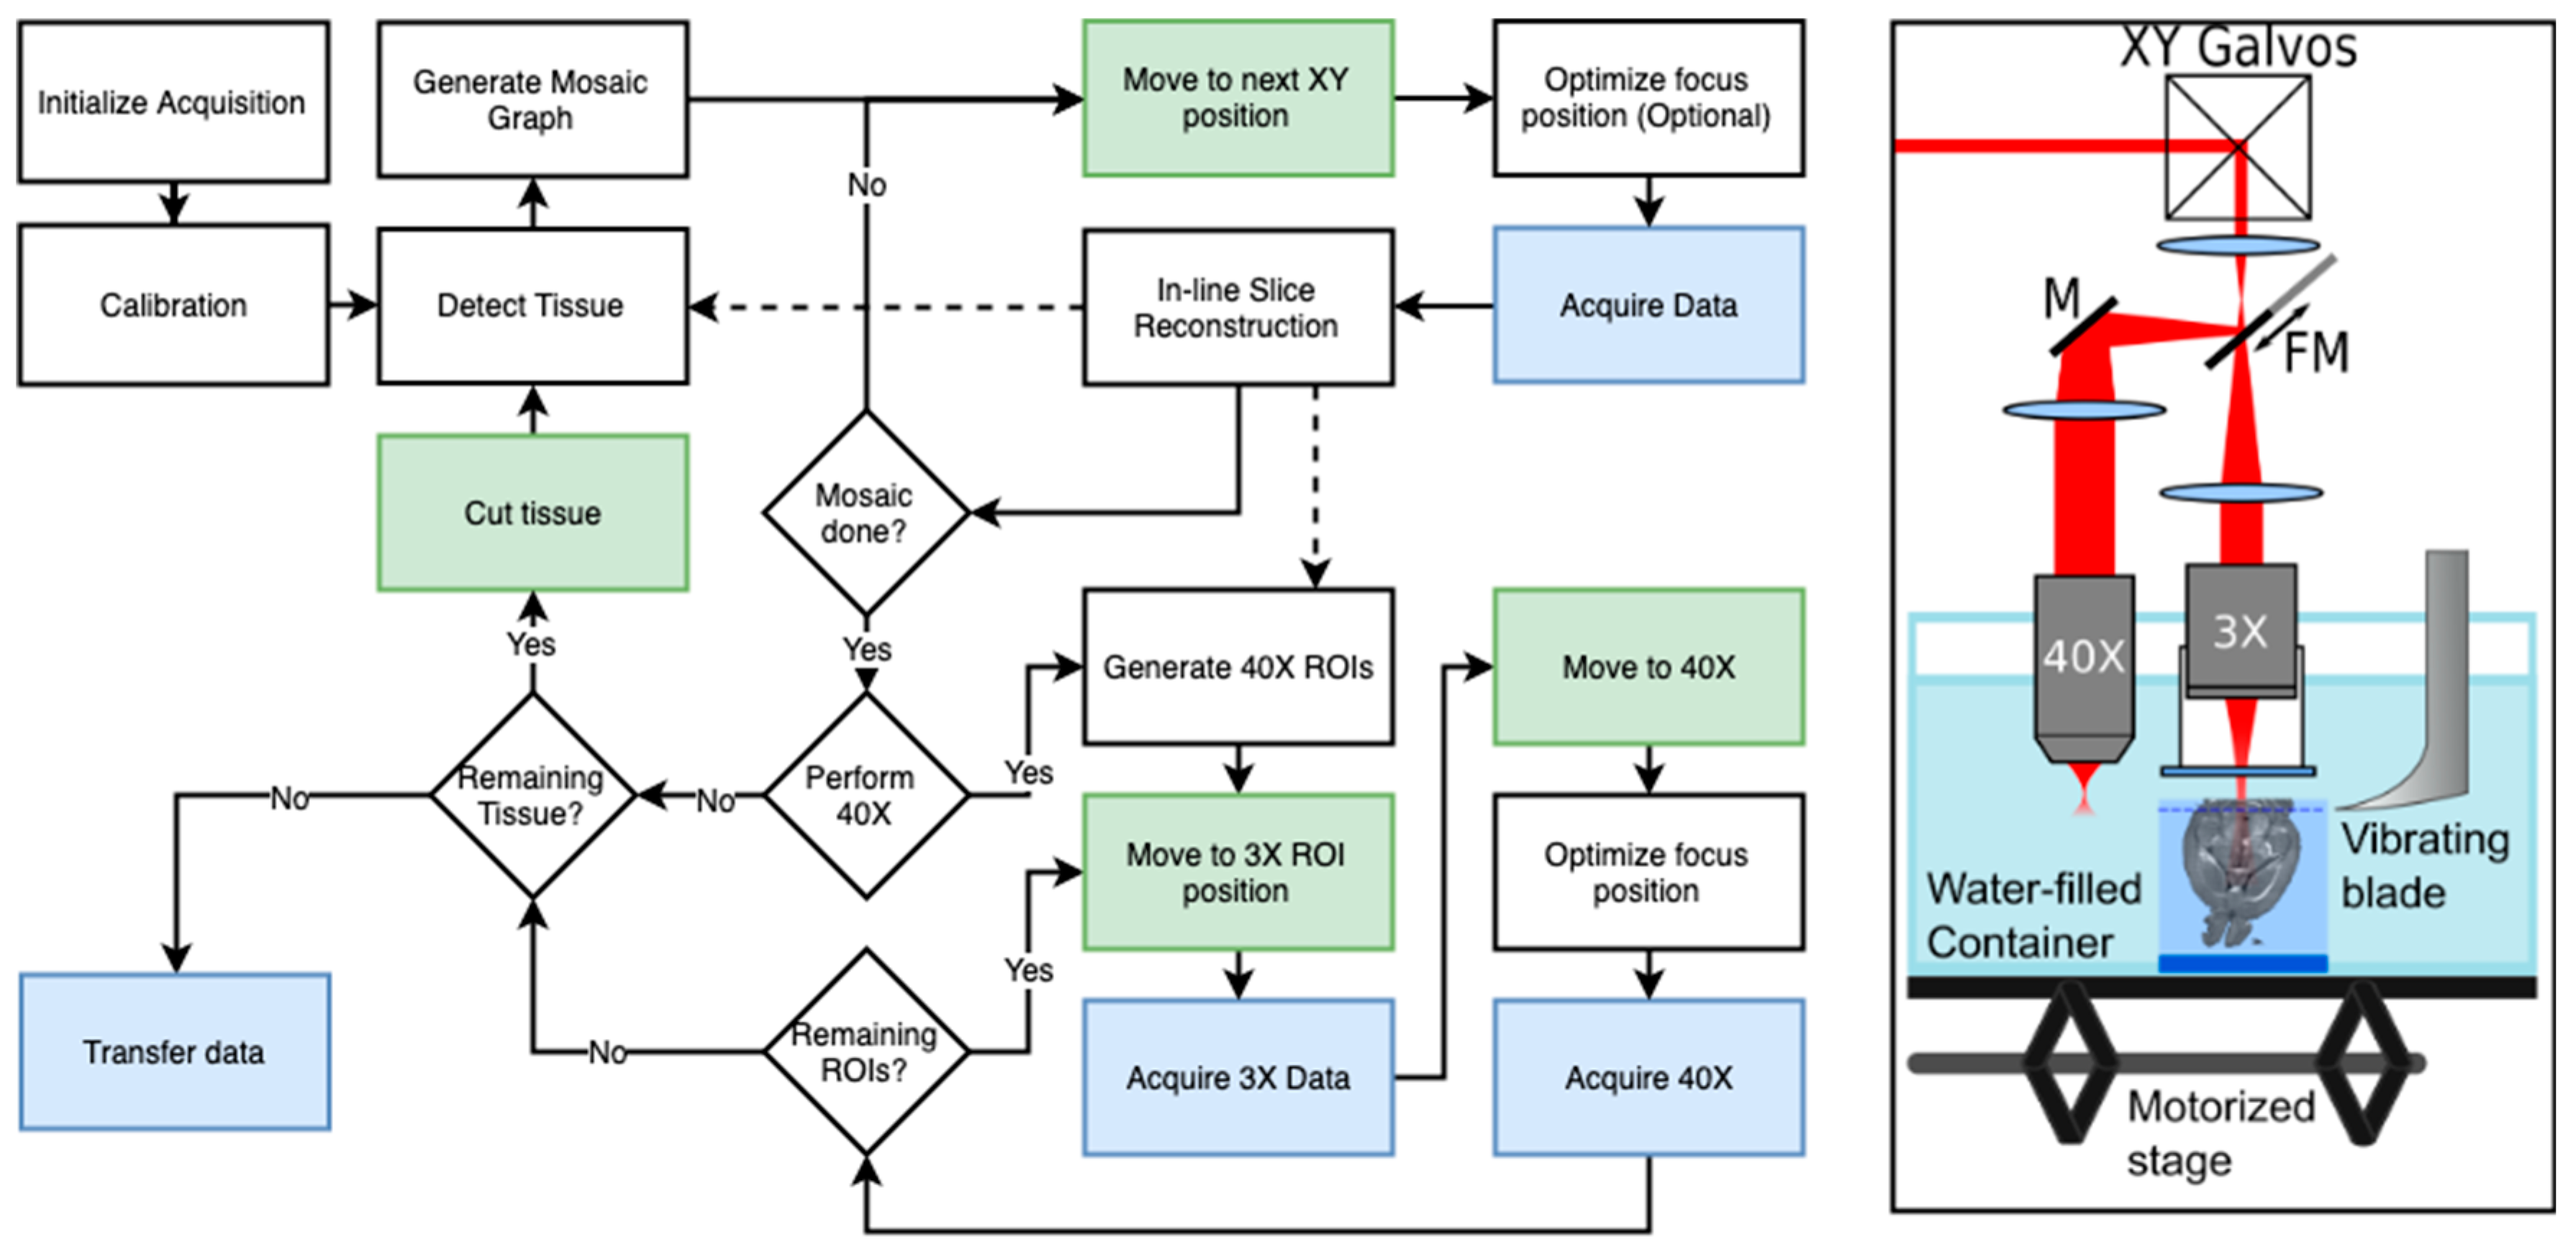
3.1. SBH Acquisition Automation

To acquire whole mouse brains within a reasonable time and without necessitating labor-intensive manual user interactions, several serial histology systems are automated using computer-controlled hardware. Initial automation efforts consisted of hardware controllers, acquisition routines, and graphical user interfaces (GUI) [10,11]. For instance, the MPScope toolkit [93,94] was developed for the all-optical histology system and for TPEF laser scanning microscopes. It may be used to control the mechanical stage, to acquire the images, to manage the data generated, and to visualize the acquisition. A similar open-source cross-platform software package is µManager [95,96]. Its modular design and the multiple hardware devices supported enable users to create advanced techniques, and they accelerate custom-imaging system development. Additional acquisition time reduction was obtained by using a service-oriented architecture for system control [12]. The reported controlling software suite consisted in several services that each interacted with a different part of the microscope. Another global service was used to orchestrate the services and to perform task scheduling. This approach enables simultaneous operations (e.g., moving the stage while processing the data); it can also be used to plan complex sequences of tasks.
Apart from hardware communication, image digitization, and sample stage motion control, another important component of serial histology consists in all the routines used to automate the process. Figure 2 illustrates the control pipeline and routines required for the full automation of a dual-resolution serial OCT microscope [80]. This workflow consists in hardware control and data processing algorithms (white boxes), mechanical tasks such as tissue cutting or sample stage movements (green boxes), data acquisition and transfer operations (blue boxes), and decision nodes (diamond-shaped boxes).
The following is a description of a typical automated SBH acquisition, mostly based on our previously published dual resolutions serial OCT (2R-SOCT) system [80]. Other similar acquisition pipelines were described for single-resolution SBH platforms [12,81,85]. A typical automated SBH acquisition begins with an initialization and calibration process. At this stage, manual or automated routines are used to calibrate the motorized stage displacement, to detect the agarose block bounding box, to initialize the vibratome cutting height, and to optimize the focus position within the tissue. Then, multiple vibratome cuts are performed until the brain tissue is reached. This step is necessary because the brain is often covered by agarose during the embedding process and the SBH needs a clean tissue surface to initialize imaging. For our 2R-SOCT system, the last calibration operations were the acquisition of background images in both water and agarose used during data reconstruction for inhomogeneous illumination correction and the initialization of the data folder structure to save the volumetric tiles.
After calibration, an initial mosaic is acquired over the whole agarose bounding box (“Detect Tissue” process in Figure 2 workflow). The volumetric OCT data was assembled, and tissue was segmented to refine the acquisition bounding box. The tissue mask was then used to generate the mosaic graph. Some mosaic parameters that can be set by the user are the size of the field of view (FOV), the overlap fraction between adjacent tiles, a margin size around the bounding box to make sure that all tissue is covered by the acquisition, and a tissue mask to avoid acquisition of empty tiles. Once the mosaic graph is generated, the blockface acquisition can begin. For each tile within the mosaic, the sample stage is moved to the predefined position. An optional focus depth optimization can be performed, and the image/volume tile is acquired. The data is then sent to an in-line reconstruction algorithm that stitches the tiles together to get a visualization of the current blockface tissue slice. This process is repeated until the whole mosaic has been acquired.
Following mosaic acquisition, our 2R-SOCT system can perform 40X imaging for the same blockface tissue slice. This is represented by the group of process blocks following the “Perform 40X” decision in the Figure 2 workflow. The acquisition procedure for the dual-resolution mode is similar to the single resolution mosaic acquisition, except that the sample moves from the 3X to the 40X for each region of interest (ROI). These ROIs can either be selected manually by the microscope operator with a graphical user interface or be generated automatically with an image processing algorithm. Briefly, the ROI selection algorithm segments the tissue within the low-resolution assembled mosaic, computes a saliency map based on the local image gradient magnitude, and then randomly selects ROIs to be imaged. More details about the automated ROI selection algorithm can be found in our previous publication [80]. Once all the 40X ROIs are acquired, the acquisition workflow determines if there is still tissue left to be imaged (“Remaining Tissue?” decision box in Figure 2). This can be determined either by setting a number of serial scans to perform, by asking for user interaction, or by analyzing the assembled mosaic with a computer vision-based method. If there is still tissue to image, the sample is moved to the vibratome, a small tissue layer is removed, and the mosaic acquisition is repeated. If there is no tissue remaining, the raw data is transferred to a remote server for further reconstruction and post processing and the SBH system is shut down to enabled sample removal and setup cleaning.

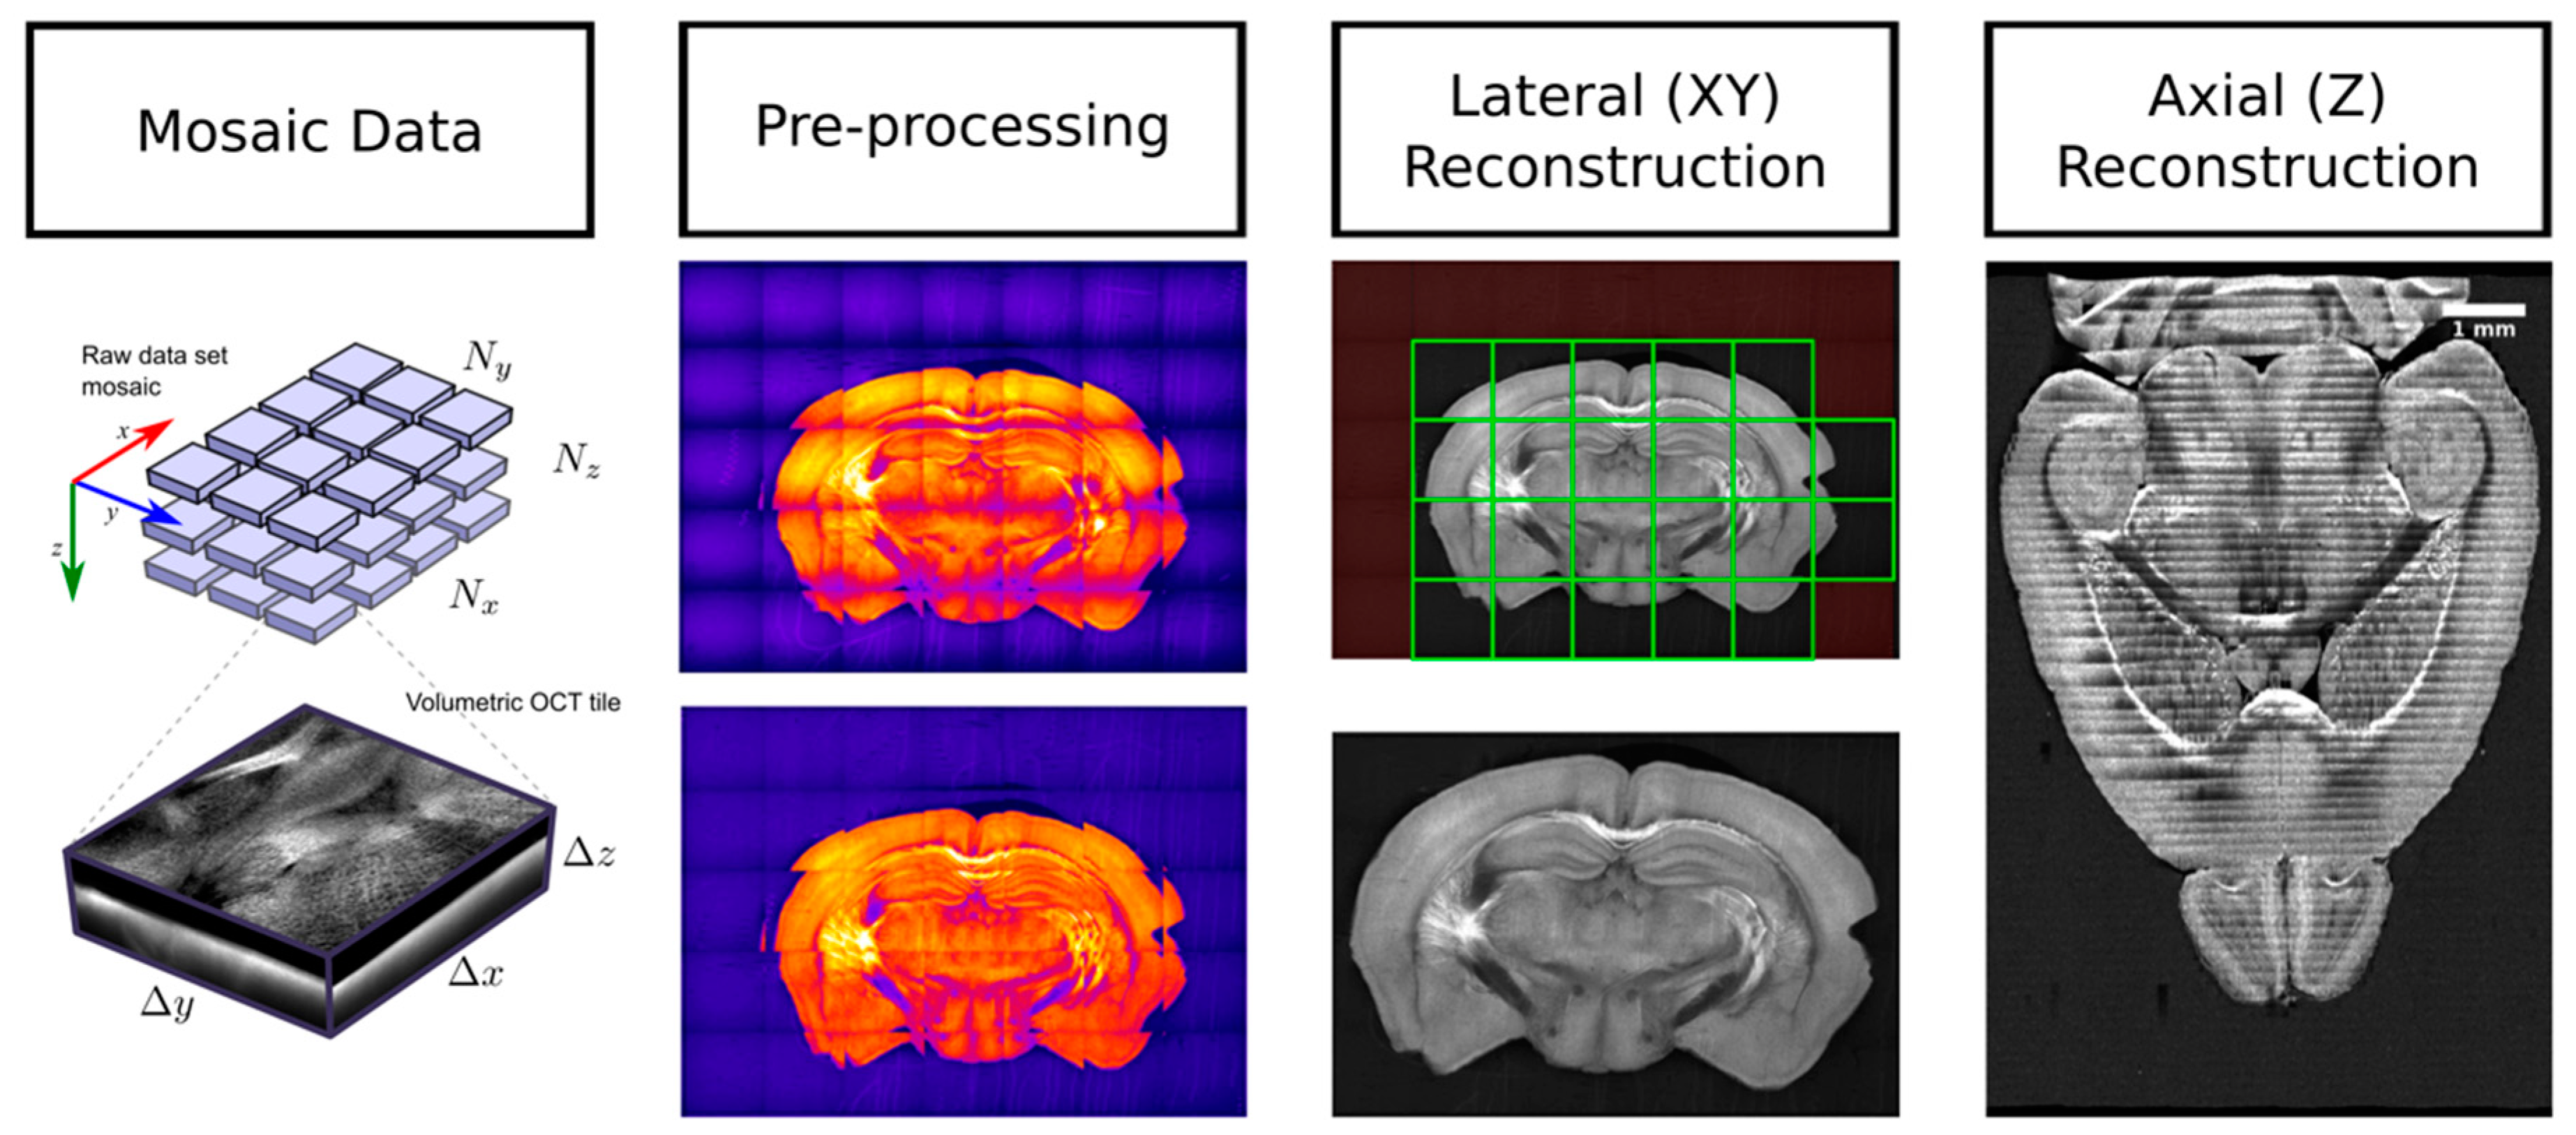
3.2. SBH Data Processing

The key advantage of SBH is that the generated sequential tissue images are inherently pre-aligned, which greatly simplifies the 3-D reconstruction algorithm when compared to high-throughput serial histology. Still, due to the limited FOV size of most optical setups, whole blockface tissue slices have to be acquired as a mosaic of tiles (Figure 3, 1st column). These tiles have to be assembled into a single image for each blockface tissue slice. Thus, most reconstruction pipelines for SBH consists in the steps illustrated in Figure 3.

3.2.1. SBH Data Preprocessing

The initial step of any SBH reconstruction pipeline is tile-based data preprocessing. This consists in various operations, including data compression, slice cropping, uneven illumination correction, optical aberrations compensation, optical attenuation extraction and compensation, as well as coarse data reconstruction for dataset quality assessment. The key preprocessing step that contributes to creating seamless assembled images is the uneven illumination correction (Figure 3, 2nd column). This correction can be performed in multiple ways. If a flat-field background image was acquired during the calibration phase of the acquisition, then it is used to normalize the intensity of each image [97]. If this data is not available, then the vignetting effect can be eliminated by cropping the images to only keep the relatively flat illumination area at the center of each tile [98]. Alternatives are estimating flat-field from the dataset, either by averaging all images within the dataset [12,99], by averaging only the tiles within the agarose background [16], or by performing low-frequency high-pass filtering of the illumination intensity [100]. A recent method, BaSiC [101], is a more advanced signal model to perform retrospective background and shading correction. It uses a shading model and optimization to compute both the flat-field and an additive dark-field from a collection of images.
The shading correction techniques described above were developed for 2-D image tiles. However, some imaging modalities (e.g., OCT) acquire a mosaic of 3-D volumetric tiles for each tissue slice. In that case, intensity inhomogeneities have to be compensated both laterally (X-Y) and axially (Z). For instance, in serial OCT [16], the contrast is affected by both the axial confocal point spread function (PSF) and by optical attenuation with depth. In that paper, the confocal PSF was compensated by fitting a Gaussian profile. Then a single-photon scattering model was used to model the optical attenuation with depth. This enabled the extraction of a spatially resolved attenuation coefficient within the tissue. This attenuation information was then used to remove this effect from the reflectivity data. Another uneven illumination compensation algorithm that was developed for 3-D data is Intensify3D [102]. This method first extracts the background of each 2-D image within a volume stack, then normalizes the images with this background. Last, the background correction is uniformized along the Z direction to obtain the final corrected stack. This method is recommended when the signal is sparse (e.g., for TPFM or for OCT with cleared tissue).

3.2.2. Intra-Slice Registration and Stitching

The second data processing step is intra-slice tile registration and stitching. The third column of Figure 3 illustrates this operation. Most methods assume that only translation is needed to register the tile within the global slice coordinate reference. This hypothesis is met in most instances by using multiple linear kinetic stages stacked on each other to move the sample under the microscope objective. An initial reconstruction effort in SBH used a semi-automated reconstruction approach, wherein a pair of adjacent images were first manually aligned and then the translation was propagated to all other tiles within the mosaic [103,104]. When necessary, an automatic fine-scale optimization is performed by using normalized cross-correlation and by detecting misidentified translations. Another early reconstruction effort used a Fourier-based cross-correlation technique to align the neighboring tiles in the X-Y plane and to assemble them by averaging the signal in the overlapping areas [11]. The registration is later optimized and fully automated by using phase correlation in Fourier space and by finding a global optimal configuration for all tiles within the mosaic [105,106]. This reconstruction approach also introduced a nonlinear blending method based on the exponentially weighted distance from the tile boundary. This data processing method was adopted by many SBH implementations [19,38,84,85] in part due to its integration as a plugin in the Fiji open-source biological-image analysis platform [107]. A similar open-source tool is TeraStitcher [108], which can be used either as a stand-alone software or as a plugin in Vaa3D [109,110]. This reconstruction pipeline was adapted to assemble the teravoxel sized images in an efficient manner, and it was used to assemble the data coming from both serial histology and light-sheet microscopy [111,112].
Instead of performing multiple registrations between neighboring tiles followed by position optimization, other techniques rely more directly on the high accuracy of the linear stages used for sample movements. For example, the serial photoacoustic microscope data reconstruction presented in Reference [17] does not perform any registration and it solely relies on precise stage positioning. In our previous works, we have adopted a similar approach by modeling the sample stage motion using either the acquired mosaic data [16] or during a calibration stage prior to acquisition [80]. We used the transform matrix obtained from the modeling to accurately predict the tile position within the assembled image without necessitating further optimization. The reconstruction method was also adapted to execute in parallel on a computer cluster. The tiles were stitched together using a linear blending and a novel diffusion-based blending weight method. Morphological operations were used to define the overlap area shape instead of relying on predefined overlay geometries. Finally, some mosaic reconstruction methods were developed to assemble tiles that were acquired without using a motorized stage. These techniques require an additional mosaic topology detection method. This provides an optimal path to traverse the mosaic and to compute a fine-scale registration between neighboring tiles. Some software tools using this technique to perform the mosaic assembly are MicroMos [113] and XuvTools [114].

3.2.3. Inter-Slice Registration and Stitching

The final data processing stage of SBH is z-axis registration and volume reconstruction from the series of assembled slices, corresponding to the 4th column of Figure 3. It is for this reconstruction step that the blockface configuration is the most helpful. Indeed, this imaging and slicing configuration introduces a very limited amount of tissue deformations. This eliminates the resource-intensive and time-consuming processing steps that are necessary with conventional serial histology, such as slice flattening [88], or complex deformable tissue registrations between slices [99,115,116,117,118]. In fact, some SBH systems [10,15,82] rely only on the accuracy of the motorized stage and on the slicing performance of the system and do not even perform axial registration between consecutive slices.
When SBH acquisition is performed with 3-D volumetric tiles, the axial shifts between each volume need to be computed in order to perform a seamless 3-D reconstruction. The axial registration is performed manually using either a GUI [11], a set of features between slices and a descriptor-based image registration method [81], or a normalized-correlation based method with the 2-D image gradient modulus [16]. Other reconstruction techniques do not assemble tissue slices and volumes in a consecutive way but instead treat all tiles at the same time and perform 3-D registration and optimization simultaneously [108]. In our previous work [16], the axial registration and stitching were combined with the in-slice 3-D tissue segmentation and mask optimization to make sure there is a consistent overlap between consecutive slices. This mask was also necessary to remove the water above the tissues in the acquired volumes. The slices were assembled using linear blending and diffusion-based blending weights. A similar reconstruction approach was employed for TPFM-SBF [82], where a small margin close to the cutting interface was removed from the data before assembling the slices to avoid introducing cutting artifacts in the reconstructed volume.
To summarize, data reconstruction is an essential part of SBF systems. Among all the data preprocessing algorithms, uneven illumination compensation is the most important to ensure a uniform and seamless reconstruction. Next, intra-slice registration and stitching is performed to obtain an image for each blockface tissue slice. This operation can use a variety of techniques and tools based on the data dimensionality (2-D vs. 3-D) and on the SBH setup. Finally, the tissue slices are assembled into a single volume. This inter-slice reconstruction requires the axial registration of adjacent blockface volumes for 3-D data. In the simplest case, no further image registration is necessary due to the inherent alignment of the tissue slices provided by SBH.

3.3. Alternatives to SBH

Apart from SBH, other whole brain imaging techniques exist. One option is to perform whole sample tissue clearing, a chemical treatment that dramatically reduces the optical scattering and absorption within the tissue [98,119,120,121]. These procedures render the samples clear and colorless. This allows the light to traverse the whole tissue section without much degradation and thus enable imaging, for example, of intact whole mouse brains. Some microscope configurations that exploit tissue clearing are optical projection tomography [122,123,124], light-sheet microscopy [125,126,127,128,129,130], clearing assisted scattering tomography [111], optical frequency domain imaging [111], and expansion super-resolution microscopy [131]. Despite the opportunity offered by tissue clearing to perform an optical imaging of complete whole brains, this process presents a few drawbacks such as a long preparation time, tissue shrinkage, protein and lipid loss, and the usage of highly toxic chemical reagents [132,133]. Tissue clearing is not limited to the imaging of intact whole mouse brains, it can be used with SBH, for example, to extend light penetration depth within the tissue, thus allowing thicker tissue sections and faster acquisition times. Tissue clearing with SBH was also shown to be beneficial to increase white matter contrast in clearing-assisted scattering tomography [111].
A different approach to whole brain imaging that can be used to work around the limited light penetration depth is to use histological slicing. With this technique, the brain can be cut into thin slices prior to imaging. The collected slices are usually labeled to provide contrast for various cellular components and then imaged with high-resolution photography. This is the way conventional histology is performed, and this is considered the gold standard in cellular biology upon which the findings observed by many other imaging modalities are validated. Histological slicing is a well-known and established technique, and the procedure was developed and improved over many decades. However, the complex tissue preparation procedure, the staining process, and manual slice handling can result in tissue deformations and damages and can represent a significant time investment for an imaging study. Some systems have been developed to address these limitations. For example, a slicing apparatus [134] was developed using a modified tape-transfer technique that combines cryostat sectioning with the tape-transfer technique and custom UV curing platform. This method enables a high-throughput preparation of histological slices with reduced sectioning-induced damages, and the authors report a preparation time of 4 h to slice a single frozen block into 20 microns thick histological slides. This system was used to obtain a brain-wide mesoscale connectivity mapping of the common marmoset [135]. The reported time to prepare and image a full Nissl marmoset brain was 6.4 days. Due to the very nature of histological imaging, consecutive slices were assembled using complex deformable registration methods in which prior-knowledge coming from pre-acquired MRI volumes or existing atlases are used to guide the histological data reconstruction [116]. Another strategy to assist data reconstruction is to acquire a high-resolution blockface photography prior to slicing and then use this blockface image as reference when performing the histological slice deformation [117,118,136].

4. Applications

SBH is an increasingly popular tool in neuroscience. This imaging setup was employed in high-profile scientific projects that study the connectome, gene expression, and microvasculature in whole mouse brains [13,14,15]. Since the seminal works that presented the first implementations of computer-controlled serial histology systems [10,11,12], multiple similar apparatus using intrinsic optical contrast have been built around the world [16,17,18,19,80]. Still, most neuroimaging studies with SBH use a combination of tissue clearing and fluorescent labeling. Significantly fewer applications using intrinsic optical contrast have been reported. The ICI-SBH systems reported in the literature are mainly used for two types of applications: validation studies and the creation of multimodal brain atlases.

4.1. Validation Studies

Some preliminary validation studies were performed with ICI-SBH. The goals of these studies can be separated into two main categories: (1) to better understand the origin of intrinsic optical contrast within the brain tissue and (2) to compare the information obtained from ICI serial histology with other neuroimaging modalities. The first category aims at delineating the information provided by intrinsic optics in the brain, and as such, the images are frequently compared to histological labeled slices. For example, OCT and optical coherence microscopy (OCM) images measured in brain tissues were compared with adjacent slices labeled with Nissl staining. The latter are considered the gold standard to study the brain tissue cytoarchitecture [84,86]. These studies have shown a good correlation between OCT and Nissl staining. They demonstrated that the cortical layers could be accurately segmented from the intrinsic OCT signal. For OCM, it was shown that the neuron cell bodies could be colocalized with Nissl in 60% of instances. Some of the variability has been attributed to light shadowing effects of dense fiber structures traversed by the sampling beam and to other protocols and human-related factors [86]. A similar study performed in the cerebellum showed that a polarization-sensitive OCT signal can be used to distinguish between the molecular layer, the granular layer, and the white matter fibers [137]. To confirm the myelin origin of CARS signals, brain tissue slices were labeled with a lipophilic fluorescent dye and imaged with TPEFm [20]. This comparison revealed that CARS is able to extract quantitative information about fiber volume, myelin density, and bundle orientation across the brain. A similar study was performed with third-harmonic generation (THG), and this modality was shown to colocalize with TPFM, the authors concluding that this dye-free modality is an ideal tool for the study of myelin loss and recovery [18]. The microtromy-assisted photoacoustic microscope (mPAM) images were compared with adjacent tissue slices stained with hematoxylin and eosin (H&E) to reveal that this modality can localize cell nuclei with a sensitivity of 93% and a specificity of 99.8% [17]. The authors have also demonstrated that this label-free imaging method is sensitive to DNA/RNA, hemoglobin, and lipids, enabling the visualization of cell nuclei, blood vessels, axons, and other anatomical structures. To validate the sensitivity of optical frequency domain imaging (OFDI) to neuronal fiber bundles and blood vessels, the same tissue slices were stained with fluorescent dyes and observed with confocal fluorescence microscopy [111]. This revealed a strong correlation between the label-free scattering signal and the fluorescent signal, demonstrating that a clearing can selectively enhance the contrast of some important anatomical structures in mammalian brains.
Another type of validation study aims at using serial block-face histology in combination with MRI to validate the hypotheses used when analyzing the MRI results. Due to the capability of OCT to directly image myelinated fibers without requiring tissue labeling, this modality was compared with diffusion MRI data in multiple investigations. Using polarization-sensitive OCT, Wang et al. demonstrated that the optical contrast was able to extract the fiber orientation that was consistent with fiber bundles orientation obtained with DTI [50]. Furthermore, they showed that analyzing the image texture orientation with the structure tensor technique also provided information that correlated with DTI measurements [138]. With a similar serial OCT setup, we developed a fully automated reconstruction and registration pipeline that enabled the alignment to a common coordinate framework of both the reconstructed brain and the dMRI data acquired in the same brains prior to slicing [16]. This enabled the direct comparison of OCT contrast with dMRI derived metrics, validating the relationship between the fiber bundle angle and contrast. It, moreover, indicated potential new OCT contrast mechanisms such as fiber orientation heterogeneity, fiber bundle density, and neurite density. This pipeline was also used to study the deformations introduced by tissue fixation, by brain extraction and by serial histology [139]. The comparison between in vivo MRI, ex vivo MRI, and assembled 3-D OCT brains revealed that the main deformations were imputable to a lack of tissue adhesion to the agarose embedding matrix and to ventricles collapse after the animal sacrifice. In a further study [80], our SOCT apparatus was modified to include a second high-resolution arm, which enabled the acquisition of OCM volumes that could be precisely colocalized with dMRI voxels in 3-D in an automated fashion. This was used to compare the white matter microstructure directly with various dMRI metrics and to validate the intuition underlying some dMRI models. This tool, as it provides a way to perform completely automatized validation studies of MRI, presents a good potential for future multimodal neuroimaging studies. In a similar MRI validation work, CARS microscopy of mouse brain slices was used to develop a myelin sheet segmentation method [140]. In follow-up works, the segmentation model was adapted for serial electron microscopy [141,142]. These techniques can be used as examples to compare the histology derived g-ratio of myelin sheets with similar measurements obtained from MRI [143,144] and to validate microstructural imaging using quantitative MRI in the spinal cord [145].

4.2. Multi-Modal Brain Atlases

Another common use of SBH is to create multimodal brain atlases combining multiple image sources such as MRI, conventional histological staining, and blockface intrinsic contrast imaging. In these instances, the intrinsic imaging modality most commonly used is high-resolution blockface photography. For example, this modality was used in an early work to create a multimodal mouse brain atlas [146]. Besides high-resolution blockface photography, this atlas also contains diffusion-weighted MRI volumes, histological stains (Nissl-bodies, myelin, and acetylcholine-esterase), and immunohistochemistry essays revealing a few gene expression maps. In a similar work, blockface images were acquired before performing Nissl staining to help with 3-D data reconstruction and further alignment with MRI data for the Waxholm space atlas [147]. The strategy of using the blockface images to serve as a reference for histological slice deformations was adopted by other high-throughput brain atlasing projects. For instance, this technique was adopted for human brains (BigBrain project) [118], for rodent brains [136], for opossum brains [148], and for common marmoset brains [135]. The blockface photography used in these projects could be replaced by other more informative intrinsic imaging modalities, such as autofluorescence or OCT. These modalities have the double advantage of providing more tissue selectivity due to their optical slicing capability and of providing 3-D slice acquisition. The 3-D information can be used to exclude the tissue deformations near the cutting interface, to provide more information for the 3-D reconstruction, and to guide the nonlinear deformations of the histological slices. An original approach for obtaining cytoarchitecture landmarks at the cellular level was to perform in situ cell body counterstaining during serial histology [149]. This was achieved by immersing the brain in a fluorescent nuclear staining solution and by letting the dye penetrate in the tissue after each tissue sections. Another recent multimodal serial histology system is ChroMS [87], a multicolor and multiscale brain imaging apparatus with chromatic multiphoton serial microscopy. This implementation enables the acquisition with a single microscope of both fluorescent proteins and of label-free nonlinear signals (THG and CARS) used to identify the white matter fiber bundles.

5. Discussion and Conclusions

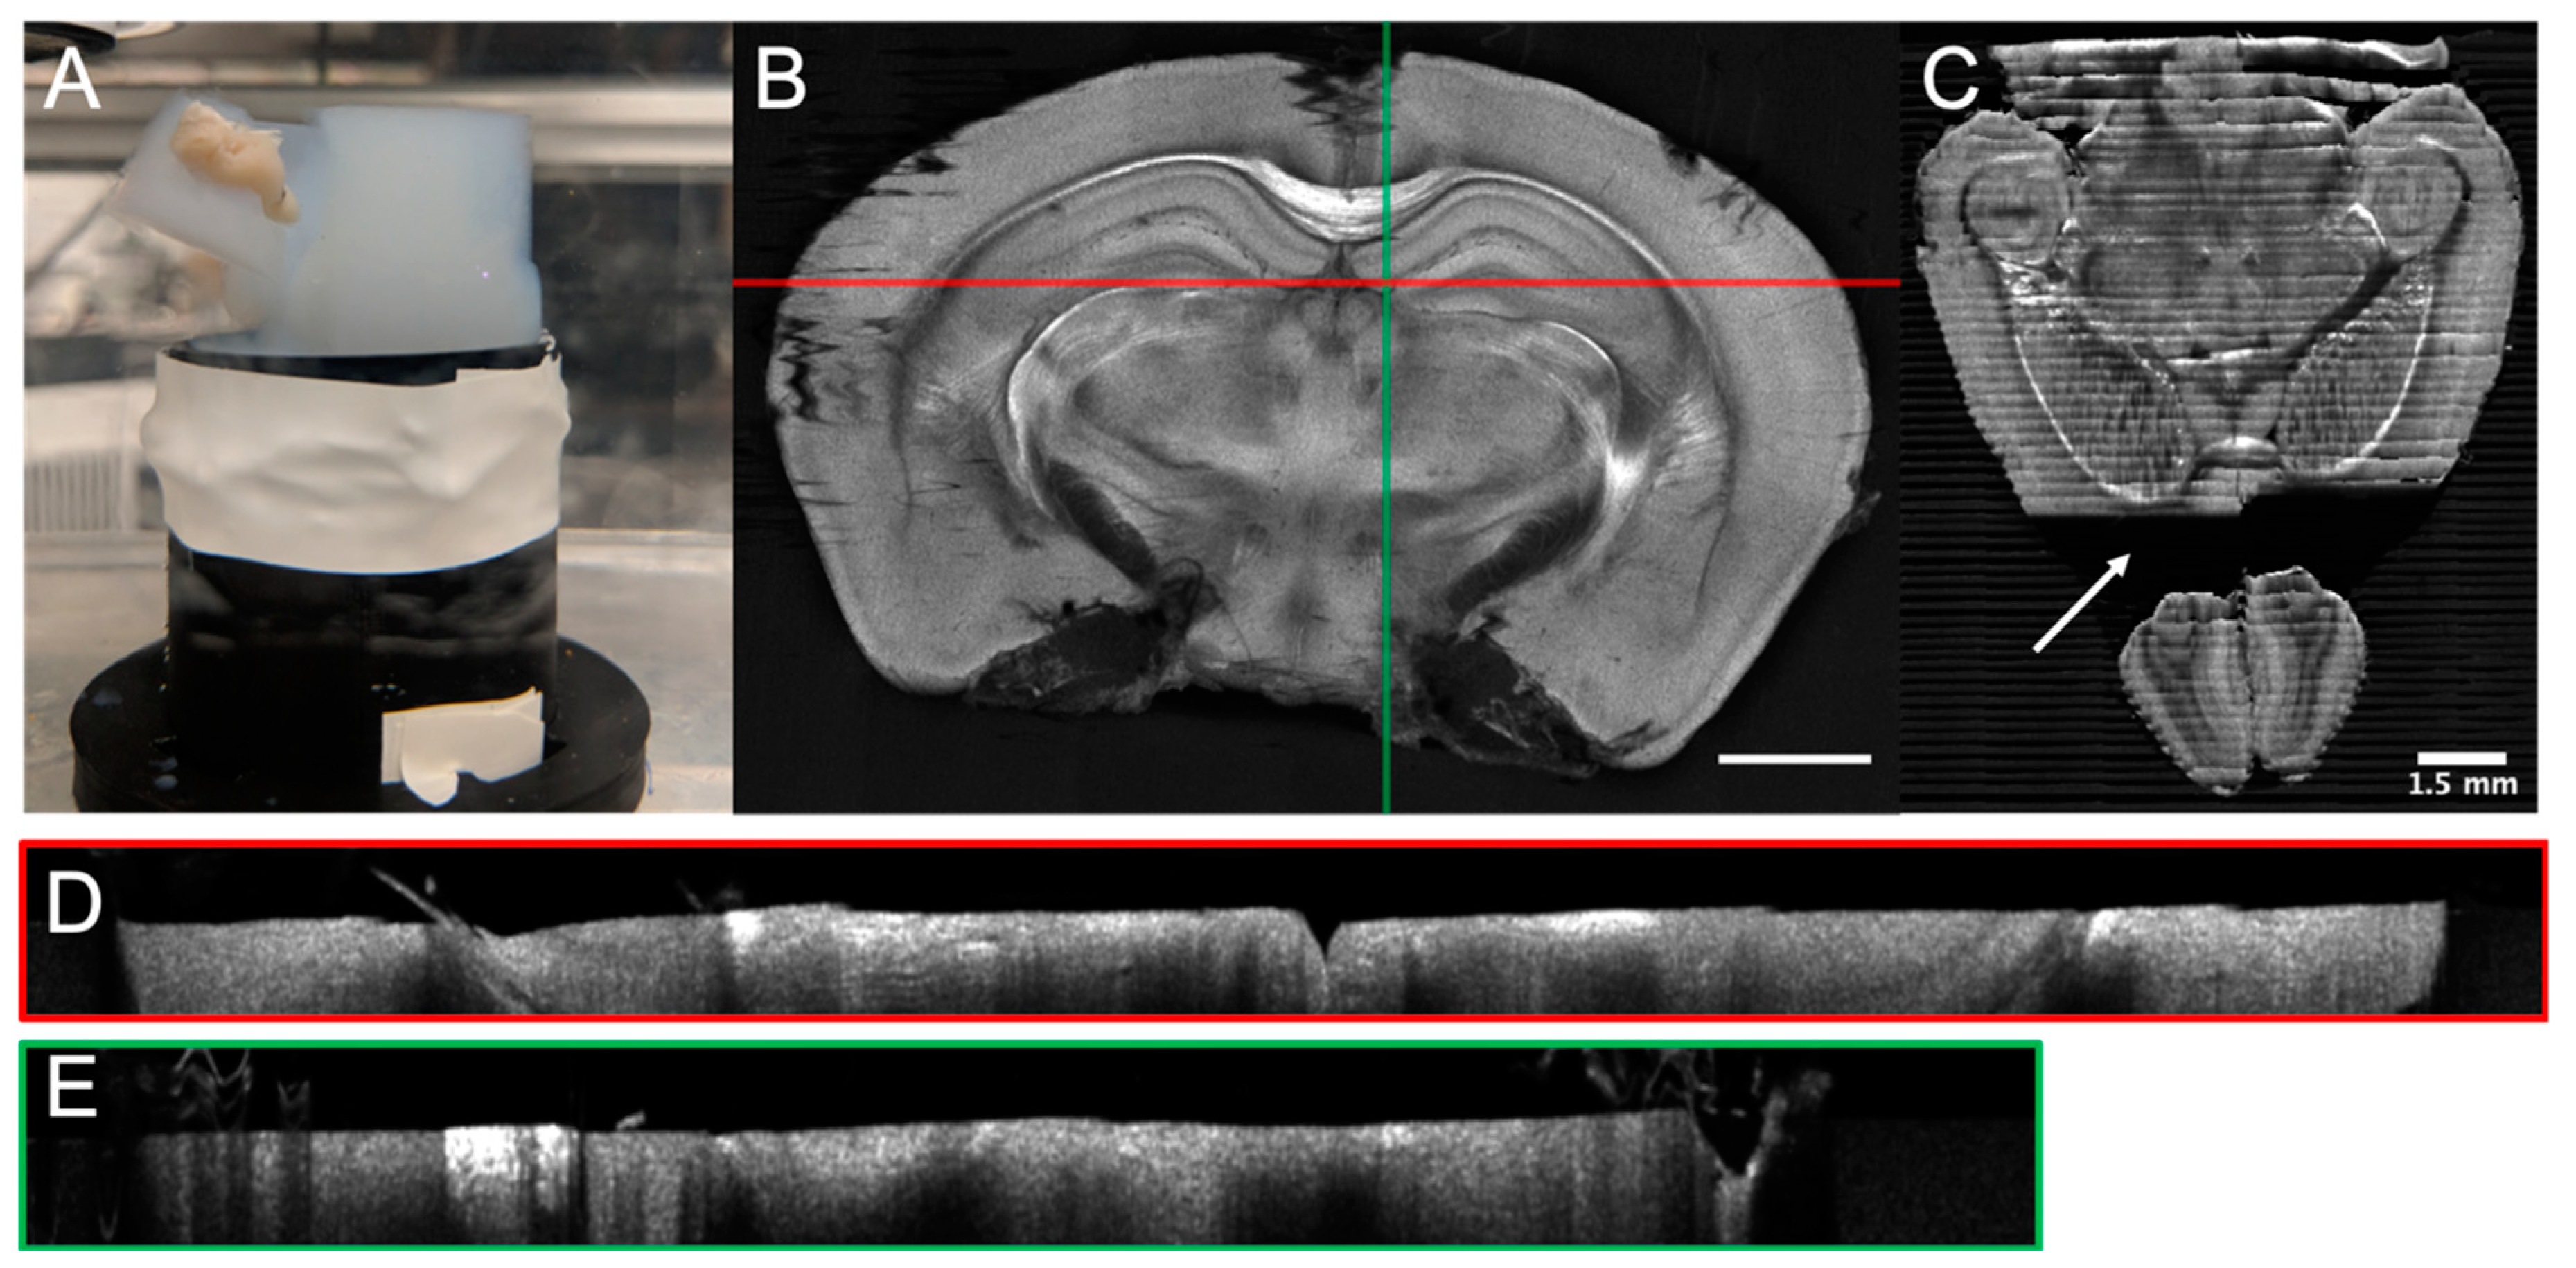
5.1. Tissue Preparation and Cutting Artefacts

Compared to conventional serial histology, SBH greatly reduces tissue deformations and artifacts caused by slicing, fixation, and tissue preparation. This simplifies the data reconstruction methods because complex nonlinear deformations are not necessary to align consecutive images. Some methods reported in the literature do not even perform image registration to obtain the tile position within the mosaics, as they solely rely on the motorized stage positioning accuracy [16,17,80]. Regardless of this advantage of SBH, tissue preparation still remains an important aspect to consider. Common steps in tissue preparation protocols include animal sacrifice, perfusion with a fixating agent, brain extraction from the skull, sample storage, optional tissue clearing, and brain embedding in an agarose matrix. When performing additional ex vivo neuroimaging (e.g., MRI), the animal can also be perfused with additional contrast agents. An aspect often missing in published brain atlases obtained from serial histology is the localization of anatomical reference points. For example, many neurophotonics studies localize the imaging position according to skull-based reference points such as the bregma and lambda points [150,151,152]. Thus, keeping track of the precise position of an acquired brain within the animal skull would enable neuroscientists to access the serial histological data more reliably. To address this question, Majka et al. [148] acquired micro-computed tomography and ex vivo anatomical MRI before histology and then performed a multimodal registration of the histological data onto these pre-acquired volumes. A similar multimodal imaging pipeline could be adopted for whole rodent brain imaging with SBH.
An understudied aspect of whole brain serial histology is the effect of ex vivo neuroimaging on the tissue. For example, many studies perform MRI and dMRI acquisitions on fixed mouse brains after animal sacrifice and before brain extraction and histological slicing. Some of the imaging protocols require perfusion with contrast enhancing agents, brain immersion in low MRI signal liquids (e.g., Fomblin) and long acquisition sequences (multiple hs/days). These could have an effect on brain tissue properties due to energy deposits by the MRI sequence, chemical interaction with the contrast agent, immersion fluid, or other reagents, as well as the longer waiting time between animal sacrifice and serial histology acquisition. To illustrate, we have observed experimentally that brains imaged with long MRI sequences before serial OCT acquisitions exhibited more partial tissue tearing during sectioning. These appeared as floating fibers in the acquired images (Figure 4E). Similarly, in a previous investigation [139] of brain tissue spatial deformations induced by sample preparation, stronger tissue shrinkage along the brain’s longitudinal axis was identified between ex vivo brains in and out of the skull. Also, our analysis revealed that ex vivo brains exhibited ventricles collapse when compared with in vivo MRI volumes acquired within the same animal. Possible causes of these deformations are the reduction of intracranial pressure after sacrifice and the use of a vacuum pump to remove any bubbles in the MRI immersion fluid that could induce imaging artifacts during MRI. Both the experimental observation and the quantitative evaluation of tissue deformations induced by serial histology reveal that the effect of neuroimaging on fixed whole mouse brains needs to be better understood. An optimization of the ex vivo MRI imaging protocols will also reduce the effect of these acquisitions on the ex vivo tissue.
Some of the tissue-related deformations come also from the slicing process. The brain is usually embedded in an agarose block, which is itself fixed in a water-filled container to help with tissue slices removal. Many factors can impact the vibratome tissue sectioning efficacy. Some are related to the agarose embedding (size and geometry of the block, agarose concentration, agarose oxidation, and fixation method in the water container), some are related to the blade (vibrating frequency, blade width, angles, slice thickness, cutting speed, blade holding mechanism, etc.), and others are linked to various experimental factors (temperature, laser power, acquisition duration, etc.). The optimization of the mechanical aspect of vibratome sectioning is an aspect that deserves more attention, as this will help to reduce the slicing related deformations. Some of the tissue-sectioning artifacts that were observed with our serial OCT are illustrated in Figure 4. These include agarose tearing due to the shearing force of the blade and adhesion of agarose to the 3-D printed plastic base (Figure 4A), tissue separation from the agarose matrix causing brain displacements and missing cuts (Figure 4C), cutting interface denivelation (Figure 4D), floating fibres and tissue slices (Figure 4B,E), and tissue tearing (Figure 4E), often occurring with the olfactory lobes at the end of acquisition. Sometimes the tissue slices were stuck on the agarose block after sectioning, thus preventing the imaging of the next blockface. These slicing-related tissue deformations complexify the acquisition and reconstruction methods, for example, by necessitating a water-tissue interface detection during acquisition or data reconstruction. Furthermore, some of the deformations cause data obstructions or complete loss of tissue that impedes data reconstruction and further limits the information available for data analysis. The vibrating blade also represents a limitation on the sample size that can be imaged with SBH, as the agarose block cannot be wider than the blade width. Alternative cutting methods thus need to be considered if larger samples need to be imaged (e.g., fixed diamond blade or all-optical histology [92]), or different tissue preparation and embedding protocols need to be developed (i.e., splitting a larger brain into smaller blocks that are imaged separately with the serial histology microscopy and then assembled back on the computer into a single volume).
Further work is needed to improve the reliability of serial blockface imaging. For example, an initial effort [153] has derived an analytical model to describe the sectioning of soft materials with an oscillating blade. This model could be used to predict the optimal cutting parameters for various tissues. A systematic investigation could be done to adapt these results to the SBH configuration and to establish an optimized tissue preparation protocol. Furthermore, data reconstruction and analysis methods should consider these tissue deformations by either identifying missing brain areas, compensating for cutting interface imperfection and denivelations, or by considering the effect of tissue fixations.

5.2. Machine Learning and Serial Histology

SBH generates a tremendous amount of data for each brain. This represents a challenge for data management, reconstruction, and the analysis methods. Future development in this neurophotonics field will increasingly require a closer synergy between imaging and machine learning. This effort will likely have two objectives: (1) to accelerate image acquisition and reconstruction by integrating the microscope with advanced computer vision methods and (2) to analyze the large amount of data generated by such imaging systems with machine learning based methods.
First, combining serial imaging with computer vision methods and automation procedures will reduce the acquisition time of whole datasets. Applications include the automation of ROI selection [154], the acceleration of acquisition time with compressed sensing [155,156] and with deep learning [157], and the adaptation of the acquisition protocol to deep learning based denoising techniques such as Noise2Noise [158]. To accelerate high-throughput microscopy, a recent work [159] has combined a microscope with a deep learning image reconstruction approach. This method employs a generative adversarial network (GAN) to infer a realistic high-resolution image from a low-resolution acquisition. Regarding automated ROI selection, another recent work has presented a technique to colocalize a 2-D histological image within the 3-D Allen mouse brain template [160]. Integrating this approach to an SBH system will allow the use of existing templates to target structures in the brain. Similar advances were presented in the field of augmented reality microscopy. With the use of modern computer vision and machine learning methods, these novel systems can perform automated cell tracking with a convolutional neural network trained for object detection [161], cancerous tissue identification with image classification networks [162], or the use of machine learning for online automated optimization of microscopy [163].
A second application of machine learning for SBH will likely be to better exploit the immense amount of data generated by these imaging systems. Similar efforts were deployed in whole slide histology image analysis [164,165,166]. These methods can be applied to detect and remove imaging artifacts, to improve image denoising, to perform image segmentation, to assist data annotation, and to detect tissue changes in an unsupervised way. A recent work has used image texture information and machine learning to improve multimodal brain registration [167]. Their technique was also used to create an active atlas that is improved after each use. For multimodal brain imaging studies, weakly supervised learning, multiple instances learning, and unsupervised methods could be used to identify changes in large histological 3-D data sets [166]. It will thus reduce the quantity of human intervention to annotate the data. This will contribute to a better understanding of the evolution of various neurodegenerative pathologies and could help discover early biomarkers of these diseases. Relating MRI and whole brain histology can, in addition, help link MRI-based biomarkers to optical biomarkers. These could be used by neurosurgeons when performing an intervention. Indeed, as intrinsic optics does not require the addition of contrast agents, the findings in SBH using intrinsic contrast could potentially be translated to human intervention with robotic microscopes, similar to a reported robotic Raman platform used to identify tumors during surgery [168].

5.3. Open-Source SBH Platform

SBH using the brain tissue intrinsic contrast offers great potential for future neuroimaging studies. This is due to its simplified tissue preparation protocol and its significant reduction of slicing-induced deformations and of acquisition time. This review has identified a variety of serial histology implementations using intrinsic optics, each exploiting a different contrast mechanism. An observation from this literature search is that there is no common architecture between imaging pipelines. Systems were developed by multiple research groups around the world, each team developing their own solution for the serial histology optical design, for microscope automation, for reconstruction, and for analysis pipelines. A consolidation of the research and development efforts to create a standardized serial histology platform would be of great service to the neuroimaging community. The standardization of open-source serial histology platform would be akin to the open source efforts that democratized light-sheet microscopy [169] with the OpenSPIM platform [170] and single-plane illumination microscopy with the MesoSPIM platform [171]. These projects provide the microscope optical design (mechanical components, list of parts, and installation instructions), the open source control software, the tissue preparation protocols, and the open documentation. A similar project for sample clearing and whole-mount immunolabeling for volume imaging is iDISCO [172]. This project also provides the ClearMap software [173] to analyze the volumetric data acquired from tissue prepared by iDISCO. It is not in the scope of this review paper to provide a detailed design of an open-source SBH platform. Nevertheless, it is possible to identify the principal modular components of most SBH systems (Table 2).
An SBH platform designed in a modular manner would offer the possibility to select various intrinsic contrasts. As the technological platform settles and matures, this multi-center solution would empower neuroscientists to perform studies using this new tool and it could be adopted by other research communities. Furthermore, the combination of SBH and machine learning is a must as these systems will generate increasing amounts of data that will require a closer merge of both fields to analyze this information. Finally, an open-source serial histology platform could contribute to creating a multimodal multiscale atlas of the brain intrinsic contrast properties. Such information could be integrated in a public mouse brain database such as the Scalable atlas project [174] and would offer an invaluable reference asset for neuroscientists. Needless to say, creating an open-source platform for serial blockface imaging is an initiative that will require the collaboration of multiple research groups. This effort could be initiated by a set of meetings and workshops, similar to the mesoSPIM initiative.

Author Contributions

Writing—original draft preparation, J.L. and P.D.-M.; writing—review and editing, J.L. and F.L.; supervision, F.L.

Funding

This work was supported by a Fonds de Recherche du Québec-Nature et Technologies (FRQ-NT) postdoctoral research scholarship to J. Lefebvre and by a CIHR Project grant to F. Lesage.

Conflicts of Interest

The authors declare no conflict of interest.

References

  1. Raichle, M.E. A Brief History of Human Brain Mapping. Trends Neurosci. 2009, 32, 118–126. [Google Scholar] [CrossRef] [PubMed]
  2. Filippi, M. Oxford Textbook of Neuroimaging; Oxford University Press: New York, NY, USA, 2015. [Google Scholar] [CrossRef]
  3. Doronina-Amitonova, L.V.; Fedotov, I.V.; Fedotov, A.B.; Anokhin, K.V.; Zheltikov, A.M. Neurophotonics: Optical Methods to Study and Control the Brain. Uspekhi Fiz. Nauk 2015, 185, 371–392. [Google Scholar] [CrossRef]
  4. Cho, Y.K.; Zheng, G.; Augustine, G.J.; Hochbaum, D.; Cohen, A.; Knöpfel, T.; Pisanello, F.; Pavone, F.S.; Vellekoop, I.M.; Booth, M.J.; et al. Roadmap on Neurophotonics. J. Opt. 2016, 18, 093007. [Google Scholar] [CrossRef] [PubMed]
  5. Keiser, G. Biophotonics; Graduate Texts in Physics; Springer: Singapore, 2016. [Google Scholar] [CrossRef]
  6. Farkas, E.; Luiten, P.G.M. Cerebral Microvascular Pathology in Aging and Alzheimer’s Disease. Prog. Neurobiol. 2001, 64, 575–611. [Google Scholar] [CrossRef]
  7. De La Torre, J.C. Is Alzheimer’s Disease a Neurodegenerative or a Vascular Disorder? Data, Dogma, and Dialectics. Lancet Neurol. 2004, 3, 184–190. [Google Scholar] [CrossRef]
  8. de la Torre, J.C. Cerebrovascular and Cardiovascular Pathology in Alzheimer’s Disease. Int. Rev. Neurobiol. 2009, 84, 35–48. [Google Scholar] [PubMed]
  9. Grammas, P.; Martinez, J.; Miller, B. Cerebral Microvascular Endothelium and the Pathogenesis of Neurodegenerative Diseases. Expert Rev. Mol. Med. 2011, 13. [Google Scholar] [CrossRef] [PubMed]
  10. Tsai, P.S.; Friedman, B.; Ifarraguerri, A.I.; Thompson, B.D.; Lev-Ram, V.; Schaffer, C.B.; Xiong, Q.; Tsien, R.Y.; Squier, J.A.; Kleinfeld, D. All-Optical Histology Using Ultrashort Laser Pulses. Neuron 2003, 39, 27–41. [Google Scholar] [CrossRef] [Green Version]
  11. Sands, G.B.; Gerneke, D.A.; Hooks, D.A.; Green, C.R.; Smaill, B.H.; Legrice, I.J. Automated Imaging of Extended Tissue Volumes Using Confocal Microscopy. Microsc. Res. Tech. 2005, 67, 227–239. [Google Scholar] [CrossRef] [PubMed]
  12. Ragan, T.; Kadiri, L.R.; Venkataraju, K.U.; Bahlmann, K.; Sutin, J.; Taranda, J.; Arganda-Carreras, I.; Yongsoo, K.; Seung, H.S.; Osten, P. Serial two-photon tomography for automated ex vivo mouse brain imaging. Nat. Methods 2012, 9, 255–258. [Google Scholar] [CrossRef] [PubMed]
  13. Lein, E.S.; Hawrylycz, M.J.; Ao, N.; Ayres, M.; Bensinger, A.; Bernard, A.; Boe, A.F.; Boguski, M.S.; Brockway, K.S.; Byrnes, E.J.; et al. Genome-Wide Atlas of Gene Expression in the Adult Mouse Brain. Nature 2007, 445, 168–176. [Google Scholar] [CrossRef] [PubMed]
  14. Kleinfeld, D.; Bharioke, A.; Blinder, P.; Bock, D.D.; Briggman, K.L.; Chklovskii, D.B.; Denk, W.; Helmstaedter, M.; Kaufhold, J.P.; Lee, W.-C.A.; et al. Large-Scale Automated Histology in the Pursuit of Connectomes. J. Neurosci. 2011, 31, 16125–16138. [Google Scholar] [CrossRef] [PubMed] [Green Version]
  15. Oh, S.W.; Harris, J.A.; Ng, L.; Winslow, B.; Cain, N.; Mihalas, S.; Wang, Q.; Lau, C.; Kuan, L.; Henry, A.M.; et al. A Mesoscale Connectome of the Mouse Brain. Nature 2014, 508, 207–214. [Google Scholar] [CrossRef] [PubMed]
  16. Lefebvre, J.; Castonguay, A.; Pouliot, P.; Descoteaux, M.; Lesage, F. Whole Mouse Brain Imaging Using Optical Coherence Tomography: Reconstruction, Normalization, Segmentation, and Comparison with Diffusion MRI. Neurophotonics 2017, 4, 41501. [Google Scholar] [CrossRef] [PubMed]
  17. Wong, T.T.W.; Zhang, R.; Zhang, C.; Hsu, H.-C.; Maslov, K.I.; Wang, L.V.L.; Shi, J.; Chen, R.; Shung, K.K.; Zhou, Q.; et al. Label-Free Automated Three-Dimensional Imaging of Whole Organs by Microtomy-Assisted Photoacoustic Microscopy. Nat. Commun. 2017, 8, 1386. [Google Scholar] [CrossRef] [PubMed]
  18. Farrar, M.J.; Wise, F.W.; Fetcho, J.R.; Schaffer, C.B. In Vivo Imaging of Myelin in the Vertebrate Central Nervous System Using Third Harmonic Generation Microscopy. Biophys. J. 2011, 100, 1362–1371. [Google Scholar] [CrossRef] [PubMed] [Green Version]
  19. Wang, H.; Zhu, J.; Akkin, T. Serial Optical Coherence Scanner for Large-Scale Brain Imaging at Microscopic Resolution. Neuroimage 2014, 84, 1007–1017. [Google Scholar] [CrossRef] [PubMed]
  20. Fu, Y.; Huff, T.B.; Wang, H.-W.; Cheng, J.-X.; Wang, H. Ex Vivo and in Vivo Imaging of Myelin Fibers in Mouse Brain by Coherent Anti-Stokes Raman Scattering Microscopy. Opt. Express 2008, 16, 19396. [Google Scholar] [CrossRef]
  21. Yaqoob, Z.; Wu, J.; Yang, C. Spectral Domain Optical Coherence Tomography: A Better OCT Imaging Strategy. Biotechniques 2005, 39 (Suppl. 6). [Google Scholar] [CrossRef]
  22. Zipfel, W.R.; Williams, R.M.; Christie, R.; Nikitin, A.Y.; Hyman, B.T.; Webb, W.W. Live Tissue Intrinsic Emission Microscopy Using Multiphoton-Excited Native Fluorescence and Second Harmonic Generation. Proc. Natl. Acad. Sci. USA 2003, 100, 7075–7080. [Google Scholar] [CrossRef]
  23. Wang, L.V. Tutorial on Photoacoustic Microscopy and Computed Tomography. IEEE J. Sel. Top. Quantum Electron. 2008, 14, 171–179. [Google Scholar] [CrossRef]
  24. Wang, X.; Pang, Y.; Ku, G.; Xie, X.; Stoica, G.; Wang, L.V. Noninvasive Laser-Induced Photoacoustic Tomography for Structural and Functional in Vivo Imaging of the Brain. Nat. Biotechnol. 2003, 21, 803–806. [Google Scholar] [CrossRef] [PubMed]
  25. Schlup, P.; Masihzadeh, O.; Bartels, R.A. High-Speed, Label-Free Second Harmonic Generation Holographic Microscopy of Biological Specimens. Multiphot. Microsc. Biomed. Sci. XI 2011, 7903, 790308. [Google Scholar] [CrossRef]
  26. Witte, S.; Negrean, A.; Lodder, J.C.; de Kock, C.P.J.; Testa Silva, G.; Mansvelder, H.D.; Louise Groot, M. Label-Free Live Brain Imaging and Targeted Patching with Third-Harmonic Generation Microscopy. Proc. Natl. Acad. Sci. USA 2011, 108, 5970–5975. [Google Scholar] [CrossRef] [PubMed]
  27. Ozeki, Y.; Dake, F.; Kajiyama, S.; Fukui, K.; Itoh, K. Analysis and Experimental Assessment of the Sensitivity of Stimulated Raman Scattering Microscopy. Opt. Express 2009, 17, 3651. [Google Scholar] [CrossRef] [PubMed]
  28. Cote, D.; Lin, C.P.; Evans, C.L.; Puoris’haag, M.; Potma, E.O.; Xie, X.S. Chemical Imaging of Tissue in Vivo with Video-Rate Coherent Anti-Stokes Raman Scattering Microscopy. Proc. Natl. Acad. Sci. USA 2005, 102, 16807–16812. [Google Scholar] [CrossRef]
  29. Huang, D.; Swanson, E.A.; Lin, C.P.; Schuman, J.S.; Stinson, W.G.; Chang, W.; Hee, M.R.; Flotte, T.; Gregory, K.; Puliafito, C.A.; et al. Optical Coherence Tomography. Science 1991, 254, 1178–1181. [Google Scholar] [CrossRef] [Green Version]
  30. Bourdieu, L.; Léger, J.-F.; Boccara, C.; Ben Arous, J.; Binding, J.; Gigan, S. Brain Refractive Index Measured in Vivo with High-NA Defocus-Corrected Full-Field OCT and Consequences for Two-Photon Microscopy. Opt. Express 2011, 19, 4833. [Google Scholar] [CrossRef]
  31. Sun, J.; Jin Lee, S.; Wu, L.; Sarntinoranont, M.; Xie, H. Refractive Index Measurement of Acute Rat Brain Tissue Slices Using Optical Coherence Tomography. Opt. Express 2012, 20, 1084–1095. [Google Scholar] [CrossRef]
  32. Bachmann, L.; Zezell, D.M.; Ribeiro, A.D.C.; Gomes, L.; Ito, A.S. Fluorescence Spectroscopy of Biological Tissues—A Review. Appl. Spectrosc. Rev. 2006, 41, 575–590. [Google Scholar] [CrossRef]
  33. Petry, R.; Schmitt, M.; Popp, J. Raman Spectroscopy—A Prospective Tool in the Life Sciences. ChemPhysChem 2003, 4, 14–30. [Google Scholar] [CrossRef] [PubMed]
  34. Mishchenko, M.I.; Travis, L.D.; Lacis, A.A. Multiple Scattering of Light by Particles: Radiative Transfer and Coherent Backscattering; Cambridge University Press: New York, NY, USA, 2006. [Google Scholar]
  35. Jacques, S.L. Optical Properties of Biological Tissues: A Review. Phys. Med. Biol. 2013, 58, R37. [Google Scholar] [CrossRef] [PubMed]
  36. Faber, D.J.; van der Meer, F.J.; Aalders, M.C.G.; van Leeuwen, T.G. Quantitative Measurement of Attenuation Coefficients of Weakly Scattering Media Using Optical Coherence Tomography. Opt. Express 2004, 12, 4353–4365. [Google Scholar] [CrossRef] [PubMed]
  37. Xu, M.; Wang, L.V. Photoacoustic Imaging in Biomedicine. Rev. Sci. Instrum. 2006, 77, 41101. [Google Scholar] [CrossRef]
  38. Li, W.; Chen, R.; Lv, J.; Wang, H.; Liu, Y.; Peng, Y.; Qian, Z.; Fu, G.; Nie, L. In Vivo Photoacoustic Imaging of Brain Injury and Rehabilitation by High-Efficient Near-Infrared Dye Labeled Mesenchymal Stem Cells with Enhanced Brain Barrier Permeability. Adv. Sci. 2018, 5. [Google Scholar] [CrossRef]
  39. Yang, S.; Xing, D.; Lao, Y.; Yang, D.; Zeng, L.; Xiang, L.; Chen, W.R. Noninvasive Monitoring of Traumatic Brain Injury and Post-Traumatic Rehabilitation with Laser-Induced Photoacoustic Imaging. Appl. Phys. Lett. 2007, 90, 243902. [Google Scholar] [CrossRef]
  40. Guevara, E.; Berti, R.; Londono, N.; Xie, N.; Bellec, P.; Lesage, R.; Lodygensky, G.A. Imaging of an Inflammatory Injury in the Newborn Rat Brain with Photoacoustic Tomography. PLoS ONE 2013, 8, e83045. [Google Scholar] [CrossRef]
  41. Ku, G.; Wang, X.; Xie, X.; Stoica, G.; Wang, L.V. Imaging of Tumor Angiogenesis in Rat Brains in Vivo by Photoacoustic Tomography. Appl. Opt. 2005, 44, 770–775. [Google Scholar] [CrossRef]
  42. Li, M.-L.; Oh, J.-T.; Xie, X.; Ku, G.; Wang, W.; Li, C.; Lungu, G.; Stoica, G.; Wang, L.V. Simultaneous Molecular and Hypoxia Imaging of Brain Tumors In Vivo Using Spectroscopic Photoacoustic Tomography. Proc. IEEE 2008, 96, 481–489. [Google Scholar] [CrossRef]
  43. De Boer, J.F. Polarization Sensitive Optical Coherence Tomography: A Review of Technology and Applications. Appl. Sci. 2017, 7, 474. [Google Scholar] [CrossRef]
  44. Kasaragod, D.K.; Lu, Z.; Jacobs, J.; Matcher, S.J. Experimental validation of an extended Jones matrix calculus model to study the 3D structural orientation of the collagen fibers in articular cartilage using polarization-sensitive optical coherence tomography. Biomed. Opt. Express 2012, 3, 378–387. [Google Scholar] [CrossRef] [PubMed]
  45. Deber, C.M.; Reynolds, S.J. Central Nervous System Myelin: Structure, Function, and Pathology. Clin. Biochem. 1991, 24, 113–134. [Google Scholar] [CrossRef]
  46. Villiger, M.; Zhang, E.Z.; Nadkarni, S.K.; Oh, W.-Y.; Vakoc, B.J.; Bouma, B.E. Spectral Binning for Mitigation of Polarization Mode Dispersion Artifacts in Catheter-Based Optical Frequency Domain Imaging. Opt. Express 2013, 21, 16353. [Google Scholar] [CrossRef] [PubMed]
  47. van der Sijde, J.N.; Karanasos, A.; Villiger, M.; Bouma, B.E.; Regar, E. First-in-Man Assessment of Plaque Rupture by Polarization-Sensitive Optical Frequency Domain Imaging in Vivo. Eur. Heart J. 2016, 37, 1932. [Google Scholar] [CrossRef] [PubMed]
  48. Hong, Y.-J.; Makita, S.; Sugiyama, S.; Yasuno, Y. Optically Buffered Jones-Matrix-Based Multifunctional Optical Coherence Tomography with Polarization Mode Dispersion Correction. Biomed. Opt. Express 2014, 6, 225. [Google Scholar] [CrossRef] [PubMed]
  49. Sayegh, R.G.; Zotter, S.; Roberts, P.K.; Kandula, M.M.; Sacu, S.; Kreil, D.P.; Baumann, B.; Pircher, M.; Hitzenberger, C.K.; Schmidt-Erfurth, U. Polarization-Sensitive Optical Coherence Tomography and Conventional Retinal Imaging Strategies in Assessing Foveal Integrity in Geographic Atrophy. Investig. Ophthalmol. Vis. Sci. 2015, 56, 5246–5255. [Google Scholar] [CrossRef] [PubMed]
  50. Wang, H.; Zhu, J.; Reuter, M.; Vinke, L.N.; Yendiki, A.; Boas, D.A.; Fischl, B.; Akkin, T. Cross-Validation of Serial Optical Coherence Scanning and Diffusion Tensor Imaging: A Study on Neural Fiber Maps in Human Medulla Oblongata. Neuroimage 2014, 100, 395–404. [Google Scholar] [CrossRef]
  51. Baumann, B.; Woehrer, A.; Ricken, G.; Augustin, M.; Mitter, C.; Pircher, M.; Kovacs, G.G.; Hitzenberger, C.K. Visualization of Neuritic Plaques in Alzheimer’s Disease by Polarization-Sensitive Optical Coherence Microscopy. Sci. Rep. 2017, 7, 43477. [Google Scholar] [CrossRef] [PubMed]
  52. Boyd, R.W. Nonlinear Optics, 3rd ed.; Academic Press: Amsterdam, NL, USA, 2008. [Google Scholar]
  53. Nuriya, M.; Jiang, J.; Nemet, B.; Eisenthal, K.B.; Yuste, R. Imaging Membrane Potential in Dendritic Spines. Proc. Natl. Acad. Sci. USA 2006, 103, 786–790. [Google Scholar] [CrossRef]
  54. Cox, G.; Kable, E.; Jones, A.; Fraser, I.; Manconi, F.; Gorrell, M.D. 3-Dimensional Imaging of Collagen Using Second Harmonic Generation. J. Struct. Biol. 2003, 141, 53–62. [Google Scholar] [CrossRef]
  55. Stoller, P.; Celliers, P.M.; Reiser, K.M.; Rubenchik, A.M. Quantitative Second-Harmonic Generation Microscopy in Collagen. Appl. Opt. 2003, 42, 5209. [Google Scholar] [CrossRef] [PubMed]
  56. Mansfield, J.; Yu, J.; Attenburrow, D.; Moger, J.; Tirlapur, U.; Urban, J.; Cui, Z.; Winlove, P. The Elastin Network: Its Relationship with Collagen and Cells in Articular Cartilage as Visualized by Multiphoton Microscopy. J. Anat. 2009, 215, 682–691. [Google Scholar] [CrossRef] [PubMed]
  57. Becker, W. Fluorescence Lifetime Imaging—Techniques and Applications. J. Microsc. 2012, 247, 119–136. [Google Scholar] [CrossRef] [PubMed]
  58. König, K.; So, P.T.C.; Mantulin, W.W.; Tromberg, B.J.; Gratton, E. Two-Photon Excited Lifetime Imaging of Autofluorescence in Cells during UV A and NIR Photostress. J. Microsc. 1996, 183, 197–204. [Google Scholar] [CrossRef] [PubMed]
  59. Yaseen, M.A.; Sakadžić, S.; Wu, W.; Becker, W.; Kasischke, K.A.; Boas, D.A. In Vivo Imaging of Cerebral Energy Metabolism with Two-Photon Fluorescence Lifetime Microscopy of NADH. Biomed. Opt. Express 2013, 4, 307–321. [Google Scholar] [CrossRef]
  60. Leppert, J.; Krajewski, J.; Kantelhardt, S.R.; Schlaffer, S.; Petkus, N.; Reusche, E.; Hüttmann, G.; Giese, A. Multiphoton Excitation of Autofluorescence for Microscopy of Glioma Tissue. Neurosurgery 2006, 58, 759–767. [Google Scholar] [CrossRef]
  61. McCamant, D.W.; Kukura, P.; Yoon, S.; Mathies, R.A. Femtosecond Broadband Stimulated Raman Spectroscopy: Apparatus and Methods. Rev. Sci. Instrum. 2004, 75, 4971–4980. [Google Scholar] [CrossRef]
  62. Begley, R.F.; Harvey, A.B.; Byer, R.L. Coherent Anti-Stokes Raman Spectroscopy. Appl. Phys. Lett. 2004, 25, 387–390. [Google Scholar] [CrossRef]
  63. Turrell, G.; Corset, J. Raman Microscopy: Developments and Applications; Academic Press: San Diego, CA, USA, 1996. [Google Scholar]
  64. Fu, D.; Lu, F.-K.; Zhang, X.; Freudiger, C.; Pernik, D.R.; Holtom, G.; Xie, X.S. Quantitative Chemical Imaging with Multiplex Stimulated Raman Scattering Microscopy. J. Am. Chem. Soc. 2012, 134, 3623–3626. [Google Scholar] [CrossRef] [Green Version]
  65. Fu, D.; Holtom, G.; Freudiger, C.; Zhang, X.; Xie, X.S. Hyperspectral Imaging with Stimulated Raman Scattering by Chirped Femtosecond Lasers. J. Phys. Chem. B 2013, 117, 4634–4640. [Google Scholar] [CrossRef] [Green Version]
  66. Cheng, J.-X.; Xie, X.S. Coherent Raman Scattering Microscopy; CRC Press: Boca Raton, FL, USA, 2016. [Google Scholar]
  67. Cheng, J.X.; Xie, X.S. Vibrational Spectroscopic Imaging of Living Systems: An Emerging Platform for Biology and Medicine. Science 2015, 350. [Google Scholar] [CrossRef] [PubMed]
  68. Min, W.; Freudiger, C.W.; Lu, S.; Xie, X.S. Coherent Nonlinear Optical Imaging: Beyond Fluorescence Microscopy. Annu. Rev. Phys. Chem. 2011, 62, 507–530. [Google Scholar] [CrossRef] [PubMed] [Green Version]
  69. Wang, M.C.; Min, W.; Freudiger, C.W.; Ruvkun, G.; Xie, X.S. RNAi Screening for Fat Regulatory Genes with SRS Microscopy. Nat. Methods 2011, 8, 135. [Google Scholar] [CrossRef] [PubMed]
  70. Fu, D.; Yu, Y.; Folick, A.; Currie, E.; Farese, R.V., Jr.; Tsai, T.-H.; Xie, X.S.; Wang, M.C. In Vivo Metabolic Fingerprinting of Neutral Lipids with Hyperspectral Stimulated Raman Scattering Microscopy. J. Am. Chem. Soc. 2014, 136, 8820–8828. [Google Scholar] [CrossRef] [PubMed]
  71. Ji, M.; Orringer, D.A.; Freudiger, C.W.; Ramkissoon, S.; Liu, X.; Lau, D.; Golby, A.J.; Norton, I.; Hayashi, M.; Agar, N.Y.R.; et al. Rapid, Label-Free Detection of Brain Tumors with Stimulated Raman Scattering Microscopy. Sci. Transl. Med. 2013, 5, 201ra119. [Google Scholar] [CrossRef] [PubMed]
  72. Ekins, S. Pharmaceutical Applications of Raman Spectroscopy; John Wiley & Sons: Hoboken, NJ, USA, 2008. [Google Scholar]
  73. Staveley, L.A.K. The Characterization of Chemical Purity: Organic Compounds; Elsevier: Amsterdam, The Netherlands, 1971. [Google Scholar] [CrossRef]
  74. Hamada, K.; Fujita, K.; Smith, N.I.; Kobayashi, M.; Inouye, Y.; Kawata, S. Raman Microscopy for Dynamic Molecular Imaging of Living Cells. J. Biomed. Opt. 2008, 13, 44027. [Google Scholar] [CrossRef] [PubMed]
  75. Kirsch, M.; Schackert, G.; Salzer, R.; Krafft, C. Raman Spectroscopic Imaging for in Vivo Detection of Cerebral Brain Metastases. Anal. Bioanal. Chem. 2010, 398, 1707–1713. [Google Scholar] [CrossRef] [PubMed]
  76. Hollon, T.; Lewis, S.; Freudiger, C.W.; Xie, X.S.; Orringer, D.A. Improving the Accuracy of Brain Tumor Surgery via Raman-Based Technology. Neurosurg. Focus 2016, 40, E9. [Google Scholar] [CrossRef]
  77. Jermyn, M.; Mok, K.; Mercier, J.; Desroches, J.; Pichette, J.; Saint-Arnaud, K.; Bernstein, L.; Guiot, M.-C.; Petrecca, K.; Leblond, F. Intraoperative Brain Cancer Detection with Raman Spectroscopy in Humans. Sci. Transl. Med. 2015, 7, 274ra19. [Google Scholar] [CrossRef]
  78. Evans, C.L.; Xu, X.; Kesari, S.; Xie, X.S.; Wong, S.T.C.; Young, G.S. Chemically-Selective Imaging of Brain Structures with CARS Microscopy. Opt. Express 2007, 15, 12076. [Google Scholar] [CrossRef]
  79. Leahy, C.; Radhakrishnan, H.; Srinivasan, V.J. Volumetric Imaging and Quantification of Cytoarchitecture and Myeloarchitecture with Intrinsic Scattering Contrast. Biomed. Opt. Express 2013, 4, 1913–1978. [Google Scholar] [CrossRef] [PubMed]
  80. Lefebvre, J.; Delafontaine-Martel, P.; Pouliot, P.; Girouard, H.; Descoteaux, M. Fully Automated Dual-Resolution Serial Optical Coherence Tomography Aimed at Diffusion MRI Validation in Whole Mouse Brains. Neurophotonics 2018, 5, 045004. [Google Scholar] [CrossRef] [PubMed]
  81. Economo, M.N.; Clack, N.G.; Lavis, L.D.; Gerfen, C.R.; Svoboda, K.; Myers, E.W.; Chandrashekar, J. A Platform for Brain-Wide Imaging and Reconstruction of Individual Neurons. Elife 2016, 5, e10566. [Google Scholar] [CrossRef] [PubMed]
  82. Amato, S.P.; Pan, F.; Schwartz, J.; Ragan, T.M. Whole Brain Imaging with Serial Two-Photon Tomography. Front. Neuroanat. 2016, 10, 31. [Google Scholar] [CrossRef] [Green Version]
  83. Delafontaine-Martel, P.; Lefebvre, J.; Tardif, P.-L.; Lévy, B.I.; Pouliot, P.; Lesage, F. Whole Brain Vascular Imaging in a Mouse Model of Alzheimer’s Disease with Two-Photon Microscopy. J. Biomed. Opt. 2018, 23, 076501. [Google Scholar] [CrossRef] [PubMed]
  84. Magnain, C.; Augustinack, J.C.; Reuter, M.; Wachinger, C.; Frosch, M.P.; Ragan, T.; Akkin, T.; Wedeen, V.J.; Boas, D.A.; Fischl, B. Blockface Histology with Optical Coherence Tomography: A Comparison with Nissl Staining. Neuroimage 2014, 84, 524–533. [Google Scholar] [CrossRef] [PubMed]
  85. Wang, H.; Magnain, C.; Wang, R.; Dubb, J.; Varjabedian, A.; Tirrell, L.S.; Stevens, A.; Augustinack, J.C.; Konukoglu, E.; Aganj, I.; et al. As-PSOCT: Volumetric Microscopic Imaging of Human Brain Architecture and Connectivity. Neuroimage 2018, 165, 56–68. [Google Scholar] [CrossRef] [PubMed]
  86. Magnain, C.; Augustinack, J.C.; Tirrell, L.; Fogarty, M.; Frosch, M.P.; Boas, D.; Fischl, B.; Rockland, K.S. Colocalization of Neurons in Optical Coherence Microscopy and Nissl-Stained Histology in Brodmann’s Area 32 and Area 21. Brain Struct. Funct. 2019, 224, 351–362. [Google Scholar] [CrossRef] [PubMed]
  87. Abdeladim, L.; Matho, K.S.; Clavreul, S.; Mahou, P.; Sintes, J.-M.; Solinas, X.; Arganda-Carreras, I.; Turney, S.G.; Lichtman, J.W.; Chessel, A.; et al. Multicolor Multiscale Brain Imaging with Chromatic Multiphoton Serial Microscopy. Nat. Commun. 2019, 10, 1662. [Google Scholar] [CrossRef] [PubMed]
  88. Hayworth, K.J.; Xu, C.S.; Lu, Z.; Knott, G.W.; Fetter, R.D.; Tapia, J.C.; Lichtman, J.W.; Hess, H.F. Ultrastructurally Smooth Thick Partitioning and Volume Stitching for Large-Scale Connectomics. Nat. Methods 2015, 12. [Google Scholar] [CrossRef] [PubMed]
  89. Hildebrand, D.G.C.; Cicconet, M.; Torres, R.M.; Choi, W.; Quan, T.M.; Moon, J.; Wetzel, A.W.; Scott Champion, A.; Graham, B.J.; Randlett, O.; et al. Whole-Brain Serial-Section Electron Microscopy in Larval Zebrafish. Nature 2017, 545, 345–349. [Google Scholar] [CrossRef] [PubMed]
  90. Mayerich, D.; Abbott, L.; McCormick, B. Knife-Edge Scanning Microscopy for Imaging and Reconstruction of Three-Dimensional Anatomical Structures of the Mouse Brain. J. Microsc. 2008, 231, 134–143. [Google Scholar] [CrossRef] [PubMed]
  91. Choe, Y.; Mayerich, D.; Kwon, J.; Miller, D.E.; Chung, J.R.; Sung, C.; Keyser, J.; Abbott, L.C. Knife-Edge Scanning Microscopy for Connectomics Research. In Proceedings of the 2011 International Joint Conference on Neural Networks, San Jose, CA, USA, 31 July–5 August 2011; pp. 2258–2265. [Google Scholar] [CrossRef]
  92. Tsai, P.S.; Blinder, P.; Squier, J.A.; Kleinfeld, D. All-Optical In Situ Histology of Brain Tissue with Femtosecond Laser Pulses. Cold Spring Harb. Protoc. 2013, 2013. [Google Scholar] [CrossRef] [PubMed]
  93. Nguyen, Q.T.; Tsai, P.S.; Kleinfeld, D. MPScope: A Versatile Software Suite for Multiphoton Microscopy. J. Neurosci. Methods 2006, 156, 351–359. [Google Scholar] [CrossRef] [PubMed]
  94. Nguyen, Q.-T.; Driscoll, J.; Dolnick, E.M.; Kleinfeld, D. MPScope 2.0. A Computer System for Two-Photon Laser Scanning Microscopy with Concurrent Plasma-Mediated Ablation and Electrophysiology. Vivo Opt. Imaging Brain Funct. Second Ed. 2009, 1–18. [Google Scholar] [CrossRef]
  95. Edelstein, A.; Amodaj, N.; Hoover, K.; Vale, R.; Stuurman, N. Computer Control of Microscopes Using ΜManager. Curr. Protoc. Mol. Biol. 2010, 92, 14–20. [Google Scholar] [CrossRef]
  96. Edelstein, A.D.; Tsuchida, M.A.; Amodaj, N.; Pinkard, H.; Vale, R.D.; Stuurman, N. Advanced Methods of Microscope Control Using ΜManager Software. J. Biol. Methods 2014, 1, e10. [Google Scholar] [CrossRef]
  97. Babaloukas, G.; Tentolouris, N.; Liatis, S.; Sklavounou, A.; Perrea, D. Evaluation of Three Methods for Retrospective Correction of Vignetting on Medical Microscopy Images Utilizing Two Open Source Software Tools. J. Microsc. 2011, 244, 320–324. [Google Scholar] [CrossRef]
  98. Tomer, R.; Ye, L.; Hsueh, B.; Deisseroth, K. Advanced CLARITY for Rapid and High-Resolution Imaging of Intact Tissues. Nat. Protoc. 2014, 9, 1682–1697. [Google Scholar] [CrossRef]
  99. Berlanga, M.L.; Phan, S.; Bushong, E.A.; Wu, S.; Kwon, O.; Phung, B.S.; Lamont, S.; Terada, M.; Tasdizen, T.; Martone, M.E.; et al. Three-Dimensional Reconstruction of Serial Mouse Brain Sections: Solution for Flattening High-Resolution Large-Scale Mosaics. Front. Neuroanat. 2011, 5, 17. [Google Scholar] [CrossRef] [Green Version]
  100. Seiriki, K.; Kasai, A.; Hashimoto, T.; Schulze, W.; Niu, M.; Yamaguchi, S.; Nakazawa, T.; Inoue, K.-I.; Uezono, S.; Takada, M.; et al. High-Speed and Scalable Whole-Brain Imaging in Rodents and Primates. Neuron 2017, 94, 1085–1100.e6. [Google Scholar] [CrossRef] [PubMed]
  101. Peng, T.; Thorn, K.; Schroeder, T.; Wang, L.; Theis, F.J.; Marr, C.; Navab, N. A BaSiC Tool for Background and Shading Correction of Optical Microscopy Images. Nat. Commun. 2017, 8, 14836. [Google Scholar] [CrossRef] [PubMed]
  102. Yayon, N.; Dudai, A.; Vrieler, N.; Amsalem, O.; London, M.; Soreq, H. Intensify3D: Normalizing Signal Intensity in Large Heterogenic Image Stacks. Sci. Rep. 2018, 8, 4311. [Google Scholar] [CrossRef] [PubMed]
  103. Price, D.L.; Chow, S.K.; MacLean, N.A.B.; Hakozaki, H.; Peltier, S.; Martone, M.E.; Ellisman, M.H. High-Resolution Large-Scale Mosaic Imaging Using Multiphoton Microscopy to Characterize Transgenic Mouse Models of Human Neurological Disorders. Neuroinformatics 2006, 4, 65–80. [Google Scholar] [CrossRef]
  104. Chow, S.K.; Hakozaki, H.; Price, D.L.; MacLean, N.A.B.; Deerinck, T.J.; Bouwer, J.C.; Martone, M.E.; Peltier, S.T.; Ellisman, M.H. Automated Microscopy System for Mosaic Acquisition and Processing. J. Microsc. 2006, 222, 76–84. [Google Scholar] [CrossRef]
  105. Preibisch, S.; Saalfeld, S.; Tomancak, P. Fast Stitching of Large 3d Biological Datasets. In Proceedings of the Image J User and Developer Conference, Luxembourg, 6–7 November 2008. [Google Scholar]
  106. Preibisch, S.; Saalfeld, S.; Tomancak, P. Globally Optimal Stitching of Tiled 3D Microscopic Image Acquisitions. Bioinformatics 2009, 25, 1463–1465. [Google Scholar] [CrossRef]
  107. Schindelin, J.; Arganda-Carreras, I.; Frise, E.; Kaynig, V.; Longair, M.; Pietzsch, T.; Preibisch, S.; Rueden, C.; Saalfeld, S.; Schmid, B.; et al. Fiji: An Open-Source Platform for Biological-Image Analysis. Nat. Methods 2012, 9, 676–682. [Google Scholar] [CrossRef] [PubMed]
  108. Bria, A.; Iannello, G. TeraStitcher—A Tool for Fast Automatic 3D-Stitching of Teravoxel-Sized Microscopy Images. BMC Bioinform. 2012, 13, 316. [Google Scholar] [CrossRef] [PubMed]
  109. Peng, H.; Ruan, Z.; Long, F.; Simpson, J.H.; Myers, E.W. V3D Enables Real-Time 3D Visualization and Quantitative Analysis of Large-Scale Biological Image Data Sets. Nat. Biotechnol. 2010, 28, 348–353. [Google Scholar] [CrossRef] [PubMed]
  110. Peng, H.; Bria, A.; Zhou, Z.; Iannello, G.; Long, F. Extensible Visualization and Analysis for Multidimensional Images Using Vaa3D. Nat. Protoc. 2014, 9, 193–208. [Google Scholar] [CrossRef]
  111. Ren, J.; Choi, H.; Chung, K.; Bouma, B.E. Label-Free Volumetric Optical Imaging of Intact Murine Brains. Sci. Rep. 2017, 7, 46306. [Google Scholar] [CrossRef] [PubMed]
  112. Silvestri, L.; Allegra Mascaro, A.L.; Costantini, I.; Sacconi, L.; Pavone, F.S. Correlative Two-Photon and Light Sheet Microscopy. Methods 2014, 66, 268–272. [Google Scholar] [CrossRef] [PubMed]
  113. Piccinini, F.; Bevilacqua, A.; Lucarelli, E. Automated Image Mosaics by Non-Automated Light Microscopes: The MicroMos Software Tool. J. Microsc. 2013, 252, 226–250. [Google Scholar] [CrossRef] [PubMed]
  114. Emmenlauer, M.; Ronneberger, O. XuvTools: Free, Fast and Reliable Stitching of Large 3D Datasets. J. Microsc. 2009, 233, 42–60. [Google Scholar] [CrossRef] [PubMed]
  115. Lee, B.C.; Tward, D.J.; Mitra, P.P.; Miller, M.I. On Variational Solutions for Whole Brain Serial-Section Histology Using a Sobolev Prior in the Computational Anatomy Random Orbit Model. PLoS. Comput. Biol. 2018, 14, e1006610. [Google Scholar] [CrossRef] [PubMed]
  116. Lee, B.C.; Lin, M.K.; Fu, Y.; Hata, J.; Miller, M.I.; Mitra, P.P. Joint Atlas-Mapping of Multiple Histological Series Combined with Multimodal MRI of Whole Marmoset Brains. arXiv 2018, arXiv:1805.04975. [Google Scholar]
  117. Ali, S.; Schober, M.; Schlöme, P.; Amunts, K.; Axer, M.; Rohr, K. Towards Ultra-High Resolution 3D Reconstruction of a Whole Rat Brain from 3D-PLI Data; Springer: Cham, Switzerland, 2018. [Google Scholar]
  118. Amunts, K.; Lepage, C.; Borgeat, L. BigBrain: An Ultrahigh-Resolution 3D Human Brain Model. Science 2013, 340, 1472–1475. [Google Scholar] [CrossRef] [PubMed] [Green Version]
  119. Susaki, E.A.; Ueda, H.R. Review Whole-Body and Whole-Organ Clearing and Imaging Techniques with Single-Cell Resolution: Toward Organism-Level Systems Biology in Mammals. Cell Chem. Biol. 2016, 23, 137–157. [Google Scholar] [CrossRef]
  120. Chung, K.; Deisseroth, K. CLARITY for Mapping the Nervous System. Nat. Methods 2013, 10, 508–513. [Google Scholar] [CrossRef]
  121. Qi, Y.; Yu, T.; Xu, J.; Wan, P.; Ma, Y.; Zhu, J.; Li, Y.; Gong, H.; Luo, Q.; Zhu, D. FDISCO: Advanced Solvent-Based Clearing Method for Imaging Whole Organs. Arch. Stud. Urbani Reg. 2019, 5, eaau8355. [Google Scholar] [CrossRef]
  122. Sharpe, J. Optical Projection Tomography as a Tool for 3D Microscopy and Gene Expression Studies. Science (80-) 2002, 296, 541–545. [Google Scholar] [CrossRef] [PubMed] [Green Version]
  123. Sharpe, J. Optical Projection Tomography. Annu. Rev. Biomed. Eng. 2004, 6, 209–228. [Google Scholar] [CrossRef] [PubMed]
  124. Nguyen, D.; Marchand, P.J.; Planchette, A.L.; Nilsson, J.; Sison, M.; Extermann, J.; Lopez, A.; Sylwestrzak, M.; Sordet-Dessimoz, J.; Schmidt-Christensen, A.; et al. Optical Projection Tomography for Rapid Whole Mouse Brain Imaging. Biomed. Opt. Express 2017, 8, 5637. [Google Scholar] [CrossRef] [PubMed]
  125. Dodt, H.U.; Leischner, U.; Schierloh, A.; Jährling, N.; Mauch, C.P.; Deininger, K.; Deussing, J.M.; Eder, M.; Zieglgänsberger, W.; Becker, K. Ultramicroscopy: Three-Dimensional Visualization of Neuronal Networks in the Whole Mouse Brain. Nat. Methods 2007, 4, 331–336. [Google Scholar] [CrossRef] [PubMed]
  126. Silvestri, L.; Bria, A.; Sacconi, L.; Iannello, G.; Pavone, F.S. Confocal Light Sheet Microscopy: Micron-Scale Neuroanatomy of the Entire Mouse Brain. Opt. Express 2012, 20, 20582. [Google Scholar] [CrossRef]
  127. Silvestri, L.; Bria, A.; Costantini, I.; Sacconi, L.; Peng, H.; Iannello, G.; Pavone, F.S. Micron-Scale Resolution Optical Tomography of Entire Mouse Brains with Confocal Light Sheet Microscopy. J. Vis. Exp. 2013, e50696. [Google Scholar] [CrossRef]
  128. Ahrens, M.B.; Orger, M.B.; Robson, D.N.; Li, J.M.; Keller, P.J. Whole-Brain Functional Imaging at Cellular Resolution Using Light-Sheet Microscopy. Nat. Methods 2013, 10, 413–420. [Google Scholar] [CrossRef]
  129. Keller, P.J.; Ahrens, M.B. Visualizing Whole-Brain Activity and Development at the Single-Cell Level Using Light-Sheet Microscopy. Neuron 2015, 85, 462–483. [Google Scholar] [CrossRef] [Green Version]
  130. Pende, M.; Becker, K.; Wanis, M.; Saghafi, S.; Kaur, R.; Hahn, C.; Pende, N.; Foroughipour, M.; Hummel, T.; Dodt, H.U. High-Resolution Ultramicroscopy of the Developing and Adult Nervous System in Optically Cleared Drosophila Melanogaster. Nat. Commun. 2018, 9, 4731. [Google Scholar] [CrossRef]
  131. Gao, R.; Asano, S.M.; Upadhyayula, S.; Pisarev, I.; Milkie, D.E.; Liu, T.L.; Singh, V.; Graves, A.; Huynh, G.H.; Zhao, Y.; et al. Cortical Column and Whole-Brain Imaging with Molecular Contrast and Nanoscale Resolution. Science 2019, 363. [Google Scholar] [CrossRef]
  132. Richardson, D.S.; Lichtman, J.W. Clarifying Tissue Clearing. Cell 2015, 246–257. [Google Scholar] [CrossRef] [PubMed]
  133. Silvestri, L.; Costantini, I.; Sacconi, L.; Pavone, F.S. Clearing of Fixed Tissue: A Review from a Microscopist’s Perspective. J. Biomed. Opt. 2016, 21, 081205. [Google Scholar] [CrossRef] [PubMed]
  134. Pinskiy, V.; Jones, J.; Tolpygo, A.S.; Franciotti, N.; Weber, K.; Mitra, P.P. High-Throughput Method of Whole-Brain Sectioning, Using the Tape-Transfer Technique. PLoS ONE 2015, 10, e0102363. [Google Scholar] [CrossRef] [PubMed]
  135. Lin, M.K.; Takahashi, Y.S.; Huo, B.-X.; Hanada, M.; Nagashima, J.; Hata, J.; Tolpygo, A.S.; Ram, K.; Lee, B.C.; Miller, M.I.; et al. A High-Throughput Neurohistological Pipeline for Brain-Wide Mesoscale Connectivity Mapping of the Common Marmoset. Elife 2019, 8. [Google Scholar] [CrossRef] [PubMed]
  136. Vandenberghe, M.E.; Hérard, A.-S.; Souedet, N.; Sadouni, E.; Santin, M.D.; Briet, D.; Carré, D.; Schulz, J.; Hantraye, P.; Chabrier, P.-E.; et al. High-Throughput 3D Whole-Brain Quantitative Histopathology in Rodents. Sci. Rep. 2016, 6, 20958. [Google Scholar] [CrossRef]
  137. Liu, C.J.; Williams, K.E.; Orr, H.T.; Akkin, T. Visualizing and Mapping the Cerebellum with Serial Optical Coherence Scanner. Neurophotonics 2016, 4, 011006. [Google Scholar] [CrossRef]
  138. Wang, H.; Lenglet, C.; Akkin, T. Structure Tensor Analysis of Serial Optical Coherence Scanner Images for Mapping Fiber Orientations and Tractography in the Brain. J. Biomed. Opt. 2015, 20, 036003. [Google Scholar] [CrossRef]
  139. Castonguay, A.; Lefebvre, J.; Lesage, F.; Pouliot, P. Comparing Three-Dimensional Serial Optical Coherence Tomography Histology to MRI Imaging in the Entire Mouse Brain. J. Biomed. Opt. 2018, 23, 016008. [Google Scholar] [CrossRef]
  140. Bégin, S.; Dupont-Therrien, O.; Bélanger, E.; Daradich, A.; Laffray, S.; De Koninck, Y.; Côté, D.C. Automated Method for the Segmentation and Morphometry of Nerve Fibers in Large-Scale CARS Images of Spinal Cord Tissue. Biomed. Opt. Express 2014, 5, 4145–4161. [Google Scholar] [CrossRef]
  141. Zaimi, A.; Duval, T.; Gasecka, A.; Côté, D.; Stikov, N.; Cohen-Adad, J. AxonSeg: Open Source Software for Axon and Myelin Segmentation and Morphometric Analysis. Front. Neuroinform. 2016, 10, 37. [Google Scholar] [CrossRef] [Green Version]
  142. Zaimi, A.; Wabartha, M.; Herman, V.; Antonsanti, P.-L.; Perone, C.S.; Cohen-Adad, J. AxonDeepSeg: Automatic Axon and Myelin Segmentation from Microscopy Data Using Convolutional Neural Networks. Sci. Rep. 2018, 8, 3816. [Google Scholar] [CrossRef] [PubMed]
  143. Stikov, N.; Campbell, J.S.W.; Stroh, T.; Lavelée, M.; Frey, S.; Novek, J.; Nuara, S.; Ho, M.-K.; Bedell, B.J.; Dougherty, R.F.; et al. Quantitative Analysis of the Myelin G-Ratio from Electron Microscopy Images of the Macaque Corpus Callosum. Data Br. 2015, 4, 368–373. [Google Scholar] [CrossRef] [PubMed]
  144. Stikov, N.; Campbell, J.S.W.; Stroh, T.; Lavelée, M.; Frey, S.; Novek, J.; Nuara, S.; Ho, M.-K.; Bedell, B.J.; Dougherty, R.F.; et al. In Vivo Histology of the Myelin G-Ratio with Magnetic Resonance Imaging. Neuroimage 2015, 118, 397–405. [Google Scholar] [CrossRef] [PubMed]
  145. Cohen-Adad, J. Microstructural Imaging in the Spinal Cord and Validation Strategies. Neuroimage 2018, 182, 169–183. [Google Scholar] [CrossRef] [PubMed]
  146. MacKenzie-Graham, A.; Lee, E.-F.; Dinov, I.D.; Bota, M.; Shattuck, D.W.; Ruffins, S.; Yuan, H.; Konstantinidis, F.; Pitiot, A.; Ding, Y.; et al. A Multimodal, Multidimensional Atlas of the C57BL/6J Mouse Brain. J. Anat. 2004, 204, 93–102. [Google Scholar] [CrossRef] [PubMed]
  147. Johnson, G.A.; Badea, A.; Brandenburg, J.; Cofer, G.; Fubara, B.; Liu, S.; Nissanov, J. Waxholm Space: An Image-Based Reference for Coordinating Mouse Brain Research. Neuroimage 2010, 53, 365–372. [Google Scholar] [CrossRef] [PubMed]
  148. Majka, P.; Chlodzinska, N.; Turlejski, K.; Banasik, T.; Djavadian, R.L.; Węglarz, W.P.; Wójcik, D.K. A Three-Dimensional Stereotaxic Atlas of the Gray Short-Tailed Opossum (Monodelphis Domestica) Brain. Brain Struct. Funct. 2017. [Google Scholar] [CrossRef] [PubMed]
  149. Gong, H.; Xu, D.; Yuan, J.; Li, X.; Guo, C.; Peng, J.; Li, Y.; Schwarz, L.A.; Li, A.; Hu, B.; et al. High-Throughput Dual-Colour Precision Imaging for Brain-Wide Connectome with Cytoarchitectonic Landmarks at the Cellular Level. Nat. Commun. 2016, 7, 12142. [Google Scholar] [CrossRef]
  150. Lu, H.; Scholl, C.A.; Zuo, Y.; Demny, S.; Rea, W.; Stein, E.A.; Yang, Y. Registering and Analyzing Rat FMRI Data in the Stereotaxic Framework by Exploiting Intrinsic Anatomical Features. Magn. Reson. Imaging 2010, 28, 146–152. [Google Scholar] [CrossRef]
  151. Li, X.; Aggarwal, M.; Hsu, J.; Jiang, H.; Mori, S. AtlasGuide: Software for Stereotaxic Guidance Using 3D CT/MRI Hybrid Atlases of Developing Mouse Brains. J. Neurosci. Methods 2013, 220, 75–84. [Google Scholar] [CrossRef]
  152. Rangarajan, J.R.; Vande Velde, G.; van Gent, F.; De Vloo, P.; Dresselaers, T.; Depypere, M.; van Kuyck, K.; Nuttin, B.; Himmelreich, U.; Maes, F. Image-Based in Vivo Assessment of Targeting Accuracy of Stereotactic Brain Surgery in Experimental Rodent Models. Sci. Rep. 2016, 6, 38058. [Google Scholar] [CrossRef] [PubMed]
  153. Wang, J.; Li, C.; Chen, S.C. Sectioning Soft Materials with an Oscillating Blade. Precis. Eng. 2019, 56, 96–100. [Google Scholar] [CrossRef]
  154. Gutiérrez, R.; Gómez, F.; Roa-Peña, L.; Romero, E. A Supervised Visual Model for Finding Regions of Interest in Basal Cell Carcinoma Images. Diagn. Pathol. 2011, 6, 26. [Google Scholar] [CrossRef] [PubMed]
  155. Pavillon, N.; Smith, N.I. Compressed Sensing Laser Scanning Microscopy. Opt. Express 2016, 24, 30038. [Google Scholar] [CrossRef] [PubMed]
  156. Woringer, M.; Darzacq, X.; Zimmer, C.; Mir, M. A Versatile Compressed Sensing Scheme for Faster and Less Phototoxic 3D Fluorescence Microscopy. bioRxiv 2017, 125815. [Google Scholar] [CrossRef]
  157. Ouyang, W.; Aristov, A.; Lelek, M.; Hao, X.; Zimmer, C. Deep Learning Massively Accelerates Super-Resolution Localization Microscopy. Nat. Biotechnol. 2018, 36, 460–468. [Google Scholar] [CrossRef]
  158. Lehtinen, J.; Munkberg, J.; Hasselgren, J.; Laine, S.; Karras, T.; Aittala, M.; Aila, T. Noise2Noise: Learning Image Restoration without Clean Data. In Proceedings of the 35th International Conference on Machine Learning, Stockholm, Sweden, 10–15 July 2018. [Google Scholar]
  159. Zhang, H.; Fang, C.; Xie, X.; Yang, Y.; Mei, W.; Jin, D.; Fei, P. High-Throughput, High-Resolution Deep Learning Microscopy Based on Registration-Free Generative Adversarial Network. Biomed. Opt. Express 2019, 10, 1044. [Google Scholar] [CrossRef]
  160. Xiong, J.; Ren, J.; Luo, L.; Horowitz, M. Mapping Histological Slice Sequences to the Allen Mouse Brain Atlas Without 3D Reconstruction. Front. Neuroinform. 2018, 12, 93. [Google Scholar] [CrossRef] [Green Version]
  161. Waithe, D.; Brown, J.; Reglinski, K.; Diez-Sevilla, I.; Roberts, D.; Eggeling, C. Object Detection Networks and Augmented Reality for Cellular Detection in Fluorescence Microscopy Acquisition and Analysis. bioRxiv 2019, 544833. [Google Scholar] [CrossRef]
  162. Chen, P.-H.C.; Gadepalli, K.; MacDonald, R.; Liu, Y.; Nagpal, K.; Kohlberger, T.; Dean, J.; Corrado, G.S.; Hipp, J.D.; Stumpe, M.C. Microscope 2.0: An Augmented Reality Microscope with Real-Time Artificial Intelligence Integration. arXiv 2018, arXiv:1812.00825. [Google Scholar]
  163. Durand, A.; Wiesner, T.; Gardner, M.A.; Robitaille, L.É.; Bilodeau, A.; Gagné, C.; De Koninck, P.; Lavoie-Cardinal, F. A Machine Learning Approach for Online Automated Optimization of Super-Resolution Optical Microscopy. Nat. Commun. 2018, 9. [Google Scholar] [CrossRef] [PubMed]
  164. Magliaro, C.; Tirella, A.; Mattei, G.; Pirone, A.; Ahluwalia, A. HisTOOLogy: An Open-Source Tool for Quantitative Analysis of Histological Sections. J. Microsc. 2015, 260, 260–267. [Google Scholar] [CrossRef] [PubMed]
  165. Janowczyk, A.; Madabhushi, A. Deep Learning for Digital Pathology Image Analysis: A Comprehensive Tutorial with Selected Use Cases. J. Pathol. Inform. 2016, 7, 29. [Google Scholar] [CrossRef] [PubMed]
  166. Komura, D.; Ishikawa, S. Machine Learning Methods for Histopathological Image Analysis. Comput. Struct. Biotechnol. J. 2018, 16, 34–42. [Google Scholar] [CrossRef] [PubMed]
  167. Chen, Y.; McElvain, L.E.; Tolpygo, A.S.; Ferrante, D.; Friedman, B.; Mitra, P.P.; Karten, H.J.; Freund, Y.; Kleinfeld, D. An Active Texture-Based Digital Atlas Enables Automated Mapping of Structures and Markers across Brains. Nat. Methods 2019, 16. [Google Scholar] [CrossRef] [PubMed]
  168. Pinto, M.; Zorn, K.C.; Tremblay, J.-P.; Desroches, J.; Dallaire, F.; Aubertin, K.; Marple, E.; Kent, C.; Leblond, F.; Trudel, D.; et al. Integration of a Raman Spectroscopy System to a Robotic-Assisted Surgical System for Real-Time Tissue Characterization during Radical Prostatectomy Procedures. J. Biomed. Opt. 2019, 24, 025001. [Google Scholar] [CrossRef] [PubMed]
  169. Girkin, J.M.; Carvalho, M.T. The Light-Sheet Microscopy Revolution. J. Opt. 2018, 20, 053002. [Google Scholar] [CrossRef]
  170. Pitrone, P.G.; Schindelin, J.; Stuyvenberg, L.; Preibisch, S.; Weber, M.; Eliceiri, K.W.; Huisken, J.; Tomancak, P. OpenSPIM: An Open-Access Light-Sheet Microscopy Platform. Nat. Methods 2013, 10, 598–599. [Google Scholar] [CrossRef] [PubMed]
  171. Voigt, F.F.; Kirschenbaum, D.; Platonova, E.; Pagès, S.; Campbell, R.A.A.; Kästli, R.; Schaettin, M.; Egolf, L.; van der Bourg, A.; Bethge, P.; et al. The MesoSPIM Initiative: Open-Source Light-Sheet Mesoscopes for Imaging in Cleared Tissue. bioRxiv 2019, 577122. [Google Scholar] [CrossRef]
  172. Renier, N.; Wu, Z.; Simon, D.J.; Yang, J.; Ariel, P.; Tessier-Lavigne, M. IDISCO: A Simple, Rapid Method to Immunolabel Large Tissue Samples for Volume Imaging. Cell 2014, 159, 896–910. [Google Scholar] [CrossRef]
  173. Renier, N.; Adams, E.L.; Kirst, C.; Wu, Z.; Azevedo, R.; Kohl, J.; Autry, A.E.; Kadiri, L.; Umadevi Venkataraju, K.; Zhou, Y.; et al. Mapping of Brain Activity by Automated Volume Analysis of Immediate Early Genes. Cell 2016, 165, 1789–1802. [Google Scholar] [CrossRef] [PubMed] [Green Version]
  174. Bakker, R.; Tiesinga, P.; Kötter, R. The Scalable Brain Atlas: Instant Web-Based Access to Public Brain Atlases and Related Content. Neuroinformatics 2015, 13, 353–366. [Google Scholar] [CrossRef] [PubMed] [Green Version]
Figure 1. Examples of various intrinsic optical contrast mechanisms that can be used to image the brain: (A) Reflectivity, (B) absorption from photo-acoustics microscopy (PAM), (C) attenuation, (D) retardance from Optical Coherence Tomography (OCT) imaging, (E) nonlinear optics such as third-harmonic generation (THG), and (F) Raman scattering. The images for Figure 1A,C come from our previous work [16]. For more information about the images presented, consult the appropriate references. The absorption image is an excerpt from a still frame from the supplementary video 3 of Wong2017 [17], the THG image is a reproduction of Figure 3 from Farrar2011 [18], the retardance image comes from Wang2014 [19], and the Coherent Anti-stokes Raman Spectroscopy (CARS) image is taken from Fu2008 [20].
Photonics 06 00066 g001
Figure 2. A representation of a fully automated dual-resolution serial OCT imaging system (Right) and a diagram of the workflow pipeline used to control the acquisition (Left): The 2R-SOCT consists in a vibratome coupled to two OCT arms, a 3X arm to acquire low-resolution data (25 µm/voxel) used for the whole mouse brain reconstruction, and a 40X arm used to acquire high-resolution images (1.5 µm/voxel) in automatically chosen regions of interests (ROIs). The solid lines represent the order of operation of acquisition. The dashed lines represent data transfer to other parts of the workflow (e.g., sending in situ assembled slices to generate 40X ROIs). The green shaded boxes are tasks necessitating mechanical movements, and the blue shaded boxes represent data generation or transfer operations. FM: Flip mirror, M: Mirror. Adapted from our previous work [80].
Photonics 06 00066 g002
Figure 3. A representation of the principal data reconstruction steps used for SBH, which consists in preprocessing (here, vignetting correction is illustrated), lateral (XY) reconstruction of each tissue slices, and the stitching of each slices along the z-axis to obtain a complete 3-D representation of the whole mouse brain.
Photonics 06 00066 g003
Figure 4. Examples of tissue sectioning artefacts for a serial OCT mouse brain: (A) Agarose tearing, (B) coronal slice exhibiting shadowing effects due to floating fibers, (C) horizontal slice with missing tissue due to tissue/agarose separation (arrow), (D) B-Scan corresponding to the horizontal red line of image B showing water-tissue interface denivelation, and (E) B-Scan corresponding to the vertical green line in Figure 4B, showing floating tissue fibers and their shadow. The scale bar is 1.5 mm.
Photonics 06 00066 g004
Table 1. A comparative table for different intrinsic contrast imaging (ICI) techniques: In the case of autofluorescence two-photon excitation fluorescence microscopy (TPEFm), the sensitivity of the signal is highly dependent on the effective cross section of the excitation from the targeted molecule. Moreover, the examples shown here are dependent on the resolution desired for the microscopic observation. In the case where slow modality was used, high magnification microscope objective tended to slow the speed of acquisition. This duality between resolution and speed is an important factor to consider, and in the optimization for applications such as ex-vivo microscopy, speed is often put aside for the benefit of resolution and vice versa for in vivo imaging. OCT: Optical Coherence Tomography, PS-OCT: Polarization-sensitive OCT, SDOCT: Spectral Domain OCT, PAM: Photoacoustic Microscopy, SHG: Second-harmonic generation, THG: Third-harmonic generation, SRS: Stimulated Raman Scattering, CARS: Coherence Anti-Stokes Raman Spectroscopy, IR: Infrared, NIR: Near Infrared.
Imaging TechniqueSensitivitySpatial Resolution (Voxel Size)SpeedWavelength
OCT/PS-OCT/SDOCT90 dB–110 dB [21]6 × 6 × 3.5 µm3 [19]
25 × 25 × 25 µm3 [16]
Fast (4 cm3/h) [19] NIR-IR
Autofluorescence TPEFmHighly variable [22]1 × 1 × 2.5 µm3 [12]Slow (190 mm3/h) [12]NIR
PAM~65 dB [23] 1.5 mm × 1.5 mm [24] Fast (18 cm3/h) [24] Visible-NIR
SHG/ THG>20 dB [25] 0.6 × 0.6 × 2 µm3 [26]Slow (125 µm3/h) [26]NIR-IR
SRS/CARS>20 dB [27]0.3 × 0.3 × 1.5 µm3 [28]Slow (4000 µm3/h) [28]NIR-IR
Table 2. The main components and parts of an SBH system.
ComponentsParts
Tissue preparationAnimal sacrifice protocol
Brain extraction protocol
Tissue storage
Tissue clearing protocol
Agarose embedding
Pre-Acquisition with other modalities (e.g., MRI)
Microscope and Optical DesignCollection optics
Beam scanning system
Microscope objective swapping
Modality swapping (e.g., PS-OCT to confocal)
Various microscope modalities
MechanicalMotorized sample stage
Tissue sectioning system
Slice collection
Immersion container
Sample holder
Acquisition controlCalibration procedures
Stage motion
Tissue detection
Mosaic path planning
Image acquisition
Tissue slicing
Focus depth optimization
Data management system
In-situ reconstruction method
Visualization and control interface
Acquisition cards for communication with computer
Reconstruction and AnalysisPreprocessing methods (illumination inhomogeneity compensation, denoising, artifacts removal, attenuation compensation, and tissue segmentation)
Tile registration
Tile stitching
Registration to a template
Brain parcellation and atlasing

