Terahertz Polarization Imaging and Its Applications


Faculty of Science and Technology, Department of Physics, Keio University, 3-14-1 Hiyoshi, Kohoku-ku, Yokohama, Kanagawa 223-8522, Japan
Photonics 2018, 5(4), 58; https://doi.org/10.3390/photonics5040058
Submission received: 27 October 2018
/
Revised: 30 November 2018
/
Accepted: 6 December 2018
/
Published: 12 December 2018
(This article belongs to the Special Issue Terahertz Photonics)
Abstract
:This review focuses on several recent research activities regarding precise and fast polarization-sensitive terahertz time-domain spectroscopy systems for imaging purposes, and explains three interesting application examples. Owing to modulation techniques that have recently been developed for the evaluation of the instantaneous terahertz electric-field (E-field) vector, fast and precise terahertz polarization imaging becomes feasible. This terahertz technology enables high-resolution surface topography, precise understanding of the spatial E-field vector distribution of the focused terahertz pulse, and examination of strain-induced birefringence in polymeric materials. These examples constitute a new application area of terahertz photonics with emphasis on both fundamental optics and industrial applications.
1. Introduction
Terahertz imaging is an emerging technology and a popular research subject in the field of photonics [1]. After the invention of the terahertz time-domain spectroscopy (THz-TDS) [2,3,4], the detection sensitivity of the terahertz radiation has been dramatically improved due to the coherent measurement scheme based on the ultrafast laser pulse technology. The improved detection allows us to increase the speed of the terahertz imaging and thus terahertz imaging systems for industrial use become feasible. In particular, the THz-TDS imaging provides additional information compared to the common optical imaging. One example is the time-of-flight information of the terahertz pulse reflected and/or transmitted through the sample which enables retrieving the tomographic profile of an object [5]. Another example is the spectroscopic information of an object in the energy range of few meV, which is useful for identifying chemical species with their spectral fingerprint [6] and for measuring carrier density and mobility of semiconductor devices [7,8]. As a result, a wide range of applications of terahertz imaging has been reported, including biomedical and pharmaceutical applications [9,10,11], quality control of industrial products [12], art conservation [13], and security control [14,15].
The polarization information of the THz-TDS provides additional information on magnetic and anisotropic dielectric properties of materials when employing the terahertz Hall effect [7,16], ellipsometry [8,17], or Faraday rotation spectroscopy [18,19,20,21,22]. In imaging applications, the polarization information is especially important for determining the birefringence of materials, which is useful to probe their anisotropies [23,24]. However, terahertz polarization imaging has not been extensively studied until very recently [24,25,26,27,28,29,30,31,32]. One of the reasons was a lack of sufficiently fast and precise terahertz polarization detection systems, which are crucial to achieve high-speed imaging. Recently, there have been several important reports regarding the realization of fast and highly precise terahertz polarization detection schemes, which are promising for polarization imaging applications. Because the precision and speed of the terahertz polarization measurement is much better than before, a new application field of the terahertz polarization imaging has opened.
This review focuses on several recent research activities aimed at realizing high-speed polarization imaging systems and introduces a few examples for actual implementation which have recently become feasible. Section 2 elucidates some techniques that are important to achieve fast and precise terahertz polarization imaging. In Section 3, the author provides a detailed overview of recent research activities by his group regarding the applications of polarization imaging. Finally, I summarize the article in Section 4.
2. Precise and Fast Terahertz Polarization Measurement Methods
For the practical implementation of terahertz polarization imaging, a fast and precise polarization sensing method is necessary. There have been several important breakthroughs in the terahertz polarization measurement scheme that allow us to increase both the sensitivity and the acquisition rate. In this section, I review several terahertz technologies that are important for the polarization measurement, and in particular, the polarization modulation technique [33].
2.1. Rotating Polarizer Method
A simple and straightforward implementation of the polarization-sensitive (PS) THz-TDS measurement is to place a polarizer (wire-grid polarizer) in the terahertz beam path and quickly rotate it by a mechanical rotator with angular frequency ω which modulates the signal [34]. The typical bandwidth of the wire-grid polarizer is 3 THz. The extinction ratio of the wire-grid polarizer depends on frequency and the typical value is about 1000:1 [35]. A lock-in detection scheme that analyzes the 2 ω frequency component of the polarization-modulated signal enables determination of the polarization direction of the detected terahertz wave with an accuracy better than 1 mrad [34,36]. An important issue in polarization measurements is the effect of the finite extinction ratio of the polarizers, which induces unexpected signals, that is, even if two polarizers with mutually orthogonal transmission axes are placed in the beam path, we have to consider that the terahertz intensity passing through the two polarizers will not become zero. Morris et al. [34] carefully examined the effect of the finite extinction ratio of the rotating polarizer and found that the finite extinction simply scales the amplitude of the measured electric field (E-field) and a careful correction using the extinction ratio of another static polarizer enables precise polarization measurements of terahertz waves. The rotating polarizer method has been employed by several authors for measuring the complex Faraday angle [36], optical activity [37], birefringence [38,39], anisotropic molecular absorption [40], and the thickness of a paint coating by implementing this method in a terahertz ellipsometer [17].
2.2. Utilization of Polarization-Sensitive Intensity Modulation of the Electro-Optic Signal
Electro-optic (EO) sampling [41,42,43,44] is an important technique to quantitatively measure the temporal E-field profile of the propagating terahertz radiation. In the EO sampling technique, the terahertz E-field incident on the EO crystal modifies the crystal’s refractive index ellipsoid via the EO effect (Pockels effect), and the change of the refractive index ellipsoid is probed by the polarization change of an ultrafast laser pulse (hereafter referred to as probe pulse) that is also incident on the EO crystal. This probe pulse needs to be synchronized with the terahertz pulse. By scanning the relative time delay between the terahertz and probe pulses, the time-domain waveform is obtained from the EO signal. The measured EO signal is proportional to the terahertz E-field when the velocity-matching condition between the terahertz and ultrafast laser pulses is satisfied. The absolute value of the E-field can be estimated by considering the effects of refractive index, thickness, and the EO coefficient of the EO crystal [43]. Even though the velocity-matching condition may not be strictly satisfied, the frequency domain analysis, including the dispersion of the refractive index and the EO coefficient (of the EO crystal), provides a precise shape of the E-field transient [45,46,47].
It is possible to probe the polarization of the terahertz pulse by the EO sampling method without use of wire-grid polarizers. Because the sensitivity of the EO signal depends on the crystal orientation and the polarizations of terahertz and probe pulses, the polarization information of the terahertz pulse can be extracted by rotating the EO crystal and measuring two waveforms at specific angles. Because here the wire-grid polarizers are not used, the measurement bandwidth is only restricted by the bandwidth of the EO crystal, where the velocity-matching condition is well satisfied. Planken et al. demonstrated that detection of the terahertz pulse polarization is possible by rotating the <110>-oriented ZnTe crystal if the direction of a specific axis of the crystal is known [48]. Van der Valk et al. provided general equations describing the EO signal as a function of the crystal angle and the polarization directions of the terahertz and probe pulses [49]. Yasumatsu and Watanabe [50] proposed a fast and precise method for polarization determination which employs a mechanically rotating <110>-oriented GaP crystal with a relatively fast angular frequency ω for signal modulation (spinning EO sensor method). Here, a lock-in detection scheme is used to analyze the amplitudes and phases of the ω and 3 ω frequency components of the intensity-modulated signal. They achieved a standard deviation of 0.56 deg (~10 mrad) for the terahertz E-field direction within a measurement time of 21 ms. In this scheme, a precise knowledge of the direction of the specific crystal axis in the GaP crystal is not required during the measurements. Another way to probe the polarization by EO sampling is to modulate the polarization of the probe pulse by using a photo elastic modulator [51] or EO modulator [52]. Nemoto et al. achieved a precision of 0.1 mrad for the direction of the terahertz E-field vector determined within a measurement time of 660 ms [51]. The precise shape of the E-field vector transient is obtained from the experimental results by a numerical analysis including the dispersion of the refractive index [53].
2.3. Utilization of a Polarization-Sensitive Detector
For determining the polarization state of a terahertz pulse, two time-domain E-field transients with mutually orthogonal polarization have to be measured. If a conventional terahertz polarization detection system is employed, it takes additional time to evaluate the second E-field transient because a reorientation of the polarizer to the orthogonal direction is required. In order to perform a real-time polarization measurement, researchers sometimes use PS detectors. In these devices, one can simultaneously detect the terahertz-pulse-induced current along two orthogonal directions [54], which enables real-time extraction of the terahertz E-field vector. Another advantage of PS detectors is that they do not rely on wire-grid polarizers and hence the measurement bandwidth is not restricted by the wire-grid polarizer bandwidth. Below, I describe the two representative PS detectors that have so far been reported.
2.3.1. Polarization-Sensitive Antenna
Simultaneous measurement of two E-field transients with orthogonal polarization is possible by using a multicontact photoconductive receiver with two closely-spaced photoconductive gaps whose directions are orthogonal. Castro-Camus et al. proposed this idea and demonstrated the real-time measurement of the E-field vector of a terahertz pulse [54]. The extinction ratio of their device is about 100:1 [54]. In another work, they achieved a polarization resolution of 0.34 deg (~6 mrad) [55]. Other multicontact geometries have been proposed to improve the accuracy [56,57] and the frequency bandwidth up to 30 THz [58]. The multicontact polarization detection scheme was successfully applied to polymeric materials to extract their birefringence with a careful calibration of the measured PS data [24].
2.3.2. Polarization-Sensitive Air-Biased Coherent Detection
The utilization of ionizing gases for terahertz pulse generation and detection is suitable for broadband THz-TDS measurements because this technique does not suffer from any phonon absorption, which usually occurs in the solid-state terahertz generator and detector [59]. Lü et al. employed an orientation-modulated bias field to coherently detect the amplitude and polarization of a terahertz beam simultaneously [60]. Zhang pointed out that for an accurate polarization determination of the terahertz waves using this method, it is important to take into account the effect of the air plasma birefringence [61].
2.4. Polarization Imaging
Terahertz polarization imaging was applied in 1997 by Mittleman et al. to the imaging of the carrier density and Hall mobility of doped semiconductor wafers by measuring the terahertz magnetoconductivity tensor of the sample [7]. In their setup, they used a polarizing terahertz beam splitter to divide the E-field transients into two E-field transients with mutually orthogonal polarization which were simultaneously measured by using two detectors. The sample was scanned by a pair of translation stages. Van der Valk et al. constructed a terahertz polarization imaging system based on the EO sampling method and recorded the PS scattering images of a coin [25]. They simultaneously measured the two orthogonal E-field transients by utilizing the polarization-dependent sensitivity of the EO effect. Terahertz polarization imaging has been employed for observing the sharp edge of a sample [26] and birefringence [27]. To realize fast terahertz polarization imaging, several techniques based on a combination of a CCD camera with the EO sampling method have been reported [28,62]. Takai et al. achieved the standard deviation of 3.5 deg (~60 mrad) for the terahertz E-field direction at each pixel of the CCD within a measurement time of 21 ms [62].
Finally, we summarize Section 2 by comparing several terahertz polarization detection techniques introduced in this section. In the rotating polarizer method, simple implementation of the PS THz-TDS and simple analysis of the measured data are possible. The extinction ratio of the wire-grid polarizer is relatively high, and the effect of the finite extinction ratio can be eliminated by the numerical analysis in the rotating polarizer method. On the other hand, it is difficult to realize the extremely high frequency bandwidth of the PS THz-TDS in this method, because the frequency bandwidth of the wire-grid polarizer is limited. The polarization detection by rotating the EO crystal has an advantage that the frequency bandwidth of the measurement is only restricted by the bandwidth of the EO crystal, where the velocity-matching condition is well satisfied. Recently, the EO sampling in the near-infrared frequency range was reported [63], and thus the PS THz-TDS in the near-infrared frequency range is potentially available. The polarization detection by using the PS antenna and PS air-biased coherent detection has lower extinction ratio compared to the rotating polarizer method, while they have the advantages that the real-time polarization measurement is possible, and the frequency bandwidth of the measurement is broad [64]. It is reported that the bandwidth of the PS antenna can increase up to 190 THz [65]. Each technique has its own advantage and it is important to choose the appropriate technique depending on certain application.
3. Applications of Terahertz Polarization Imaging
In Chapter 2, I reviewed several technologies that are essential for fast and precise determination of the E-field vector or the polarization of the terahertz pulses. Such advanced techniques are very important to obtain a terahertz polarization image with good precision within a practicable measurement time. Owing to recent advances, various interesting terahertz polarization imaging results have been reported [7,23,24,25,26,28]. In this chapter, I summarize our recent activities regarding applied terahertz polarization imaging.
3.1. High-Resolution Topography
The PS THz-TDS based on the polarization modulation technique provides very precise information on the temporal information of the E-field vector of the propagating terahertz waves. For certain imaging applications, the E-field vector angle can provide information that is more stable and precise than the information provided by the absolute value of the E-field. Reference [66] is an example that utilizes the polarization information of the terahertz waves to retrieve precise information on the surface topography (high-resolution T-ray topography).
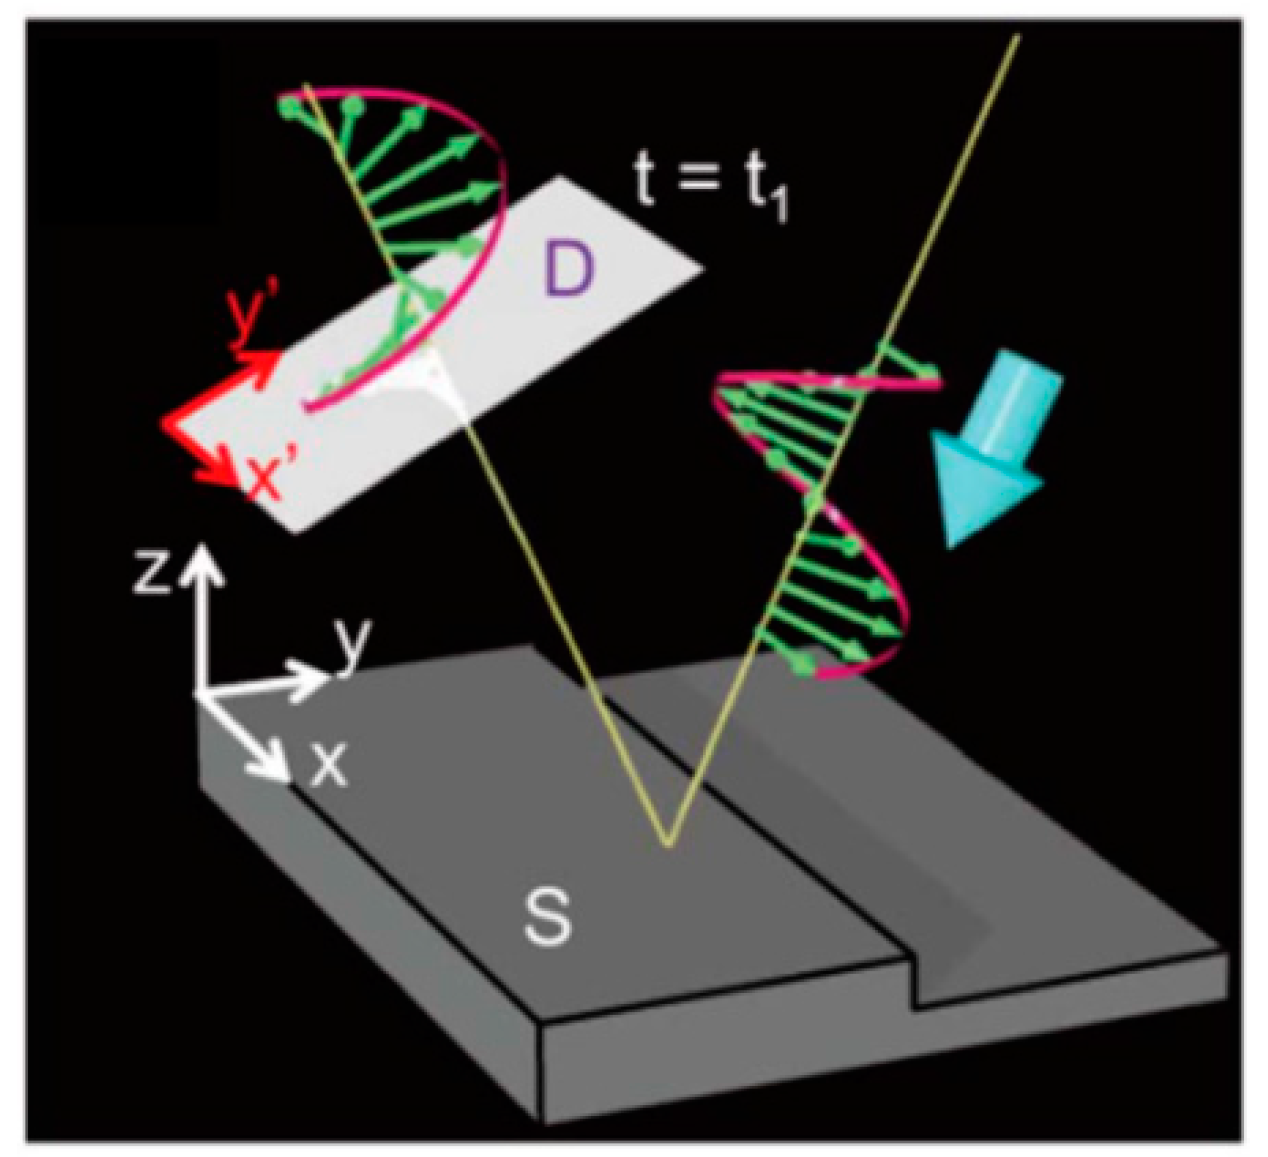
Figure 1 shows the concept of the high-resolution T-ray topography measurement which utilizes the PS THz-TDS in reflection mode (i.e., it measured the polarization information of the terahertz waves reflected from the sample). Here, we illuminate the sample by an elliptically-polarized terahertz pulse whose E-field direction performs one complete rotation within a single optical cycle of the terahertz pulse. The reflected terahertz pulse that has arrived at the detector is probed by the spinning EO sensor method [50] to precisely determine the magnitude and angle of the E-field vector. Because the measured angle of the terahertz E-field depends on the traveling time of the terahertz pulse, the angle contains the height information or topography information of the sample.
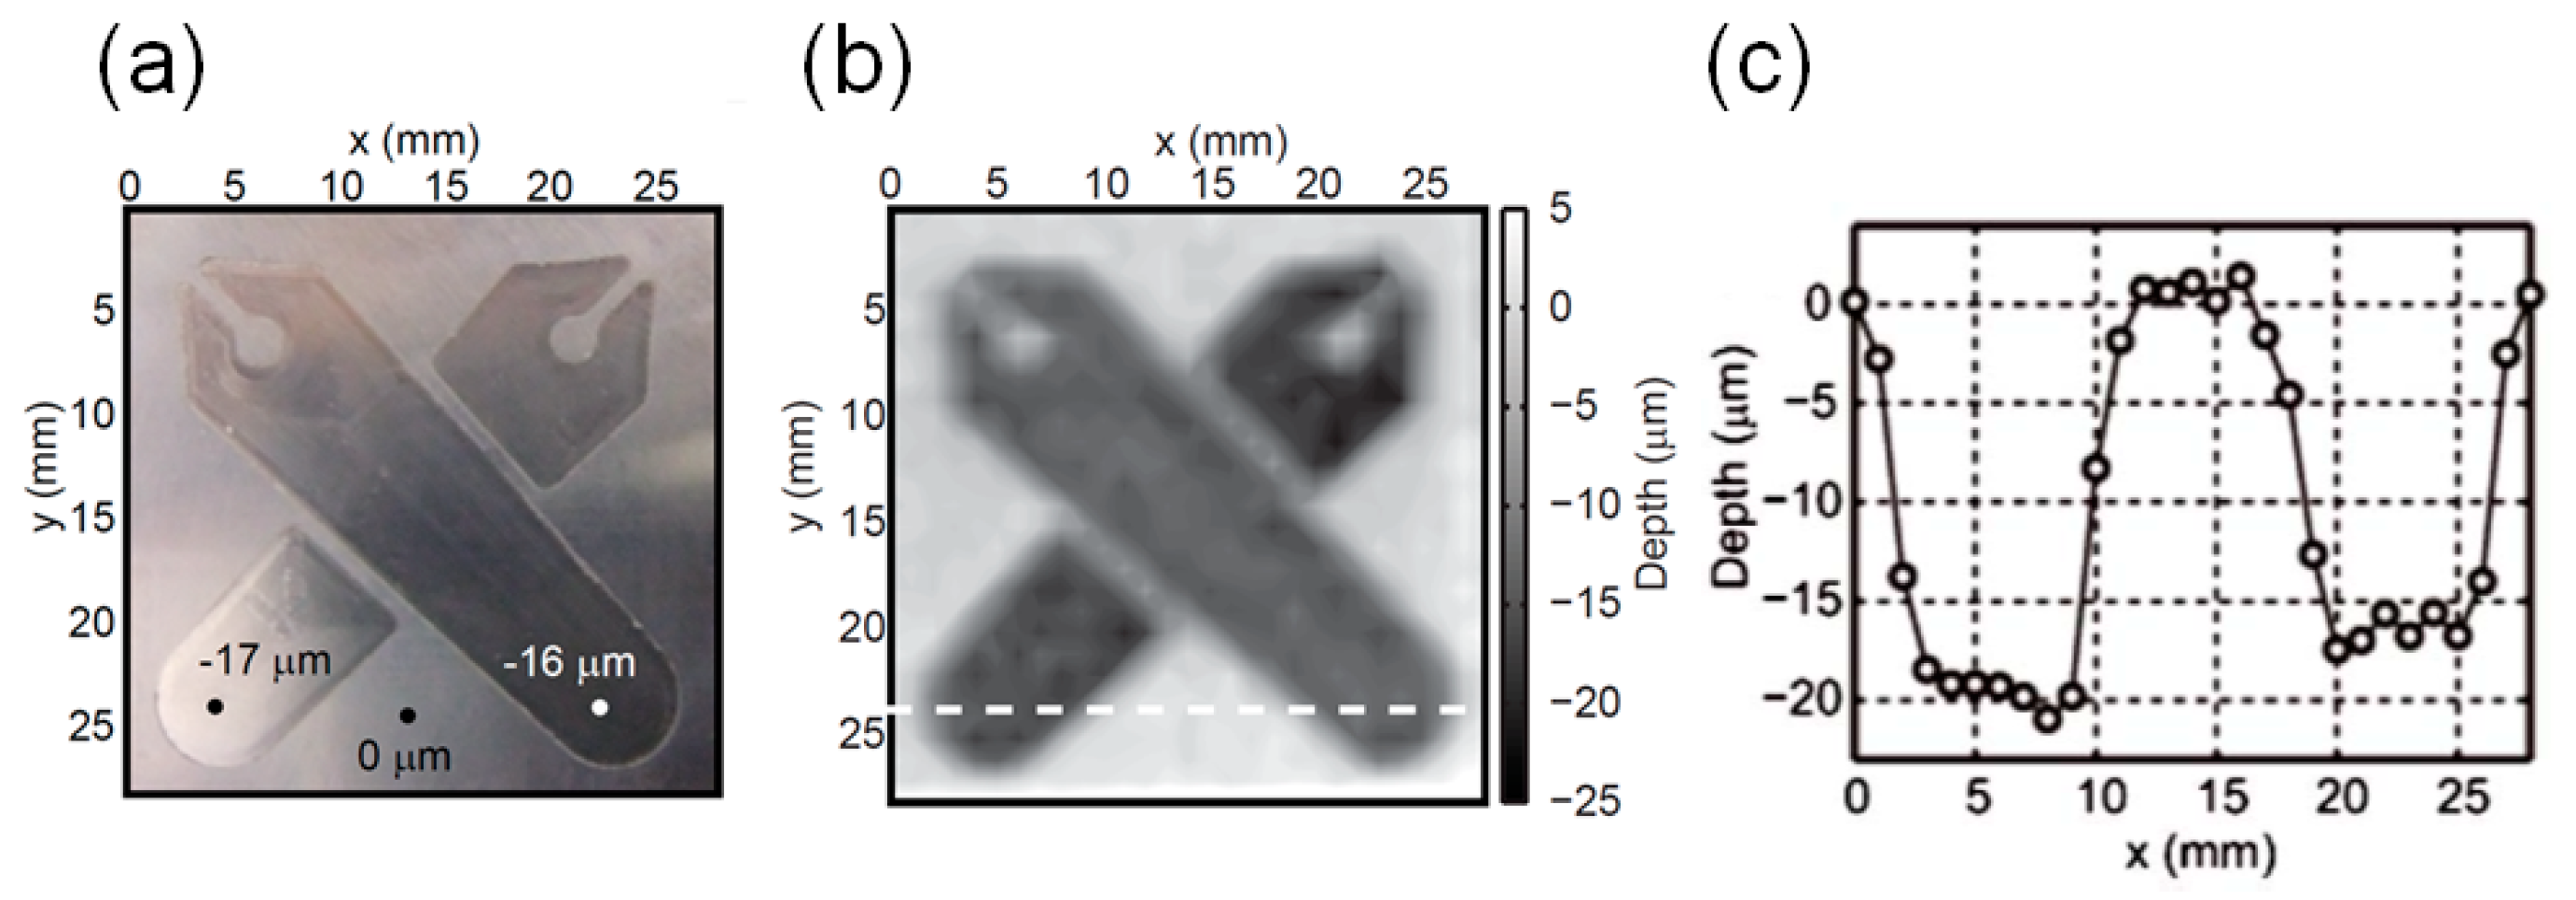
Figure 2 shows an actual T-ray topography image [66]. A photograph of the sample (a machined aluminum board including our university emblem) is shown in Figure 2a. The depth of the emblem on the board is about 17 μm, measured by a digital height gauge. The topography extracted from the PS THz-TDS data is shown by the map in Figure 2b. Figure 2c plots the cross-section of the topography data along the white line in Figure 2b. Obviously, the PS THz-TDS measurement is able to quantitatively trace the height profile of the sample with an axial resolution (~1 μm) much better than the wavelength of the terahertz pulse.
In our system, the axial resolution of the topographic image is about λ/1000 where λ is the center wavelength of the terahertz pulse (~600 μm). Please note that the axial resolution smaller than 1 μm is easily achieved by the terahertz pulse with relatively low spectral bandwidth (<1 THz). This is in stark contrast to the regular THz-TDS topography and tomography system where the terahertz pulse with much broader bandwidth with sharp terahertz E-field pulse structure is required to improve the comparable axial resolution [67]. The extremely high axial resolution utilizing PS THz-TDS is due to the precise determination of the E-field angle of the elliptically polarized terahertz pulse within the single cycle of the terahertz pulse, that is, the direction of the E-field is changing by 360 deg within a single optical cycle while the determined E-field vector direction has an accuracy of about 1.8 deg.
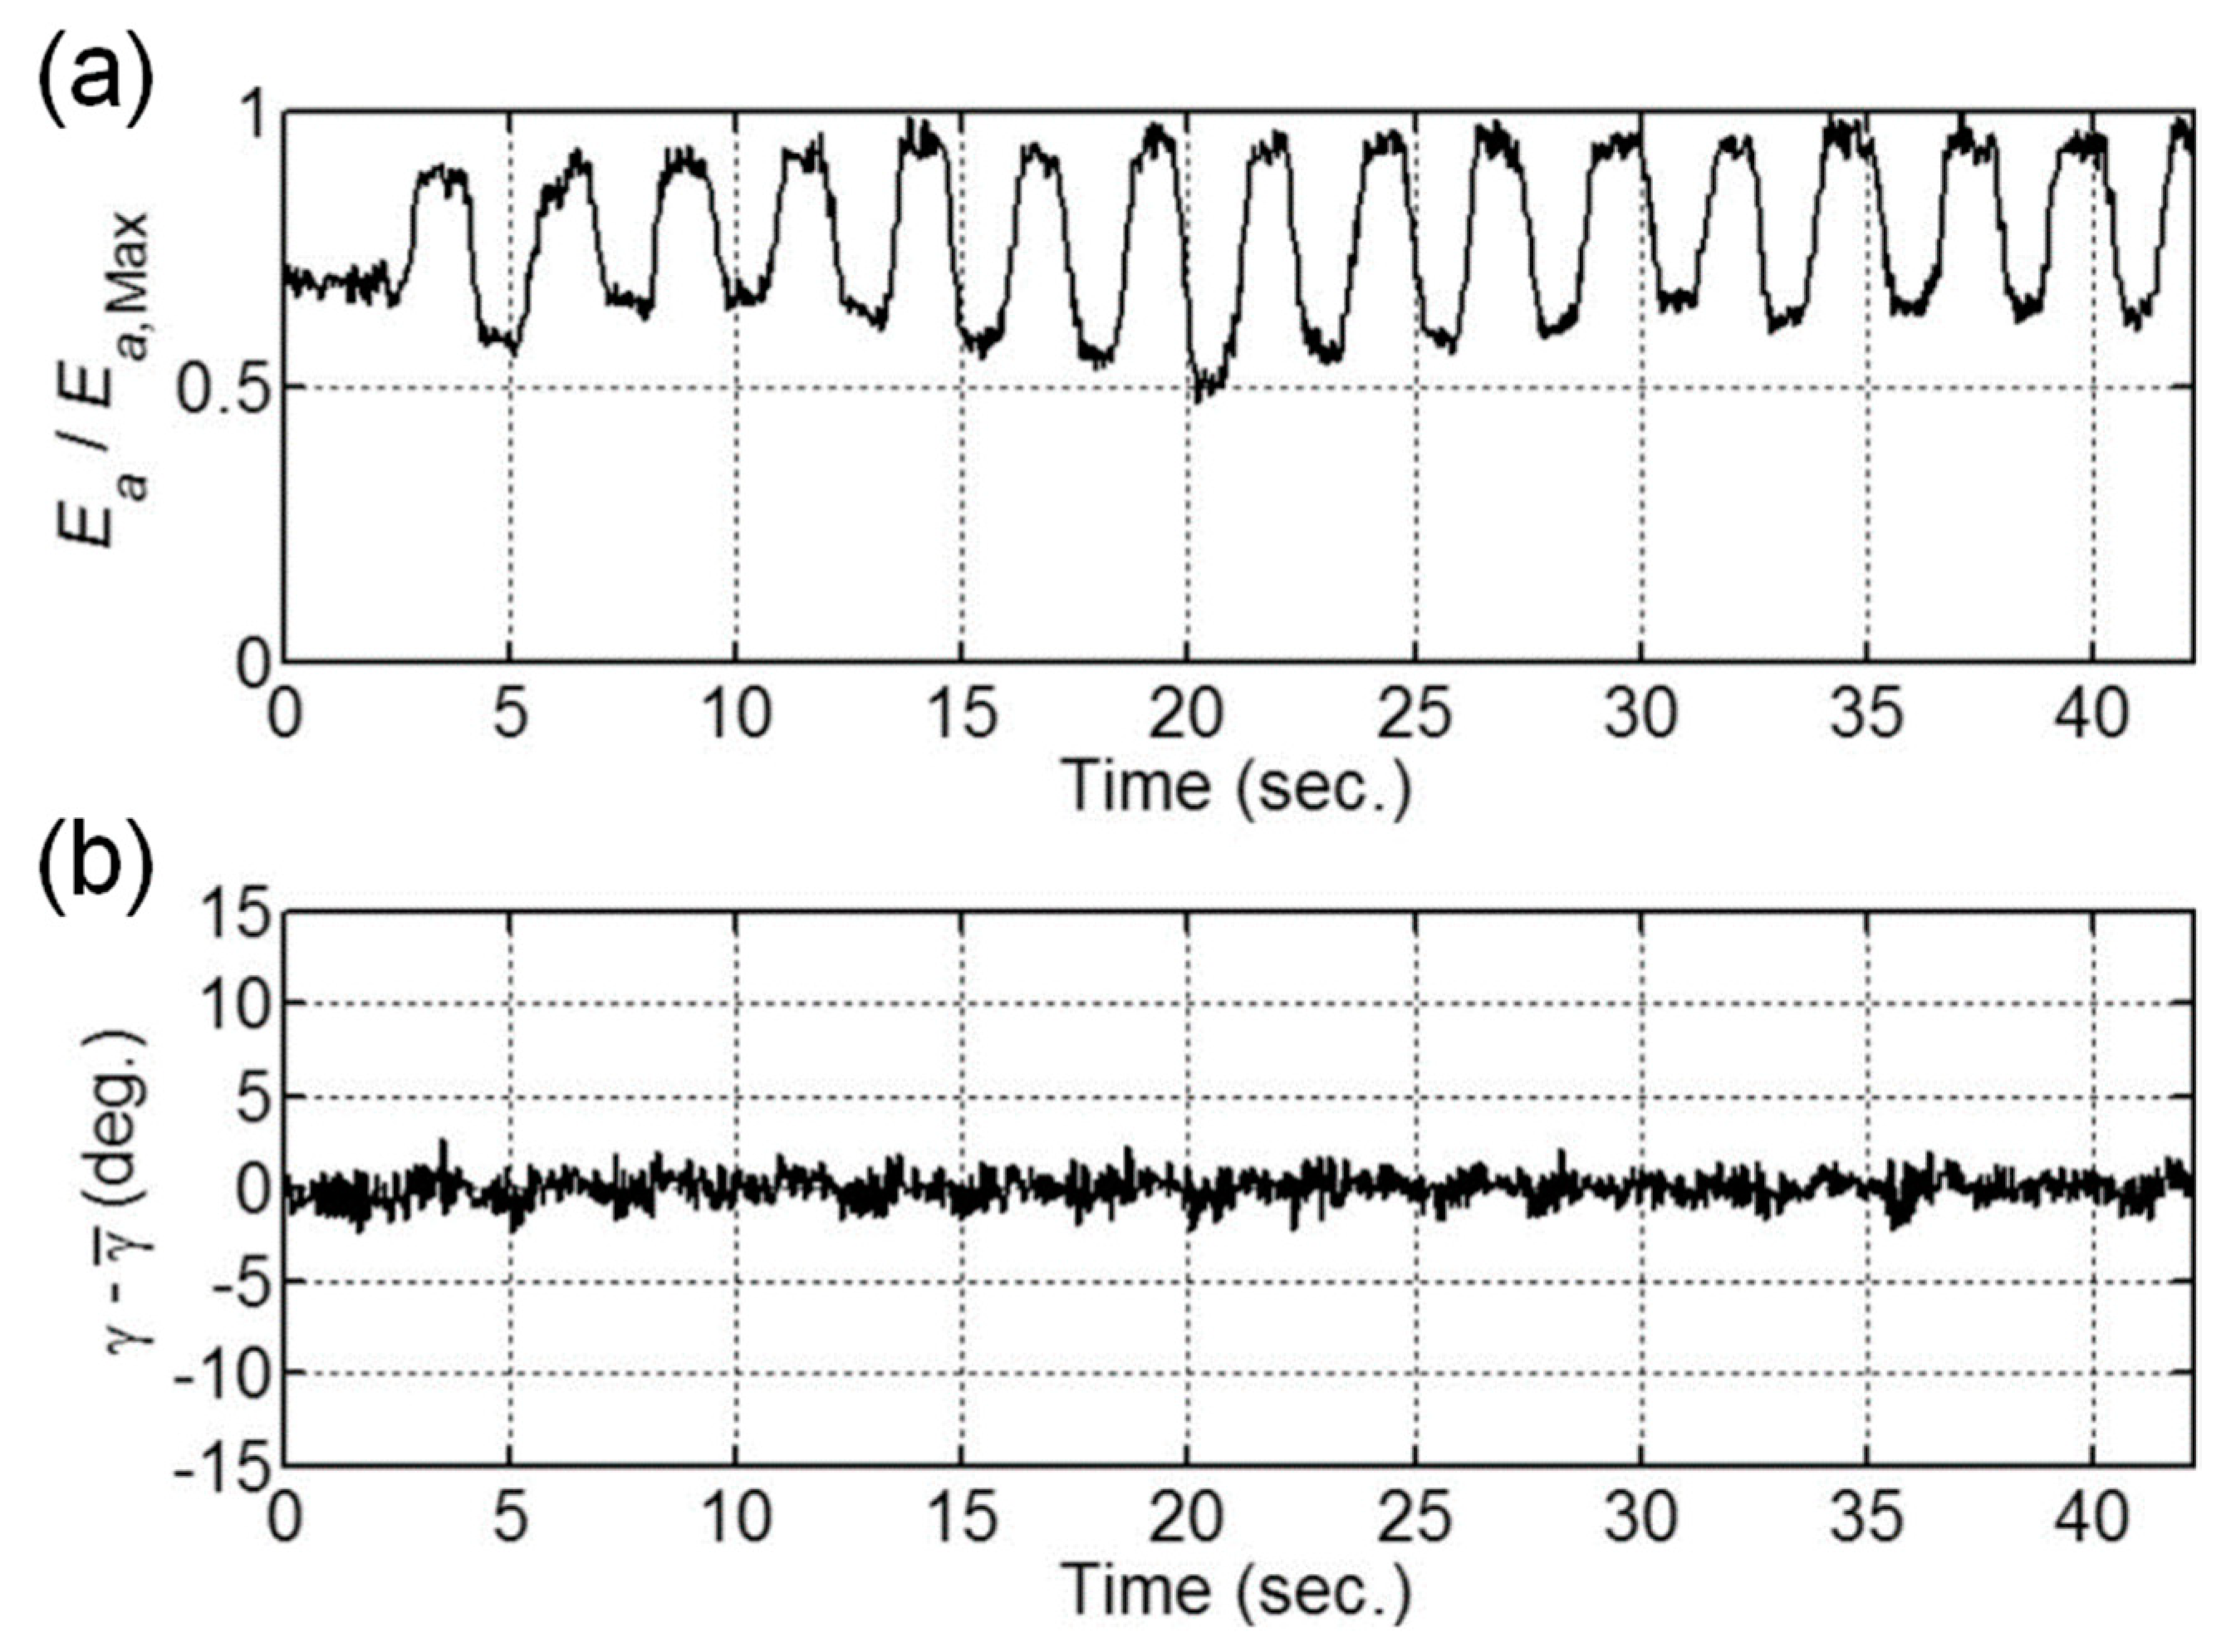
It is interesting to note that the topography image obtained by the PS THz-TDS utilizing the E-field vector angle information is much more stable than the image obtained by utilizing the magnitude information within the single cycle of the reflected terahertz E-field [68]. This might be a result of a very sensitive magnitude of the terahertz E-field with respect to slight inclinations of the surface or surface roughness of the sample in the reflection geometry, while the polarization information stays rather unaffected. In addition, the polarization modulation technique is insensitive to amplitude fluctuations of the terahertz signal which originate from the power fluctuation of the femtosecond laser pulses used to generate the terahertz radiation. Figure 3 shows the experimental results that verify the stability of the terahertz polarization measurement using the spinning EO sensor method [50]. In this experiment, we intentionally modulate the power of the laser pulse to demonstrate the negligible influence of the terahertz E-field magnitude fluctuations. Even though we periodically change the magnitude of the terahertz pulse (Figure 3a), the measured polarization direction is hardly influenced (Figure 3b). The robustness of the terahertz polarization measurement that implements the modulation technique could play an important role for experiments that require very stable polarization information such as the high-resolution T-ray topography.
3.2. Visualization of Spatio-Temporal Variation of the E-Field Vector of the Focused Terahertz Beam
In THz-TDS measurement systems, researchers usually use 90° off-axis parabolic mirrors to focus the terahertz pulses on the sample and the detector. In order to perform a quantitative terahertz polarization spectroscopy, the precise knowledge of the spatial E-field vector distribution (or polarization distribution) at the focal plane is vital. In particular, we have to elucidate what happens when we focus a linearly polarized terahertz pulse by an off-axis parabolic mirror. Is the focused beam still linearly polarized? To answer this question, we constructed a terahertz E-field vector imaging system using a CCD camera [62] and investigated the spatial E-field vector distribution at the focal plane. We observed an unusual E-field vector distribution and successfully explained the experimental results by a rigorous calculation as outlined below [69,70].
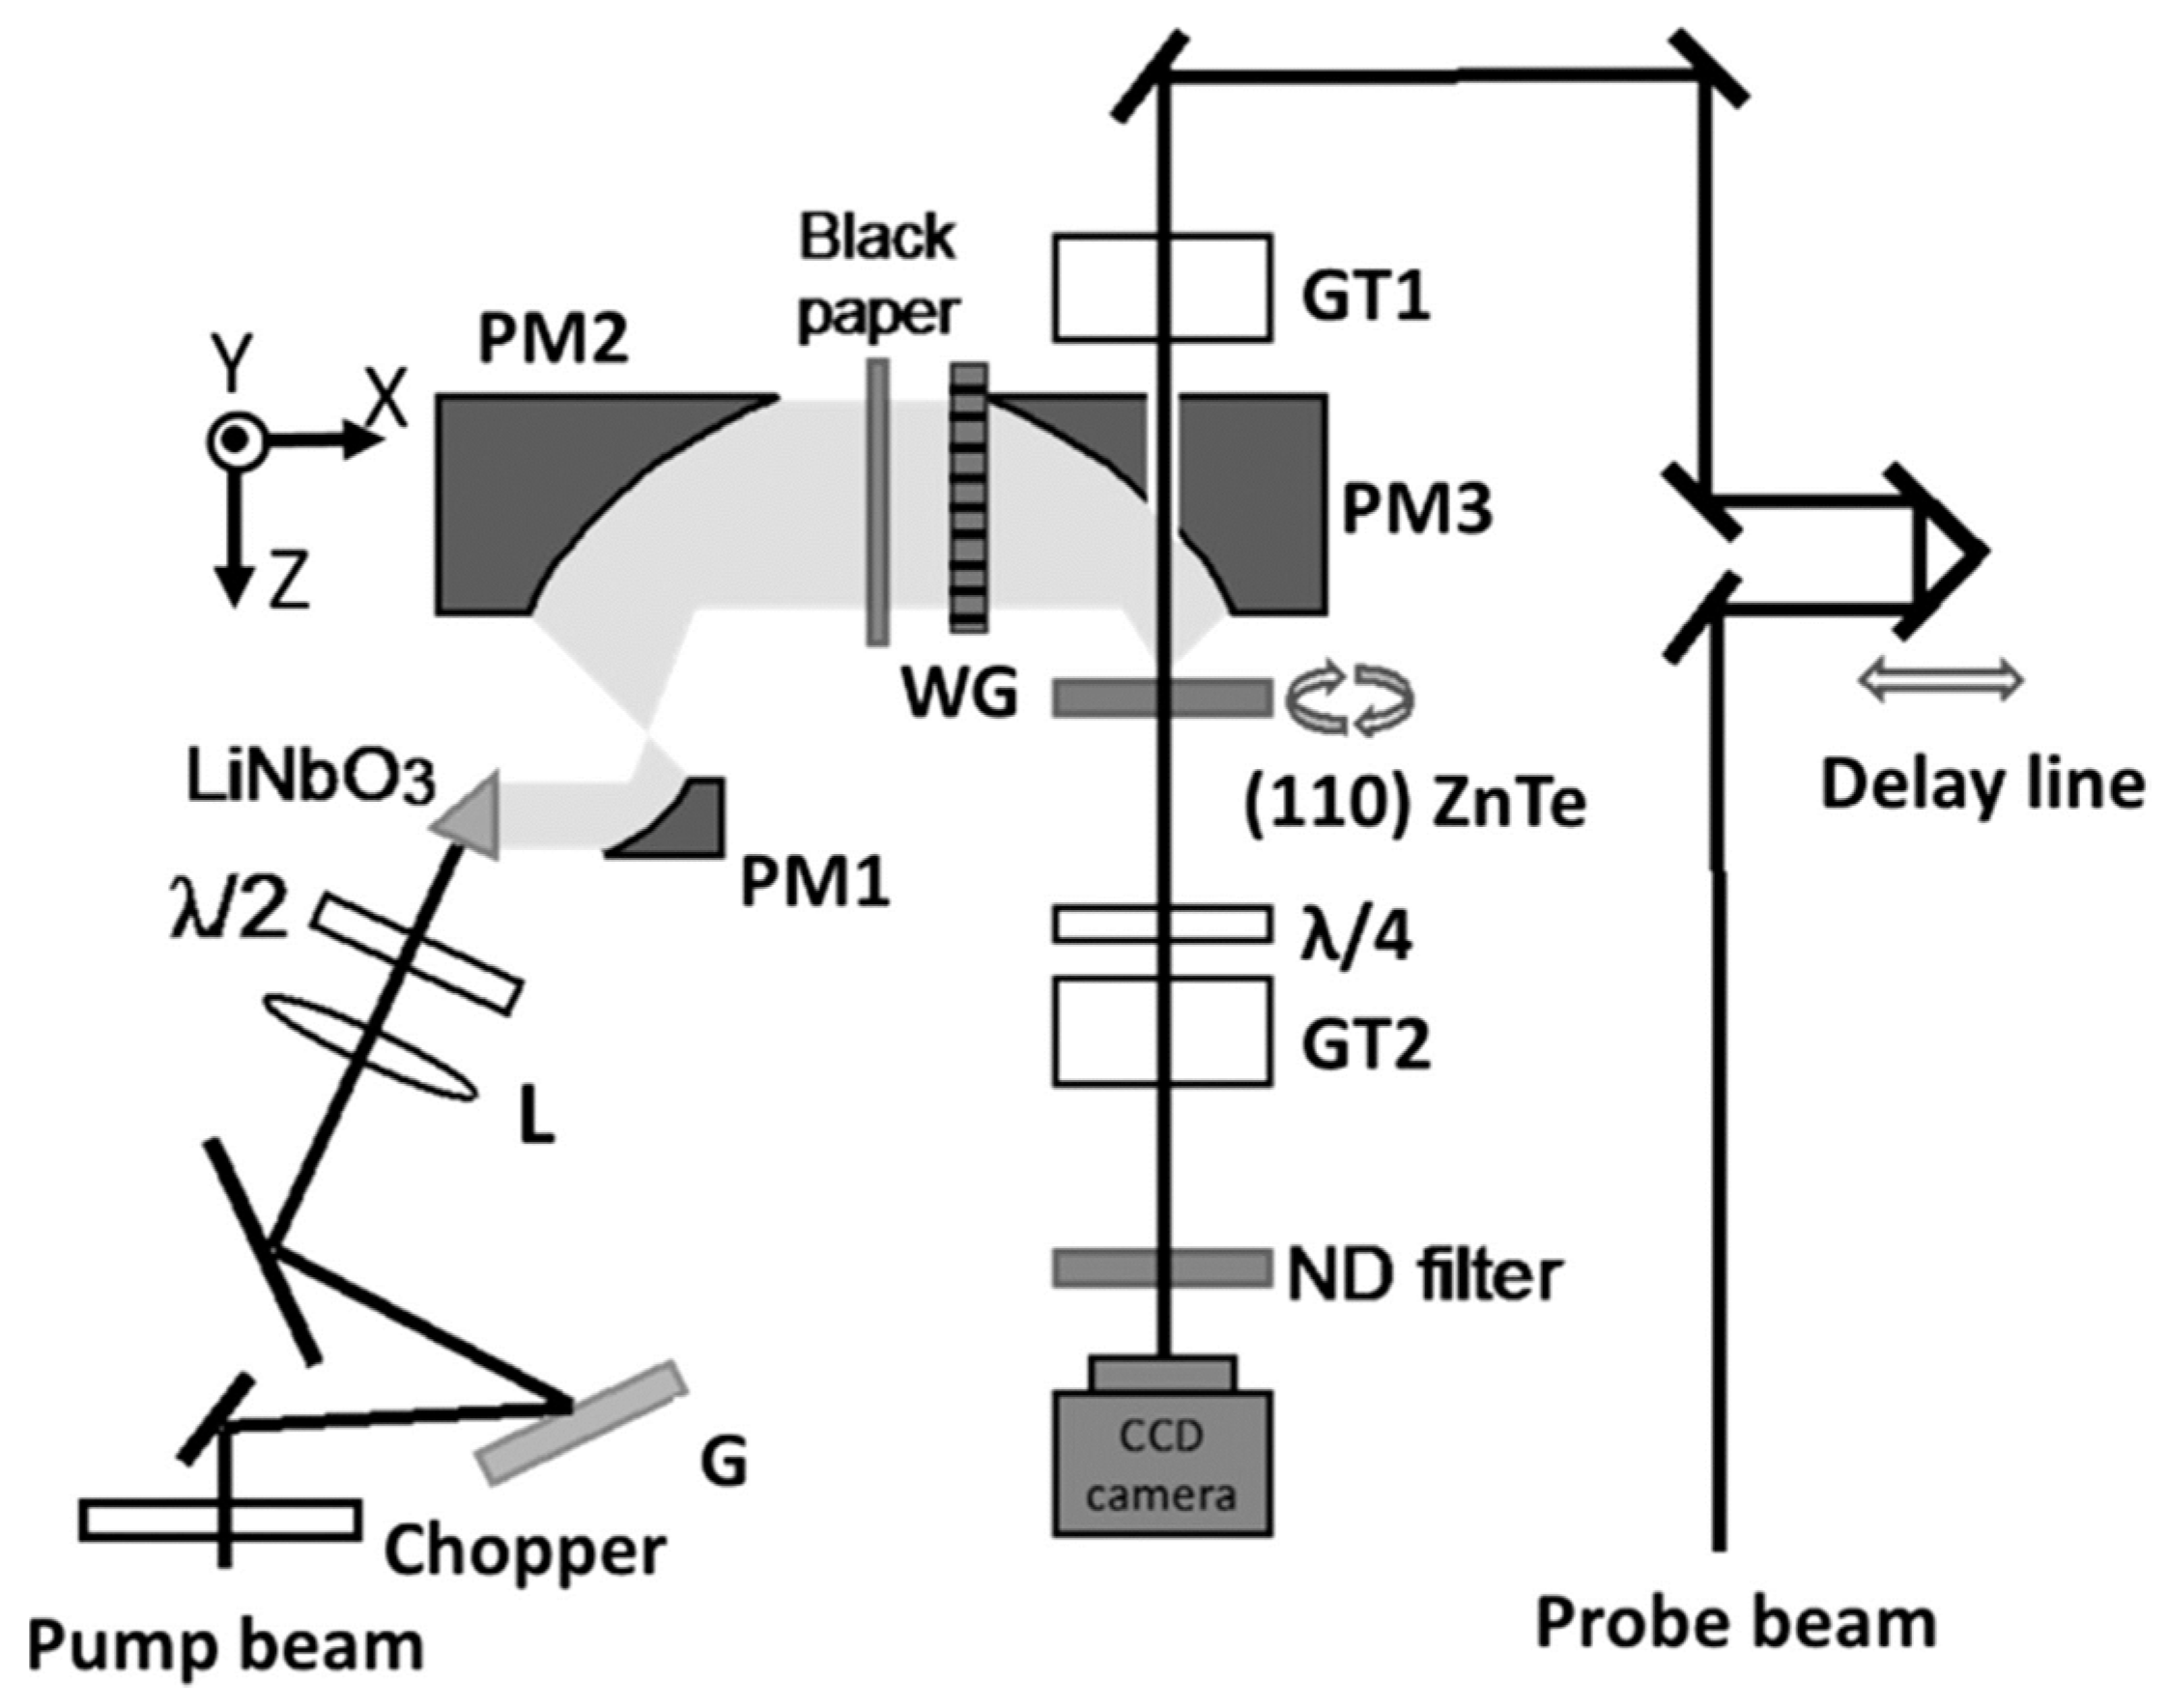
Figure 4 shows the experimental setup of the terahertz E-field vector imaging system [62]. Here, we use a titanium-sapphire regenerative amplified laser system (with a repetition rate of 1.042 kHz and an average power of 570 mW) for both the terahertz pulse generation and detection. The terahertz pulse is generated by optical rectification in the LiNbO3 crystal by using the tilted-pump-pulse-front method [71]. The generated terahertz pulse is almost collimated at the surface of the LiNbO3 crystal [72]. This pulse is focused by the first off-axis parabolic mirror (PM1) and collimated again by the second off-axis parabolic mirror (PM2). The collimated terahertz pulse passes through the wire-grid polarizer (WG) with a transmission axis parallel to the Y-axis, and thus becomes linearly polarized along the Y-direction. Finally, the terahertz beam is focused on a <110>-oriented ZnTe crystal by the third off-axis parabolic mirror (PM3) with a diameter and reflected focal length equal to 2 inches. The spatio-temporal profile of the focused terahertz E-field vector is measured by the spinning-EO sensor method; a collimated linearly polarized probe pulse (right-hand side of the figure) first passes through the Glan-Thompson prism (GT1) and then through the ZnTe crystal which is mechanically rotated. The polarization–rotation image of the probe pulse on the ZnTe crystal is analyzed by measuring a certain polarization component (defined by the quarter waveplate denoted as λ/4 in the figure and the second Glan-Thompson prism GT2) by a CCD camera. After the temporal profile of the E-field vector has been obtained at each pixel of the CCD camera, we perform the Fourier transform of the temporal profile of the E-field vector data at each pixel and extract a single frequency component.
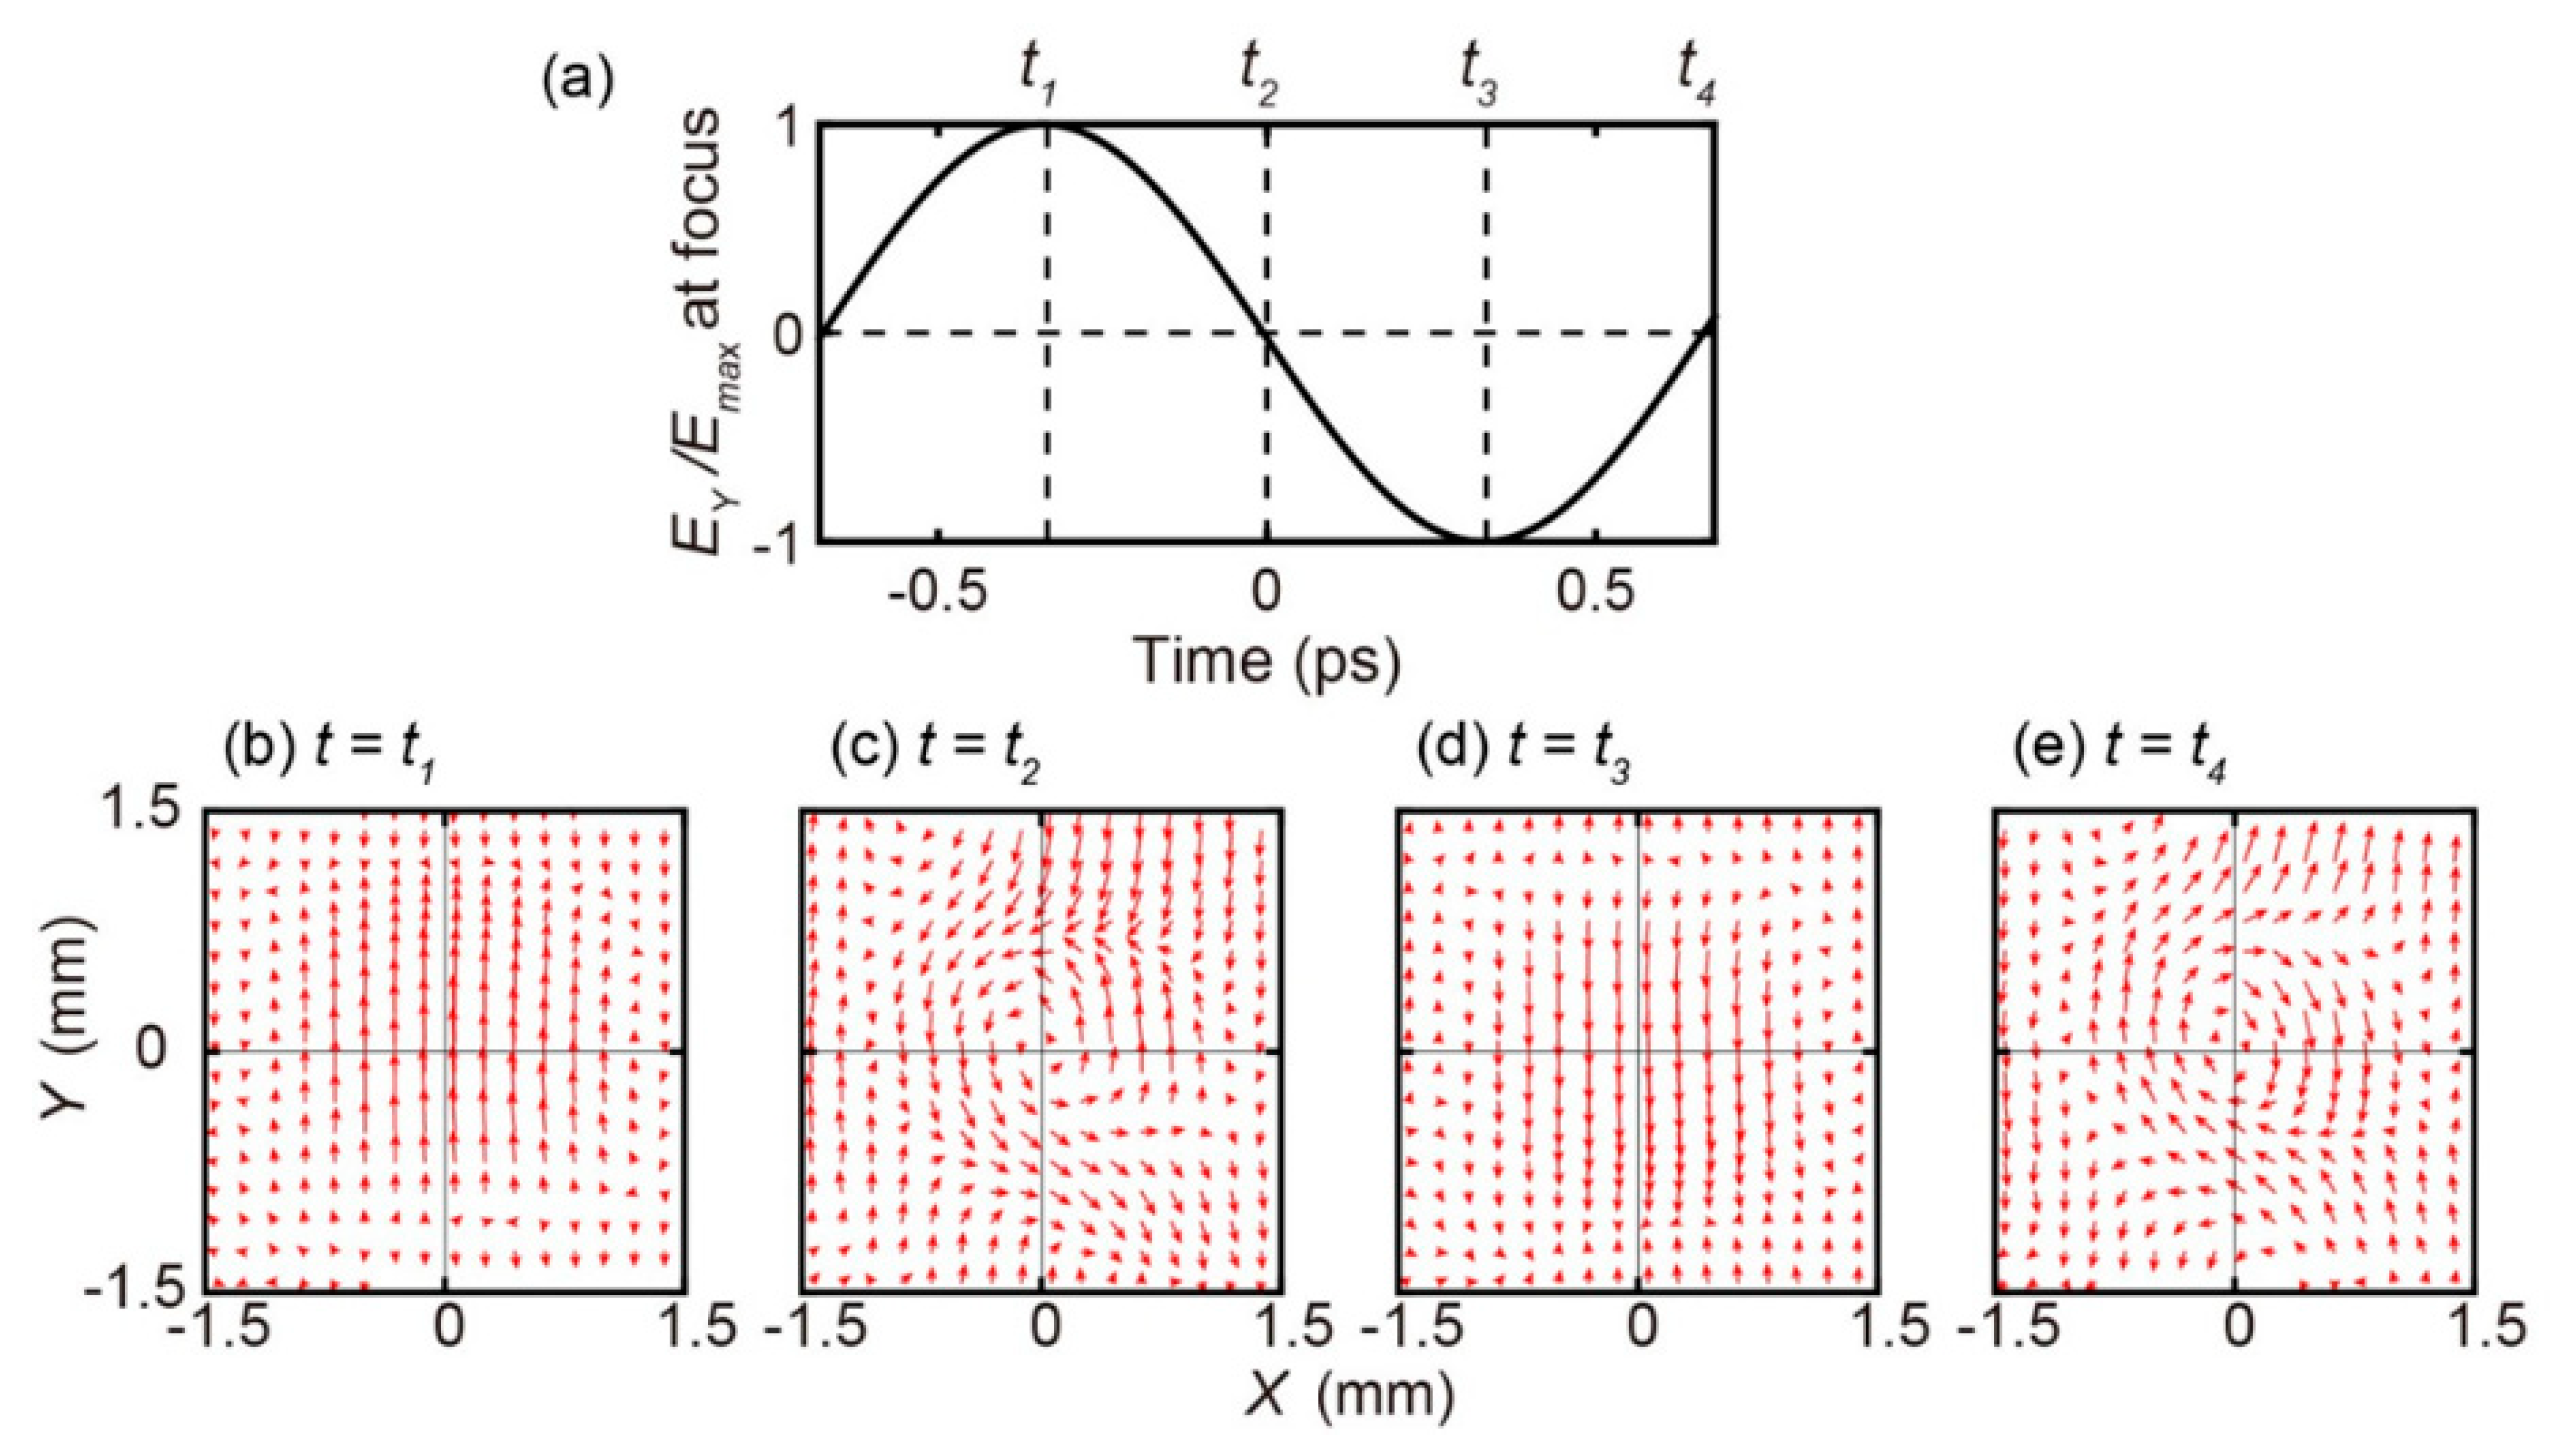
Figure 5 shows the experimental results [70]. Figure 5a plots the time evolution of the Y-polarized E-field at the focus of the parabolic mirror for the frequency component 0.75 THz. We analyze the spatio-temporal behavior of the pulse by considering the four instants of time corresponding to the time where the E-field is maximum (t = t1), minimum (t = t3), and zero (t = t2 and t4) at the focus. Figure 5b–e shows the spatial profile of the E-field vector in the focal plane at these four specific times. The focus lies at X = Y = 0. Figure 5b,d reveals that for times when the E-field is maximum (minimum), all E-field vectors point upwards (downwards). This result is expected because we focused a Y-polarized terahertz pulse with polarization along the vertical direction. The unexpected result is obtained at times when the E-field is zero at the focus (t = t2 and t4); we find that the E-field around the focus is not zero but rotating around the focus anticlockwise (Figure 5c) and clockwise (Figure 5e). The strength of the rotating E-field at t = t2 and t4 is not so small; it is about one tenth of the strength of the maximum E-field at the focus [69].
We performed a rigorous calculation to explain these experimental results and obtained a formulation of the clockwise and anticlockwise rotating E-field vector at times when the E-field is zero at the focus. Using this theoretical result, we can calculate the ratio of the rotating E-field strength (at t = t2 and t4) at positions where the distance from the focal point is half of the wavelength to the maximum E-field strength (at t = t1 and t3) at focus, resulting in [69];
where is the radius of the parabolic mirror and is the focal length of the parabolic mirror where the reflected focal length is twice the focal length. In our experimental condition in Figure 4, and are both 1 inch. Therefore, the predicted ratio is ~0.2, which is on the same order as the experimentally observed ratio of about 0.1. The slight difference may come from the fact that the collimated terahertz pulse did not cover the entire surface region of the parabolic mirror (PM3 in Figure 4), that is, we used a smaller value for .
The rotating E-field vector at t = t2 and t4 implies that the focused terahertz pulse is not linearly polarized but elliptically polarized in the focal plane except at the focus (X = Y = 0). At some positions in the focal plane, we even observed almost complete circular polarization [70]. Our experimental and theoretical investigations provide important suggestions for reliable quantitative terahertz polarization measurements using off-axis parabolic mirrors.
- The sample and the detector should be placed at the focus, because the polarization of the focused terahertz pulse is maintained at the focus only.
- The strength of the complicated rotating E-field can be significantly reduced if we increase the focal length () or decrease the radius () of the off-axis parabolic mirror as shown by Equation 1. For example, when we use a 90° off-axis parabolic mirror with a diameter of 2 inches and a 4-inch reflected focal length for focusing, then the magnitude of the rotating E-field at t = t2 and t4 is about 5% of the maximum E-field (observed at t = t1 and t3) at the focus. In such a way, the influence of the polarization change induced by focusing with a parabolic mirror can be controlled.
The above guidelines may be useful for quantitative terahertz polarization experiments.
3.3. Visualization of Anisotropy and Strain in Black Rubbers
Probing birefringence is one of the most important applications of terahertz polarization spectroscopy to study the anisotropy of materials (for a comprehensive review, please refer to reference [73]). The study of birefringence in the terahertz regime is especially important for polymeric materials. One of the reasons is that many polymeric materials are optically opaque in the visible and near-infrared spectral regions, but are sufficiently transparent for terahertz waves, which allows us to investigate the internal condition of polymeric products. Another reason is that polymeric materials are sometimes in an amorphous phase, and investigation of the molecular orientation of polymeric chains in an amorphous phase by X-ray diffraction measurements is difficult. Therefore, terahertz polarization spectroscopy provides a unique solution to investigate the structural anisotropy of polymeric materials. There are a few reports that have investigated the terahertz optical anisotropy and birefringence of polymeric materials [24,74,75,76,77,78,79,80,81,82]. Katletz reported the terahertz birefringence imaging of glass-fiber-reinforced plastic samples. This pioneering work succeeded in visualizing the preferred alignment of the glass fibers which occurs during the injection molding process [24].
We performed the terahertz birefringence imaging of a black rubber sample. Black rubber with conductive carbon black fillers is a very common polymer type, widely used as tires, seismic dumpers, and so on. To ensure product quality and safety, it is important to nondestructively inspect the internal strain or cracks in black rubber products. However, like many other polymeric materials, black rubber is optically opaque and amorphous. Therefore, its internal anisotropy is difficult to probe by both optical birefringence experiments and X-ray diffraction experiments. On the other hand, the terahertz polarization spectroscopy is a promising technology that provides an effective way to investigate the internal anisotropy of black rubber samples [83]. An interesting aspect of the investigation of the rubber samples is that they provide a unique opportunity for artificially changing the birefringence by simply stretching the sample.
We found that the birefringence in the terahertz frequency regime of the black rubber is large because of the anisotropic conductivity of the sample, which is a result of the anisotropic alignment of the carbon black aggregates [38]. This anisotropic alignment can be easily controlled by stretching of the sample, and therefore, the anisotropy of the conductivity can be modified [84] and the birefringence largely changes. This connection allows us to estimate the internal strain of a stretched black rubber sample by terahertz polarization imaging [83]. In the following, we summarize our results on the spatial distribution of optical anisotropy and internal strain in a stretched black rubber sample. A detailed review on the terahertz polarization spectroscopy of black rubber samples will be published elsewhere [85].
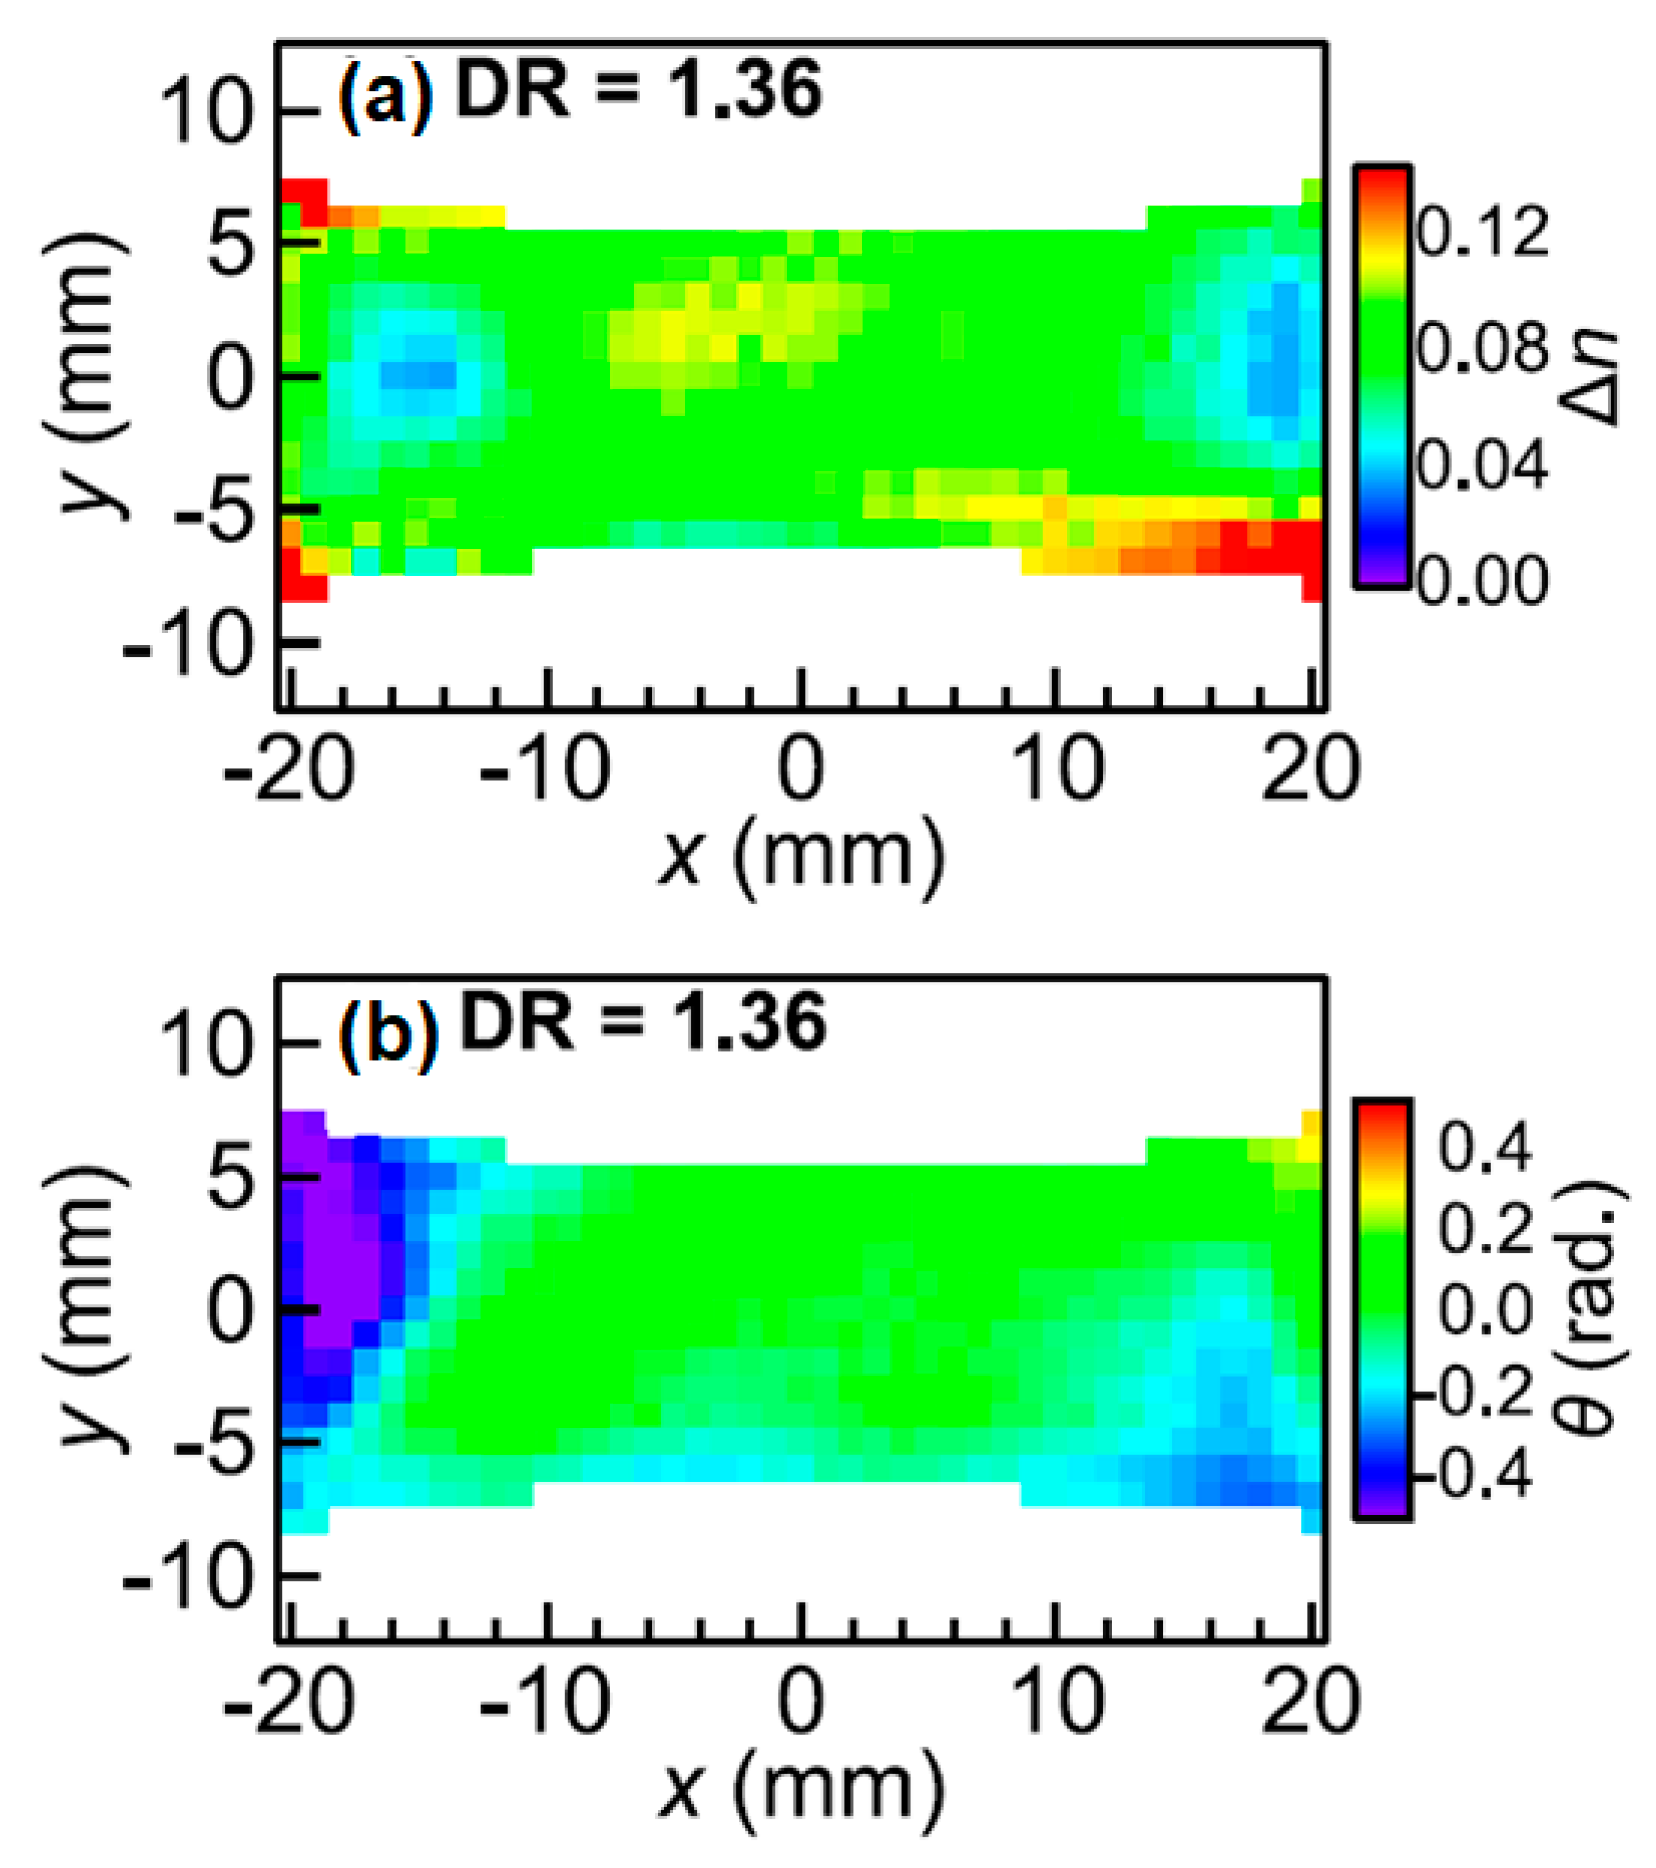
We constructed a terahertz polarization imaging system with the rotating polarizer method where the degree of birefringence () and the angle of the slow optic axis () of the black rubber sample can be measured. The thickness of the sample (direction along the z-axis) was 1 mm, and the lengths of the short (y-) and long (x-) axes of the sample were 20 and 50 mm, respectively. We stretched the sample along the x-direction with a draw ratio (DR) of 1.36, which means that the length became 136% of the length under the unstretched condition. Figure 6a,b shows the experimentally obtained spatial maps of and . From Figure 6a, we find that the at the edge (|x| > 15 mm) is smaller than that at the center (around x = 0 mm) of the sample, indicating that the in-plane strain is smaller at the edges of the sample. In addition, is almost zero at the center, indicating that the carbon black aggregates in this region have aligned along the x-direction due to the stretching.
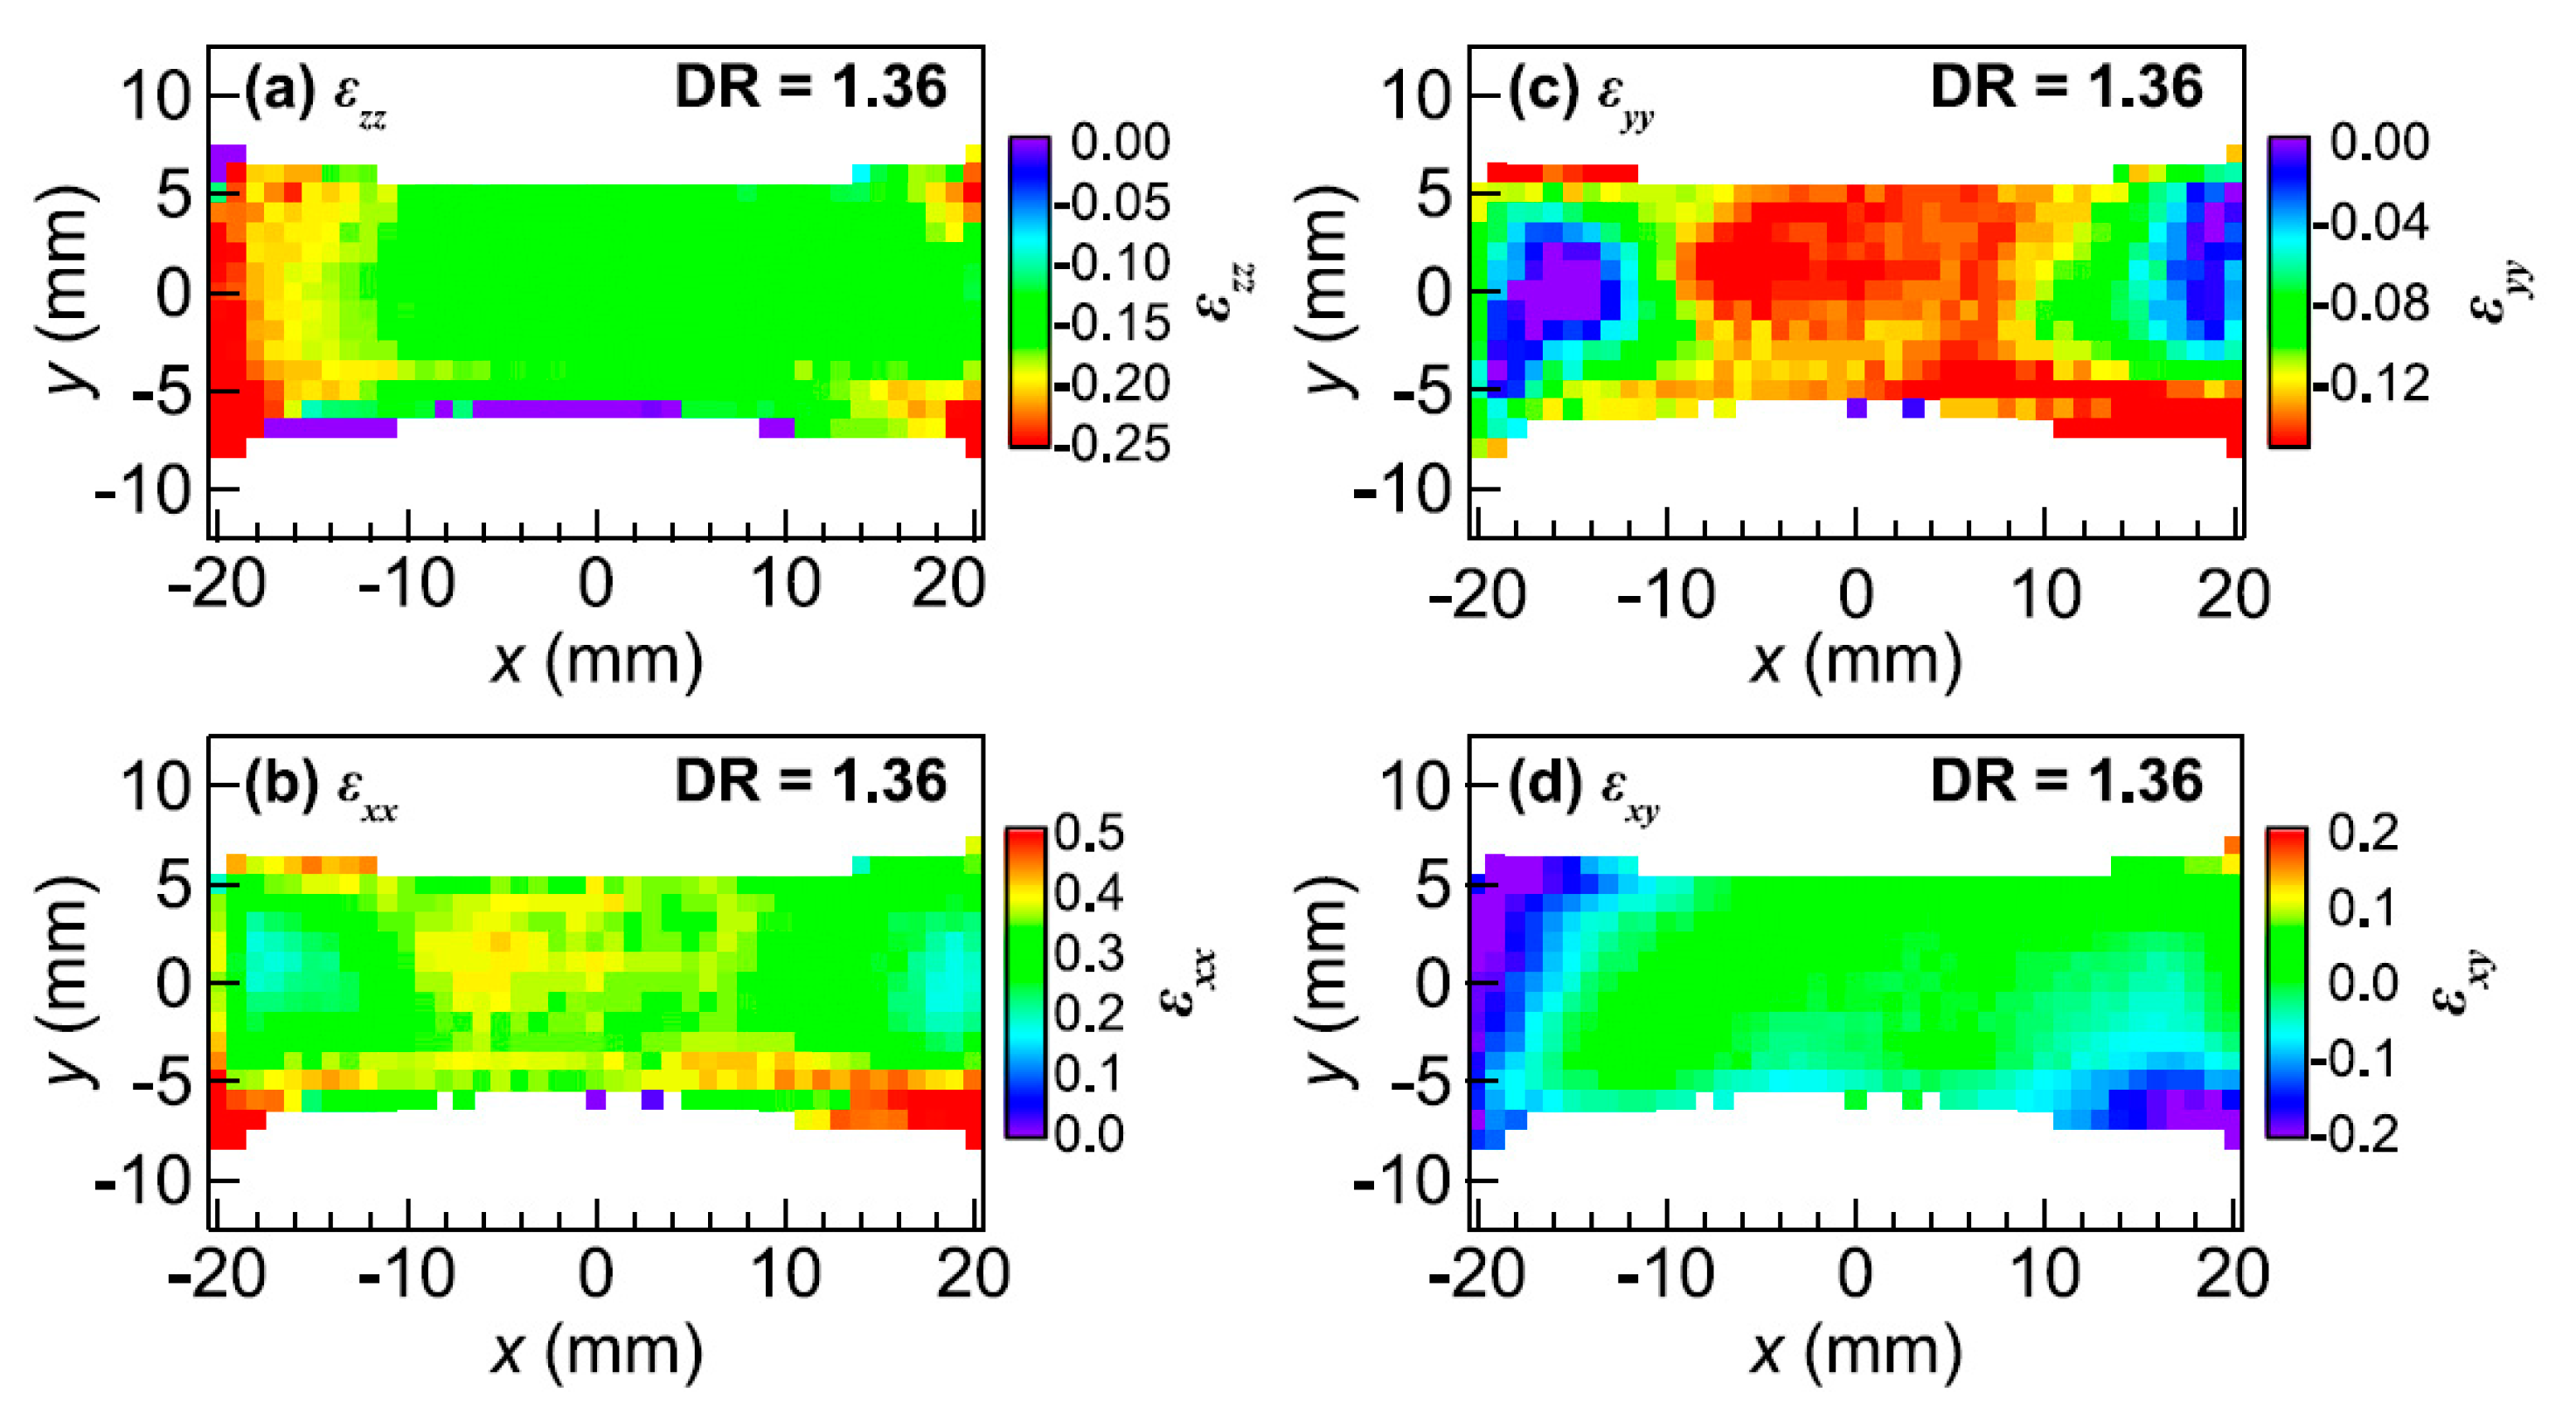
We can evaluate the internal strain of the black rubber sample from the PS THz-TDS data. The strain tensor can be written as
where , , and are the in-plane strain tensor components and is the out-of-plane strain tensor component determined by the thickness change of the sample due to the stretching. Thickness is determined by minimizing the frequency-dependent oscillations in the complex index of refraction as originally reported by Dorney et al. [86]. The spatial variations of the in-plane strain tensor components are estimated from that of and determined in Figure 6 with the aid of Monte Carlo simulations. The latter assumes many carbon black aggregates with elongated shape in the rubber matrix and accounts for the fact that the local strain modifies their orientations [83]. Figure 7 shows the spatial mapping of each strain tensor component of the stretched black rubber sample. A spatial variation in the strain tensor components is clearly observed. In particular, is small at the edge when compared to the values observed at the center of the sample, indicating that the strain in the y-direction is suppressed at the edges. Indeed, since we used a pair of clamps that fixed the left and right edges of the sample, the shrinking of these regions in the y-direction is inhibited. In addition, we observe an asymmetric spatial distribution of , which may be a result from an asymmetric clamping condition. We emphasize that PS THz-TDS enables a nondestructive evaluation of the internal strain of black rubber samples without any preprocessing, which is useful for practical applications.
4. Summary
In this review article, I summarize recent research activities regarding terahertz polarization imaging. Important application examples are high-resolution topography, spatial E-field vector mapping of the focused terahertz beam by an off-axis parabolic mirror, and internal strain mapping of black rubber products. With the aid of the polarization modulation spectroscopy, the speed and precision of the terahertz polarization measurements have been dramatically improved and, therefore, the terahertz polarization imaging can be executed in a reasonable time. I presented a few examples of terahertz polarization imaging that may motivate the reader to perform novel terahertz imaging experiments where the E-field vector or polarization information of the terahertz waves plays a crucial role. In fact, for some applications, such as birefringent imaging, a low-cost incoherent terahertz wave generation and detection system are sufficient, that is, phase-resolved terahertz measurements using THz-TDS are not always imperative. Recently, polarization-sensitive terahertz imaging arrays using semiconductor devices have become feasible [87], which is important to implement the terahertz polarization imaging in industrial applications. I believe that the terahertz polarization imaging will become a useful tool for researchers concerned with fundamental and industrial applications.
Funding
This work was partially supported by JSPS KAKENHI Grant Numbers JP18H02040 and the Japan Science and Technology Agency (JST) under Collaborative Research Based on Industrial Demand “Terahertz-wave: Towards Innovative Development of Terahertz-wave Technologies and Applications.”
Conflicts of Interest
The authors declare no conflict of interest.
References
- Mittleman, D.M. Twenty years of terahertz imaging. Opt. Express 2018, 26, 9417–9431. [Google Scholar] [CrossRef] [PubMed]
- Auston, D.H.; Cheung, K.P.; Smith, P.R. Picosecond photoconducting Hertzian dipoles. Appl. Phys. Lett. 1984, 45, 284–286. [Google Scholar] [CrossRef]
- Auston, D.H.; Cheung, K.P.; Valdmanis, J.A.; Kleinman, D.A. Cherenkov radiation from femtosecond optical pulses in electro-optic media. Phys. Rev. Lett. 1984, 53, 1555–1558. [Google Scholar] [CrossRef]
- Smith, P.R.; Auston, D.H.; Nuss, M.C. Subpicosecond photoconducting dipole antennas. IEEE J. Quantum Electron. 1988, 24, 255–260. [Google Scholar] [CrossRef]
- Mittleman, D.M.; Hunsche, S.; Boivin, L.; Nuss, M.C. T-ray tomography. Opt. Lett. 1997, 22, 904–906. [Google Scholar] [CrossRef] [PubMed]
- Ueno, Y.; Ajito, K. Analytical terahertz spectroscopy. Anal. Sci. 2008, 24, 185–192. [Google Scholar] [CrossRef] [PubMed]
- Mittleman, D.M.; Cunningham, J.; Nuss, M.C.; Geva, M. Noncontact semiconductor wafer characterization with the terahertz Hall effect. Appl. Phys. Lett. 1997, 71, 16–18. [Google Scholar] [CrossRef]
- Nagashima, T.; Hangyo, M. Measurement of complex optical constants of a highly doped Si wafer using terahertz ellipsometry. Appl. Phys. Lett. 2001, 79, 3917–3919. [Google Scholar] [CrossRef]
- Woodward, R.M.; Cole, B.E.; Wallace, V.P.; Pye, R.J.; Arnone, D.D.; Linfield, E.H.; Pepper, M. Terahertz pulse imaging in reflection geometry of human skin cancer and skin tissue. Phys. Med. Biol. 2002, 47, 3853–3863. [Google Scholar] [CrossRef]
- Crawley, D.; Longbottom, C.; Wallace, V.P.; Cole, B.; Arnone, D.; Pepper, M. Three-dimensional terahertz pulse imaging of dental tissue. J. Biomed. Opt. 2003, 8, 303–307. [Google Scholar] [CrossRef]
- Zeitler, J.A.; Shen, Y.C.; Baker, C.; Taday, P.F.; Pepper, M.; Rades, T. Analysis of coating structures and interfaces in solid oral dosage forms by three dimensional terahertz pulsed imaging. J. Pharm. Sci. 2007, 96, 330–340. [Google Scholar] [CrossRef] [PubMed]
- Rutz, F.; Koch, M.; Khare, S.; Moneke, M.; Richter, H.; Ewert, U. Terahertz quality control of polymeric products. Int. J. Infrared Millim. Waves 2006, 27, 547–556. [Google Scholar] [CrossRef]
- Fukunaga, K.; Sekine, N.; Hosako, I.; Oda, N.; Yoneyama, H.; Sudoh, T. Real-time terahertz imaging for art conservation science. J. Eur. Opt. Soc.-Rapid Public 2008, 3, 08027. [Google Scholar] [CrossRef]
- Shen, Y.C.; Lo, T.; Taday, P.F.; Cole, B.E.; Tribe, W.R.; Kemp, M.C. Detection and identification of explosives using terahertz pulsed spectroscopic imaging. Appl. Phys. Lett. 2005, 86, 241116. [Google Scholar] [CrossRef]
- Kawase, K.; Ogawa, Y.; Watanabe, Y.; Inoue, H. Non-destructive terahertz imaging of illicit drugs using spectral fingerprints. Opt. Express 2003, 11, 2549–2554. [Google Scholar] [CrossRef] [PubMed]
- Shimano, R.; Ino, Y.; Svirko, Y.S.; Kuwata-Gonokami, M. Terahertz frequency Hall measurement by magneto-optical Kerr spectroscopy in InAs. Appl. Phys. Lett. 2002, 81, 199–201. [Google Scholar] [CrossRef]
- Iwata, T.; Uemura, H.; Mizutani, Y.; Yasui, T. Double-modulation reflection-type terahertz ellipsometer for measuring the thickness of a thin paint coating. Opt. Express 2014, 22, 20595–20606. [Google Scholar] [CrossRef] [PubMed]
- Aguilar, R.V.; Stier, A.V.; Liu, W.; Bilbro, L.S.; George, D.K.; Bansal, N.; Wu, L.; Cerne, J.; Markelz, A.G.; Oh, S.; et al. Terahertz response and colossal kerr rotation from the surface states of the topological insulator Bi2Se3. Phys. Rev. Lett. 2012, 108, 087403. [Google Scholar] [CrossRef] [PubMed]
- Shimano, R.; Yumoto, G.; Yoo, J.Y.; Matsunaga, R.; Tanabe, S.; Hibino, H.; Morimoto, T.; Aoki, H. Quantum Faraday and Kerr rotations in graphene. Nat. Commun. 2013, 4, 1841. [Google Scholar] [CrossRef] [PubMed] [Green Version]
- Wu, L.; Salehi, M.; Koirala, N.; Moon, J.; Oh, S.; Armitage, N.P. Quantized Faraday and Kerr rotation and axion electrodynamics of a 3D topological insulator. Science 2016, 354, 1124–1127. [Google Scholar] [CrossRef] [PubMed] [Green Version]
- Yumoto, G.; Matsunaga, R.; Hibino, H.; Shimano, R. Ultrafast Terahertz nonlinear optics of landau level transitions in a monolayer graphene. Phys. Rev. Lett. 2018, 120, 107401. [Google Scholar] [CrossRef] [PubMed]
- Arikawa, T.; Zhang, Q.; Ren, L.; Belyanin, A.; Kono, J. Review of anisotropic terahertz material response. J. Infrared Millim. Terahz Waves 2013, 34, 724–739. [Google Scholar] [CrossRef]
- Zhang, L.L.; Zhong, H.; Deng, C.; Zhang, C.L.; Zhao, Y.J. Polarization sensitive terahertz time-domain spectroscopy for birefringent materials. Appl. Phys. Lett. 2009, 94, 211106. [Google Scholar] [CrossRef]
- Katletz, S.; Pfleger, M.; Pühringer, H.; Mikulics, M.; Vieweg, N.; Peters, O.; Scherger, B.; Scheller, M.; Koch, M.; Wiesauer, K. Polarization sensitive terahertz imaging: Detection of birefringence and optical axis. Opt. Express 2012, 20, 23025–23035. [Google Scholar] [CrossRef] [PubMed]
- Van der Valk, N.C.J.; Van der Marel, W.A.M.; Planken, P.C.M. Terahertz polarization imaging. Opt. Lett. 2005, 30, 2802–2804. [Google Scholar] [CrossRef] [PubMed]
- Zhang, R.; Cui, Y.; Sun, W.F.; Zhang, Y. Polarization information for terahertz imaging. Appl. Opt. 2008, 47, 6422–6427. [Google Scholar] [CrossRef] [PubMed]
- Zhang, L.L.; Zhong, H.; Deng, C.; Zhang, C.L.; Zhao, Y.J. Terahertz polarization imaging with birefringent materials. Opt. Commun. 2010, 283, 4993–4995. [Google Scholar] [CrossRef]
- Wang, X.K.; Cui, Y.; Sun, W.F.; Ye, J.S.; Zhang, Y. Terahertz polarization real-time imaging based on balanced electro-optic detection. J. Opt. Soc. Am. A 2010, 27, 2387–2393. [Google Scholar] [CrossRef]
- Zhang, L.L.; Zhong, H.; Deng, C.; Zhang, C.L.; Zhao, Y.J. THz wave polarization-controlled spectroscopic imaging for anisotropic materials. Opt. Commun. 2011, 284, 4356–4359. [Google Scholar] [CrossRef]
- Zhou, Y.; Li, Q. Dual-axis reflective continuous-wave terahertz confocal scanning polarization imaging and image fusion. Opt. Eng. 2017, 56, 013103. [Google Scholar] [CrossRef]
- Földesy, P. Current steering detection scheme of three terminal antenna-coupled terahertz field effect transistor detectors. Opt. Lett. 2013, 38, 2804–2806. [Google Scholar] [CrossRef] [PubMed]
- Doradla, P.; Alavi, K.; Joseph, C.S.; Giles, R.H. In Detection of colon cancer by continuous-wave terahertz polarization imaging technique. J. Biomed. Opt. 2013, 18, 090504. [Google Scholar] [CrossRef]
- Jenkins, G.S.; Schmadel, D.C.; Drew, H.D. Simultaneous measurement of circular dichroism and Faraday rotation at terahertz frequencies utilizing electric field sensitive detection via polarization modulation. Rev. Sci. Instrum. 2010, 81, 083903–083910. [Google Scholar] [CrossRef] [PubMed]
- Morris, C.M.; Aguilar, R.V.; Stier, A.V.; Armitage, N.P. Polarization modulation time-domain terahertz polarimetry. Opt. Express 2012, 20, 12303–12317. [Google Scholar] [CrossRef] [PubMed]
- Huang, Z.; Park, H.; Parrott, E.P.J.; Chan, H.P.; Pickwell-MacPherson, E. Robust Thin-Film Wire-Grid THz Polarizer Fabricated Via a Low-Cost Approach. IEEE Photonics Technol. Lett. 2013, 25, 81–84. [Google Scholar] [CrossRef]
- George, D.K.; Stier, A.V.; Ellis, C.T.; McCombe, B.D.; Černe, J.; Markelz, A.G. Terahertz magneto-optical polarization modulation spectroscopy. J. Opt. Soc. Am. B 2012, 29, 1406–1412. [Google Scholar] [CrossRef]
- Aschaffenburg, D.J.; Williams, M.R.C.; Talbayev, D.; Santavicca, D.F.; Prober, D.E.; Schmuttenmaer, C.A. Efficient measurement of broadband terahertz optical activity. Appl. Phys. Lett. 2012, 100, 241114. [Google Scholar] [CrossRef] [Green Version]
- Okano, M.; Watanabe, S. Anisotropic optical response of optically opaque elastomers with conductive fillers as revealed by terahertz polarization spectroscopy. Sci. Rep. 2016, 6, 39079. [Google Scholar] [CrossRef] [Green Version]
- Dong, H.; Gong, Y.D.; Paulose, V.; Hong, M.H. Polarization state and Mueller matrix measurements in terahertz-time domain spectroscopy. Opt. Commun. 2009, 282, 3671–3675. [Google Scholar] [CrossRef]
- Singh, R.; George, D.K.; Bae, C.J.; Niessen, K.A.; Markelz, A.G. Modulated orientation-sensitive terahertz spectroscopy. Photonics Res. 2016, 4, A1–A8. [Google Scholar] [CrossRef]
- Jepsen, P.U.; Winnewisser, C.; Schall, M.; Schyja, V.; Keiding, S.R.; Helm, H. Detection of THz pulses by phase retardation in lithium tantalate. Phys. Rev. E 1996, 53, R3052. [Google Scholar] [CrossRef]
- Wu, Q.; Zhang, X.C. Ultrafast electro-optic field sensors. Appl. Phys. Lett. 1996, 68, 1604–1606. [Google Scholar] [CrossRef]
- Nahata, A.; Auston, D.H.; Heinz, T.F.; Wu, C.J. Coherent detection of freely propagating terahertz radiation by electro-optic sampling. Appl. Phys. Lett. 1996, 68, 150–152. [Google Scholar] [CrossRef]
- Wu, Q.; Zhang, X.C. Free-space electro-optic sampling of terahertz beams. Appl. Phys. Lett. 1995, 67, 3523–3525. [Google Scholar] [CrossRef]
- Leitenstorfer, A.; Hunsche, S.; Shah, J.; Nuss, M.C.; Knox, W.H. Detectors and sources for ultrabroadband electro-optic sampling: Experiment and theory. Appl. Phys. Lett. 1999, 74, 1516–1518. [Google Scholar] [CrossRef]
- Bakker, H.J.; Cho, G.C.; Kurz, H.; Wu, Q.; Zhang, X.C. Distortion of terahertz pulses in electro-optic sampling. J. Opt. Soc. Am. B 1998, 15, 1795–1801. [Google Scholar] [CrossRef]
- Gallot, G.; Grischkowsky, D. Electro-optic detection of terahertz radiation. J. Opt. Soc. Am. B 1999, 16, 1204–1212. [Google Scholar] [CrossRef]
- Planken, P.C.M.; Nienhuys, H.-K.; Bakker, H.J.; Wenckebach, T. Measurement and calculation of the orientation dependence of terahertz pulse detection in ZnTe. J. Opt. Soc. Am. B. 2001, 18, 313–317. [Google Scholar] [CrossRef]
- Van der Valk, N.C.J.; Wenckebach, T.; Planken, P.C.M. Full mathematical description of electro-optic detection in optically isotropic crystals. J. Opt. Soc. Am. B. 2004, 21, 622–631. [Google Scholar] [CrossRef]
- Yasumatsu, N.; Watanabe, S. Precise real-time polarization measurement of terahertz electromagnetic waves by a spinning electro-optic sensor. Rev. Sci. Instrum. 2012, 83, 023104. [Google Scholar] [CrossRef]
- Nemoto, N.; Higuchi, T.; Kanda, N.; Konishi, K.; Kuwata-Gonokami, M. Highly precise and accurate terahertz polarization measurements based on electro-optic sampling with polarization modulation of probe pulses. Opt. Express 2014, 22, 17915–17929. [Google Scholar] [CrossRef] [PubMed]
- Yasumatsu, N.; Kasatani, A.; Oguchi, K.; Watanabe, S. High-speed terahertz time-domain polarimeter based on an electro-optic modulation technique. Appl. Phys. Express 2014, 7, 092401. [Google Scholar] [CrossRef] [Green Version]
- Oguchi, K.; Okano, M.; Watanabe, S. Retrieving the undistorted terahertz time-domain electric-field vector from the electro-optic effect. J. Opt. Soc. Am. B 2017, 34, 1946–1956. [Google Scholar] [CrossRef]
- Castro-Camus, E.; Lloyd-Hughes, J.; Johnston, M.B.; Fraser, M.D.; Tan, H.H.; Jagadish, C. Polarization-sensitive terahertz detection by multicontact photoconductive receivers. Appl. Phys. Lett. 2005, 86, 254102. [Google Scholar] [CrossRef] [Green Version]
- Castro-Camus, E.; Lloyd-Hughes, J.; Fu, L.; Tan, H.H.; Jagadish, C.; Johnston, M.B. An ion-implanted InP receiver for polarization resolved terahertz spectroscopy. Opt. Express 2007, 15, 7047–7057. [Google Scholar] [CrossRef] [PubMed]
- Makabe, H.; Hirota, Y.; Tani, M.; Hangyo, M. Polarization state measurement of terahertz electromagnetic radiation by three-contact photoconductive antenna. Opt. Express 2007, 15, 11650–11657. [Google Scholar] [CrossRef] [PubMed]
- Niehues, G.; Funkner, S.; Bulgarevich, D.S.; Tsuzuki, S.; Furuya, T.; Yamamoto, K.; Shiwa, M.; Tani, M. A matter of symmetry: Terahertz polarization detection properties of a multi-contact photoconductive antenna evaluated by a response matrix analysis. Opt. Express 2015, 23, 16184–16195. [Google Scholar] [CrossRef] [PubMed]
- Hussain, A.; Andrews, S.R. Ultrabroadband polarization analysis of terahertz pulses. Opt. Express 2008, 16, 7251–7257. [Google Scholar] [CrossRef] [PubMed]
- Karpowicz, N.; Dai, J.M.; Lu, X.F.; Chen, Y.Q.; Yamaguchi, M.; Zhao, H.W.; Zhang, X.C.; Zhang, L.L.; Zhang, C.L.; Price-Gallagher, M.; et al. Coherent heterodyne time-domain spectrometry covering the entire “terahertz gap”. Appl. Phys. Lett. 2008, 92, 011131. [Google Scholar] [CrossRef]
- Lü, Z.H.; Zhang, D.W.; Meng, C.; Sun, L.; Zhou, Z.Y.; Zhao, Z.X.; Yuan, J.M. Polarization-sensitive air-biased-coherent-detection for terahertz wave. Appl. Phys. Lett. 2012, 101, 081119. [Google Scholar] [CrossRef]
- Zhang, J. Polarization-dependent study of THz air-biased coherent detection. Opt. Lett. 2014, 39, 4096–4099. [Google Scholar] [CrossRef] [PubMed]
- Takai, M.; Takeda, M.; Sasaki, M.; Tachizaki, T.; Yasumatsu, N.; Watanabe, S. Video-rate terahertz electric-field vector imaging. Appl. Phys. Lett. 2014, 105, 151103. [Google Scholar] [CrossRef]
- Keiber, S.; Sederberg, S.; Schwarz, A.; Trubetskov, M.; Pervak, V.; Krausz, F.; Karpowicz, N. Electro-optic sampling of near-infrared waveforms. Nat. Photonics 2016, 10, 159–163. [Google Scholar] [CrossRef]
- Ashida, M. Ultra-Broadband Terahertz Wave Detection Using Photoconductive Antenna. Jpn. J. Appl. Phys. 2008, 47, 8221–8225. [Google Scholar] [CrossRef]
- Ashida, M.; Matsubara, E.; Katayama, I. Ultra-Broadband IR and THz Generation and Detection With Ultrashort Pulses. Available online: https://www.spiedigitallibrary.org/conference-proceedings-of-spie/8964/896409/Ultra-broadband-IR-and-THz-generation-and-detection-with-ultrashort/10.1117/12.2042829.short?SSO=1 (accessed on 11 December 2018).
- Yasumatsu, N.; Watanabe, S. T-ray topography by time-domain polarimetry. Opt. Lett. 2012, 37, 2706–2708. [Google Scholar] [CrossRef] [PubMed]
- Takayanagi, J.; Jinno, H.; Ichino, S.; Suizu, K.; Yamashita, M.; Ouchi, T.; Kasai, S.; Ohtake, H.; Uchida, H.; Nishizawa, N.; et al. High-resolution time-of-flight terahertz tomography using a femtosecond fiber laser. Opt. Express 2009, 17, 7533–7539. [Google Scholar] [CrossRef]
- Yasumatsu, N.; Watanabe, S. IEEE Terahertz profilometer by time-domain polarimetry. In Proceedings of the 2012 Conference on Lasers and Electro-Optics, San Jose, CA, USA, 6–11 May 2012. [Google Scholar]
- Shibata, K.; Takai, M.; Uemoto, M.; Watanabe, S. Intrinsic formation of electromagnetic divergence and rotation by parabolic focusing. Phys. Rev. A 2015, 92, 053806. [Google Scholar] [CrossRef]
- Takai, M.; Shibata, K.; Uemoto, M.; Watanabe, S. Spatial polarization variation in terahertz electromagnetic wave focused by off-axis parabolic mirror. Appl. Phys. Express 2016, 9, 052206. [Google Scholar] [CrossRef] [Green Version]
- Hebling, J.; Almási, G.; Kozma, I.; Kuhl, J. Velocity matching by pulse front tilting for large area THz-pulse generation. Opt. Express 2002, 10, 1161–1166. [Google Scholar] [CrossRef]
- Watanabe, S.; Minami, N.; Shimano, R. Intense terahertz pulse induced exciton generation in carbon nanotubes. Opt. Express 2011, 19, 1528–1538. [Google Scholar] [CrossRef]
- Wiesauer, K.; Jördens, C. Recent Advances in birefringence studies at THz frequencies. J. Infrared Millim. Terahertz Waves 2013, 34, 663–681. [Google Scholar] [CrossRef]
- Rutz, F.; Hasek, T.; Koch, M.; Richter, H.; Ewert, U. Terahertz birefringence of liquid crystal polymers. Appl. Phys. Lett. 2006, 89, 221911. [Google Scholar] [CrossRef]
- Reid, M.; Fedosejevs, R. Terahertz birefringence and attenuation properties of wood and paper. Appl. Opt. 2006, 45, 2766–2772. [Google Scholar] [CrossRef] [PubMed]
- Tanabe, T.; Watanabe, K.; Oyama, Y.; Seo, K. Polarization sensitive THz absorption spectroscopy for the evaluation of uniaxially deformed ultra-high molecular weight polyethylene. NDT E Int. 2010, 43, 329–333. [Google Scholar] [CrossRef]
- Fuse, N.; Sato, R.; Mizuno, M.; Fukunaga, K.; Itoh, K.; Ohki, Y. Observation and analysis of molecular vibration modes in polylactide at terahertz frequencies. Jpn. J. Appl. Phys. 2010, 49, 102402. [Google Scholar] [CrossRef]
- Hoshina, H.; Morisawa, Y.; Sato, H.; Minamide, H.; Noda, I.; Ozaki, Y.; Otani, C. Polarization and temperature dependent spectra of poly(3-hydroxyalkanoate)s measured at terahertz frequencies. Phys. Chem. Chem. Phys. 2011, 13, 9173–9179. [Google Scholar] [CrossRef]
- Iwasaki, H.; Nakamura, M.; Komatsubara, N.; Okano, M.; Nakasako, M.; Sato, H.; Watanabe, S. Controlled terahertz birefringence in stretched poly(lactic acid) films investigated by terahertz time-domain spectroscopy and wide-angle X-ray scattering. J. Phys. Chem. B 2017, 121, 6951–6957. [Google Scholar] [CrossRef]
- Komatsu, M.; Mizuno, M.; Saito, S.; Fukunaga, K.; Ohki, Y. Terahertz spectral change associated with glass transition of poly-epsilon-caprolactone. J. Appl. Phys. 2015, 117, 133102. [Google Scholar] [CrossRef]
- Pfleger, M.; Roitner, H.; Pühringer, H.; Wiesauer, K.; Grün, H.; Katletz, S. Advanced birefringence measurements in standard terahertz time-domain spectroscopy. Appl. Opt. 2014, 53, 3183–3190. [Google Scholar] [CrossRef]
- Pfleger, M.; Pühringer, H.; Katletz, S. IEEE Terahertz-elasticity measurements on elastomers. In Proceedings of the 2014 39th International Conference on Infrared, Millimeter, and Terahertz Waves, Tucson, AZ, USA, 14–19 September 2014. [Google Scholar]
- Moriwaki, A.; Okano, M.; Watanabe, S. Internal triaxial strain imaging of visibly opaque black rubbers with terahertz polarization spectroscopy. APL Photonics 2017, 2, 106101. [Google Scholar] [CrossRef] [Green Version]
- Okano, M.; Fujii, M.; Watanabe, S. Anisotropic percolation conduction in elastomer-carbon black composites investigated by polarization-sensitive terahertz time-domain spectroscopy. Appl. Phys. Lett. 2017, 111, 221902. [Google Scholar] [CrossRef]
- Okano, M.; Watanabe, S. Internal status of visibly opaque black rubbers investigated by terahertz polarization spectroscopy: Fundamentals and applications. Unpublished work. 2018. [Google Scholar]
- Dorney, T.D.; Baraniuk, R.G.; Mittleman, D.M. Material parameter estimation with terahertz time-domain spectroscopy. J. Opt. Soc. Am. A 2001, 18, 1562–1571. [Google Scholar] [CrossRef]
- Li, Z.; Qi, B.K.; Zhang, X.H.; Zeinolabedinzadeh, S.; Sang, L.; Cressler, J.D. A 0.32-THz SiGe Imaging Array With Polarization Diversity. IEEE Trans. Terahertz Sci. Technol. 2018, 8, 215–223. [Google Scholar] [CrossRef]
Figure 1.
Schematic of the T-ray topography which utilizes the polarization information of the terahertz waves. “S” represents the sample and “D” represents the spinning EO sensor to detect the magnitude and direction of the terahertz E-field. (Reprinted with permission from reference [66], Optical Society of America.)

Figure 2.
(a) Photograph of the sample. The numbers indicate the relative heights at the three positions marked with the dots; (b) topographic map as measured by the PS THz-TDS system developed for the T-ray topography; (c) cross-section of the topography data along the white line in (b). (Reprinted with permission from reference [66], Optical Society of America.).

Figure 3.
Stability of the extracted polarization direction when using the spinning EO sensor method. (a) Time chart of the intentionally modulated magnitude of the terahertz E-field (normalized by the maximum value); (b) Time chart of the measured angle of the E-field vector, , relative to its mean value . (Reprinted from reference [50] with the permission of AIP Publishing.).

Figure 4.
Experimental setup of the terahertz E-field vector imaging system. (Adapted from reference [62] with the permission of AIP Publishing.)
Figure 4.
Experimental setup of the terahertz E-field vector imaging system. (Adapted from reference [62] with the permission of AIP Publishing.)

Figure 5.
(a) Temporal waveform of the terahertz pulse at the focus for the 0.75 THz component. (b–e) Experimental results of the spatial distribution of the terahertz E-field vector at different times. For easy comparison, the lengths of the arrows in (c,e) are magnified by a factor of 2.5. (Adapted from reference [70]. Copyright (2016), Applied Physics Express.).

Figure 6.
Spatial mapping of (a) the degree of birefringence and (b) the angle of the slow optic axis of a stretched black rubber sample. The draw ratio is 1.36. (Reprinted from reference [83] used in accordance with the Creative Commons Attribution (CC BY) license.).
Figure 6.
Spatial mapping of (a) the degree of birefringence and (b) the angle of the slow optic axis of a stretched black rubber sample. The draw ratio is 1.36. (Reprinted from reference [83] used in accordance with the Creative Commons Attribution (CC BY) license.).

Figure 7.
Spatial mapping of the four components of the strain tensor of a stretched black rubber sample evaluated by the PS THz-TDS measurements. (a) Strain tensor component ; (b) ; (c) ; and (d) . The draw ratio is 1.36. (Reprinted from reference [83] used in accordance with the Creative Commons Attribution (CC BY) license.).

© 2018 by the author. Licensee MDPI, Basel, Switzerland. This article is an open access article distributed under the terms and conditions of the Creative Commons Attribution (CC BY) license (http://creativecommons.org/licenses/by/4.0/).
Share and Cite
MDPI and ACS Style
Watanabe, S. Terahertz Polarization Imaging and Its Applications. Photonics 2018, 5, 58. https://doi.org/10.3390/photonics5040058
AMA Style
Watanabe S. Terahertz Polarization Imaging and Its Applications. Photonics. 2018; 5(4):58. https://doi.org/10.3390/photonics5040058
Chicago/Turabian StyleWatanabe, Shinichi. 2018. "Terahertz Polarization Imaging and Its Applications" Photonics 5, no. 4: 58. https://doi.org/10.3390/photonics5040058
Note that from the first issue of 2016, this journal uses article numbers instead of page numbers. See further details here.