Development of Ultrashort Pulse Lasers for Ultrafast Spectroscopy

1
Advanced Ultrafast Laser Research Center and Brain Science Inspired Life Support Research Center, University of Electro-Communications, 1-5-1 Chofugaoka, Chofu, Tokyo 182-8585, Japan
2
Department of Electrophysics, National Chiao-Tung University, 1001 Ta Hsinchu Rd., Hsinchu 300, Taiwan
3
Research Center for Water Frontier Science and Technology, Tokyo University of Science, Kagurazaka 1-3, Shinjuku-ku, Tokyo 162-8601, Japan
Photonics 2018, 5(3), 19; https://doi.org/10.3390/photonics5030019
Submission received: 21 May 2018
/
Revised: 25 June 2018
/
Accepted: 11 July 2018
/
Published: 20 July 2018
Abstract
:Principles and information obtained by ultrafast spectroscopy and scheme of optical parametric amplifier are discussed. Realization of ultrashort visible and ultraviolet lasers based on the parametric processes are discussed.
1. Introduction
Curiosity is a driving force of science development. Humans have been motivated to investigate microscopic structures of materials even from the ancient Greek era in terms of the “atom”. This motivation is a driving force to open the frontier in science even now. Together with the interest in the elementary particles in the ultimate size, the molecular systems are of interest from the viewpoint of material properties that are sensed by human eyes and other sensing organs in everyday life. The material properties are determined by the static properties and dynamics of electrons in the outmost orbital in an atom. To understand these, it is necessary to investigate the motion of the outmost electrons whose fastest processes are in the femtosecond range of which the Fourier transform is in the near ultraviolet (UV), visible, and near infrared (NIR) ranges. The femtosecond dynamics study using ultrashort optical pulses can provide the most direct information of the electronic states.
In the last two decades, development of the mode-locked femtosecond laser has enabled the observation of ultrafast dynamics to elucidate the ultrafast processes in molecules and various condensed-phase materials, opening a new research field of femtoscience [1]. To disclose the processes in nanomaterials and molecular systems where elementary processes are taking place with ultrahigh speed, it is necessary to time-resolve the processes with high temporal resolution. The primary processes in electronic relaxations in molecules and solid-state materials like metals and semiconductors are in the range of femtosecond. Nuclear motion associated with molecular vibration and lattice vibration in the optical phonon branch are in the femtosecond and subpicosecond-picosecond regime, respectively. The most direct method to study such processes is to use pump/probe-type spectroscopy using pump and probe pulses with femtosecond duration. Efficient photochemical reaction competing with electronic relaxation can also take place in the subpicosecond range. Hence, to observe the processes directly, it is required to utilize a short enough pulse. To fulfil this requirement, we have been developing various techniques to generate ultrashort pulses in the NIR-visible and UV-DUV (deep UV) spectral ranges as described in this compact review article. An intense FT (Fourier transform) limited pulse in these wavelengths triggers the excitation of electrons in the outmost molecular orbital in most of organic aromatic molecules and interband transition in semiconductors. Another FT limited pulse probes the change induced by the pump. A chirped pulse instead of a FT limited pulse can be used by using a multi-channel broad spectral range, to be discussed later in the present paper, utilizing simultaneous resolution of time and spectrum.
This paper is organized as follows. The explanation of the importance of the ultrashort pulse is described in Section 1. Section 2 briefly introduces the development of the ultrashort pulse laser as a tool for studying ultrafast processes. In Section 3, electronic relaxation and vibrational dynamics which are the principle information obtained by ultrafast spectroscopy, are described. In Section 4, principles and advantages of broad-band time-resolved spectroscopy that can provide both electronic relaxation and vibrational dynamics are explained. In the following Section 5 and Section 6, ultrashort visible pulse laser and ultrashort ultraviolet (UV) laser, respectively, both based on parametric processes, are discussed. Finally, concluding remarks are made in Section 7.
2. Light Sources for Studying Ultrafast Processes
To study the mechanism of fast chemical reactions, flash photolysis was developed by R. G. W. Norrish and G. Porter, who were awarded the Nobel Prize in Chemistry in 1967 [2]. By flash photolysis, the time-resolution is limited by the flash duration, which is in the order of a few nanoseconds at best. Development of the mode-locking method has enabled to generate an ultrashort laser pulse much shorter than 1 ns. Among various mode-locked lasers operated by several mechanisms, a self-mode locked Ti:sapphire laser can generate an ultrashort pulse stably and has been used most widely. It generates visible-NIR pulse with wavelength range around 800 nm. The Ti:sapphire laser system can generate an ultrashort visible-NIR pulse with sub-10 fs width or its second harmonics (SH), which can have sub-20 fs duration. Ultrafast dynamics of the various chemical reactions and carrier dynamics in condensed matter like semiconductors have been studied using the ultrashort visible-NIR pulse or its SH. Elucidation of ultrafast dynamics in various systems accelerates development in various applications like photosensors [3,4,5], ultrafast optical switches [6,7,8], and ultrafast optical memories [9,10,11]. Many interesting ultrafast dynamics in biological systems including photosynthesis [12,13,14] and vision processes [15,16,17], were studied by ultrafast spectroscopy using the visible or UV pulse lasers. In these experiments, sometimes the intensities of the generated pulses are not stable due to the various nonlinearities in the generation process. Due to instability-induced intensity noise, the results do not have enough signal to noise ratio (S/N), which is desired to be improved to discuss detailed mechanism of the ultrafast processes of interest. Therefore, it is quite important to develop an ultrashort visible pulse laser whose intensity is high and stable enough to be used as a light source for time-resolved spectroscopy of visible and UV photo-induced dynamics.
To extend the available ultrashort laser wavelength and to obtain even shorter pulse, several nonlinear optical (NLO) processes of the second order and the third order are frequently utilized. The examples of the second-order NLO processes are the second-harmonic generation (SHG) and optical parametric amplification (OPA). The examples of the third-order process are third harmonic generation and parametric four-wave mixing. For the time-resolved spectroscopic measurement, various NLO processes such as optical gating by optical Kerr effect are utilized.
3. Electronic Relaxation and Vibrational Dynamics
Thanks to the high time resolution of ultrafast spectroscopy, it is possible to time-resolve not only ultrafast electronic relaxation among different electronic states including some chemical reaction but also vibration dynamics in real time. The meaning of real-time here is that the time-course of vibration amplitude can be visualized in the time domain. One of the typical molecular vibration modes, i.e., the C-C double bond stretching, has an oscillation period of about 20 fs. Therefore, the transient absorption (TA) signal measured by the ultrashort pulsed laser can reflect both the electronic relaxation and vibrational dynamics, temporally resolving the nuclear motion in the molecular vibrations. A pulse duration as short as sub10 fs is short enough to impulsively excite almost all molecular vibration modes in organic molecules except some OH and CH stretching modes with vibration periods shorter than 10 fs. Even though these high-frequency stretching modes cannot be fully resolved, they are in the range of detection with reduced amplitudes by the ratio factor of about (pulse duration time)/(vibration period). Compared with other methods, such as time-resolved vibration spectroscopy in the frequency domain including time-resolved Raman scattering and IR absorption spectroscopies, TA spectroscopy by ultrashort pulse has the advantage that it is possible to obtain vibrational phases and to study the electronic dynamics and vibrational dynamics simultaneously in the same experimental condition. Taking advantage of this method, it is possible to elucidate ultrafast dynamics in various photo-induced dynamic processes. Both sub-5fs visible-near infrared (VIS-NIR) pulse and sub-10fs deep UV (DUV) pulse are developed as discussed later and it has become possible to study ultrafast dynamics in various materials.
4. Principles and Advantages of Broad-Band Ultrafast Spectroscopy
The ultrafast signal change in the femtosecond region can be measured by the pump-probe method using the ultrashort femtosecond pulse. Spectroscopic data are discussed in terms of ultrafast TA signal in the extended spectral range, which contains contributions from various mechanisms depending on the probed wavelength. Quantitative analysis of TA is made by difference absorbance change defined by ΔA(ω) = log[In(ω)/Iw(ω)]. Here, In(ω) and Iw(ω) are the transmitted probe light intensity without and with excitation, respectively, at the probe photon angular frequency ω. ΔA(ω) can be positive or negative depending on the phenomenon triggered by the pump. Positive values correspond to photoexcitation induced absorption (IA) due to transient absorption from the excited state to higher state or due to some (photo) chemical species created by the pump pulse. Positive values are induced by the stimulated emission (SE) from the excited state to the ground state or by the ground-state bleaching (GSB) due to depletion of the ground state, which are mixed together in the measured spectral range. They are difficult to be identified from the measurement at a single probe wavelength. The probe wavelength dependence can be studied in principle by repeating the pump-probe measurement at each probe wavelength. However, it takes a long time to cover the spectral region of interest, and the conditions of sample and pump and probe pulses for each wavelength measurement may not be maintained during the long time measurement.
Therefore, it is desirable to obtain broad band spectral information at one time because of the long measurement time and systematic errors introduced by fluctuation of the ultrashort pulse in the case of one-by-one wavelength measurement by single point detection using a photomultiplier or photodiode. We have developed two detection schemes: the multi-channel lock-in detector [18] and the diode array detection system [19,20].
The broadband probe spectra of femtosecond pulse and white light continuum are of great advantage for spectroscopy. The broadband spectroscopic data provide invaluable information of the species appearing in the time-resolved data. For example, they enable discrimination of the congested spectrum and separate the signal into IA, SE, and GSB from the wavelength dependent dynamics of the ultrafast TA signal [18,19,20].
To study the electronic relaxation and vibrational dynamics simultaneously, the transient absorption (TA) signal should be measured with fine delay step (to resolve molecular vibration dynamics) and broad delay region (to observed electronic relaxation). Typically, the measurement of broad-band time-resolved spectrum takes about one hour to a few ten minutes. Then, in some cases, especially in biological samples, photo-damage effects may be accumulated in the samples, even in a single-scan time scale. Also, it has been hard to perform the TA spectroscopy using ultrashort pulse that cannot maintain stability enough to guarantee the reliability of electronic relaxation dynamics information. This is because the gradual intensity change of the laser may distort the slow electronic dynamics, which can take place in the delay-stage scanning time similar to the time of laser intensity change, even if all controllable environmental conditions are carefully adjusted for about one hour to maintain stability of the ultrashort pulse. This is because of the unavoidable changes in the intensity of pump and probe pulses obtained by many nonlinear processes. Then, the time-trace data thus obtained may suffer from artifacts in the electronic relaxation dynamics. To overcome this difficulty, we have developed a fast-scan femtosecond time-resolved broad-band spectroscopy system, which can complete the full-trace scan measurement more than 100 times faster than the previous method. Intensity changes of pump and probe pulses during such a short scan are more than an order of magnitude reduced. Therefore, scan trace can be averaged without the artefacts. The details of this system are described elsewhere [19,20].
The result of TA spectroscopy shows the probe wavelength dependence reflecting the contributions from the ground state depletion, the excited states, and intermediates. In case of single wavelength measurement, their lifetimes are hard to be evaluated at the wavelength where the fractional signal intensity of the corresponding species may be too small due to the overlap of other contributions. Thus, it is necessary to analyze the TA spectroscopy data obtained simultaneously at all probe wavelengths. Global fitting analysis—for example, [21]—is one of the solutions. However, the global fitting analysis cannot be used when the lifetime itself is dependent on probe wavelength. We have introduced another method of two-dimensional correlation spectroscopy, which is described elsewhere [22].
Various nonlinear optical (NLO) phenomena are involved not only in the generation and characterization of ultrashort pulse but also in the ultrafast spectroscopy measurement. In the following section, how NLO processes are utilized is described in some detail.
5. Ultrashort Visible Pulse Generation Based on Non-Linear Optical Parametric Amplifier (NOPA)
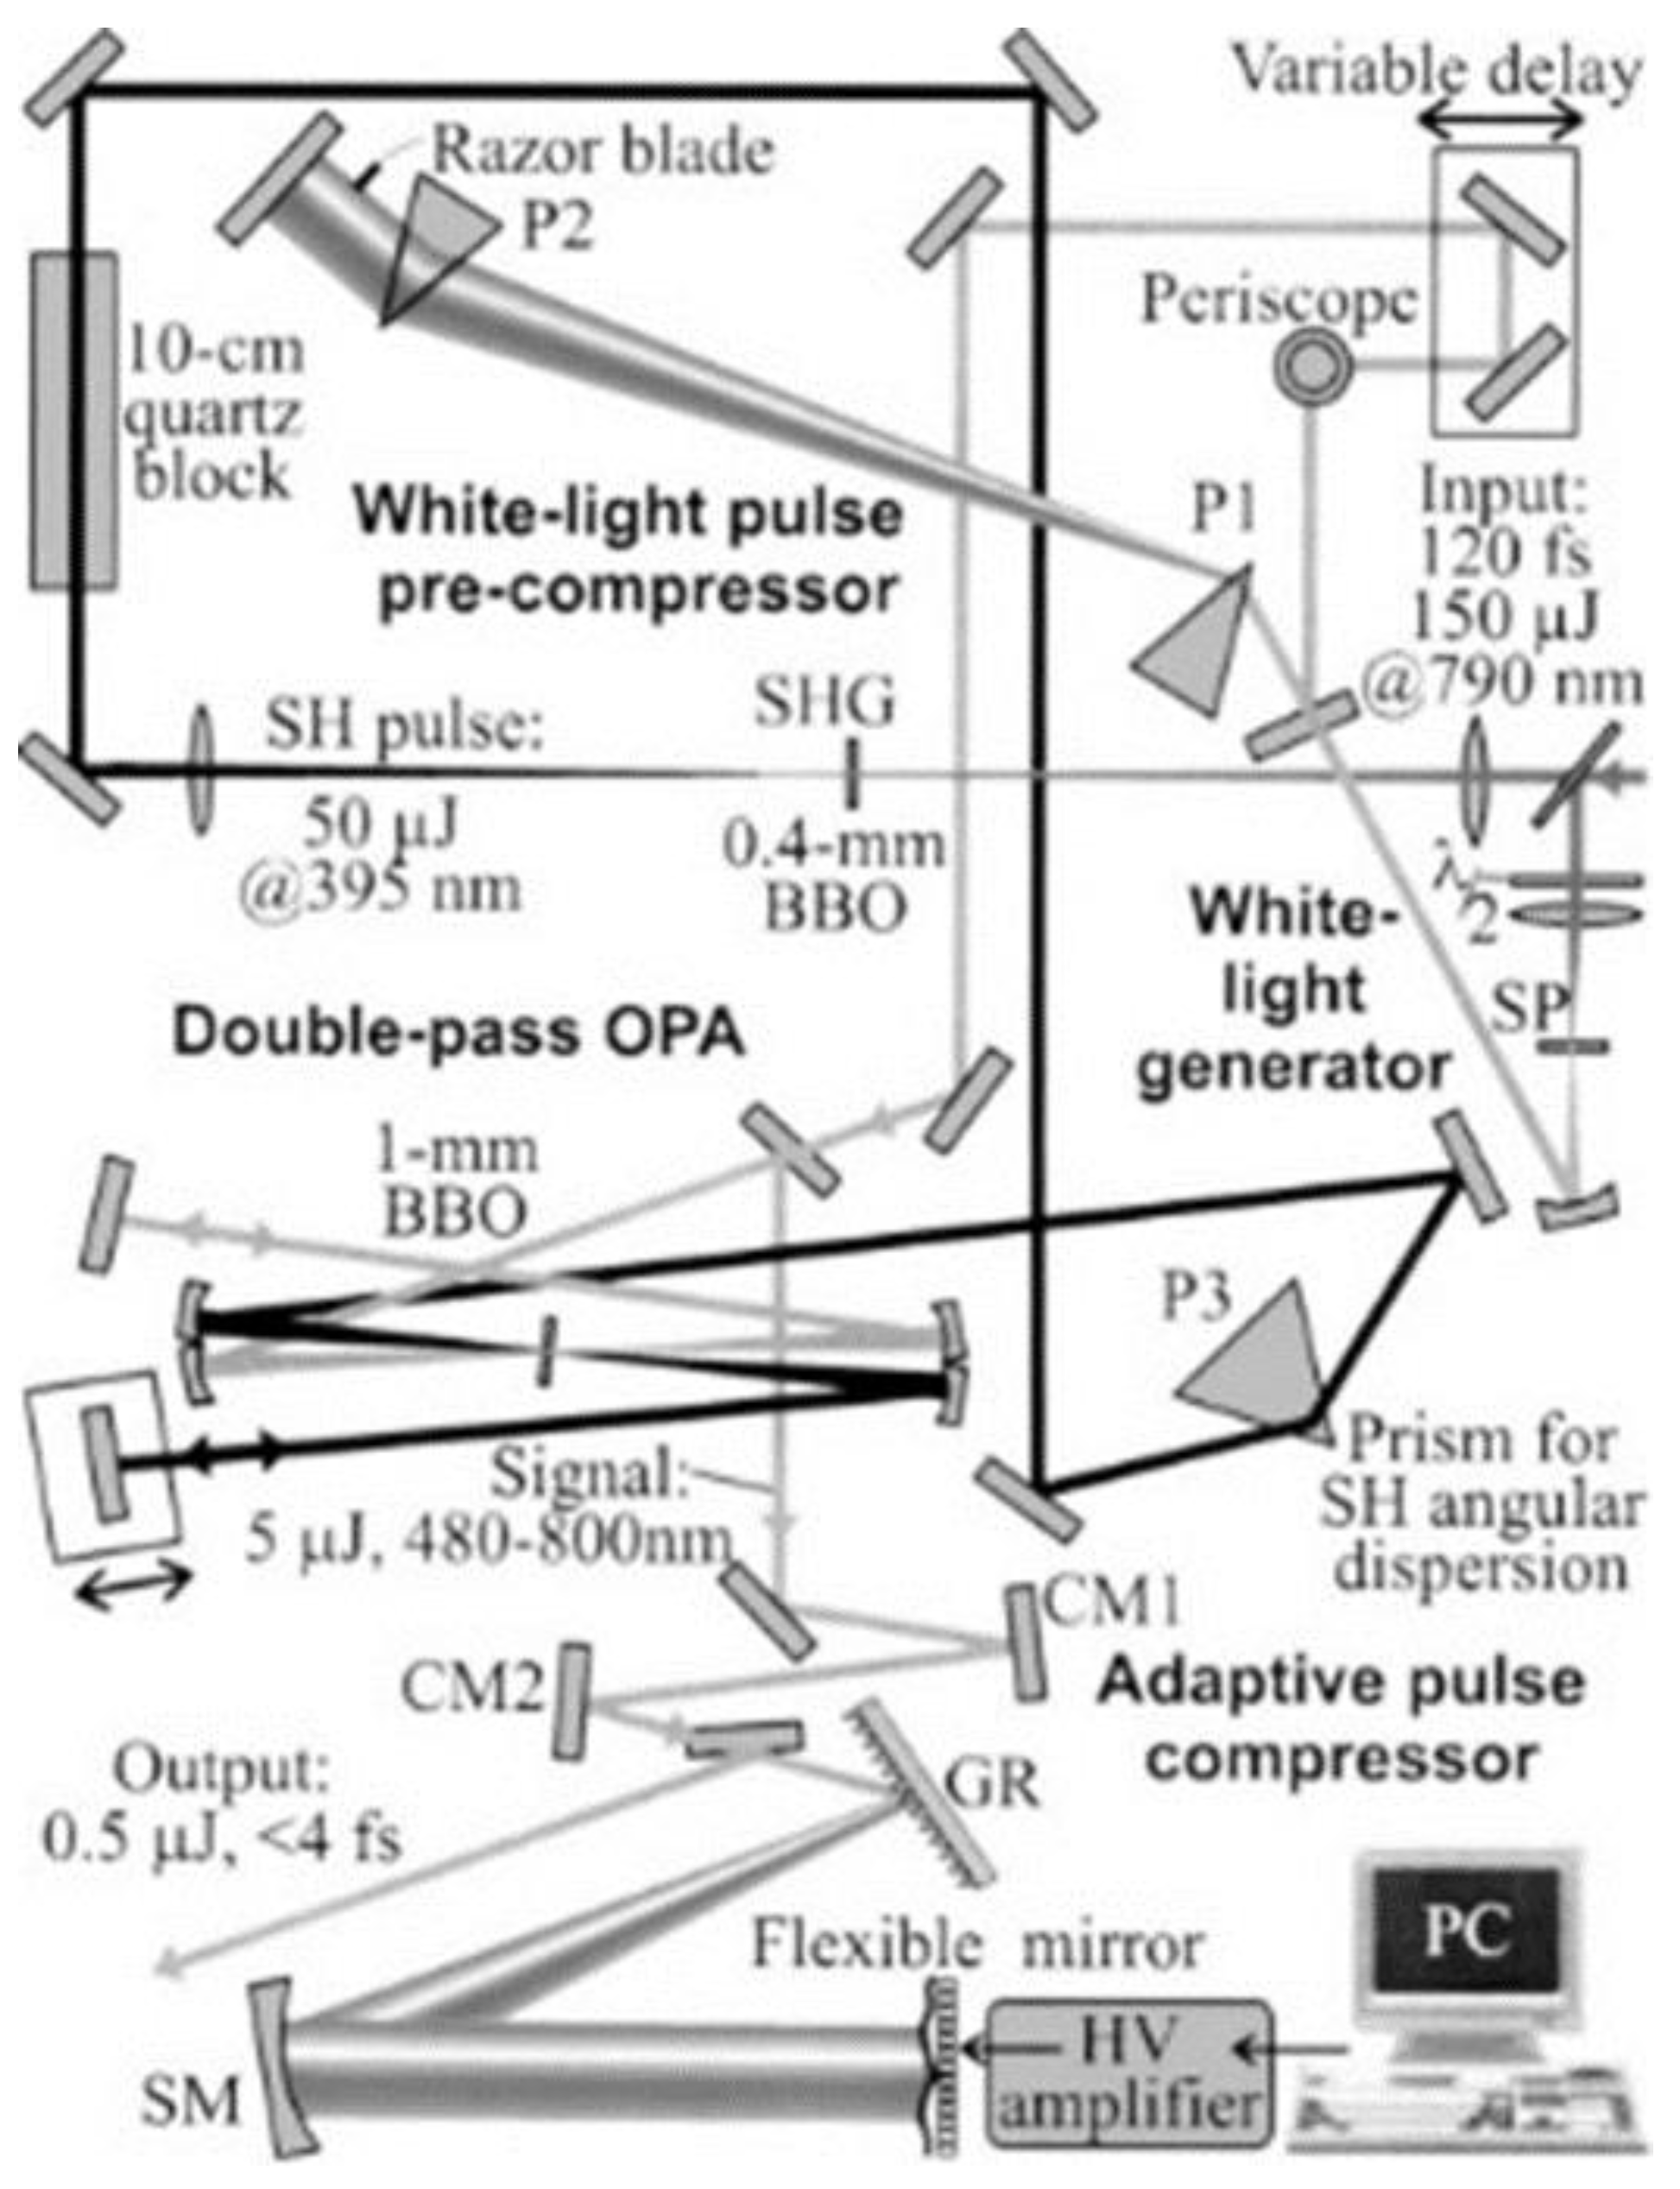
Our group and other groups developed a broadband ultrashort pulse with spectral range covering 520–720 nm achieving sub 10 fs pulse duration by the optical parametric amplifier (OPA) process in noncollinear configuration [23,24,25,26,27,28,29]. The scheme of the noncollinear optical parametric amplifier (NOPA) is illustrated in Figure 1.
The linear polarization of the NIR pulse was rotated by an achromatic half-wave plate, and then the NIR pulse was separated into two copies by a polarization beam splitter (PBS). Adjusting the rotation angle of the half-wave plate, we set the power ratio between the two NIR pulses as 10:1. The higher intensity pulse of about 680 mW from the PBS was focused into a β-BaB2O4 (BBO) crystal to generate second harmonic UV pulse [23]. The UV pulse was used as a pump in the NOPA process. The lower intensity pulse from the PBS was focused into a 2 mm–thick sapphire plate to generate spectrally broadband pulse by self-phase modulation (SPM), which is the third-order NLO process. This 10:1 ratio is to obtain as high an NOPA pulse energy as possible to be used in the pump probe experiment, which requires many optical components such as chirped mirrors and prism pairs (see Figure 1). The shortest edge can reach up to ~450 nm close to the UV region, and longest wavelength is beyond the 800 nm extending to >1.2 μm. Thus, the broadband SPM spectrum covers nearly all of the visible spectral region a part of NIR. However, the intensity of the visible spectral component is much lower than that of the original spectral component around 800 nm. For the application of the time-resolved spectroscopy, the broadband visible SPM light pulse should be amplified. For this purpose, this broadband pulse is used as a seed of signal in the OPA process, which is the second-order NLO process. A long wavelength cut-off filter (CF) blocking >750 nm is set after the sapphire plate to eliminate the intense 800 nm spike in the SPM spectrum. The other beam propagates through a 0.4 mm–thick BBO crystal (29.2°z-cut) to yield a second harmonic UV pulse for the pump of NOPA, satisfying the type-I (o + o → e) phase match condition. BBO crystal is an excellent NLO crystal widely used in the field of ultrashort pulse laser research [30]. In order to achieve efficient and stable OPA, a 10-cm quartz block is used to stretch the pump pulse duration to 200 fs to be comparable to the white-light continuum seed (signal) pulse. This condition makes the interaction efficiency between the pump and signal robust against the jitter between them. A prism (TP) with 45° apex is set after the quartz block for pre-tilting the pulse front of the pump beam to satisfy the pule-front matching condition with the signal beam co-propagating with the pump beam in the crystal. Then, the pulse front pre-tilted seed is focused into a 1 mm–thick BBO crystal (31.5°z-cut) together with the UV pump pulse, which satisfies good spatial overlap with white-light continuum signal beam during the co-propagation. The optical delay line in white-light continuum path is adjusted to attain temporal overlap. In order to achieve higher signal pulse energy, the remaining pump and signal pulse energies are reflected after the first OPA processing and focused again in the BBO crystal at a slightly lower position. The temporal overlapping of pump and signal can be controlled by the optical delay line in the pump beam path.
The amplified signal just after the BBO crystal is about 5 µJ. The time duration of the amplified broadband visible pulse was compressed using a set of chirped mirrors and a deformable mirror, to be shorter than 10 fs in the sample. A pair of ultra-broadband chirped mirrors (CM1 and CM2) with the combination of the prism pair (P1 and P2), air and the beam splitter was designed to compensate GDD and TOD in the NOPA system. The chirped mirrors have high reflectivity (R > 99%). The best noncollinear angle was obtained by adjusting the fluorescence ring width to be thinnest. Ultrashort visible pulse with 4.7 fs duration was generated by pulse-front-matched noncollinear optical parametric amplification [23]. The pulse width was as short as 3.9 fs with the spectrum 520–770 nm [24]. The optimized output pulse from the NOPA was characterized by the SHG FROG (second harmonic frequency-resolved optical gating) method [31], the results are shown in Figure 2.
The NOPA is tunable in wavelength at the expense of bandwidth, pulse duration, and/or energy. For example in real experimental conditions, the spectrum of non-collinear NOPA can be adjusted in such a way that the wavelength range extends to longer region, 556–753 nm, to achieve higher absorbance of some sample. In this case, the pulse duration is 7.0 fs. By using the NOPA system developed, the time resolution of the measurement to observe ultrafast electronic dynamics has reached as high as sub10 fs. Moreover, the measured signal also contains periodically modulating component, which reflects wave packet motion moving on the potential energy surface in the period of molecular vibration. Thus, ultrafast electronic dynamics and vibrational dynamics can be studied simultaneously in the common experimental condition [32,33,34,35,36,37].
Further we have developed a shorter pulse covering 430–850 nm, corresponding to nearly one octave bandwidth. Also, the carrier envelope phase (CEP) of the pulse is stabilized, and it makes the pulse useful for studying the CEP effect on the electronic and vibrational dynamics [38].
6. Ultrashort Deep Ultraviolet Laser
6.1. DUV Pulse Generation
Generally, the DUV laser pulse based on the Ti:sapphire laser is generated by the SFG or four wave mixing (FWM) method through nonlinear materials. Both cases are usually two-step processes. The former is the combination of SHG and the following SFG (SH plus fundamental). The latter case is the combination of SHG and parametric FWM (SH and the following interaction of two SH photons and fundamental photon) and is going to be discussed in detail in the following. Previously, in several systems for sub-10 fs DUV pulse generation was reported in a group developing high-power lasers aiming attosecond pulse generation [39,40]. Also, an intense sub 10 fs DUV pulse is generated [41], but it has not yet been well applied to time-resolved spectroscopy. Such a situation may be because of the following several difficulties. First, in such high-power systems, the intense amplified spontaneous emission can be easily amplified to generate satellite pulses resulting in the multi-pulse structure. Second, when the DUV pulse is transmitted in the air, the effect of group velocity dispersion (GVD) is much more severe than the visible case, which leads to substantial pulse broadening, resulting in the distorted non-clean shape. These make the ultrashort pulse compensation more complicated and difficult. For the spectroscopy, a clean FT limited pulse is required for application. In the following, we describe the novel method developed to obtain such a clean nearly FT limited pulse.
If the pump and idler pulses in the FWM processes are both linearly chirped by appropriate control, the output of the FWM can be designed to be an FT-limited pulse. It is performed by a method called chirped pulse FWM (CPFWM). Energy conservation in the FWM process can be expressed by ωpump + ωpump − ωidler = ωsignal, where ωpump, ωidler, and ωsignal are the pump, idler, and signal angular frequencies, respectively. In case when the pump and idler pulses are linear chirped, it is possible to obtain nearly-FT limited pulse as follows. At first let us assume that the instantaneous angular frequencies of the pump and idler pulses are represented by ωpump (t) = 2ω0 + βpumpt and ωidler (t) = ω0 + βidlert, respectively. Here, ω0 is the center angular frequency of the idler and βpump and βidler are the chirp rates of the pump and idler pulses, respectively. Then the energy conservation condition gives the DUV signal pulse frequency, ωsignal (t) = 3ω0 + (2βpump − βidler) t in case their time origin is common. The frequency chirps of the idler and pump pulses cancel out each other when the frequency chirps of the two input pulses have the same signs. When 2βpump − βidler = 0 is satisfied, no frequency chirp is induced in the amplified signal pulse. In the present experiment, frequency chirps were induced in the input pulses by spectrum broadening in the hollow fiber. The pump pulses is frequency chirped by a pair of gratings.
6.2. Sub-10 fs DUV Laser Pulse Obtained by Broad-Band CPFWM
To generate a high-quality DUV pulse suitable for ultrafast spectroscopy, a broad-band chirped-pulse four-wave mixing method (BBCPFWM) was demonstrated [42,43]. The scheme of the system is depicted in Figure 3. The basic pulse source is a Ti: Sapphire laser (Spitfire Ace, Spectra Physics, Santa Clara, CA, USA.). The energy, duration, and repetition of the output pulse beam are 2.5 mJ, 35 fs, and 1 kHz, respectively. It is split into two beams. They have pulse energies of 900 μJ and 300 μJ, the sum of which is smaller than 2.5 mJ due to beam pointing stabilizer mirror (PS), lens, beam splitter (BS), and half-wave-plate (λ/2) as shown in Figure 3. The 900 μJ pulse is introduced to a BBO crystal to generate a second harmonic (SH) near UV pulse. The UV pulse is negatively chirped after passing through two phase-delay controlled chirped mirrors (PM). The other fundamental pulse of 300 μJ is focused into hollow core fiber 2 filled with krypton gas (630 Torr) to obtain broadband supercontinuum in NIR. Then, the positive chirped NIR pulse and NUV pulse are both coupled into another hollow core fiber filled with argon gas (61 Torr), where they are spatially and temporally overlapping. In this second hollow fiber, a broadband and negative chirped DUV pulse is generated by the BBCPFWM process. Just after the second hollow fiber, a clean and well-compressed DUV pulse could be obtained at a certain distance assisted by the positive GVD in the air just after this second hollow fiber. After the collimation of the output beam, the NIR and NUV pulses are carefully eliminated by a set of four dichroic mirrors (DM) step by step.
The pulse characterization of the generated DUV pulse is performed using the frequency-resolved optical gating (FROG) method [31]. The results of FROG measurement are shown in Figure 4. Figure 4a,b depicts the measured and retrieved FROG traces, respectively. Figure 4c shows the spectrum measured with the spectrometer, the spectrum, and the spectral phase retrieved from the FROG traces. Figure 4d presents the temporal intensity profile of the transform-limited pulse corresponding to the measured spectrum and the retrieved temporal spectral intensity profile and spectral phase.
6.3. DUV Pulse Stability Optimization
For the spectroscopy application based on the pump-probe experiment, the long-time stability of the intensity of laser spectrum is of vital importance to obtain reliable data. However, the stability of the DUV laser pulse energy and spectrum after the hollow fiber is often not good enough to be used in a real-time spectroscopy experiment [38]. This is because the fluctuations of the laser beam pointing before the hollow fiber induce substantial variations in the pulse duration, spectrum, and energy of the output pulse. Especially in the present two-step scheme as shown in Figure 3, since two hollow fibers are introduced, the stability situation becomes even more serious. Therefore, it is highly desirable to stabilize the coupling of beam into the hollow fibers. The instability is induced by the change in the propagation direction and point of incidence of the beam before the hollow fibers which can be controlled by the reflection mirror of the beam to be coupled. The stabilization is attained by the feedback systems of the beam intensity in front of the entrances of the fibers to the mirror pairs in front of the fibers [42,43]. In the left part of Figure 5, the stability of DUV output power intensity is measured for 2000 s without the feedback system. The RMS noise is over 10%, which is not acceptable for the pump probe experiment. To maintain a stable DUV pulse output, three beam pointing stabilizers (PS) were used for each input beam before it was focused into the hollow fiber. Pointing detectors (PD) sense the change of intensity and feedback to PS to adjust the azimuthal and elevation angles of PS mirrors. As shown in the right part of Figure 5, after the stabilization, the DUV laser output is improved to 1.04% RMS, being measured for the same time length as without the stabilizer.
7. Conclusions
In the present paper, we described two types of femtosecond laser developed by using two types of optical parametric processes. One is in the visible range based on optical parametric amplification (OPA), and the other is in the DUV range based on optical parametric four-wave mixing.
The width of the visible pulse is as short as 4.7 fs with a spectrum of 520–720 nm. To satisfy the broad phase-matching condition, noncollinear PA (NOPA) was used. Even further pulse shortening to 3.9 fs duration was attained by compensating group-delay dispersion (GDD) and third-order dispersion (TOD) in the NOPA system using a pair of ultra-broadband chirped mirrors (CM) with the combination of the prism pair. In real experimental conditions, the spectrum of non-collinear NOPA can be adjusted in such a way that the wavelength range extends to longer region, 556–753 nm, to achieve higher absorbance of some sample. In this case, the pulse duration is 7.0 fs.
An ultrashort DUV pulse laser is developed using the broad-band chirped-pulse four-wave mixing method (BBCPFWM). The laser pulse suffered from instability induced by the fluctuation of coupling efficiency to the two hollow core fibers containing krypton and argon gas in one of the two fibers each. The former is for the introduction of chirping to obtain a broad spectrum, and the latter is for the BBCPFWM processes.
The problem of the instability of the DUV pulse output introduced by the unstable coupling efficiency to the fibers due to optical components was solved by the coupling stabilizer to the level of 1.04% RMS. The energy and duration of the DUV pulse are 300-nJ and 9.6 fs, respectively.
Funding
This research was funded by the Japan Science and Technology Agency, grant name: “Ultrashort Pulse laser” in the International Cooperative Research Project (ICORP) 2006–2011 and Core Research for Evolutional Science and Technology (CREST) 2011–2016 “Enhancing Applications of Innovative Optical Science and Technologies by making Ultimate Use of Advanced Light Sources”.
Conflicts of Interest
The authors declare no conflict of interest. The founding sponsors had no role in the design of the study; in the collection, analyses, or interpretation of data; in the writing of the manuscript, and in the decision to publish the results.
References
- Polanyi, J.C.; Zewail, A.H. Direct Observation of the Transition State. Acc. Chem. Res. 1995, 28, 119–132. [Google Scholar] [CrossRef]
- The Nobel Prize in Chemistry 1967. Available online: https://www.nobelprize.org/nobel_prizes/chemistry/laureates/1967/ (accessed on 18 July 2018).
- Boyer, A.; Déry, M.; Selles, P.; Arbour, C.; Boucher, F. Colour discrimination by forward and reverse photocurrents in bacteriorhodopsin-based photosensor. Biosens. Bioelectron. 1995, 10, 415–422. [Google Scholar] [CrossRef]
- Hellingwerf, K.J.; Hendriks, J.; Gensch, T. On the Configurational and Conformational Changes in Photoactive Yellow Protein that Leads to Signal Generation in Ectothiorhodospira halophile. J. Biol. Phys. 2002, 28, 395–412. [Google Scholar] [CrossRef] [PubMed]
- Imamoto, Y.; Kataoka, M. Structure and photoreaction of photoactive yellow protein, a structural prototype of the PAS domain superfamily. Photochem. Photobiol. 2007, 83, 40–49. [Google Scholar] [CrossRef] [PubMed]
- Eichmann, G.; Li, Y.; Alfano, R.R. Optical binary coded ternary arithmetic and logic. Appl. Opt. 1986, 25, 3113. [Google Scholar] [CrossRef] [PubMed]
- Hulin, D.; Mysyrowicz, A.; Antonetti, A.; Migus, A.; Masselink, W.T.; Morkoç, H.; Gibbs, H.M.; Peyghambarian, N. Ultrafast all-optical gate with subpicosecond ON and OFF response time. Appl. Phys. Lett. 1986, 49, 749. [Google Scholar] [CrossRef]
- De Waele, V.; Schmidhammer, U.; Mrozek, T.; Daub, J.; Riedle, E. Ultrafast bidirectional dihydroazulene/vinylheptafulvene (DHA/VHF) molecular switches: Photochemical ring closure of vinylheptafulvene proven by a two-pulse experiment. J. Am. Chem. Soc. 2002, 124, 2438–2439. [Google Scholar] [CrossRef] [PubMed]
- Kuhnert, L. A new optical photochemical memory device in a light-sensitive chemical active medium. Nature 1986, 319, 393–394. [Google Scholar] [CrossRef]
- Ikeda, T.; Horiuchi, S.; Karanjit, D.B.; Kurihara, S.; Tazuke, S. Photochemical Image Storage in Polymer Liquid Crystals. Chem. Lett. 1988, 17, 1679–1682. [Google Scholar] [CrossRef]
- Korolev, N.E.; Mokienko, I.Y.; Poletimov, A.E.; Shcheulin, A.S. Optical storage material based on doped fluoride crystals. Phys. Status Solidi 1991, 127, 327–333. [Google Scholar] [CrossRef]
- Pellegrino, F. Ultrafast Energy Transfer Processes in Photosynthetic Systems Probed by Picosecond Fluorescence Spectroscopy. Opt. Eng. 1983, 22, 225508. [Google Scholar] [CrossRef]
- Paschenko, V.Z.; Kononenko, A.A.; Protasov, S.P.; Rubin, A.B.; Rubin, L.B.; Uspenskaya, N.Y. Probing the fluorescence emission kinetics of the photosynthetic apparatus of Rhodopseudomonas sphaeroides, strain 1760-1, on a picosecond pulse fluorometer. BBA-Bioenergy 1977, 461, 403–412. [Google Scholar] [CrossRef]
- Wasielewski, M.R.; Liddell, P.A.; Barrett, D.; Moore, T.A.; Gust, D. Ultrafast carotenoid to pheophorbide energy transfer in a biomimetic model for antenna function in photosynthesis. Nature 1986, 322, 570–572. [Google Scholar] [CrossRef]
- Yabushita, A.; Kobayashi, T.; Tsuda, M. Time-resolved spectroscopy of ultrafast photoisomerization of octopus rhodopsin under photoexcitation. J. Phys. Chem. B 2012, 116. [Google Scholar] [CrossRef] [PubMed]
- Suzuki, K.; Kobayashi, T.; Ohtani, H.; Yesaka, H.; Nagakura, S.; Shichida, Y.; Yoshizawa, T. Observation of the Picosecond Time-Resolved Spectrum of Squid Bathorhodopsin at Room Temperature. Photochem. Photobiol. 1980, 32. [Google Scholar] [CrossRef]
- Peters, K.; Applebury, M.L.; Rentzepis, P.M. Primary photochemical event in vision: Proton translocation. Proc. Natl. Acad. Sci. USA 1977, 74, 3119–3123. [Google Scholar] [CrossRef] [PubMed]
- Ishii, N.; Tokunaga, E.; Adachi, S.; Kimura, T.; Matsuda, H.; Kobayashi, T. Optical frequency and vibrational time-resolved two-dimensional spectroscopy by real-time impulsive resonant coherent Raman scattering in polydiacetylene. Phys. Rev. A 2004, 70, 023811. [Google Scholar] [CrossRef]
- Yabushita, A.; Kao, C.; Lee, Y.; Kobayashi, T. Development and demonstration of table-top synchronized fast-scan femtosecond time-resolved spectroscopy system by single-shot scan photo detector array. Jpn. J. Appl. Phys. 2015, 54, 072401. [Google Scholar] [CrossRef]
- Yabushita, A.; Lee, Y.; Kobayashi, T. Development of a multiplex fast-scan system for ultrafast time-resolved spectroscopy. Rev. Sci. Instrum. 2010, 81, 063110. [Google Scholar] [CrossRef] [PubMed]
- Global Fitting with Parameter Sharing. Available online: https://www.originlab.com/doc/Tutorials/Fitting-Global (accessed on 18 July 2018).
- Hung, C.C.; Yabushita, A.; Kobayashi, T.; Chen, P.F.; Liang, K.S. Ultrafast relaxation dynamics of nitric oxide synthase studied by visible broadband transient absorption spectroscopy. Chem. Phys. Lett. 2017, 683, 619–624. [Google Scholar] [CrossRef]
- Shirakawa, A.; Sakane, I.; Takasaka, M.; Kobayashi, T. Sub-5-fs visible pulse generation by pulse-front-matched noncollinear optical parametric amplification. Appl. Phys. Lett. 1999, 74, 2268–2270. [Google Scholar] [CrossRef]
- Baltuška, A.; Kobayashi, T. Adaptive shaping of two-cycle visible pulses using a flexible mirror. Appl. Phys. B Lasers Opt. 2002, 75. [Google Scholar] [CrossRef]
- Adachi, S.; Kumbhakar, P.; Kobayashi, T. Quasi-monocyclic near-infrared pulses with a stabilized carrier-envelope phase characterized by noncollinear cross-correlation frequency-resolved optical gating. Opt. Lett. 2004, 29. [Google Scholar] [CrossRef]
- Wilhelm, T.; Piel, J.; Riedle, E. Sub-20-fs pulses tunable across the visible from a blue-pumped single-pass noncollinear parametric converter. Opt. Lett. 1997, 22, 1494–1496. [Google Scholar] [CrossRef] [PubMed]
- Cerullo, G.; Nisoli, M.; Stagira, S.; de Silvestri, S. Sub-8-fs pulses from an ultrabroadband optical parametric amplifier in the visible. Opt. Lett. 1998, 23, 1283–1285. [Google Scholar] [CrossRef] [PubMed]
- Kobayashi, T.; Shirakawa, A. Tunable visible and near-infrared pulse generator in a 5 fs regime. Appl. Phys. B Lasers Opt. 2000, 70. [Google Scholar] [CrossRef]
- Du, J.; Yuan, W.; Xing, X.; Miyatake, T.; Tamiaki, H.; Kobayashi, T.; Leng, Y. Spectral modulation observed in artificial photosynthetic complexes by real-time vibrational spectroscopy. Chem. Phys. Lett. Zewail 2017, 683, 154–159. [Google Scholar] [CrossRef]
- Chen, C.; Fan, Y.X.; Eckardt, R.C.; Byer, R.L. Recent Developments in Barium Borate. Int. Soc. Opt. Photonics 1987, 12. [Google Scholar] [CrossRef]
- Trebino, R. Frequency-Resolved Optical Gating: The Measurement of Ultrashort Laser Pulses; Springer: Berlin, Germany, 2002; ISBN 1-4020-7066-7. [Google Scholar]
- Kobayashi, T. Development of ultrashort pulse lasers and their applications to ultrafast spectroscopy in the visible and Nir ranges. In Advances in Multi-Photon Processes and Spectroscopy; Lin, S.H., Ed.; World Scientific: Singapore, 2008; pp. 155–211. [Google Scholar]
- Wang, Y.T.; Chen, M.H.; Lin, C.T.; Fang, J.J.; Chang, C.J.; Luo, C.W.; Yabushita, A.; Wu, K.H.; Kobayashi, T. Use of ultrafast time-resolved spectroscopy to demonstrate the effect of annealing on the performance of P3HT: PCBM solar cells. ACS Appl. Mater. Interfaces 2015, 7, 4457–4462. [Google Scholar] [CrossRef] [PubMed]
- Han, D.; Du, J.; Kobayashi, T.; Miyatake, T.; Tamiaki, H.; Li, Y.; Leng, Y. Excitonic Relaxation and Coherent Vibrational Dynamics in Zinc Chlorin Aggregates for Artificial Photosynthetic Systems. J. Phys. Chem. B 2015, 119, 12265–12273. [Google Scholar] [CrossRef] [PubMed]
- Hashimoto, S.; Yabushita, A.; Kobayashi, T.; Iwakura, I. Real-time measurements of ultrafast electronic dynamics in the disproportionation of [TCNQ] 22−using a visible sub-10 fs pulse laser. Chem. Phys. Lett. 2016, 650, 47–51. [Google Scholar] [CrossRef]
- Hung, C.C.; Chen, X.R.; Ko, Y.K.; Kobayashi, T.; Yang, C.S.; Yabushita, A. Schiff Base Proton Acceptor Assists Photoisomerization of Retinal Chromophores in Bacteriorhodopsin. Biophys. J. 2017, 112, 2503–2519. [Google Scholar] [CrossRef] [PubMed]
- Kobayashi, T. Ultrafast spectroscopy of coherent phonon in carbon nanotubes using sub-5-fs visible pulses. Irago Conf. 2016. [Google Scholar] [CrossRef]
- Okamura, K.; Kobayashi, T. Octave-spanning carrier-envelope phase stabilized visible pulse with sub-3-fs pulse duration. Opt. Lett. 2011, 36, 226–228. [Google Scholar] [CrossRef] [PubMed]
- Ferenc Krausz. Available online: http://www.attoworld.de (accessed on 18 July 2018).
- Durfee, C.G.; Backus, S.; Kapteyn, H.C.; Murnane, M.M. Intense 8-fs pulse generation in the deep ultraviolet. Opt. Lett. 1999, 24, 697. [Google Scholar] [CrossRef] [PubMed]
- Ermolov, A. Ultrashort UV Pulses via Nonlinear Light Matter Interaction in Gas-Filled Hollow-Core Fibres: Generation and Characterization. Friedrich-Alexander-Universitaet Erlangen-Nuernberg. 2017. Available online: https://opus4.kobv.de/opus4-fau/frontdoor/index/index/docId/8530 (accessed on 18 July 2018).
- Kida, Y.; Liu, J.; Teramoto, T.; Kobayashi, T. Sub-10 fs deep-ultraviolet pulses generated by chirped-pulse four-wave mixing. Opt. Lett. 2010, 35. [Google Scholar] [CrossRef] [PubMed]
- Kobayashi, T.; Kida, Y. Ultrafast spectroscopy with sub-10 fs deep-ultraviolet pulses. Phys. Chem. Chem. Phys. 2012, 14. [Google Scholar] [CrossRef] [PubMed]
Figure 1.
Diagram of NOPA system.; SP: a plate of sapphire for broad-band continuum generation to be used as a signal beam with spectrum >450 nm; 0.4-mm BBO, nonlinear crystal to generate second harmonic used for signal; 1-mm BBO, nonlinear crystal for noncollinear parametric amplification; 10-cm Quartz block, for pulse stretching; TP, a prism for pulse-front tilting; cm, chirped mirror; P1, P2, prism pair for pulse compression; P3, prism for introducing angular dispersion to the SH pulse; the elements of thin rectangle shape without a label are plane >99% reflection mirrors.

Figure 2.
Characterization of output from NOPA (noncollinear optical parametric amplifier). (a,b) Measured SHG FROG (second harmonic frequency-resolved optical gating traces before and after adaptive phase correction using deformable mirror, respectively. Corresponding retrieved traces are displayed in (c,d). Contour lines in (a–d) are at the values of 0.02, 0.05, 0.1, 0.2, 0.4, 0.6, and 0.8 of the FROG peak intensity. (e) Shaded area, fundamental spectrum measured at the crystal location in the FROG apparatus; open circles, spectrum recovered by the FROG retrieval algorithm; dashed-dotted curve, spectral phase before shaping; dash-dotted curve, the optimized phase, (f) Initial (solid curve) and optimized (shades area) temporal intensity profiles; dashed curve, temporal phase of the optimized pulse.

Figure 3.
DUV (deep UV) system setup scheme. BS, beam splitter; PS, beam pointing stabilizer; PD, beam pointing detector; G, grating; PM, phase-delay controlled chirped mirror; CM, concave mirror, DM, dichroic mirror.
Figure 3.
DUV (deep UV) system setup scheme. BS, beam splitter; PS, beam pointing stabilizer; PD, beam pointing detector; G, grating; PM, phase-delay controlled chirped mirror; CM, concave mirror, DM, dichroic mirror.

Figure 4.
(a) Measured and (b) retrieved FROG traces; (c) The spectrum measured with the spectrometer (broken line), the spectrum (solid line), and the spectral phase (dotted line) retrieved from the FROG traces are shown; (d) The temporal intensity profile of the transform-limited pulse corresponding to the measured spectrum is shown by the broken line, and the retrieved temporal intensity profile and phase are indicated by the solid and dotted lines, respectively.

Figure 5.
DUV laser long-time intensity stability performance before (left) and after (right) introducing the stabilization system.
Figure 5.
DUV laser long-time intensity stability performance before (left) and after (right) introducing the stabilization system.

© 2018 by the author. Licensee MDPI, Basel, Switzerland. This article is an open access article distributed under the terms and conditions of the Creative Commons Attribution (CC BY) license (http://creativecommons.org/licenses/by/4.0/).
Share and Cite
MDPI and ACS Style
Kobayashi, T. Development of Ultrashort Pulse Lasers for Ultrafast Spectroscopy. Photonics 2018, 5, 19. https://doi.org/10.3390/photonics5030019
AMA Style
Kobayashi T. Development of Ultrashort Pulse Lasers for Ultrafast Spectroscopy. Photonics. 2018; 5(3):19. https://doi.org/10.3390/photonics5030019
Chicago/Turabian StyleKobayashi, Takayoshi. 2018. "Development of Ultrashort Pulse Lasers for Ultrafast Spectroscopy" Photonics 5, no. 3: 19. https://doi.org/10.3390/photonics5030019
Note that from the first issue of 2016, this journal uses article numbers instead of page numbers. See further details here.