Microcomb-Driven Optical Convolution for Car Plate Recognition

 and
and 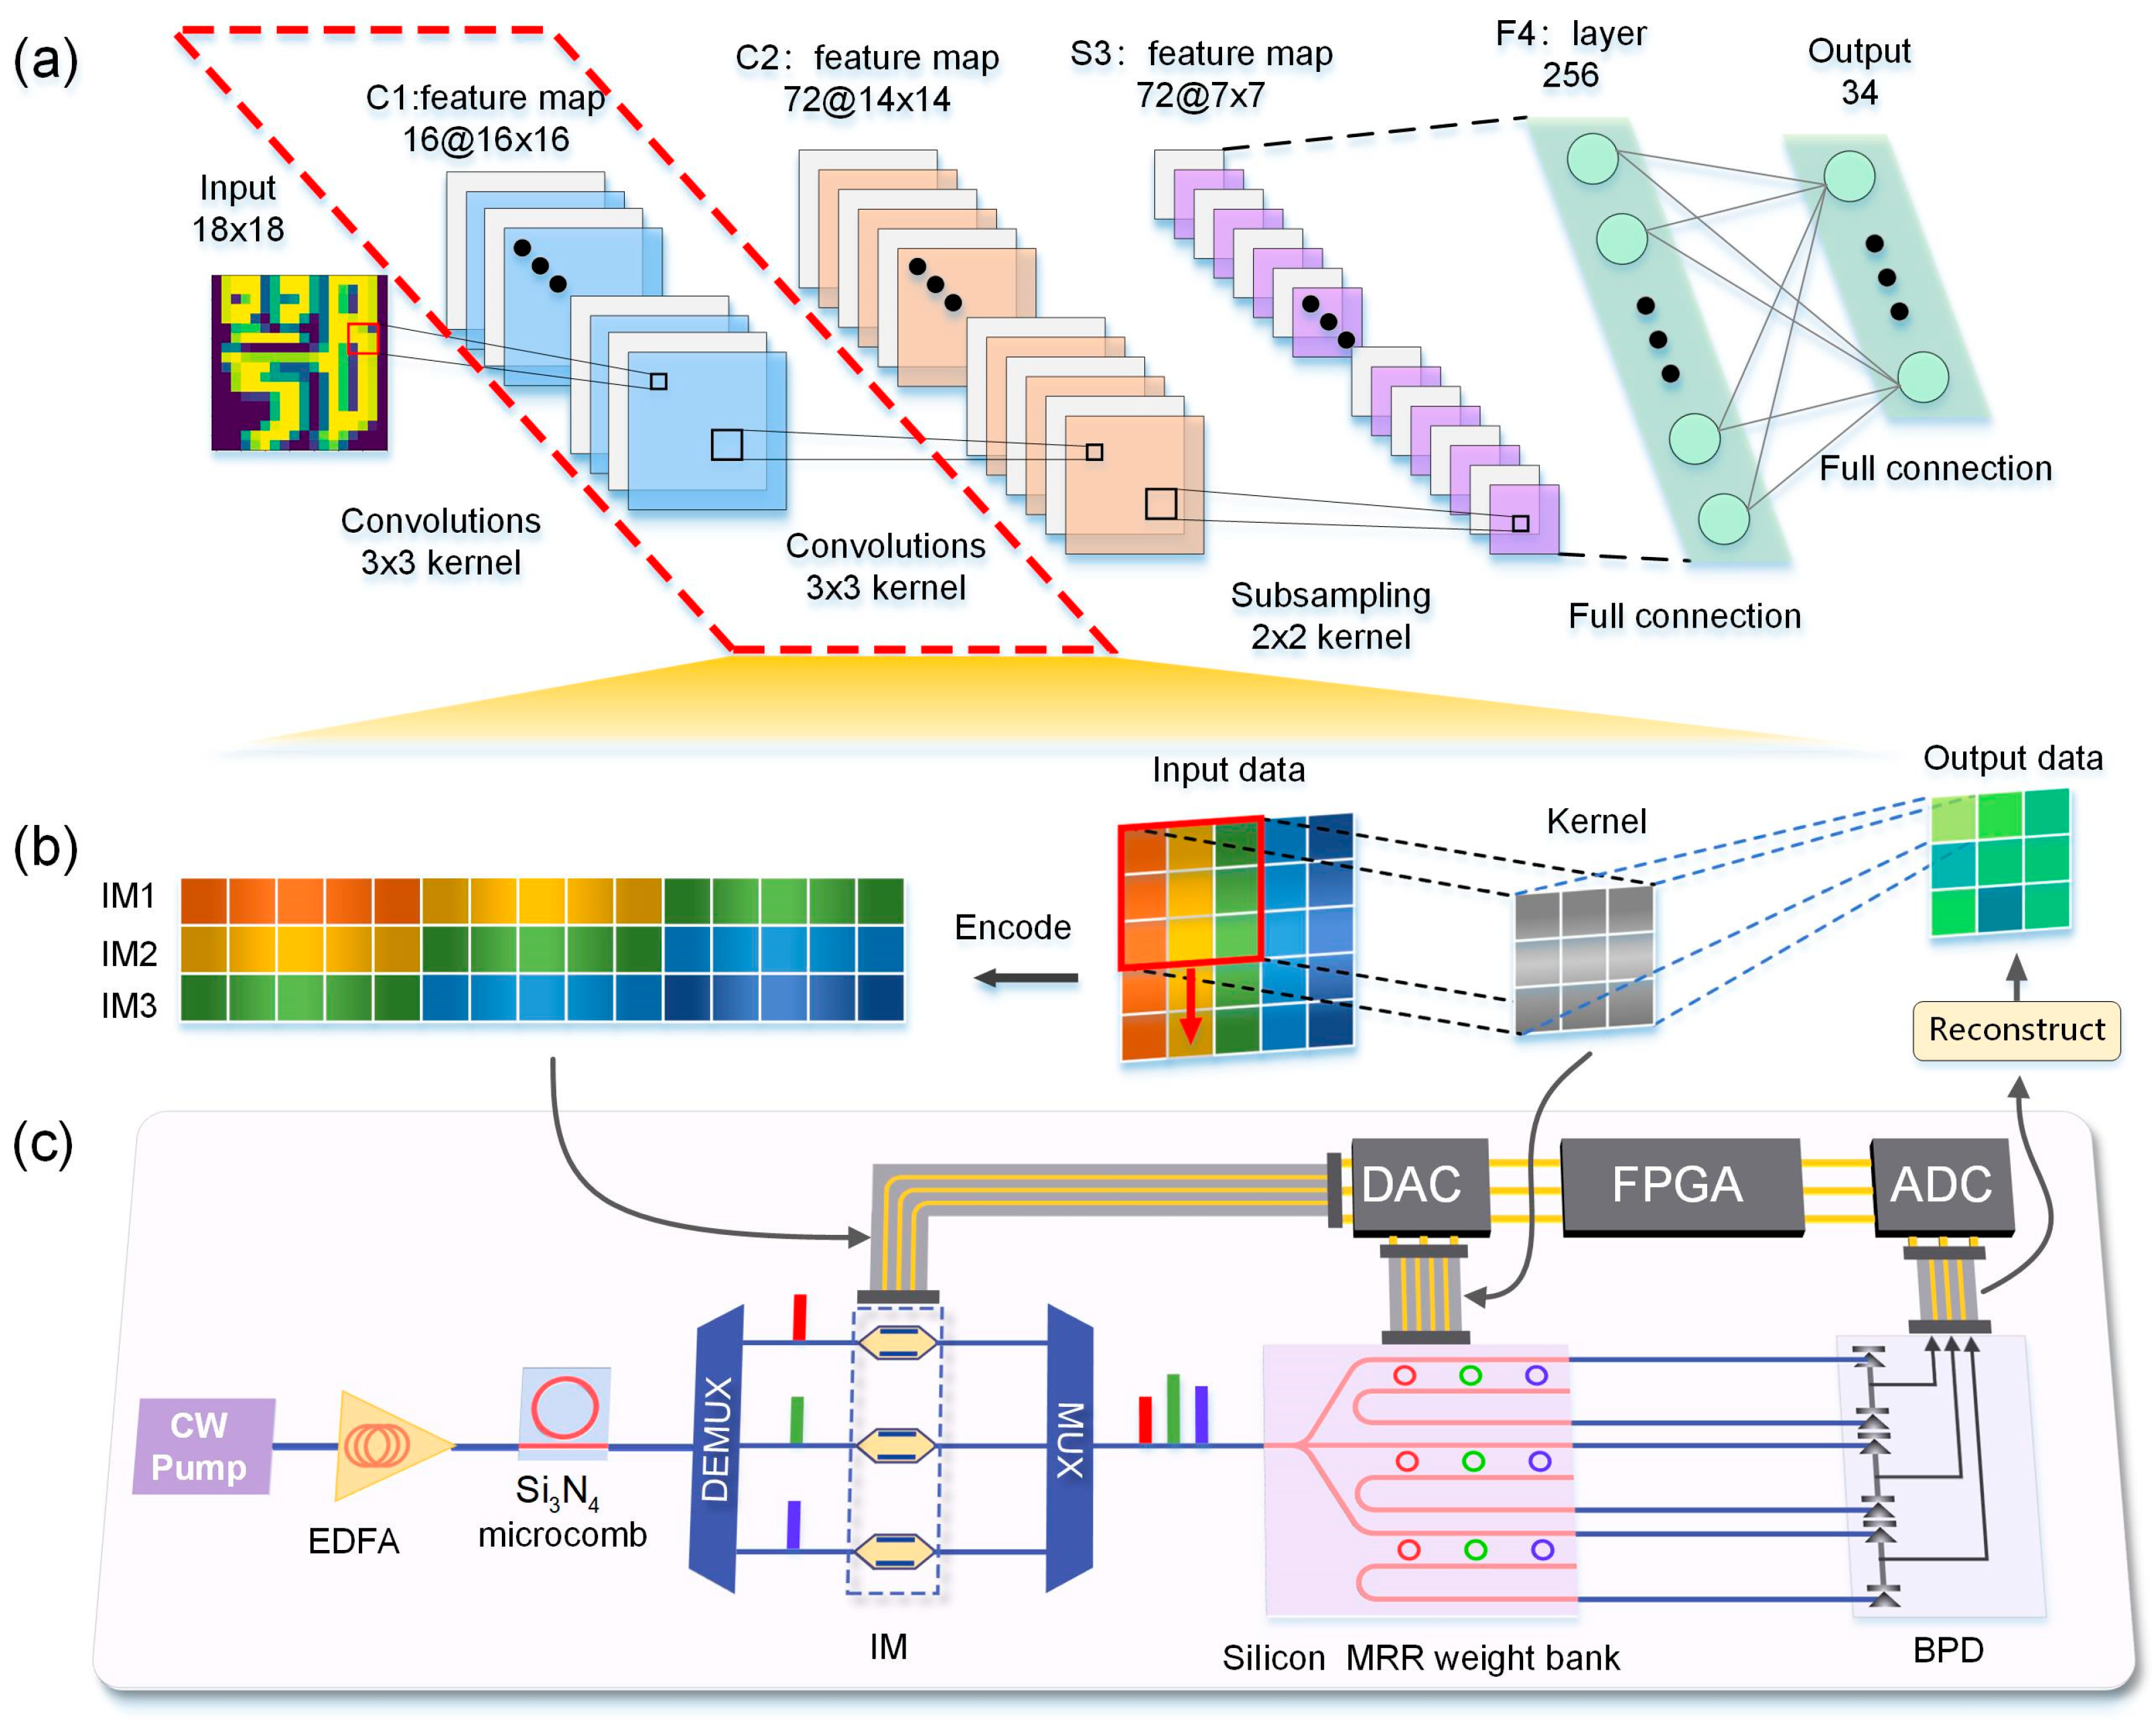
Abstract
:1. Introduction
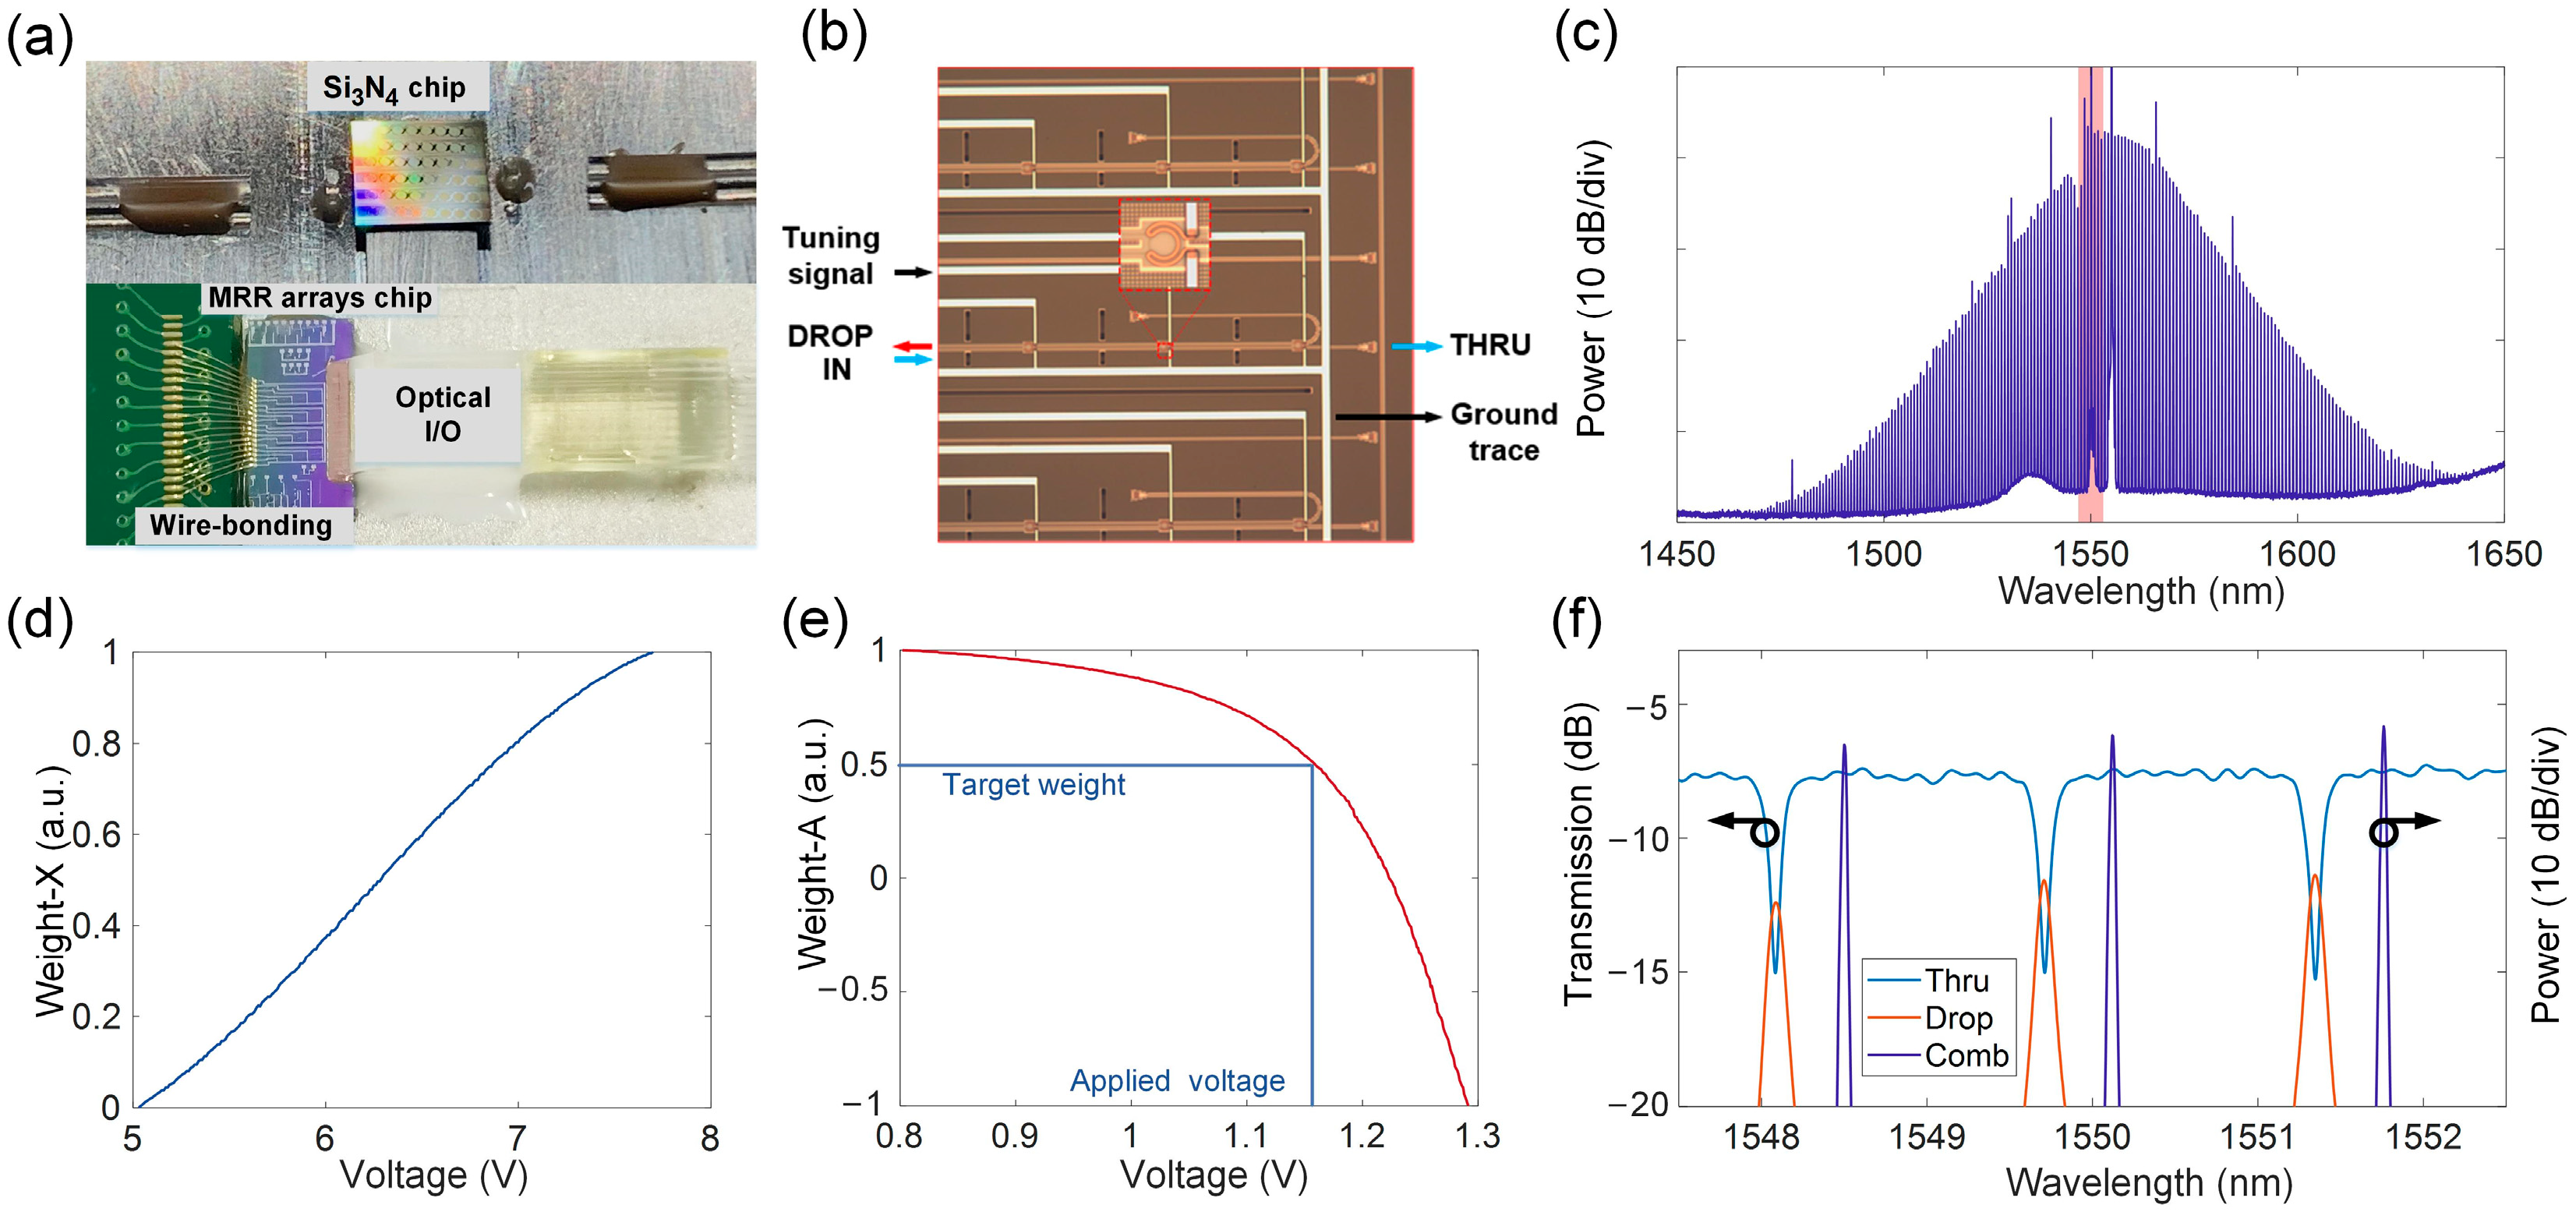
2. Principle and Device Design

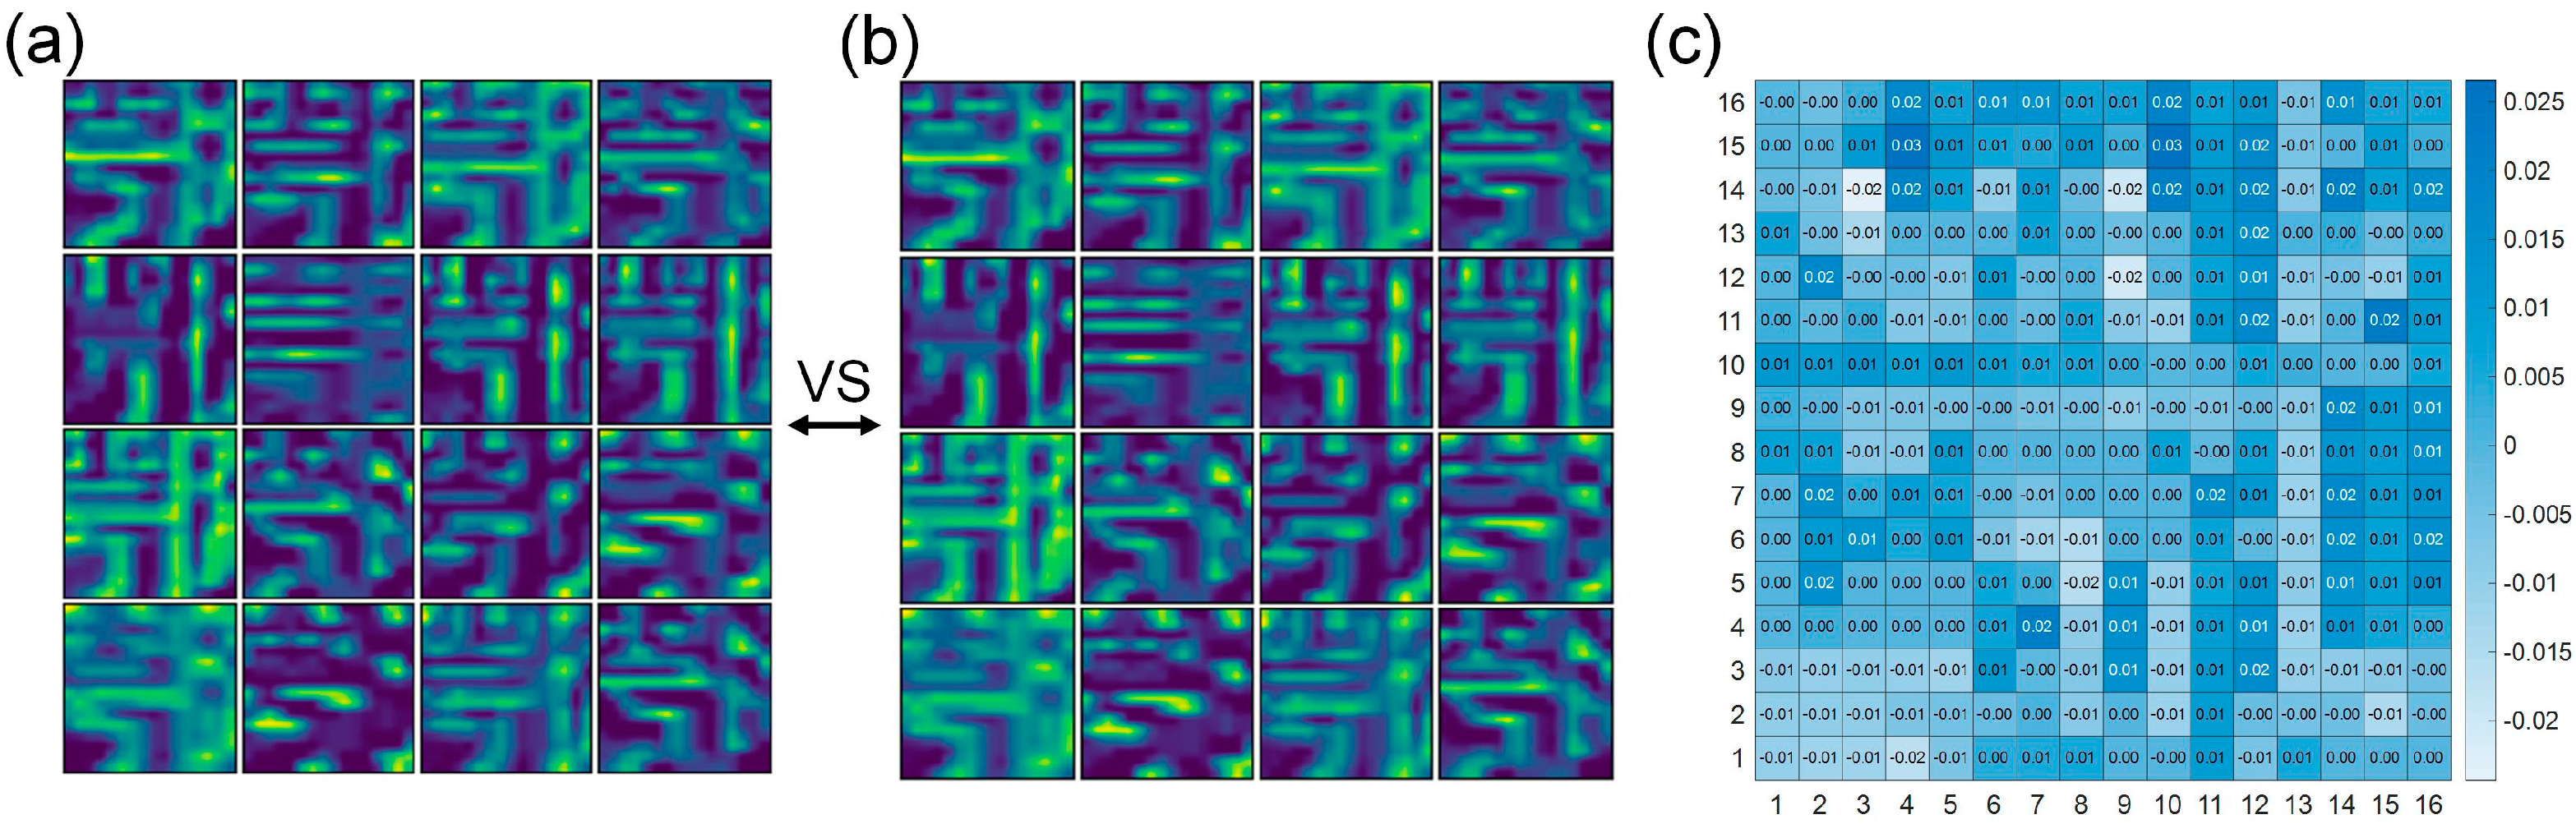
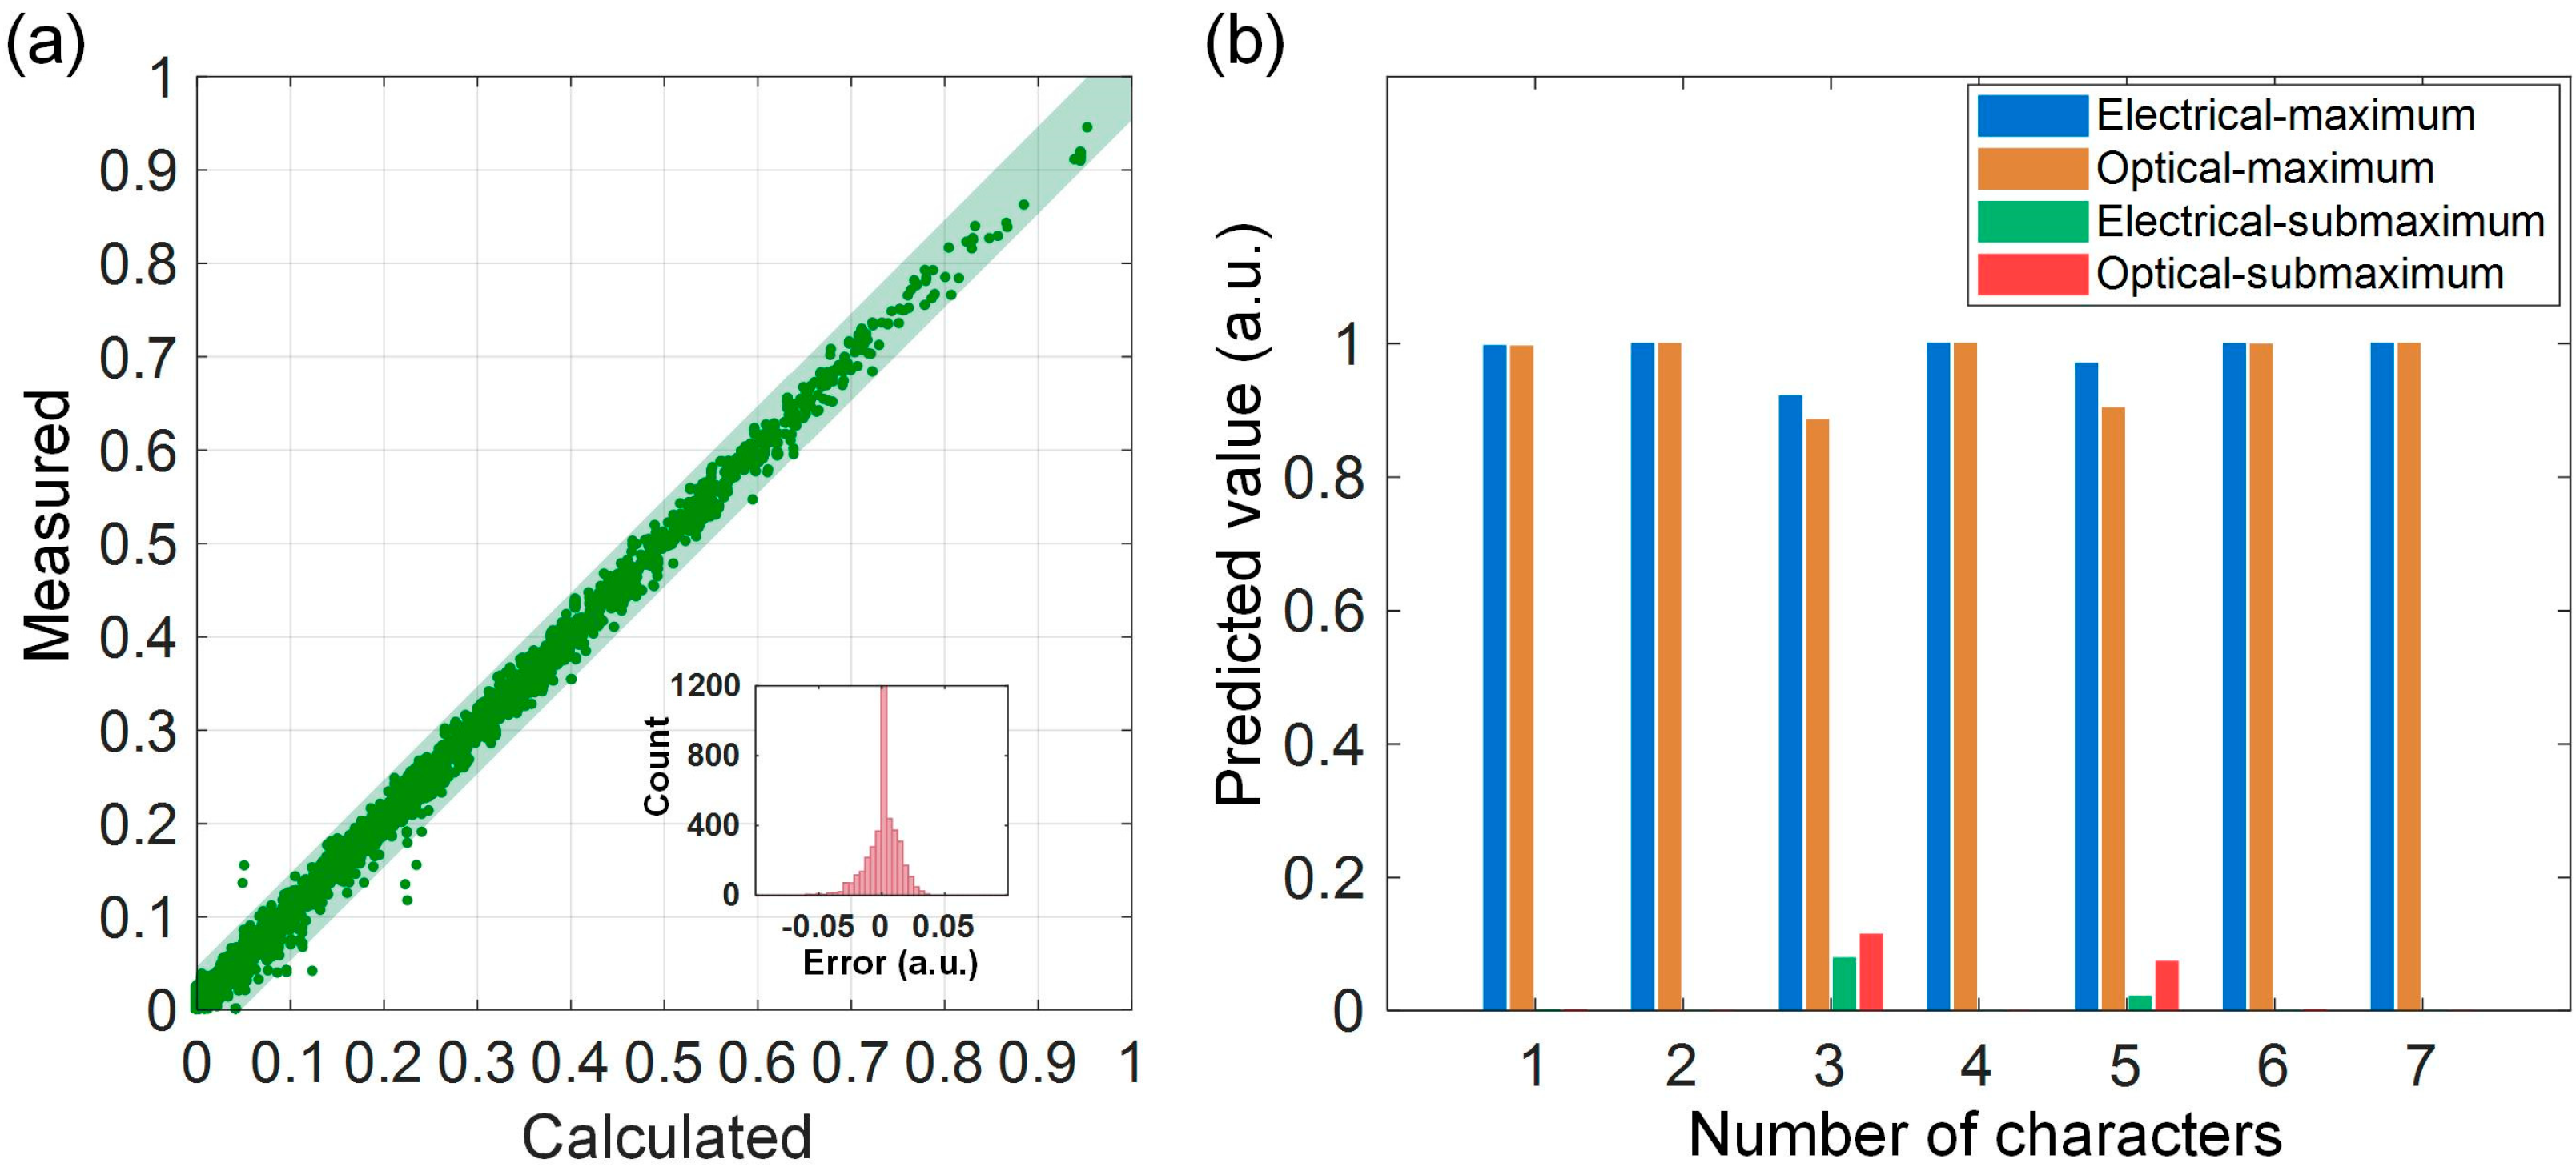
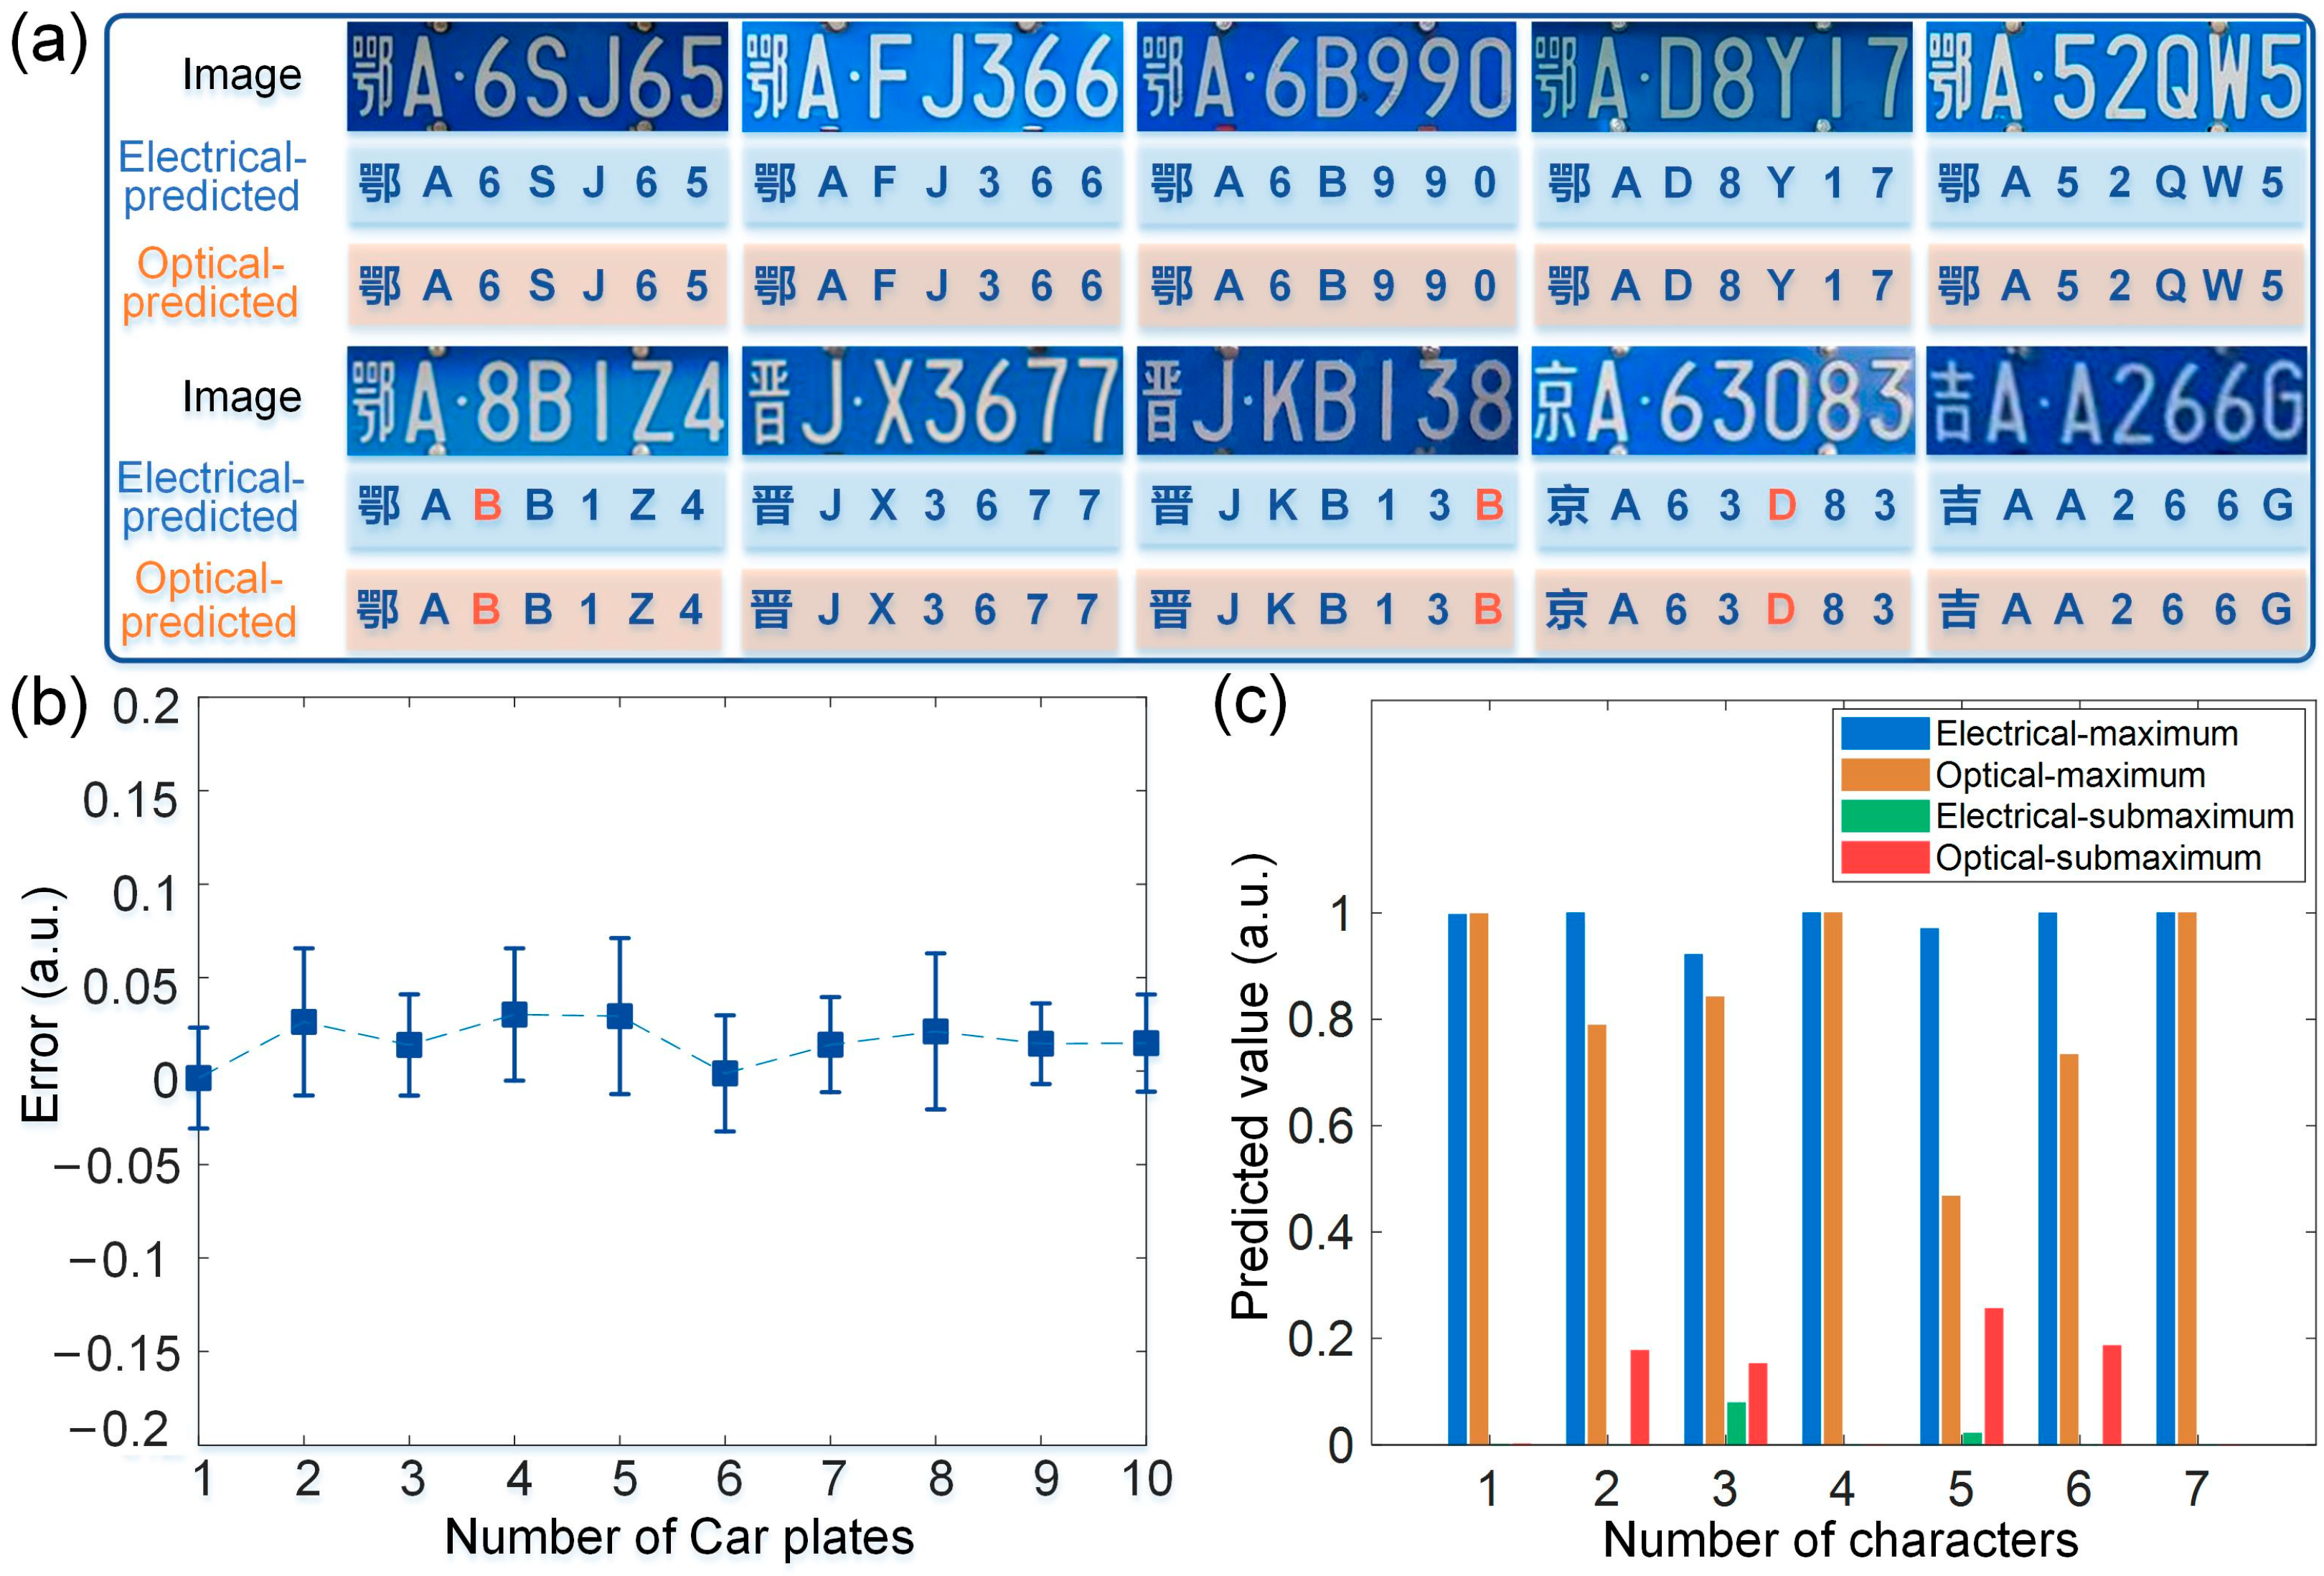
3. Results
4. Discussion
5. Conclusions
Author Contributions
Funding
Institutional Review Board Statement
Informed Consent Statement
Data Availability Statement
Conflicts of Interest
References
- LeCun, Y.; Bengio, Y.; Hinton, G. Deep learning. Nature 2015, 521, 436–444. [Google Scholar] [CrossRef]
- Mnih, V.; Kavukcuoglu, K.; Silver, D.; Rusu, A.A.; Veness, J.; Bellemare, M.G.; Graves, A.; Riedmiller, M.; Fidjeland, A.K.; Ostrovski, G.; et al. Human-level control through deep reinforcement learning. Nature 2015, 518, 529–533. [Google Scholar] [CrossRef] [PubMed]
- Lawrence, S.; Giles, C.L.; Ah Chung, T.; Back, A.D. Face recognition: A convolutional neural-network approach. IEEE Trans. Neural Netw. 1997, 8, 98–113. [Google Scholar] [CrossRef] [PubMed]
- Grigorescu, S.; Trasnea, B.; Cocias, T.; Macesanu, G. A survey of deep learning techniques for autonomous driving. J. Field Robot. 2020, 37, 362–386. [Google Scholar] [CrossRef]
- Ribeiro, A.H.; Ribeiro, M.H.; Paixão, G.M.M.; Oliveira, D.M.; Gomes, P.R.; Canazart, J.A.; Ferreira, M.P.S.; Andersson, C.R.; Macfarlane, P.W.; Meira, W., Jr.; et al. Automatic diagnosis of the 12-lead ECG using a deep neural network. Nat. Commun. 2020, 11, 1760. [Google Scholar] [CrossRef]
- Yuan, B.; Yang, D.; Rothberg, B.E.G.; Chang, H.; Xu, T. Unsupervised and supervised learning with neural network for human transcriptome analysis and cancer diagnosis. Sci. Rep. 2020, 10, 19106. [Google Scholar] [CrossRef]
- Wetzstein, G.; Ozcan, A.; Gigan, S.; Fan, S.; Englund, D.; Soljačić, M.; Denz, C.; Miller, D.A.B.; Psaltis, D. Inference in artificial intelligence with deep optics and photonics. Nature 2020, 588, 39–47. [Google Scholar] [CrossRef]
- Ren, S.; He, K.; Girshick, R.; Sun, J. Faster R-CNN: Towards Real-Time Object Detection with Region Proposal Networks. IEEE Trans. Pattern Anal. Mach. Intell. 2017, 39, 1137–1149. [Google Scholar] [CrossRef]
- Zhou, H.; Dong, J.; Cheng, J.; Dong, W.; Huang, C.; Shen, Y.; Zhang, Q.; Gu, M.; Qian, C.; Chen, H.; et al. Photonic matrix multiplication lights up photonic accelerator and beyond. Light Sci. Appl. 2022, 11, 30. [Google Scholar] [CrossRef]
- Moons, B.; Verhelst, M. An Energy-Efficient Precision-Scalable ConvNet Processor in 40-nm CMOS. IEEE J. Solid-State Circuits 2017, 52, 903–914. [Google Scholar] [CrossRef]
- Waldrop, M.M. The chips are down for Moore’s law. Nature 2016, 530, 144–147. [Google Scholar] [CrossRef] [PubMed]
- Cheng, J.; Zhou, H.; Dong, J. Photonic Matrix Computing: From Fundamentals to Applications. Nanomaterials 2021, 11, 1683. [Google Scholar] [CrossRef] [PubMed]
- Feldmann, J.; Youngblood, N.; Wright, C.D.; Bhaskaran, H.; Pernice, W.H.P. All-optical spiking neurosynaptic networks with self-learning capabilities. Nature 2019, 569, 208–214. [Google Scholar] [CrossRef] [PubMed]
- Huang, C.; Bilodeau, S.; Lima, T.F.d.; Tait, A.N.; Ma, P.Y.; Blow, E.C.; Jha, A.; Peng, H.-T.; Shastri, B.J.; Prucnal, P.R. Demonstration of scalable microring weight bank control for large-scale photonic integrated circuits. APL Photonics 2020, 5, 040803. [Google Scholar] [CrossRef]
- Zhang, W.; Huang, C.; Peng, H.-T.; Bilodeau, S.; Jha, A.; Blow, E.; de Lima, T.F.; Shastri, B.J.; Prucnal, P. Silicon microring synapses enable photonic deep learning beyond 9-bit precision. Optica 2022, 9, 579–584. [Google Scholar] [CrossRef]
- Wu, C.; Yu, H.; Lee, S.; Peng, R.; Takeuchi, I.; Li, M. Programmable phase-change metasurfaces on waveguides for multimode photonic convolutional neural network. Nat. Commun. 2021, 12, 96. [Google Scholar] [CrossRef]
- Xu, X.; Tan, M.; Corcoran, B.; Wu, J.; Boes, A.; Nguyen, T.G.; Chu, S.T.; Little, B.E.; Hicks, D.G.; Morandotti, R.; et al. 11 TOPS photonic convolutional accelerator for optical neural networks. Nature 2021, 589, 44–51. [Google Scholar] [CrossRef]
- Ashtiani, F.; Geers, A.J.; Aflatouni, F. An on-chip photonic deep neural network for image classification. Nature 2022, 606, 501–506. [Google Scholar] [CrossRef] [PubMed]
- Xu, S.; Wang, J.; Yi, S.; Zou, W. High-order tensor flow processing using integrated photonic circuits. Nat. Commun. 2022, 13, 7970. [Google Scholar] [CrossRef]
- Zhu, H.H.; Zou, J.; Zhang, H.; Shi, Y.Z.; Luo, S.B.; Wang, N.; Cai, H.; Wan, L.X.; Wang, B.; Jiang, X.D.; et al. Space-efficient optical computing with an integrated chip diffractive neural network. Nat. Commun. 2022, 13, 1044. [Google Scholar] [CrossRef]
- Bai, B.; Yang, Q.; Shu, H.; Chang, L.; Yang, F.; Shen, B.; Tao, Z.; Wang, J.; Xu, S.; Xie, W.; et al. Microcomb-based integrated photonic processing unit. Nat. Commun. 2023, 14, 66. [Google Scholar] [CrossRef] [PubMed]
- Huang, C.; Fujisawa, S.; de Lima, T.F.; Tait, A.N.; Blow, E.C.; Tian, Y.; Bilodeau, S.; Jha, A.; Yaman, F.; Peng, H.-T.; et al. A silicon photonic–electronic neural network for fibre nonlinearity compensation. Nat. Electron. 2021, 4, 837–844. [Google Scholar] [CrossRef]
- Xu, S.; Wang, J.; Shu, H.; Zhang, Z.; Yi, S.; Bai, B.; Wang, X.; Liu, J.; Zou, W. Optical coherent dot-product chip for sophisticated deep learning regression. Light Sci. Appl. 2021, 10, 221. [Google Scholar] [CrossRef] [PubMed]
- Xu, S.; Zou, W.; Wang, J.; Wang, R.; Chen, J. High-accuracy optical convolution unit architecture for convolutional neural networks by cascaded acousto-optical modulator arrays: Erratum. Opt. Express 2020, 28, 21854. [Google Scholar] [CrossRef] [PubMed]
- Luo, X.; Hu, Y.; Ou, X.; Li, X.; Lai, J.; Liu, N.; Cheng, X.; Pan, A.; Duan, H. Metasurface-enabled on-chip multiplexed diffractive neural networks in the visible. Light Sci. Appl. 2022, 11, 158. [Google Scholar] [CrossRef]
- Cheng, J.; He, Z.; Guo, Y.; Wu, B.; Zhou, H.; Chen, T.; Wu, Y.; Xu, W.; Dong, J.; Zhang, X. Self-calibrating microring synapse with dual-wavelength synchronization. Photonics Res. 2023, 11, 347–356. [Google Scholar] [CrossRef]
- Bangari, V.; Marquez, B.A.; Miller, H.; Tait, A.N.; Nahmias, M.A.; Lima, T.F.d.; Peng, H.T.; Prucnal, P.R.; Shastri, B.J. Digital Electronics and Analog Photonics for Convolutional Neural Networks (DEAP-CNNs). IEEE J. Sel. Top. Quantum Electron. 2020, 26, 1–13. [Google Scholar] [CrossRef]
- Yang, L.; Ji, R.; Zhang, L.; Ding, J.; Xu, Q. On-chip CMOS-compatible optical signal processor. Opt. Express 2012, 20, 13560–13565. [Google Scholar] [CrossRef]
- Cheng, J.; Zhao, Y.; Zhang, W.; Zhou, H.; Huang, D.; Zhu, Q.; Guo, Y.; Xu, B.; Dong, J.; Zhang, X. A small microring array that performs large complex-valued matrix-vector multiplication. Front. Optoelectron. 2022, 15, 15. [Google Scholar] [CrossRef]
- Shen, Y.; Harris, N.C.; Skirlo, S.; Englund, D.; Soljacic, M. Deep learning with coherent nanophotonic circuits. Nat. Photonics 2017, 11, 441–446. [Google Scholar] [CrossRef]
- Zhou, H.; Zhao, Y.; Wang, X.; Gao, D.; Dong, J.; Zhang, X. Self-Configuring and Reconfigurable Silicon Photonic Signal Processor. ACS Photonics 2020, 7, 792–799. [Google Scholar] [CrossRef]
- Bandyopadhyay, S.; Hamerly, R.; Englund, D. Hardware error correction for programmable photonics. Optica 2021, 8, 1247–1255. [Google Scholar] [CrossRef]
- Lin, X.; Rivenson, Y.; Yardimci, N.T.; Veli, M.; Luo, Y.; Jarrahi, M.; Ozcan, A. All-optical machine learning using diffractive deep neural networks. Science 2018, 361, 1004–1008. [Google Scholar] [CrossRef]
- Liu, C.; Ma, Q.; Luo, Z.J.; Hong, Q.R.; Xiao, Q.; Zhang, H.C.; Miao, L.; Yu, W.M.; Cheng, Q.; Li, L.; et al. A programmable diffractive deep neural network based on a digital-coding metasurface array. Nat. Electron. 2022, 5, 113–122. [Google Scholar] [CrossRef]
- Fu, T.; Zang, Y.; Huang, Y.; Du, Z.; Huang, H.; Hu, C.; Chen, M.; Yang, S.; Chen, H. Photonic machine learning with on-chip diffractive optics. Nat. Commun. 2023, 14, 70. [Google Scholar] [CrossRef] [PubMed]
- Feldmann, J.; Youngblood, N.; Karpov, M.; Gehring, H.; Li, X.; Stappers, M.; Le Gallo, M.; Fu, X.; Lukashchuk, A.; Raja, A.S.; et al. Parallel convolutional processing using an integrated photonic tensor core. Nature 2021, 589, 52–58. [Google Scholar] [CrossRef]
- Krizhevsky, A.; Sutskever, I.; Hinton, G.E. ImageNet classification with deep convolutional neural networks. Commun. ACM 2017, 60, 84–90. [Google Scholar] [CrossRef]
- Kiranyaz, S.; Avci, O.; Abdeljaber, O.; Ince, T.; Gabbouj, M.; Inman, D.J. 1D convolutional neural networks and applications: A survey. Mech. Syst. Signal Process. 2021, 151, 107398. [Google Scholar] [CrossRef]
- Du, S.; Ibrahim, M.; Shehata, M.; Badawy, W. Automatic License Plate Recognition (ALPR): A State-of-the-Art Review. IEEE Trans. Circuits Syst. Video Technol. 2013, 23, 311–325. [Google Scholar] [CrossRef]
- Yujie, L.; He, H. Car plate character recognition using a convolutional neural network with shared hidden layers. In Proceedings of the 2015 Chinese Automation Congress (CAC), Wuhan, China, 27–29 November 2015; pp. 638–643. [Google Scholar]
- Zhou, H.; Geng, Y.; Cui, W.; Huang, S.-W.; Zhou, Q.; Qiu, K.; Wei Wong, C. Soliton bursts and deterministic dissipative Kerr soliton generation in auxiliary-assisted microcavities. Light Sci. Appl. 2019, 8, 50. [Google Scholar] [CrossRef]
- Zhang, Q.; Liu, B.; Wen, Q.; Qin, J.; Geng, Y.; Zhou, Q.; Deng, G.; Qiu, K.; Zhou, H. Low-noise amplification of dissipative Kerr soliton microcomb lines via optical injection locking lasers. Chin. Opt. Lett. 2021, 19, 121401. [Google Scholar] [CrossRef]
- Chang, L.; Liu, S.; Bowers, J.E. Integrated optical frequency comb technologies. Nat. Photonics 2022, 16, 95–108. [Google Scholar] [CrossRef]
- He, M.; Xu, M.; Ren, Y.; Jian, J.; Ruan, Z.; Xu, Y.; Gao, S.; Sun, S.; Wen, X.; Zhou, L.; et al. High-performance hybrid silicon and lithium niobate Mach–Zehnder modulators for 100 Gbit s−1 and beyond. Nat. Photonics 2019, 13, 359–364. [Google Scholar] [CrossRef]
- Li, M.; Li, X.; Xiao, X.; Yu, S. Silicon intensity Mach–Zehnder modulator for single lane 100 Gb/s applications. Photonics Res. 2018, 6, 109. [Google Scholar] [CrossRef]
- Atabaki, A.H.; Moazeni, S.; Pavanello, F.; Gevorgyan, H.; Notaros, J.; Alloatti, L.; Wade, M.T.; Sun, C.; Kruger, S.A.; Meng, H.; et al. Integrating photonics with silicon nanoelectronics for the next generation of systems on a chip. Nature 2018, 556, 349–354. [Google Scholar] [CrossRef]
- Esteva, A.; Kuprel, B.; Novoa, R.A.; Ko, J.; Swetter, S.M.; Blau, H.M.; Thrun, S. Dermatologist-level classification of skin cancer with deep neural networks. Nature 2017, 542, 115–118. [Google Scholar] [CrossRef]


Disclaimer/Publisher’s Note: The statements, opinions and data contained in all publications are solely those of the individual author(s) and contributor(s) and not of MDPI and/or the editor(s). MDPI and/or the editor(s) disclaim responsibility for any injury to people or property resulting from any ideas, methods, instructions or products referred to in the content. |
© 2023 by the authors. Licensee MDPI, Basel, Switzerland. This article is an open access article distributed under the terms and conditions of the Creative Commons Attribution (CC BY) license (https://creativecommons.org/licenses/by/4.0/).
Share and Cite
He, Z.; Cheng, J.; Liu, X.; Wu, B.; Zhou, H.; Dong, J.; Zhang, X. Microcomb-Driven Optical Convolution for Car Plate Recognition. Photonics 2023, 10, 972. https://doi.org/10.3390/photonics10090972
He Z, Cheng J, Liu X, Wu B, Zhou H, Dong J, Zhang X. Microcomb-Driven Optical Convolution for Car Plate Recognition. Photonics. 2023; 10(9):972. https://doi.org/10.3390/photonics10090972
Chicago/Turabian StyleHe, Zhenming, Junwei Cheng, Xinyu Liu, Bo Wu, Heng Zhou, Jianji Dong, and Xinliang Zhang. 2023. "Microcomb-Driven Optical Convolution for Car Plate Recognition" Photonics 10, no. 9: 972. https://doi.org/10.3390/photonics10090972