Article

Spectral and Cathodoluminescence Decay Characteristics of the Ba1−xCexF2+x (x = 0.3–0.4) Solid Solution Synthesized by Precipitation from Aqueous Solutions and Fusion

by
Sergey V. Kuznetsov
1,
Darya S. Yasyrkina
1,
Damir T. Valiev
2,
Sergey A. Stepanov
2,
Alexander A. Alexandrov
1,
Sergey Kh. Batygov
1,
Valeriy V. Voronov
1,
Vasilii A. Konyushkin
1,
Andrey N. Nakladov
1,
Julia A. Ermakova
1 and
Pavel P. Fedorov
1,*
1
Prokhorov General Physics Institute of the Russian Academy of Sciences, Laser Materials and Technology Research Center, Nanotechnology Department, 119991 Moscow, Russia
2
Materials Science Department, Tomsk Polytechnic University, 634050 Tomsk, Russia
*
Author to whom correspondence should be addressed.
Photonics 2023, 10(9), 1057; https://doi.org/10.3390/photonics10091057
Submission received: 26 June 2023 / Revised: 11 September 2023 / Accepted: 14 September 2023 / Published: 18 September 2023
(This article belongs to the Special Issue State-of-the-Art Lanthanide Luminescent Materials)

Abstract

:
Single-phase samples of the Ba1−xCexF2+x solid solution (x = 0.3–0.4) were synthesized by directional crystallization in the form of single crystals and by co-precipitation from aqueous nitrate solutions using potassium fluoride as a fluorinating agent in the form of nanopowders. The cathodoluminescence of the pressed powder samples was studied in comparison with the BaF2: Ce single crystals in 250–460 nm (2.7–5 eV) spectral range upon excitation by an electron accelerator. The cathodoluminescence spectra of the samples revealed a wide band in the range of 3.0–4.0 eV, which consists of two typical components of Ce3+ with decay time 23 ns in the case of single crystals and three decay times 27 ns, 140–170 ns, and ~600 ns in the case of pressed powders. The decay time of the short-wavelength component (27 ns) in the case of pressed powders is close to the lifetime of the excited state of the Ce3+ ion. The developed X-ray phosphors can be applied for embedding in diamonds for diamond–nanoparticle composite preparation.

1. Introduction

Alkaline earth fluorides are transparent in a wide spectral range and apply as a structural material for the IR, visible, UV, and VUV spectral ranges [1]. BaF2 crystals are promising optical materials as a heavy fast scintillator (the density value is 4.8 g/cm3) and high level of radiation-resistant parameters. BaF2 crystals are heavy, fast scintillators (the density value—4.8 g/cm3) with high radiation resistance. One of the main requirements for scintillators is fast response, which means very short afterglow time [2]. At the present time, fluoride optical materials are currently used as scintillation detectors designed for gamma and X-ray radiation in medical diagnostic devices [3,4,5,6]. One of the new intensively developing applications is a detector and visualizer for bright X-ray lasers such as XFEL and synchrotrons due to the development of studies of biomolecules, crystal structure of bulk materials, and micro/nano-objects [7,8,9,10,11,12,13,14,15,16]. The new generation of such materials is based on composite diamond films with embedded nanoparticles [17]. The approach is based on the sequential process of diamond growth by chemical vapor deposition (CVD). In the first stage, the first layer of a diamond film is grown on an oriented silicon substrate in a vacuum using hydrogen–methane plasma at a 700–900 °C temperature range. At the next stage, a suspension of particles is applied to the diamond surface with a following thermal removement of solvent. In the final stage, the second stage of diamond growth is carried out by embedding the phosphor particles inside the diamond composite by growing the diamond. Oxides, chalcogenides (MoS2), and fluorides (HoF3, CeF3, EuF3, β-NaGdF4:Eu) are the most suitable compounds for incorporation into diamond. Cerium-doped Y3Al5O12 and Gd3Al5O12:Sc nanoparticles have been successfully embedded in the diamond host [17]. Other fast-acting cerium-containing X-ray phosphors are Lu2SiO5: Ce and BaF2:Ce.
Barium fluoride luminescence intensely upon excited near the fundamental absorption edge. The large Stokes shift (~7 eV) implies significant lattice relaxation in the excited state. The transition of an electron into the conduction band results in lattice distortion near the hole with simultaneous formation of X2 molecular ion, which occupies two neighboring anion positions (Vk center). The recombination of an electron with the Vk center is accompanied by translational and rotational motion of the X2 molecular ion. The localization of an electron on a nascent anion vacancy leads to the formation of F-centers in the nearest environment of F-center located H-center oriented along the <111> direction. The four configurations are possible depending on the distance between the components of the F-H pair in the fluorite lattice [18]. Radiative annihilation of defects is accompanied by the appearance of triplet luminescence at hnmax = 4.4 eV (so-called STE luminescence from “self-trapped excitons”), with subsequent return of the lattice to the unperturbed configuration. This luminescence is slow, with a decay time of ~600 ns. The core-valence transitions with luminescence at 220 nm and a decay time of less than 1 ns were interpreted in BaF2 crystals besides intensive exciton STE luminescence [19]. This type of luminescence was also called cross-luminescence or Auger-free luminescence [2,20]. The presence of an intense, long-term luminescence component at 310 nm limits the use of BaF2 as a fast scintillator. Suppression of the STE glow is realized by various techniques [20], including doping with various additives, primarily rare-earth fluorides [21,22,23,24,25,26,27,28].
In the case of doping barium fluoride by cerium, the exciton luminescence of the BaF2 converts into the luminescence of the cerium ion through d-f electron transitions of the Ce3+ ion [29,30,31]. The maximum light yield occurs at a concentration of about 0.1 mol.% of CeF3. Further increasing of cerium concentration leads to a decrease in the luminescence intensity due to the concentration quenching process [32]. This phenomenon has been reported for both single crystals and for BaF2: Ce3+ optical ceramics [33,34]. The concentration quenching effect is associated with defect formation in a fluorite-type lattice during the Ba1−xCexF2+x solid solution formation [32]. The composition consistent with the maximum luminescence intensity corresponds to the maximum concentration of free Ce3+-F dipoles in the BaF2 lattice [35], which are formed during local compensation of the excess charge Ba2+→Ce3+ + Fi.
At the same time, up to 52 mol.% CeF3 (x ≤ 0.52) dissolves in barium fluoride with a radical change in the physical properties of Ba1−xCexF2+x solid solution, especially increasing the density [36,37,38].
A high-temperature phase diagram of the BaF2-CeF3 system is presented in Figure 1. In this system, solid solutions Ba1−xCexF2+x with a fluorite structure (phase F) and Ce1−yBayF3−y with a LaF3-tysonite structure (phase T) are formed. The maximum width of a cubic Ba1−xCexF2+x solid solution reaches 52 mol.% CeF3 and does not change in a wide temperature range. Single crystals of this solid solution can be grown from the melt in the entire range of concentrations of the existence of this phase F. As a result of annealing at 400 °C, Kieser and Greis [39] observed the ordering of the corresponding composition of this solid solution with the formation of an ordered trigonal phase Ba4Ce3F17. As for low-temperature synthesis from aqueous solutions, regardless of the precipitant used, a solid solution can only be prepared within a certain concentration range, x ~ 0.3–0.5 [40,41]. No ordering of the samples of this solid solution prepared in this way was observed. A solid solution with a lower CeF3 content is not synthesized. A similar phenomenon occurs for BaF2-RF3 systems with other rare earth elements [42,43], which sharply distinguishes them from the SrF2-RF3 and CaF2-RF3 systems. The reason for this behavior remains unclear and is apparently related to the thermodynamic instability of BaF2-based solid solutions at low temperatures.
Many studies have been devoted to the investigations of the defect structure in concentrated solid solutions formed upon the incorporation of rare-earth fluorides of the cerium group into barium fluoride [44,45,46,47]. There is no unambiguous interpretation of them from the point of view of the cluster structure of defects. The most probable type of cluster in this solid solution is Ce6F37 [48,49], which is probably present in the structure of the low-temperature ordered Ba4Ce3F17 phase [39,50]. According to the X-ray powder diffraction, ordered fluorite-like phase Ba4Ce3F17 is isostructural to Ba4R3F17 (R = Y, Yb) compounds. The structural interpretation indicates the presence of rare-earth elements in clusters of the R6F37 type with eight-vertex polyhedra of the Thompson antiprism type [49,50]. Such defect clusters are easily embedded in the fluorite lattice [48] (Figure 2). However, the coordination number of eight is not characteristic for large cations at the beginning of the lanthanide series, such as cerium. Recently [47], the existence of generalized Ba8[R6F68–69] clusters in Ba1−xRxF2+x solid solutions was proposed (Figure 2d). The anionic configuration retains the same form as for the clusters embedded in the fluorite lattice, but the barium and rare earth cations are reversed. In such inverted clusters, the coordination number for rare-earth elements increases from eight to eleven.
Luminescence of BaF2: Ce3+ with a low concentration of cerium has been studied in detail [20,22,23,24,25,26] and is not the object of this study. As for the luminescence of a solid solution with a high concentration of cerium, there is only one paper [38] in which Chen and Wu recorded the presence of photoluminescence of BaCeF5 ceramics without quantitative characterization.
Regulation of the defect structure of the solid solution opens the way to control the luminescence of cerium. The destruction of defect clusters would be expected to increase the luminescence light yield of the Ba1−xCexF2+x solid solution. Cluster destruction is possible with doping of solid solution by monovalent fluorides, in particular, potassium fluoride. Synthesis of the Ba1−xCexF2+x solid solution by co-precipitation from aqueous solutions technique using potassium fluoride as a fluorinating agent resulted in the preparation of optical ceramics precursors with intense luminescence [40].
The purpose of this investigation was a comparative analysis of the spectral and luminescent characteristics of barium fluoride single crystals with a high cerium concentration (up to 40 mol.%) and powders of the Ba1−xCexKyF2+x−y solid solution with a high concentration of cerium doped with potassium. In our preliminary study [40], we recorded the luminescence of powders upon excited by X-ray radiation. The same powders are investigated with a different source of excitation.

2. Materials and Methods

Synthesis of single-phase BaF2: Ce solid solutions was carried out at room temperature by co-precipitation from aqueous solutions by technique earlier described in paper [40]. The initial reagents were Ce(NO3)3·6H2O (99.99% pure, LANHIT, Moscow, Russia), Ba(NO3)2 (specialty grade, Vekton, St. Petersburg, Russia), KF·2H2O (reagent grade, the Fluoride Salts Plant, Russia), and double distilled water. The potassium fluoride was stored in a desiccator. The reagents were used as received without additional purification. Barium nitrate and cerium nitrate solutions (0.08 mol/L each) were mixed, and the mixed solution was added drop by drop to a 0.16 M potassium fluoride solution with vigorous stirring on a magnetic stirrer. The potassium fluoride was used in a 7% excess over the stoichiometry. Once dropwise addition was over, the resulting suspension was stirred for 2 h for aging. After a precipitate settled, the mother solution was decanted, and the precipitate was washed with double distilled water. Nitrate leaching was controlled by qualitative color reaction by the 1% solution of diphenylamine in concentrated sulphuric acid. The as-washed precipitate was air-dried at 45 °C.
The composition of this solid solution with fluorite crystal structure was Ba1−x−yCexKyF2+x−y (x = 0.3–0.4, y = 0–0.008) due to using KF as fluorinating agent. The synthesized powder samples have been pressed on a manual press into tablets with 10 mm in diameter and 1–2 mm thickness.
Single crystals of solid solutions Ba1−xCexF2+x (x = 0.25–0.40) were grown by the Bridgman technique in graphite multi-channel crucible under vacuum in fluorinating (CF4) and inert (Ar) atmosphere. The initial barium fluoride and cerium fluoride with a purity of 99.99% (LANHIT, Moscow, Russia) were preliminary melted in a fluorinating atmosphere to remove oxygen-containing impurities and moisture adsorbed on the particle surface. The powders prepared by above-mentioned technique were placed in a growth crucible and evacuated to 10−3 mm Hg. After heating up to 700 °C, an inert atmosphere (argon) and fluorinating atmosphere (CF4) were injected to a pressure of −0.45 bar to prevent volatilization of barium fluoride since its vapor pressure is greater than that of cerium fluoride. After holding for 30 min, the melt was heated up to melting point. The maximal process temperature 1500 °C was selected based on the BaF2-CeF3 phase diagram [37]. The resulting melt pulled from the hot zone of the heater down into the cold zone at a rate of 8 mm/hour. The temperature gradient in the crystallization zone was 50 degrees/cm. We did not use additional crystal annealing procedures. The heating and cooling rates were 350 °C/hour and 250 °C/hour, respectively. The single crystals did not have growing defects and optical inhomogeneity, such as cellular substructure caused by the stability loss of the crystallization front [51]. Photos of the single crystals are shown in Figure 3.
X-ray powder diffraction was carried out on a Bruker D8 Advance diffractometer with CuKα radiation. The lattice parameter a and coherent scattering regions (D) were calculated using the TOPAS v.4.2 software (Rwp < 10). The X-ray density (d) was calculated according to the standard formula d = MZ/Na3, where M is the molecular mass, Z = 4 is the number of formula units in the elemental cell, N is the Avogadro number, a is the lattice parameter. The microstructure of the initial powders was analyzed by Carl Zeiss NVision 40 scanning electron microscope. The elemental analysis was performed on a Carl Zeiss NVision 40 scanning electron microscope equipped with an Oxford Instruments X-MAX 80 mm2 unit for energy-dispersive X-ray spectroscopy (EDX). On each sample of the crystal plate, we selected two sites for analysis with registration of four spectra in each site (eight spectra per sample). Confidence intervals for the average values of barium and cerium content (Table 1) were calculated with a confidence probability level of 99%.
Optical properties in the UV, visible, and near IR spectral regions (300–1100 nm) were studied using SF-256UVI spectrophotometer (Lomo-Photonics, Saint-Petersburg, Russia). The thickness of the single crystals measured samples was 10–14 mm. The cathodoluminescence spectra at the initial moments of time after the end of the excitation pulse by an electron beam were recorded by FEU-97 in spectral range 250–460 nm (2.7–5 eV). The spectra were recorded by measuring oscillograms at different wavelengths in the spectrum-scanning mode. The integral spectra of cathodoluminescence per pulse were carried out under excitation by electron pulses with an energy of E = 250 keV and a pulse duration of 10 ns FWHM. Avantes 2048 fiber spectrometer with an integration time of 10 ms in the range of 350–1100 nm was used for spectra registration. A pulse generator was applied to synchronize the start of the accelerator and the spectrometer.

3. Results

The results of energy-dispersive X-ray spectroscopy to determine the chemical composition are summarized in Table 1.
The discrepancies in the nominal and real compositions are small. The deviation of the real chemical composition from the nominal one for single-crystalline samples is explained by the distribution coefficient of the doping component (cerium). In the case of the synthesis of powders from aqueous solutions, a small amount of potassium is included in the solid solution due to the use of KF as a fluorinating agent [40]. The real content of cerium in powder samples is higher than the nominal composition, but it is an ordinary phenomenon for Ba1−xRxF2+x (R—rare-earth elements) solid solutions, which are synthesized by co-precipitation from aqua solutions technique [41,42].

3.1. Ba1−xCexF2+x Single Crystals

Pieces from the grown single crystals of Ba1−xCexF2+x were cut off and ground into powder in an agate mortar for X-ray phase analysis (Figure 4).
Comparison of X-ray powder diffraction data with PDF-2 card #00-004-0452 (a = 6.200 Å) for BaF2 revealed their single-phase state. The change in the lattice parameters from concentration corresponds to the well-known [37] dependence a = 6.200—0.36x [Å] for Ba1−xCexF2+x fluorite solid solution in the BaF2-CeF3 system (see Table 1). It arises from the difference in the ionic radii of isomorphic barium and cerium cations, as well as by the loosening effect of an interstitial fluorine ion entering the lattice for electrostatic compensation of the excess charge of the ion cerium.
The absorption spectra of Ba1−xCexF2+x (x = 0.25–0.40) single crystals are presented in Figure 5.
The UV absorption edge is located at 320 nm. A complex absorption band due to transitions between the 4f–5d energy levels of the Ce3+ ion with a maximum at 390 nm was observed when cerium concentration was varied [52,53]. In the absorption band of Ce3+ion (390 nm), an increase in absorption is observed with an increase in the concentration of ions.
The cathodoluminescence spectra contain three bands with maxima at 4.15 (A1), 3.71 (A2), and 3.42 eV (A3) (Figure 6, Table 2).
The intensity of the A1 band with a maximum of 4.15 eV is very weak and associated with BaF2 emission that is distorted because of cerium absorption during the reabsorption process. The positions of the maxima and half-widths of the A2 and A3 cathodoluminescence bands slightly depend on the CeF3 concentration in the single crystals and correlate to the shifting of the 5d level of Ce.
The luminescence decay kinetics of the Ba1−xCexF2+x single crystals (x = 0.25–0.40) upon 3.4, 3.6, and 3.8 eV excitation are described by a single exponential function with the same decay time of 23 ± 2 ns (Figure 7).

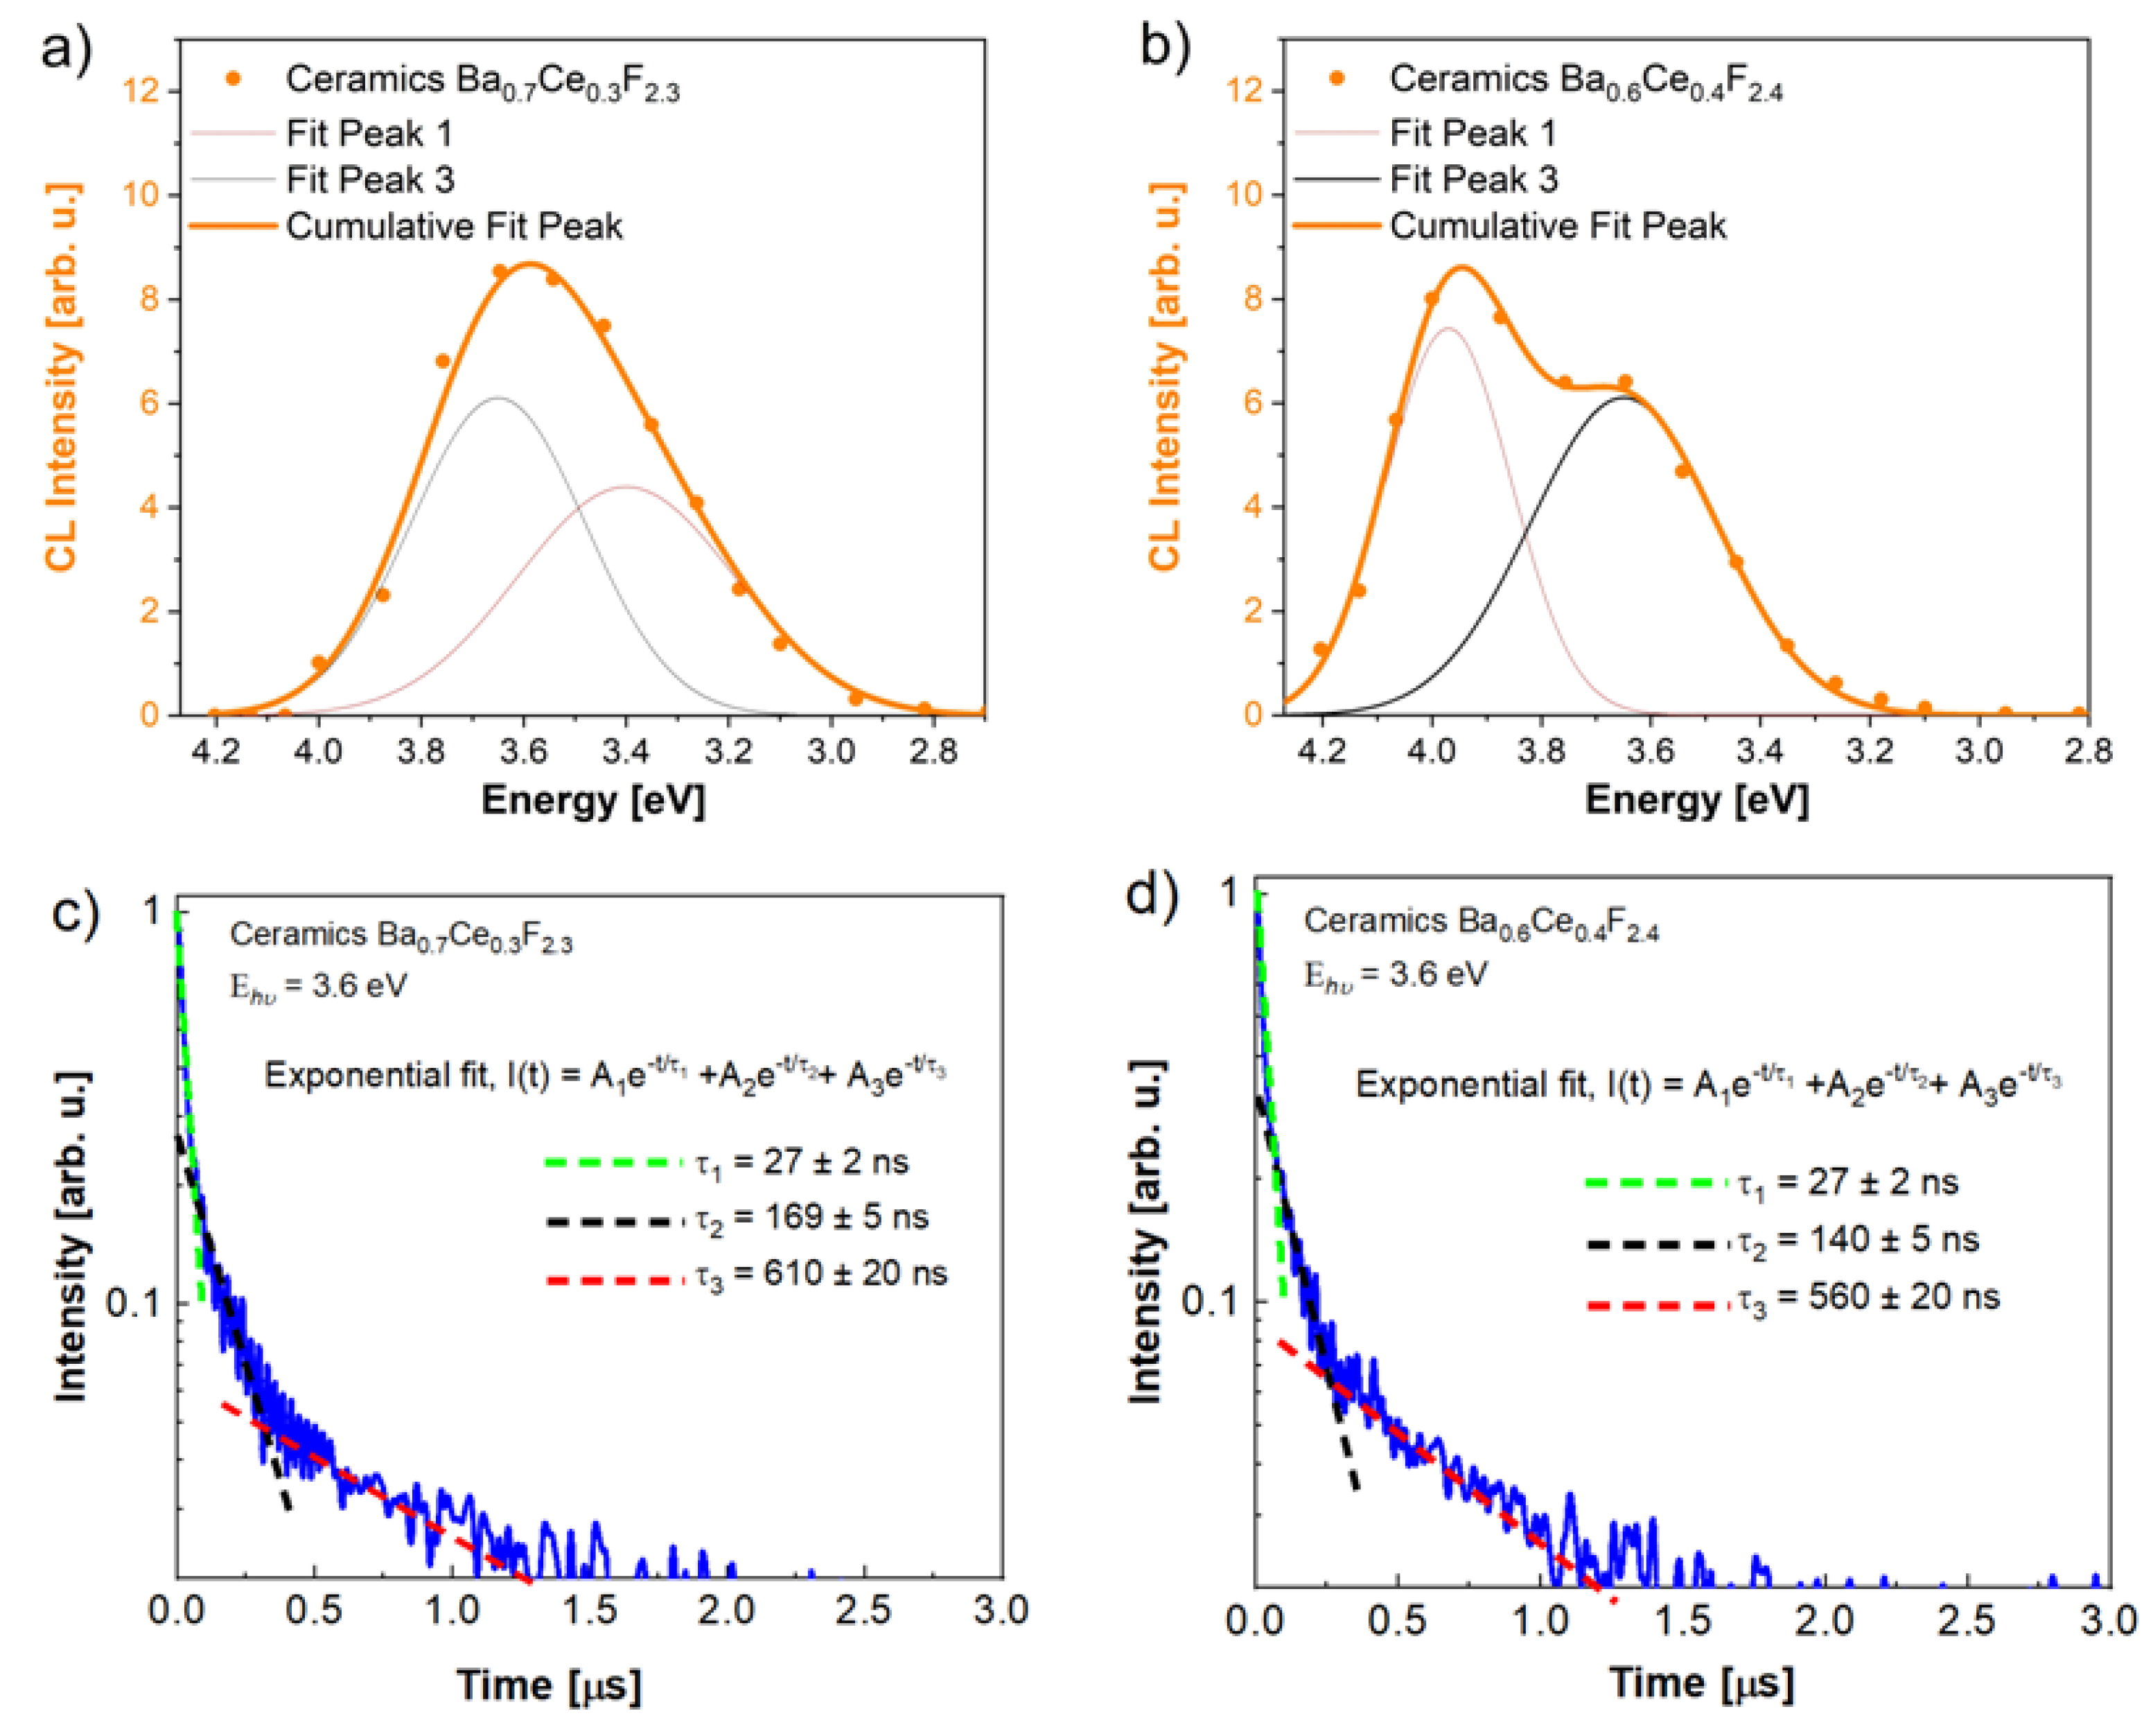
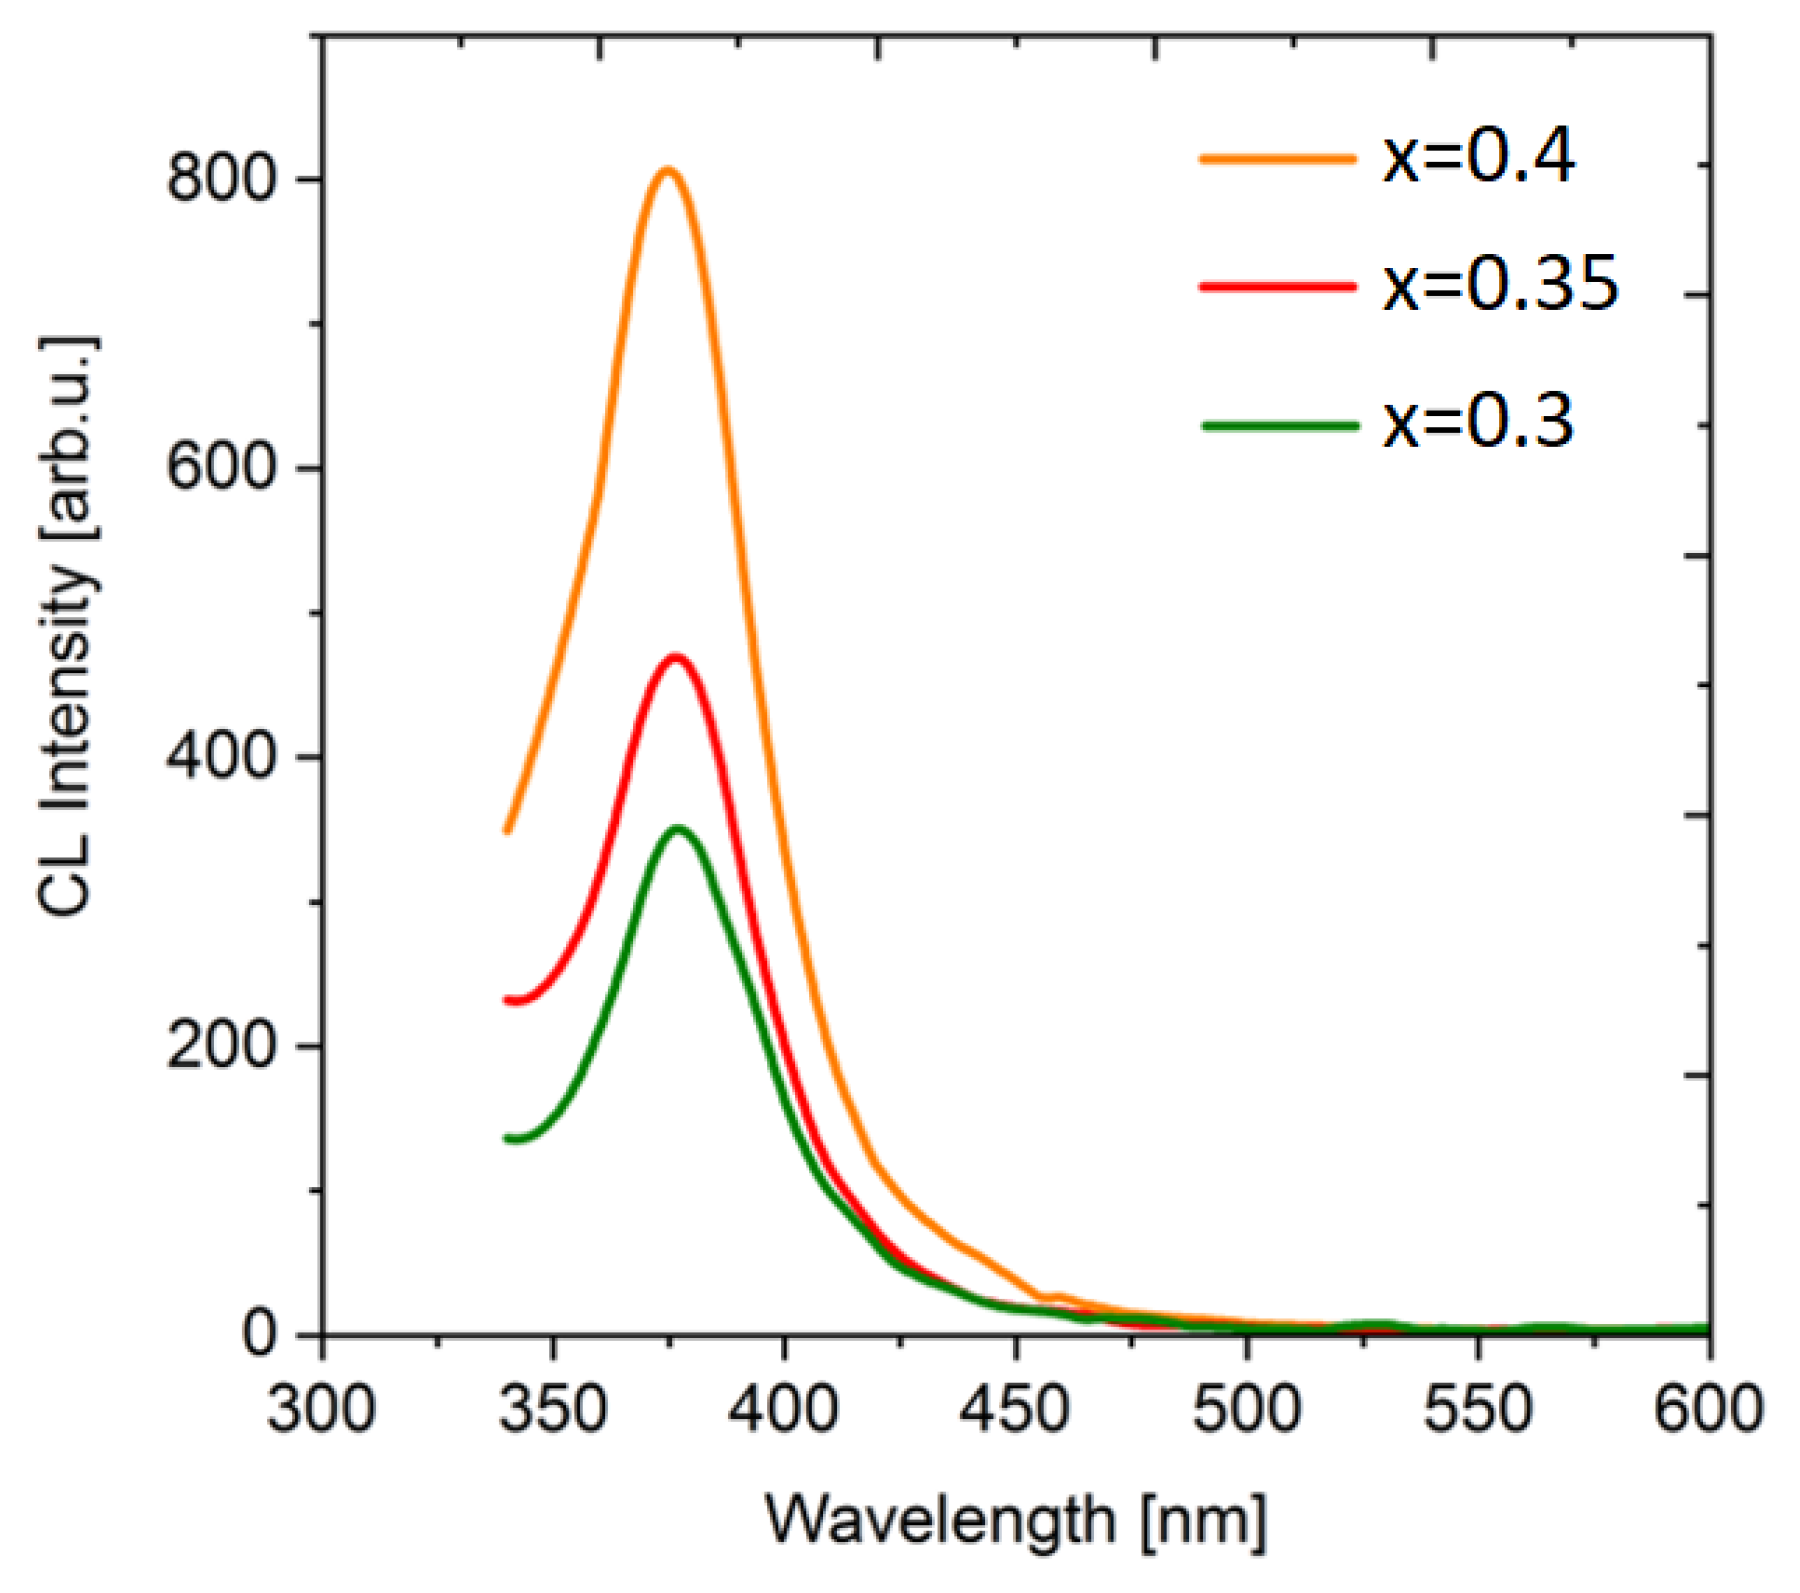
3.2. Ba1−xCexF2+x Pressed Powders

X-ray powder diffraction patterns of powder samples are presented in Figure 8. No additional peaks were detected, which means the synthesized samples are single-phase. The broadening of the reflections in X-ray diffraction patterns indicates a nanoscale state. The sizes of the coherent scattering regions (around 11–12 nm) are presented in Table 1.
Cathodoluminescence spectra of pressed ceramic samples with nominal compositions Ba0.6Ce0.4F2.4 and Ba0.7Ce0.3F2.3 are shown in Figure 9.
These spectra are complex without a band around 4.15 eV. Spectra were composed of two Ce3+ luminescence components caused by the two lowest 4f electronic energy levels, 2F5/2 and 2F7/2, peaking at 3.65 eV (340 nm) + 3.97 eV (310 nm) and 3.40 eV (365 nm) + 3.65 eV (340 nm) for Ba0.6Ce0.4F2.4 and Ba0.7Ce0.3F2.3, respectively. Redistribution of intensities of the luminescence components and significant blue shift of the luminescence bands were observed when the cerium concentration increased. (Table 1). The synthesized powders were dried at a temperature of 45 °C, which may lead to the presence of water and hydroxyl ions on the surface of the particles [54]. There are weak bands at 315 nm in the cathodoluminescence spectra of synthesized powders and single crystals. In the case of oxygen hypothetical presence, their intensity would be significantly less than the cerium cathodoluminescence bands.
The luminescence decay kinetics for powder samples has a multi-exponential character. The decay kinetics of the samples has three lifetimes (27 ns, 140–170 ns, and ~600 ns) at 300 K. The shortest component (~27 ns) is close to the Ce3+ lifetime recorded for single crystals. Slower components in decay kinetics can be associated with the time of excitation delivery to cerium by recombination of the electrons with holes and excitons. The decreasing phenomenon of the slow component is associated with an increase of the cerium content and the probability of reaching the neighboring cerium upon energy transfer process.
The integrated spectra of cathodoluminescence are similar for all samples (Figure 10). The luminescence band maximum at 375 nm (3.31 eV) is closer to the long-wavelength luminescence component for the Ba0.7Ce0.3F2.3 sample. In comparison to time-resolved cathodoluminescence, integrated luminescence exhibits longer-lived (slow) centers; therefore, the long-wavelength component in the luminescence spectrum associated to slower centers.

4. Discussion

The two components of the Ce3+ luminescence in Ba1−xCexF2+x single crystals and pressed powder are caused by transitions from the lowest 5d level to two 4f levels (2F5/2 and 2F7/2) [2]. The splitting of the two 4f levels is typically around 2000 cm−1 which corresponds to about 0.3 eV. The values of splitting determined in our work are close to this value. Such luminescence behavior contains single component in decay kinetics about 23 ns.
However, the results of decay kinetics for ceramics is differ compare with single crystals. Three components of sum exponential functions were used for approximation luminescence decay kinetics. The luminescence decay of pressed ceramics contains long-lived components with decay time about 600 ns, which are characterized for autolocalized exciton. The presence of lifetime components of ~600 ns in the decay curves indicates that the luminescence spectra of the powders contain an exciton band along with the Ce3+ bands. While in single crystals the emission of a self-trapped exciton is almost completely suppressed already at 0.1 mol.% Ce3+. The retention of exciton luminescence in powders even at a high cerium concentration can be associated with the division of the nanoparticle volume into more complicated core-shell architecture with cerium gradient from surface to inside. The similar behavior was demonstrated in [55] for barium fluoride doped with Ce3+ ceramics. It was suggested that the slow decay constant (τ3) is not typical for Ce3+ ions. It means that the luminescence centers in BaF2: Ce are Ce3+ ions, but the excitation of the centers is effected partly by some electron (or hole) traps. In our case using high energy electron beam for pressed ceramics, a high proportion of free carries are captured by traps, and thereafter the carries escape from the traps and excite Ce3+ ions can be take place.
The fast components with decay times about 140–170 ns can be attributed to intermediate layer in nanocrystals with a low concentration of cerium, in which the probability of radiative annihilation of an exciton is comparable to the probability of excitation transfer from an exciton to cerium ions. The luminescence spectra of single crystals weakly depend on cerium ions concentration between 25 and 40%, while in pressed ceramics an increase in cerium concentration causes a redistribution of the luminescence intensities components and significant blue shift of the luminescence bands. This means that powders synthesized from aqueous solutions have a different defect structure compared to melt-grown single crystals. The blue shift of the luminescence bands indicates a relative enhance in 5d energy level when the cerium concentration increasing in the ceramics.
Finally, it was determined that BaF2: Ce samples exhibit nanosecond luminescence times that potentially suitable for embedding into diamond for an X-ray phosphor application.

5. Conclusions

A comparative analysis of the structural, spectral, and luminescence decay kinetic characteristics of the Ba1−xCexF2+x (x = 0.3–0.4) single-phase samples solid solution are carried out for single crystals and nanopowders. The cathodoluminescence spectra revealed a wide band in the range of 3.0–4.0 eV, which contains two components with a luminescence decay time about 23 ns in the case of single crystals, and sum of three exponential functions with a luminescence decay time of 27 ns, 140–170 ns, and ~600 ns in the case of powders, containing potassium. The fast decay time component is close to the lifetime of the excited state of the Ce3+ ions and promising for diamond–nanoparticle composite preparation.

Author Contributions

Conceptualization, S.V.K. and P.P.F.; methodology, S.V.K. and P.P.F.; software, D.T.V. and J.A.E.; investigation, D.T.V., A.A.A., D.S.Y., S.A.S. and J.A.E.; resources, D.T.V., A.A.A., D.S.Y., V.V.V., V.A.K., A.N.N. and S.A.S.; data curation, S.K.B.; writing original draft preparation, D.T.V., S.V.K. and P.P.F.; writing—review and editing, D.T.V., S.V.K. and P.P.F.; visualization, D.T.V. and S.A.S.; supervision, S.V.K.; project administration, S.V.K.; funding acquisition, S.V.K. All authors have read and agreed to the published version of the manuscript.

Funding

This research was funded by Russian Science Foundation, project 22-13-00401, https://rscf.ru/en/project/22-13-00401/ (accessed on 10 September 2023).

Institutional Review Board Statement

Not applicable.

Informed Consent Statement

Not applicable.

Data Availability Statement

Not applicable.

Acknowledgments

Optical and cathodoluminescent measurements were carried out in CSU NMNT TPU (RF MES project #075-15-2021-710).

Conflicts of Interest

The authors declare no conflict of interest.

References

  1. Zverev, V.A.; Krivopystova, E.V.; Tochilina, T.V. Optical Materials. Part 2; NIU ITMO: St. Petersburg, FL, USA, 2013. [Google Scholar]
  2. Blasse, G.; Grabmaier, B.C. Luminescent Materials; Springer: Berlin/Heidelberg, Germany, 1994; ISBN 978-3-540-58019-5. [Google Scholar]
  3. Woody, C.L.; Anderson, D.F. Calorimetry Using BaF2 with Photosensitive Wire Chamber Readout. Nucl. Instrum. Methods Phys. Res. Sect. A 1988, 265, 291–300. [Google Scholar] [CrossRef]
  4. Wisshak, K.; Käppeler, F.; Müller, H. Prototype Crystals for the Karlsruhe 4π Barium Fluoride Detector. Nucl. Instrum. Methods Phys. Res. Sect. A 1986, 251, 101–107. [Google Scholar] [CrossRef]
  5. Makhov, V.N.; Terekhin, M.A.; Kirm, M.; Molodtsov, S.L.; Vyalikh, D.V. A Comparative Study of Photoemission and Cross Luminescence from BaF2. Nucl. Instrum. Methods Phys. Res. Sect. A 2005, 537, 113–116. [Google Scholar] [CrossRef]
  6. Kamada, K.; Nawata, T.; Inui, Y.; Yanagi, H.; Sato, H.; Yoshikawa, A.; Nikl, M.; Fukuda, T. Czochralski Growth of 8 Inch Size BaF2 Single Crystal for a Fast Scintillator. Nucl. Instrum. Methods Phys. Res. Sect. A 2005, 537, 159–162. [Google Scholar] [CrossRef]
  7. Zhukovsky, K. Analysis of the Spectral Properties of Free Electron Lasers in X-RAY and Other Bands. Radiat. Phys. Chem. 2021, 189, 109698. [Google Scholar] [CrossRef]
  8. Jönsson, H.O.; Östlin, C.; Scott, H.A.; Chapman, H.N.; Aplin, S.J.; Tîmneanu, N.; Caleman, C. FreeDam—A Webtool for Free-Electron Laser-Induced Damage in Femtosecond X-ray Crystallography. High Energy Density Phys. 2018, 26, 93–98. [Google Scholar] [CrossRef]
  9. Borovykh, S.V.; Mityureva, A.A.; Smirnov, V.V. Diffraction Pattern Degradation Driven by Intense Ultrafast X-Ray Pulse for H2+. Phys. Lett. A 2021, 389, 127088. [Google Scholar] [CrossRef]
  10. Joo, Y.; Park, Y.; Heo, H.; Heo, J.; Park, S.-S.; Kim, S.-H.; Kim, K.-H.; Kang, H.-S.; Lee, H.-S.; Noh, S.; et al. Development of New S-Band SLED for PAL-XFEL Linac. Nucl. Instrum. Methods Phys. Res. Sect. A 2017, 843, 50–60. [Google Scholar] [CrossRef]
  11. Yang, H.; Kim, G.; Kang, H.-S. First Saturation of 14.5 KeV Free Electron Laser at PAL-XFEL. Nucl. Instrum. Methods Phys. Res. Sect. A 2018, 911, 51–54. [Google Scholar] [CrossRef]
  12. Ghaith, A.; Couprie, M.-E.; Oumbarek-Espinos, D.; Andriyash, I.A.; Massimo, F.; Clarke, J.A.; Courthold, M.; Bayliss, V.; Bernhard, A.; Trunk, M.; et al. Undulator Design for a Laser-Plasma-Based Free-Electron-Laser. Phys. Rep. 2021, 937, 1–73. [Google Scholar] [CrossRef]
  13. Jana, A.; Cho, S.; Patil, S.A.; Meena, A.; Jo, Y.; Sree, V.G.; Park, Y.; Kim, H.; Im, H.; Taylor, R.A. Perovskite: Scintillators, Direct Detectors, and X-Ray Imagers. Mater. Today 2022, 55, 110–136. [Google Scholar] [CrossRef]
  14. Ma, W.; Su, Y.; Zhang, Q.; Deng, C.; Pasquali, L.; Zhu, W.; Tian, Y.; Ran, P.; Chen, Z.; Yang, G.; et al. Thermally Activated Delayed Fluorescence (TADF) Organic Molecules for Efficient X-Ray Scintillation and Imaging. Nat. Mater. 2022, 21, 210–216. [Google Scholar] [CrossRef]
  15. Lu, L.; Sun, M.; Wu, T.; Lu, Q.; Chen, B.; Huang, B. All-Inorganic Perovskite Nanocrystals: Next-Generation Scintillation Materials for High-Resolution X-Ray Imaging. Nanoscale Adv. 2022, 4, 680–696. [Google Scholar] [CrossRef] [PubMed]
  16. Tono, K.; Togashi, T.; Inubushi, Y.; Sato, T.; Katayama, T.; Ogawa, K.; Ohashi, H.; Kimura, H.; Takahashi, S.; Takeshita, K.; et al. Beamline, Experimental Stations and Photon Beam Diagnostics for the Hard X-Ray Free Electron Laser of SACLA. New J. Phys. 2013, 15, 083035. [Google Scholar] [CrossRef]
  17. Sedov, V.; Kuznetsov, S.; Martyanov, A.; Ralchenko, V. Luminescent Diamond Composites. Funct. Diam. 2022, 2, 53–63. [Google Scholar] [CrossRef]
  18. Williams, R.T.; Kabler, M.N.; Hayes, W.; Stott, J.P. Time-Resolved Spectroscopy of Self-Trapped Excitons in Fluorite Crystals. Phys. Rev. B 1976, 14, 725–740. [Google Scholar] [CrossRef]
  19. Aleksandrov, Y.M.; Makhov, V.N.; Rodnyj, P.A.; Syrejshchikova, T.I.; Yakimenko, M.N. Intrinsic Luminescence of BaF2 at Pulsed Synchrotron Radiation Excitation. Fiz. Tverd. Tela 1984, 26, 2865–2867. [Google Scholar]
  20. Schotanus, P.; van Eijk, C.W.E.; Hollander, R.W.; Pijpelink, J. Temperature Dependence of BaF2 Scintillation Light Yield. Nucl. Instrum. Methods Phys. Res. Sect. A 1985, 238, 564–565. [Google Scholar] [CrossRef]
  21. Hamada, M.M. Auger-Free Luminescence of the BaF2:Sr, BaF2:MgF2 and CsBr:LiBr Crystals under Excitation of VUV Photons and High-Energy Electrons. Nucl. Instrum. Methods Phys. Res. Sect. A 1994, 340, 524–539. [Google Scholar] [CrossRef]
  22. Dorenbos, P.; Visser, R.; Dool, R.; Andriessen, J.; van Eijk, C.W.E. Suppression of Self-Trapped Exciton Luminescence in La3+- and Nd3+ -Doped BaF2. J. Phys. Condens. Matter 1992, 4, 5281. [Google Scholar] [CrossRef]
  23. Sobolev, B.P.; Krivandina, E.A.; Derenzo, S.E.; Moses, W.W.; West, A.C. Suppression of BaF2 Slow Component of X-Ray Luminescence in Non-Stoichiometric Ba0.9R0.1F2.1 Crystals (R = rare Earth Element). MRS Online Proc. Libr. (OPL) 1994, 348, 277. [Google Scholar] [CrossRef]
  24. Sobolev, B.P. Multicomponent Crystals Based on Heavy Metal Fluorides for Radiation Detectors; Institut d’Estudis Catalans: Barcelona, Spain, 1994; ISBN 978-84-7283-261-9. [Google Scholar]
  25. Dorenbos, P.; Visser, R.; Hollander, R.; Eijk, C.W.E.; Hartog, H. The Effects of La3+ and Ce3+ Dopants on the Scintillation Properties of BaF2 Crystals. Radiat. Eff. Defects Solids 1991, 119–121, 87–92. [Google Scholar] [CrossRef]
  26. Van Eijk, C.W.E. Inorganic-Scintillator Development. Nucl. Instrum. Methods Phys. Res. Sect. A 2001, 460, 1–14. [Google Scholar] [CrossRef]
  27. Han, H.; Zhang, Z.; Weng, X.; Liu, J.; Guan, X.; Zhang, K.; Li, G. Development of a Fast Radiation Detector Based on Barium Fluoride Scintillation Crystal. Rev. Sci. Instrum. 2013, 84, 073503. [Google Scholar] [CrossRef] [PubMed]
  28. Biasini, M.; Cassidy, D.B.; Deng, S.H.M.; Tanaka, H.K.M.; Mills, A.P. Suppression of the Slow Component of Scintillation Light in BaF2. Nucl. Instrum. Methods Phys. Res. Sect. A 2005, 553, 550–558. [Google Scholar] [CrossRef]
  29. Visser, R.; Dorenbos, P.; van Eijk, C.W.E.; Meijerink, A.; Blasse, G.; den Hartog, H.W. Energy Transfer Processes Involving Different Luminescence Centres in BaF2:Ce. J. Phys. Condens. Matter 1993, 5, 1659. [Google Scholar] [CrossRef]
  30. Wojtowicz, A.J.; Szupryczynski, P.; Glodo, J.; Drozdowski, W.; Wisniewski, D. Radioluminescence and Recombination Processes in BaF2:Ce. J. Phys. Condens. Matter 2000, 12, 4097. [Google Scholar] [CrossRef]
  31. Janus, S.; Wojtowicz, A.J. Scintillation Light Yield of BaF2:Ce. Opt. Mater. 2009, 31, 523–526. [Google Scholar] [CrossRef]
  32. Batygov, S.K.; Fedorov, P.P.; Kuznetsov, S.V.; Osiko, V.V. Luminescence of Ba1–xLaxF2+x: Ce3+ Crystals. Dokl. Phys. 2016, 61, 50–54. [Google Scholar] [CrossRef]
  33. Rodnyĭ, P.A.; Gain, S.D.; Mironov, I.A.; Garibin, E.A.; Demidenko, A.A.; Seliverstov, D.M.; Gusev, Y.I.; Fedorov, P.P.; Kuznetsov, S.V. Spectral-Kinetic Characteristics of Crystals and Nanoceramics Based on BaF2 and BaF2:Ce. Phys. Solid State 2010, 52, 1910–1914. [Google Scholar] [CrossRef]
  34. Luo, J.; Ye, L.; Xu, J. Preparation and Properties of Ce3+:BaF2 Transparent Ceramics by Vacuum Sintering. J. Nanosci. Nanotechnol. 2016, 16, 3985–3989. [Google Scholar] [CrossRef] [PubMed]
  35. Murin, I.V.; Gunsser, W. Relaxation Methods for the Study of Ion Transport in Halide Systems. Solid State Ion. 1992, 53–56, 837–842. [Google Scholar] [CrossRef]
  36. Sobolev, B.P. The Rare Earth Trifluorides: The High Temperature Chemistry of the Rare Earth Trifluorides; Institut d’Estudis Catalans: Barcelona, Spain, 2000; ISBN 978-84-7283-518-4. [Google Scholar]
  37. Sobolev, B.P.; Tkachenko, N.L. Phase Diagrams of BaF2-(Y, Ln)F3 Systems. J. Less Common Met. 1982, 85, 155–170. [Google Scholar] [CrossRef]
  38. Chen, X.; Wu, Y. High Concentration Ce3+ Doped BaF2 Transparent Ceramics. J. Alloys Compd. 2020, 817, 153075. [Google Scholar] [CrossRef]
  39. Kieser, M.; Greis, O. Preparation and Properties of Fluorite-Related Superstructure Phases Ba4RE3F17 with RE = Ce-Nd, Sm-Lu, and Y. Z. Fuer Anorg. Und Allg. Chem. 1980, 469, 164–171. [Google Scholar] [CrossRef]
  40. Yasyrkina, D.S.; Kuznetsov, S.V.; Alexandrov, A.A.; Batygov, S.K.; Voronov, V.V.; Fedorov, P.P. Preparation and X-Ray Luminescence of Ba4±xCe3±xF17±x Solid Solutions. Nanosyst. Phys. Chem. Math. 2021, 12, 505–511. [Google Scholar] [CrossRef]
  41. Mayakova, M.N.; Voronov, V.V.; Iskhakova, L.D.; Kuznetsov, S.V.; Fedorov, P.P. Low-Temperature Phase Formation in the BaF2-CeF3 System. J. Fluorine Chem. 2016, 187, 33–39. [Google Scholar] [CrossRef]
  42. Kuznetsov, S.V.; Fedorov, P.P.; Voronov, V.V.; Samarina, K.S.; Ermakov, R.P.; Osiko, V.V. Synthesis of Ba4R3F17 (R Stands for Rare-Earth Elements) Powders and Transparent Compacts on Their Base. Russ. J. Inorg. Chem. 2010, 55, 484–493. [Google Scholar] [CrossRef]
  43. Karbowiak, M.; Cichos, J. Does BaYF5 Nanocrystals Exist?—The BaF2-YF3 Solid Solution Revisited Using Photoluminescence Spectroscopy. J. Alloys Compd. 2016, 673, 258–264. [Google Scholar] [CrossRef]
  44. Alexandrov, V.B.; Otroshchenko, L.P.; Fykin, L.E.; Bydanov, N.N.; Sobolev, B.P. Defect Structure of Saturated Solid Solution Ba0.5Ce0.5F2.5 by Single Crystal Neutron Diffraction Study. Sov. Phys. Crystallogr. 1989, 34, 896–899. [Google Scholar]
  45. Otroshchenko, L.P.; Muradyan, L.A.; Sobolev, B.P.; Sarin, B.A.; Alexandrov, V.B. Neutron Diffraction Study of the Features of Fluorine Ions Incorporation into Ba1−xRxF2+x Solid Solutions. Butlletí Soc. Catalanes Física Química Matemàtiques Tecnol. 1991, 12, 383–391. [Google Scholar]
  46. Sobolev, B.P.; Golubev, A.M.; Otroshchenko, L.P.; Molchanov, V.N.; Zakalyukin, R.M.; Ryzhova, E.A.; Herrero, P. Ba1−xRxF2+x Phases (R = Gd-Lu) with Distorted Fluorite-Type Structures—Products of Crystallization of Incongruent Melts in the BaF2-RF3 Systems (R = Gd-Lu). III. Defect Ba0.75Lu0.25F2.25 Structure. A New {Lu8[Ba6F71]} Supercluster of Defects. Crystallogr. Rep. 2003, 48, 944–952. [Google Scholar] [CrossRef]
  47. Sulyanova, E.A.; Karimov, D.N.; Sobolev, B.P. Displacements in the Cationic Motif of Nonstoichiometric Fluorite Phases Ba1−xRxF2+x as a Result of the Formation of {Ba8[R6F68–69]} Clusters: III. Defect Cluster Structure of the Nonstoichiometric Phase Ba0.69La0.31F2.31 and Its Dependence on Heat Treatment. Crystals 2021, 11, 447. [Google Scholar] [CrossRef]
  48. Bevan, D.J.M.; Greis, O.; Strähle, J. A New Structural Principle in Anion-Excess Fluorite-Related Superlattices. Acta Crystallogr. Sect. A 1980, 36, 889–890. [Google Scholar] [CrossRef]
  49. Kazanskii, S.A.; Ryskin, A.I.; Nikiforov, A.E.; Zaharov, A.Y.; Ougrumov, M.Y.; Shakurov, G.S. EPR Spectra and Crystal Field of Hexamer Rare-Earth Clusters in Fluorites. Phys. Rev. B 2005, 72, 014127. [Google Scholar] [CrossRef]
  50. Maksimov, B.A.; Solans, K.; Dudka, A.P.; Genkina, E.A.; Font-Badria, M.; Buchinskaya, I.I.; Loshmanov, A.A.; Golubev, A.M.; Simonov, V.I.; Font-Altaba, M. The Fluorite-Matrix-Based Ba4R3F17 (R = Y, Yb) Crystal Structure. Ordering of Cations and Specific Features of the Anionic Motif. Crystallogr. Rep. 1996, 41, 50–57. [Google Scholar]
  51. Kuznetsov, S.V.; Fedorov, P.P. Morphological Stability of Solid-Liquid Interface during Melt Crystallization of M1−xRxF2+x Solid Solutions. Inorg. Mater. 2008, 44, 1434–1458. [Google Scholar] [CrossRef]
  52. Zhang, K.; Liu, H.-Z.; Wu, Y.-T.; Hu, W.-B. Co-Precipitation Synthesis and Luminescence Behavior of Ce-Doped Yttrium Aluminum Garnet (YAG:Ce) Phosphor: The Effect of Precipitant. J. Alloys Compd. 2008, 453, 265–270. [Google Scholar] [CrossRef]
  53. Pan, Y.; Wu, M.; Su, Q. Comparative Investigation on Synthesis and Photoluminescence of YAG:Ce Phosphor. J. Mater. Sci. Eng. B 2004, 106, 251–256. [Google Scholar] [CrossRef]
  54. Garcia-Guinea, J.; Correcher, V.; Can, N.; Garrido, F.; Townsend, P.D. Cathodoluminescence Spectra Recorded from Surfaces of Solids with Hydrous Molecules. J. Electron Spectrosc. Relat. Phenom. 2018, 227, 1–8. [Google Scholar] [CrossRef]
  55. Demidenko, A.A.; Garibin, E.A.; Gain, S.D.; Gusev, Y.I.; Fedorov, P.P.; Mironov, I.A.; Michrin, S.B.; Osiko, V.V.; Rodnyi, P.A.; Seliverstov, D.M.; et al. Scintillation Parameters of BaF2 and BaF2:Ce3+ Ceramics. Opt. Mater. 2010, 32, 1291–1293. [Google Scholar] [CrossRef]
Figure 1. BaF2-CeF3 phase diagram [37]. Phase F—Ba1−xCexF2+x solid solution, phase T—Ce1−yBayF3−y solid solution, L—melt.
Photonics 10 01057 g001
Figure 2. Fluorite structure (a), R6F37 cluster (b), incorporation of the R6F37 cluster into the fluorite lattice (c), incorporation of the reversed Ba8[R6F68–69] cluster into the fluorite lattice (d). Polyhedra of rare-earth cations are shaded.
Photonics 10 01057 g002
Figure 3. Ba1−xCexF2+x single crystals: 1—Ba0.75Ce0.25F2.25, 2—Ba0.70Ce0.30F2.30, 3—Ba0.675Ce0.325F2.325, 4—Ba0.65Ce0.35F2.35, 5—Ba0.60Ce0.40F2.40 (nominal compositions).
Photonics 10 01057 g003
Figure 4. X-ray powder diffraction patterns of solid solutions BaF2-CeF3 (x = 25–40 mol.%, nominal composition) after single crystal grinding.
Photonics 10 01057 g004
Figure 5. The absorption spectra of Ba1−xCexF2+x (x = 0.25–0.40, nominal composition) single crystals with variable cerium concentrations.
Photonics 10 01057 g005
Figure 6. Cathodoluminescence spectra of Ba1−xCexF2+x (x = 0.25–0.40, nominal composition) single crystals.
Photonics 10 01057 g006
Figure 7. Luminescence decay kinetics for Ba1−xCexF2+x (x = 0.25–0.40, nominal composition) single crystals upon 3.4, 3.6, and 3.8 eV excitation.
Photonics 10 01057 g007
Figure 8. X-ray powder diffraction patterns of powder samples (nominal composition).
Photonics 10 01057 g008
Figure 9. Cathodoluminescence spectra (a,b) and luminescence decay kinetics (c,d) of Ba0.7Ce0.3F2.3 and Ba0.6Ce0.4F2.4 nominal compositions, respectively.
Photonics 10 01057 g009
Figure 10. Integrated cathodoluminescence spectra of Ba1−xCexF2+x (x = 0.30–0.40, nominal composition) pressed ceramic samples.
Photonics 10 01057 g010
Table 1. Composition, lattice parameters, and X-ray density of studied Ba1−xCexF2+x samples.
Number of SampleNominal
Composition
Real Composition by EDXLattice Parameter a, ÅD, nmX-ray Density (d), g/cm3
Single crystals
1Ba0.75Ce0.25F2.25Ba0.762Ce0.238F2.238
(x = 0.238 ± 0.004)
Thickness—14 mm
6.1024 (1)-5.28
2Ba0.70Ce0.30F2.30Ba0.716Ce0.284F2.284
(x = 0.284 ± 0.002)
Thickness—13 mm
6.0865 (1)-5.36
3Ba0.675Ce0.325F2.325Ba0.689Ce0.311F2.311
(x = 0.311 ± 0.006)
Thickness—11 mm
6.0785 (1)-5.40
4Ba0.65Ce0.35F2.35Ba0.662Ce0.338F2.338
(x = 0.338 ± 0.005)
Thickness—10 mm
6.0704 (1)-5.48
5Ba0.60Ce0.40F2.40Ba0.616Ce0.384F2.384
(x = 0.384 ± 0.002)
Thickness—11 mm
6.0572 (1)-5.50
Powders
6Ba0.70Ce0.30F2.30Ba0.645Ce0.355F2.3556.0711 (4)11.6 (2)5.43
7Ba0.65Ce0.35F2.35Ba0.594Ce0.398K0.008F2.3906.0596 (4)11.9 (1)5.46
8Ba0.60Ce0.40F2.40Ba0.564Ce0.430K0.007F2.4256.0506 (4)11.9 (1)5.52
Table 2. Cathodoluminescence characteristics (position and relative area weight of the Gaussian band set) of Ba1−xCexF2+x single crystals.
Number of SampleCharacteristicsA1A2A3
1Position (eV)4.153.693.41
Relative Area Weight0.0060.2250.300
2Position (eV)4.153.713.42
Relative Area Weight0.0070.2000.225
3Position (eV)4.153.723.42
Relative Area Weight0.0030.2500.250
4Position (eV)4.153.733.45
Relative Area Weight0.0080.2250.250
5Position (eV)4.153.763.49
Relative Area Weight0.0020.2250.225
Disclaimer/Publisher’s Note: The statements, opinions and data contained in all publications are solely those of the individual author(s) and contributor(s) and not of MDPI and/or the editor(s). MDPI and/or the editor(s) disclaim responsibility for any injury to people or property resulting from any ideas, methods, instructions or products referred to in the content.

