Article

Analysis and Prediction of Image Quality Degradation Caused by Diffraction of Infrared Optical System Turning Marks

1
Changchun Institute of Optics, Fine Mechanics and Physics, Chinese Academy of Sciences, Changchun 130033, China
2
University of Chinese Academy of Sciences, Beijing 100049, China
3
State Key Laboratory of Applied Optics, Changchun 130033, China
4
Key Laboratory of Optical System Advanced Manufacturing Technology, Chinese Academy of Sciences, Changchun 130033, China
*
Author to whom correspondence should be addressed.
Photonics 2023, 10(8), 937; https://doi.org/10.3390/photonics10080937
Submission received: 17 July 2023 / Revised: 8 August 2023 / Accepted: 11 August 2023 / Published: 17 August 2023

Abstract

:
This paper addresses the issue of reduced image quality due to annular turning marks formed by single-point diamond turning (SPDT) during the processing of metal-based mirrors and infrared lenses. An ideal single-point diamond turning marks diffraction action model to quantitatively analyze the impact of turning marks diffraction on imaging quality degradation is proposed. Based on this model, a fast estimation algorithm for the optical modulation transfer function of the system under turning marks diffraction (TMTF) is proposed. The results show that the TMTF algorithm achieves high computational accuracy, with a relative error of only 3% in diffraction efficiency, while being hundreds of times faster than rigorous coupled wave analysis (RCWA). This method is significant for reducing manufacturing costs and improving production efficiency, as it avoids the problem of being unable to compute large-size optical systems due to computational resource and time constraints.

1. Introduction

The traditional processing of optical materials uses optical cold processing, which has disadvantages such as tedious processing steps and long cycles, and can only process rotationally symmetric surfaces. Moreover, the consistency of processed lenses is poor, which is not conducive to quality control for mass production. Ultra-precision turning technology can completely overcome the shortcomings of traditional processing. By using diamond tools for single-point cutting, infrared materials (such as germanium and silicon) can be directly machined into mirror surfaces with shapes that meet the requirements of various infrared optical applications, significantly improving the production efficiency and precision of infrared lenses [1,2]. The development of ultra-precision turning technology for infrared optical parts, non-spherical metal-based reflectors, and other precision metal optical components has a milestone significance for the development of the defense industry.
However, single-point diamond turning leaves residual turning marks on the surface, which may introduce diffraction effects that could degrade the imaging performance of the optical system. Tan et al. [3] completed the equivalent modeling and verification of a high-steepness and lightweight elliptical aluminum mirror, and Zhang et al. [4] realized the whole process of manufacturing aluminum mirrors with composite surface additive manufacturing, and found that when the diamond tip passes through the pits on the surface of the mirror blank, vibrations occur and leave tiny scratches, which cause strong scattering of incident light, reducing the signal-to-noise ratio of the system. The traditional method used to eliminate this effect is polishing, but for a flat mirror with a diameter of Φ 100 mm, it takes nearly a day to roughly remove the turning marks. Therefore, research on the imaging quality of systems under diffraction caused by turning marks on surfaces machined by single-point diamond turning has significant implications for improving efficiency and reducing the cost of optical material processing.
In order to explain the influence of high-order diffraction light on the imaging quality of mirror surfaces machined by SPDT, researchers have made great efforts in both theory and experiments. In 1975, Church et al. [5] believed that the residual surface roughness of diamond-turned optical surfaces contains important periodic components, and they used Rayleigh–Rice vector scattering theory to explore the performance of diamond-turned optical devices. However, this theory is only applicable to periodically rough surfaces with vertical amplitudes far less than the wavelength of light. Wu et al. [6], based on vector diffraction theory, characterized the diffraction optical properties of diamond-turned surfaces and revealed the distribution characteristics of diffraction spots using the finite-difference time-domain method. They demonstrated that the height and spacing of nano-scale surface morphology have different effects on the intensity and angle of diffraction spots. In 2019, Harvey [7] proposed and developed a general Harvey–Shack surface scattering theory based on linear system theory. They suggested that low spatial frequency components, i.e., shape accuracy, cause wavefront aberration, while high spatial frequency components, i.e., surface roughness, redistribute radiation energy through wide-angle diffraction effects. Zhou et al. [8] studied the reduction of optical performance caused by contour errors transferred from molds during precision glass molding. They qualitatively analyzed the effect of mold turning marks on optical defects and demonstrated that turning marks can cause diffraction fringes. Yang et al. [9] proposed a mathematical model to reveal the relationship between the diffraction efficiency of harmonic diffraction optical elements, tool radius, feed rate, and other factors for evaluating the diffraction efficiency of diamond-turned harmonic diffraction optical elements. Meanwhile, some scholars have conducted research from the perspective of medium spatial frequency errors. In 2000, Youngworth et al. [10] proposed a method for viewing surface errors as perturbations to the nominal surface profile. The methods enabled simple, rough predictions of the impact of spatial frequency errors on various optical property measurements. Two decades later, Liang et al. [11,12] studied the scope of application of the perturbation method, proposed an error estimation method, and obtained a rule of thumb for the accuracy of the perturbation method.
Research on analyzing the diffraction characteristics of diamond turning surfaces has been carried out from experimental perspectives. In 2010, Li et al. [13] studied the properties of diamond machined surfaces and found that the normalized primary diffracted light was caused by turning marks, which decreased as the machining marks degraded. Additionally, they indicated that slow tool servo technology could achieve high-quality optical surfaces. In 2014, Fang et al. [14] theoretically analyzed the relationship between surface cleanliness, optical defects, and turning conditions for a turning reflector mirror using interference and integration methods. In 2015, Yin et al. [15] directly polished an aluminum mirror surface to remove turning marks, thereby improving the surface accuracy at the cost of longer polishing time. Wang et al. [16] analyzed the spiral sine trajectory airbag polishing removal of SPDT turning marks, proposing a spiral sine polishing trajectory. The surface form accuracy PV value changed from 0.449 μ m before polishing to 0.35 μ m after polishing, but the efficiency requirement decreased while the trajectory control accuracy requirement increased. Furthermore, in 2021, Du et al. [17,18] investigated the surface roughness evolution mechanism during ion beam sputtering on aluminum-based optical surfaces, combined with ion beam sputtering and smooth polishing, and achieved efficient removal of machining marks. They reduced the surface roughness from 4.3 nm to 3.7 nm while doubling the removal efficiency, although it still required multiple iterations over several hours. Chen et al. [19] proposed a model for predicting the surface roughness, R a , in single-point diamond turning based on the analysis of relative motion and expansion effects. Compared with previous models, this model is closer to the actual turning process and shows higher surface roughness prediction accuracy. In 2018, He et al. [20] established a three-dimensional surface morphology model for single-point diamond turning, and simulated the diffraction effect of SPDT caused by tool edge ripple using rigorous coupled wave analysis in 2019. They proved that as the tool edge ripple worsened, the diffraction efficiency of mirror-like light decreased, but high-order diffracted light was horizontally concentrated on the receiving screen [21]. They also proposed a new method to directly eliminate the diffraction effect in diamond turning by controlling tool edge quality, material defects, and processing parameters [22,23]. Sheng et al. [24] obtained the relationship between scattering theory and the micro-topography model of turning surfaces and adjusted the turning parameters to control the primary diffraction intensity to be less than 0.01% of the incident intensity, thereby producing an “effect-free” optical surface.
At present, related researches mainly focus on the analysis of the three-dimensional morphology and diffraction characteristics of turning marks, as well as experimental verification of turning marks removal. However, there is currently no related research that provides quantitative estimates of the image quality degradation caused by turning marks diffraction. The impact of turning marks textures on the imaging quality of optical systems can only be addressed after processing by blindly polishing the surface using methods such as airbag polishing, which not only increases processing costs but may also cause secondary damage to the surface. If the impact of turning marks on image quality degradation is not severe, the polishing process can actually be omitted, saving a significant amount of time and cost.
To address the lack of analysis methods for turning marks diffraction-induced image quality degradation, this paper uses the linear theory of optical systems [25] and takes advantage of the local linearity of turning marks gratings, estimating the impact of turning marks diffraction on image quality from the worst-case scenario where the turning mark structure perfectly matches the theoretical residual height, forming defect-free diffractive gratings with shape features. We develop a turning marks MTF (TMTF) algorithm, which can quickly estimate the maximum impact of SPDT turning marks diffraction on MTF image quality degradation. This allows us to obtain processing tolerances that meet specified image quality requirements during the design phase, integrating turning marks diffraction-induced tolerances into the optical design process [26].

2. Methods

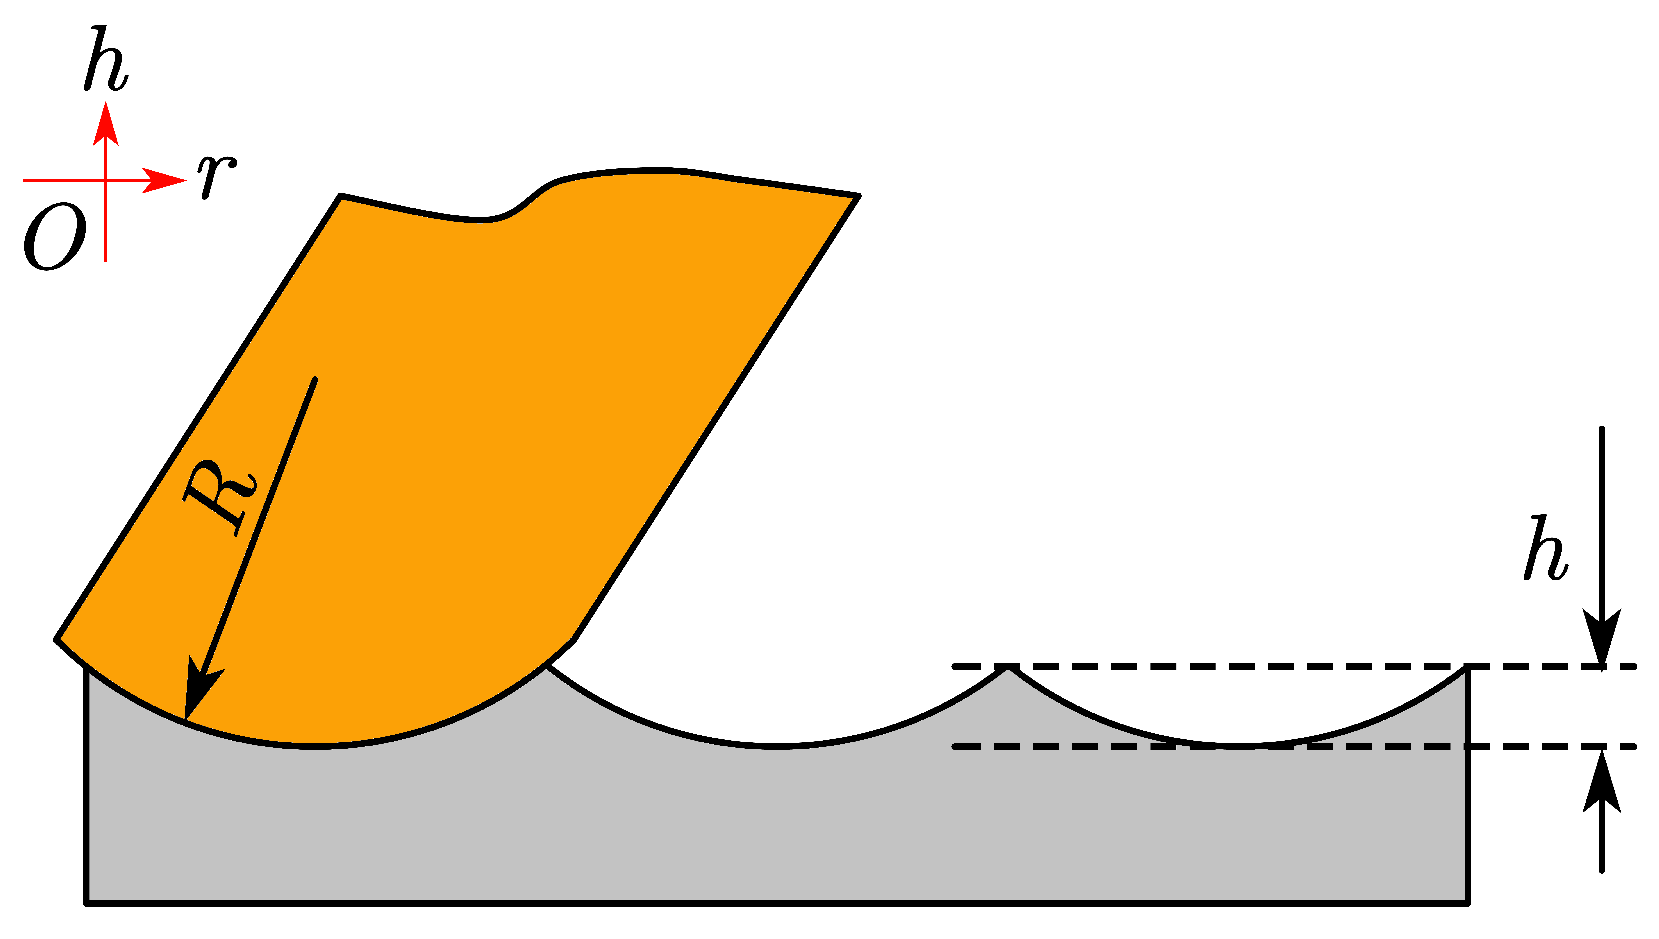
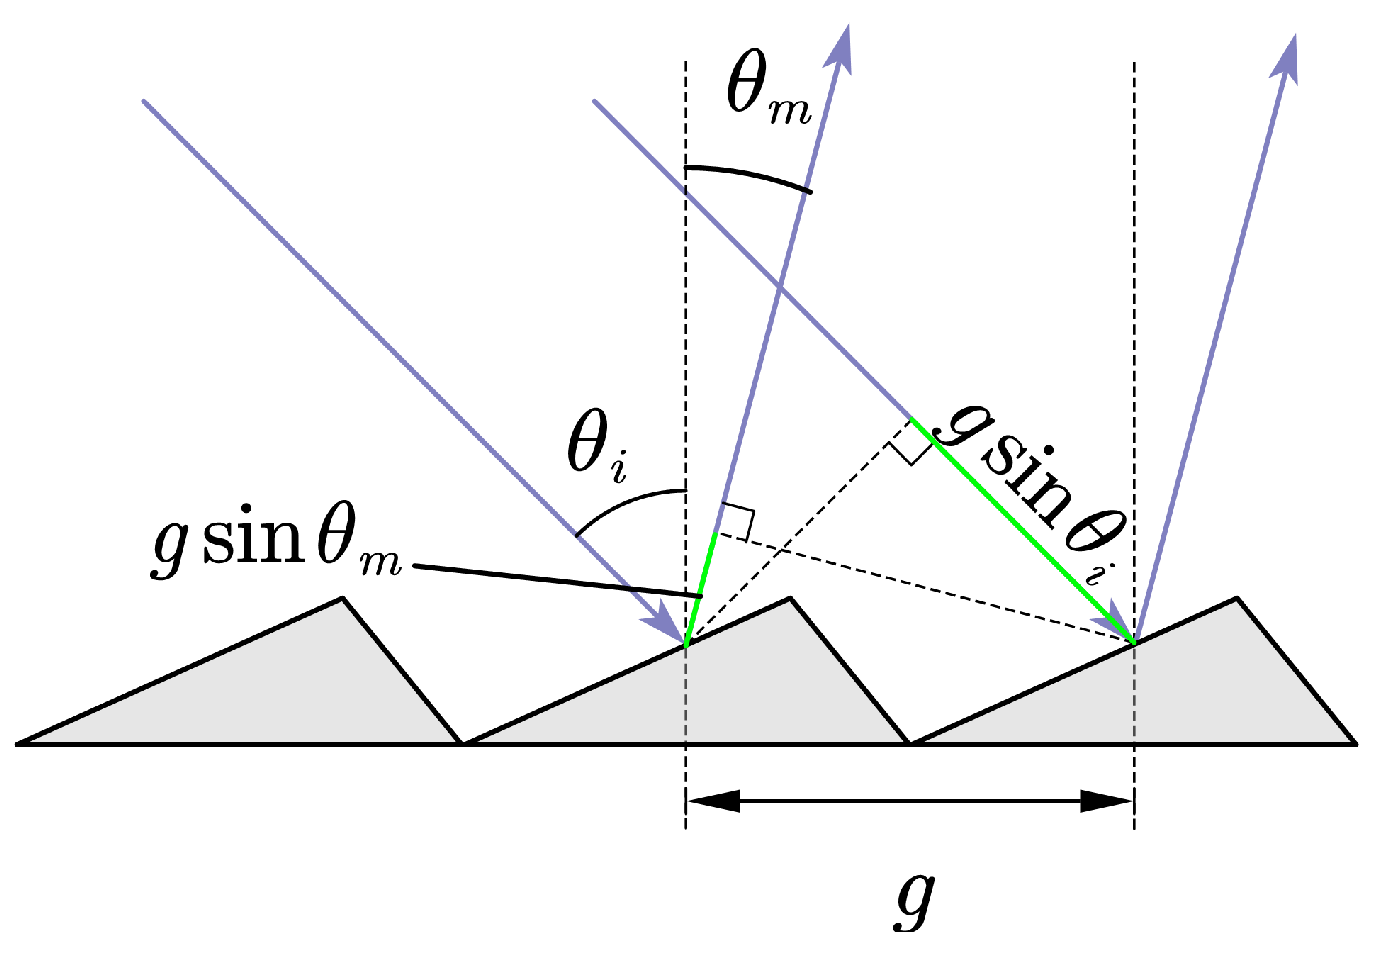
2.1. Modeling of Turning Marks Diffraction

In order to quantitatively analyze the effect of turning marks diffraction on the degradation of imaging quality, an ideal single-point diamond turning marks diffraction model is established in this paper. Based on the linear theory of the optical system, the local turning marks annular grating is regarded as a linear grating, and the phase polynomial is used to characterize it. Then, the incident light is diffracted to the corresponding order and the diffraction efficiency is calculated.
When diamond tools are used to scratch glass or metal surfaces, the cutting tool generally moves along an Archimedean spiral, forming grooves with concentric circular rings. The feed rate of the tool is very slow, and for aluminum, the feeding amount is usually 2∼3 μ m, while for infrared glass such as germanium the feeding amount is usually 0.5∼1 μ m, which is comparable to the grating period. In an ideal state, when a circular arc edge single-point diamond cutting tool for ultra-precision machining is used, contour peaks and valleys will be formed on the machined workpiece surface. The expression for the maximum distance, h m a x , between the contour peaks and valleys is as follows:
h m a x = F 2 8 R
where F is the cutting feed amount, R is the radius of the tool tip’s circular arc edge, and h m a x represents the theoretical residual height or theoretical roughness. The process of leaving turning marks on the surface during cutting is shown in Figure 1.
Constructing the turning marks profile, the height distribution of the turning marks in the radial direction is given by:
h ( r ) = 1 r % F h m a x
where r = x 2 + y 2 > 0 represents the radial coordinate of the machined surface, and % denotes the modulo operation. Clearly, this type of turning marks profile forms a ring grating structure on the substrate with a certain curvature, similar to a concave grating structure, and the grating locally can be regarded as a linear grating. When light is incident on the optical surface, according to the grating equation, under the diffraction effect of the turning marks, the light will produce diffracted rays on both sides of the specular ray with a certain angle deviation. When the diffracted rays continue to propagate to the image plane, they will cause interference and degrade the imaging performance of the optical system.
An optical system can be regarded as a linear system, i.e.,
L a 1 f 1 x + a 2 f 2 x = a 1 g 1 x + a 2 g 2 x
as a result, the image formed by an optical system under turning marks diffraction can be decomposed into a linear superposition of the ideal image and the diffracted image formed by the local linear grating at different wavelengths and orders. This decomposition allows for the separation of the ideal image from the effects of turning marks diffraction, which is a crucial step in accurately characterizing the performance of optical systems. By analyzing the contribution of each component, it is possible to optimize the design of the system and mitigate the negative impacts of turning marks diffraction. Its effectiveness highlights the importance of understanding and properly accounting for turning marks diffraction in the design and evaluation of optical systems.
Consideration of turning marks diffraction should be carried out after completing the initial structural design and image quality optimization. Based on the optimized design of the optical system, the surfaces that may cause turning marks diffraction are modeled as phase gratings on the optical surface. The annular grating on the entire optical surface can be locally regarded as a straight grating, in which fixed phase differences are introduced between adjacent periods. When there is no significant change in the gradient of the optical surface, it can be approximated that the grating introduces a small tilted phase relative to the 0th order diffracted light, which is equivalent to adding ±1st order diffracted light. Therefore, the additional phase caused by the turning marks diffraction on the incident light can be expressed as
φ = f r
where f is the function that describes the effect of the grating on the phase. It is possible to consider a lens with turning marks on its surface as a phase grating with turning marks diffraction effects on a smooth lens surface. Since the feed speed of the turning tool is in the range of only 0.5∼2 μ m, it can be assumed that the diamond tool advances uniformly in each circle. This means that the radial period of the annular grating remains constant. However, in reality, the tool mark surface can be modeled as a case where the grating period changes along the radial direction, or even a case of non-rotational symmetry. This approach is useful when dealing with surfaces where the sagittal height changes drastically. For the sake of simplicity, we assume a constant radial period in this study. When the plane wave is incident along the optical axis, the additional phase introduced is
φ = C r
where C is the coefficient of the phase polynomial and is a constant that is related to the machining feed rate.
As shown in Figure 2, the local annular grating caused by turning marks diffraction can be treated as a linear grating, which introduces a fixed phase difference between adjacent periods,
φ = 2 π λ n g sin θ i ± sin θ m
where λ represents the wavelength of the incident light, n is the refractive index of the medium in which the optical surface is immersed, typically air n = 1 , g is the grating period, θ i and θ m are the incident and diffraction angles, respectively, and m is the diffraction order. The positive diffraction order is used for the case where the incident and diffracted rays are on the same side of the grating, while the negative diffraction order is used for the case where they are on opposite sides.
In three-dimensional Cartesian coordinates, the diffraction effect of the grating on an incident light ray can be expressed as:
α = α + λ 2 π φ x β = β + λ 2 π φ y
where α and β are the direction cosines of the incident ray, while α and β are those of the outgoing ray. Due to the rotational symmetry of the turning marks grating, only a one-dimensional direction needs to be considered. Here, the x-direction is taken as an example.
According to the grating equation, when the light ray is normally incident on the grating,
g sin θ = m λ
by combining Equations (7) and (8), the following relationship is obtained:
sin θ = m λ g cos θ = Δ α = λ 2 π · φ x
Therefore, the coefficient C of the phase polynomial is given by:
C = φ x = g 2 m 2 λ 2 g 2 · 4 π 2 λ 2
which provides a 1st order coefficient for the phase polynomial that describes the characteristics of the turning marks grating.
After assigning grating properties to the surface of interest, it needs to be analyzed as part of an optical system. Since high-order diffraction energy is extremely low, only the −1st, 0th, and +1st orders of diffracted light need to be considered. Among them, the 0th order is in the same direction as normal reflection or refraction light, while the −1st and +1st orders are slightly deviated. For the diffraction surface characterized by phase, the outgoing ray direction after passing through the diffraction surface can be calculated using Equation (7).
The coefficient of the grating phase polynomial determines the direction of light rays, while another important parameter is the diffraction efficiency of the grating. The diffraction efficiency, which is the percentage of diffracted light at a specified order, is a function of wavelength and depends on the incidence angle or position in the field of view. The diffraction efficiency of the grating can generally be changed by adjusting the grating structure function. The theoretical residual height of turning marks grooves in the radial direction can be modeled as a periodic triangle function, Λ ( 2 x / F ) [27]:
Λ ( 2 x / F ) = h m a x ( 1 | x | ) , | x | < ( F / 2 ) 0 , | x | > ( F / 2 )
After diamond-tipped scribing of the substrate material, a glittering grating is formed on the groove surface [28], which diffracts incident light into many different orders. At this point, not only the design of the diffraction order, but also the light distribution in other diffraction orders needs to be considered. The energy of light in different diffraction orders depends on the phase introduced by each small facet on the glittering surface. The maximum diffraction efficiency occurs when the specular ray direction and the diffracted ray direction coincide. For the specific wavelength and field of view, an optical system containing a grooved surface can be designed to achieve a diffraction efficiency approaching 100 % , with the diffraction efficiency of the mth order given by the following equation:
η m = sin π τ m π τ m 2
where τ = h m a x n 1 cos θ 1 n 2 cos θ 2 / λ , n 1 is the refractive index of the incident medium, n 2 is the refractive index of the diffracted medium, λ is the wavelength, θ 1 is the angle of incidence, and θ 2 is the diffraction angle. If λ 0 / m = g , the diffraction efficiency is equal to 100 % .

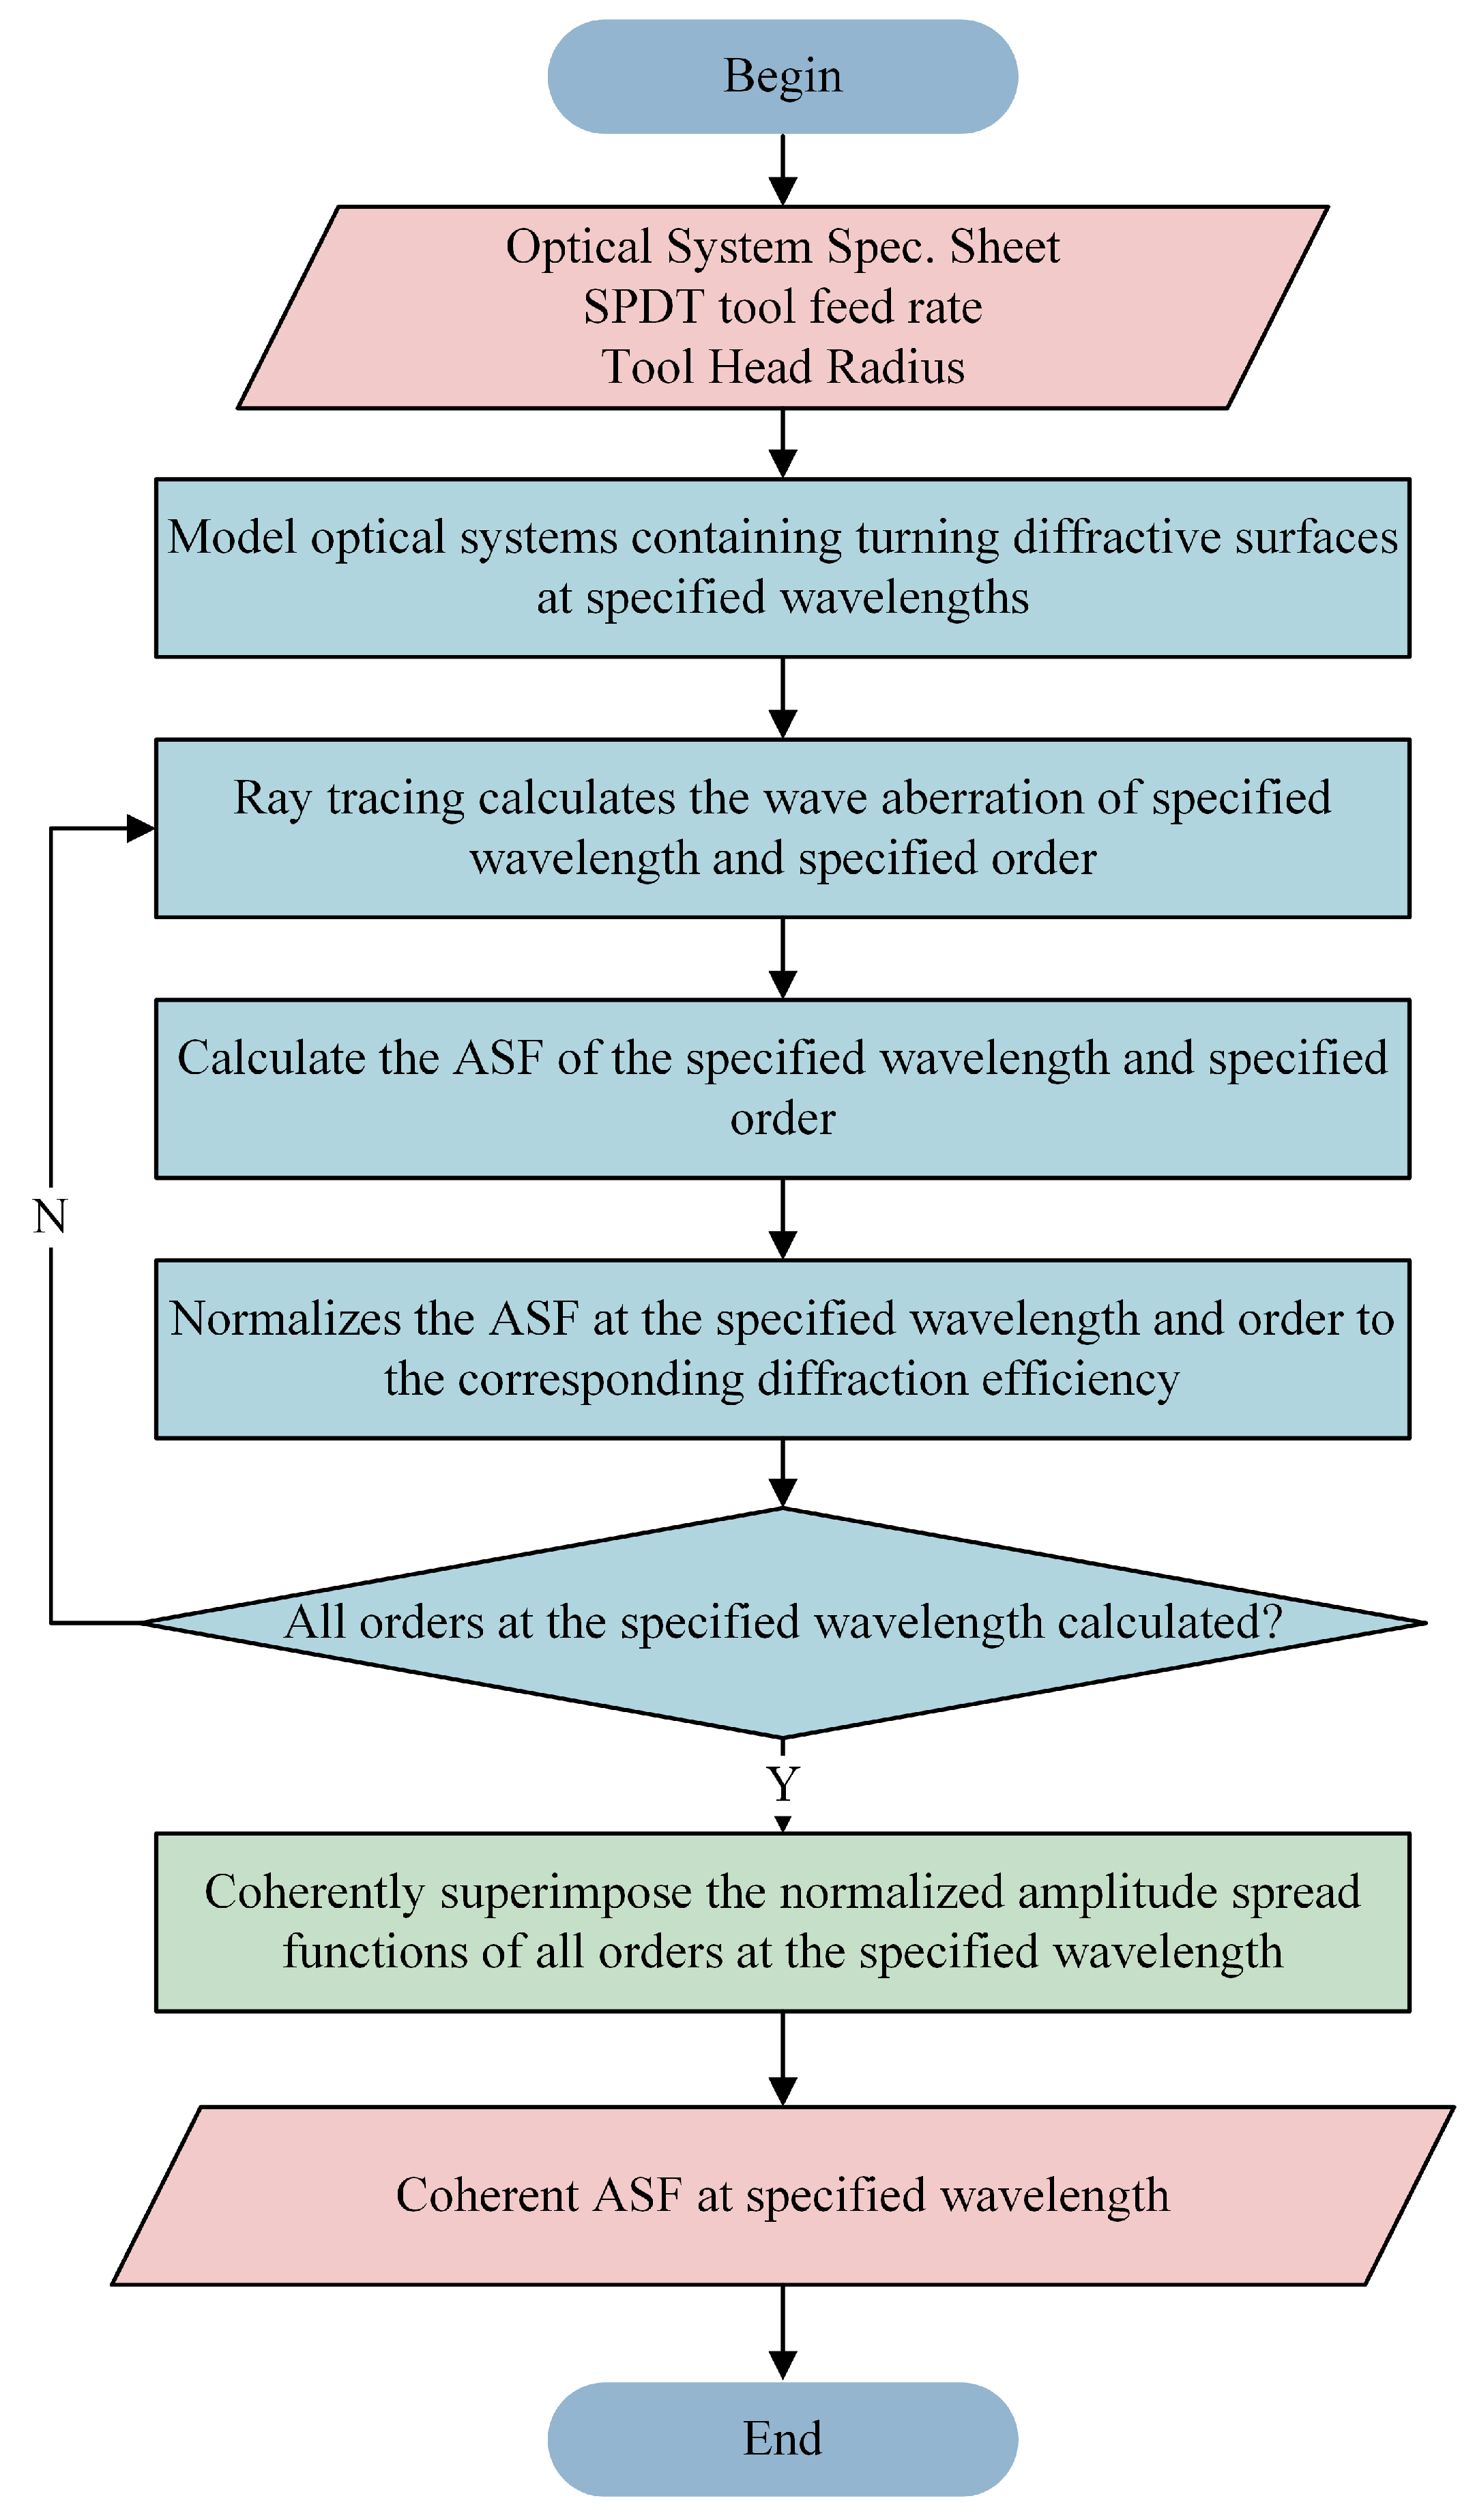
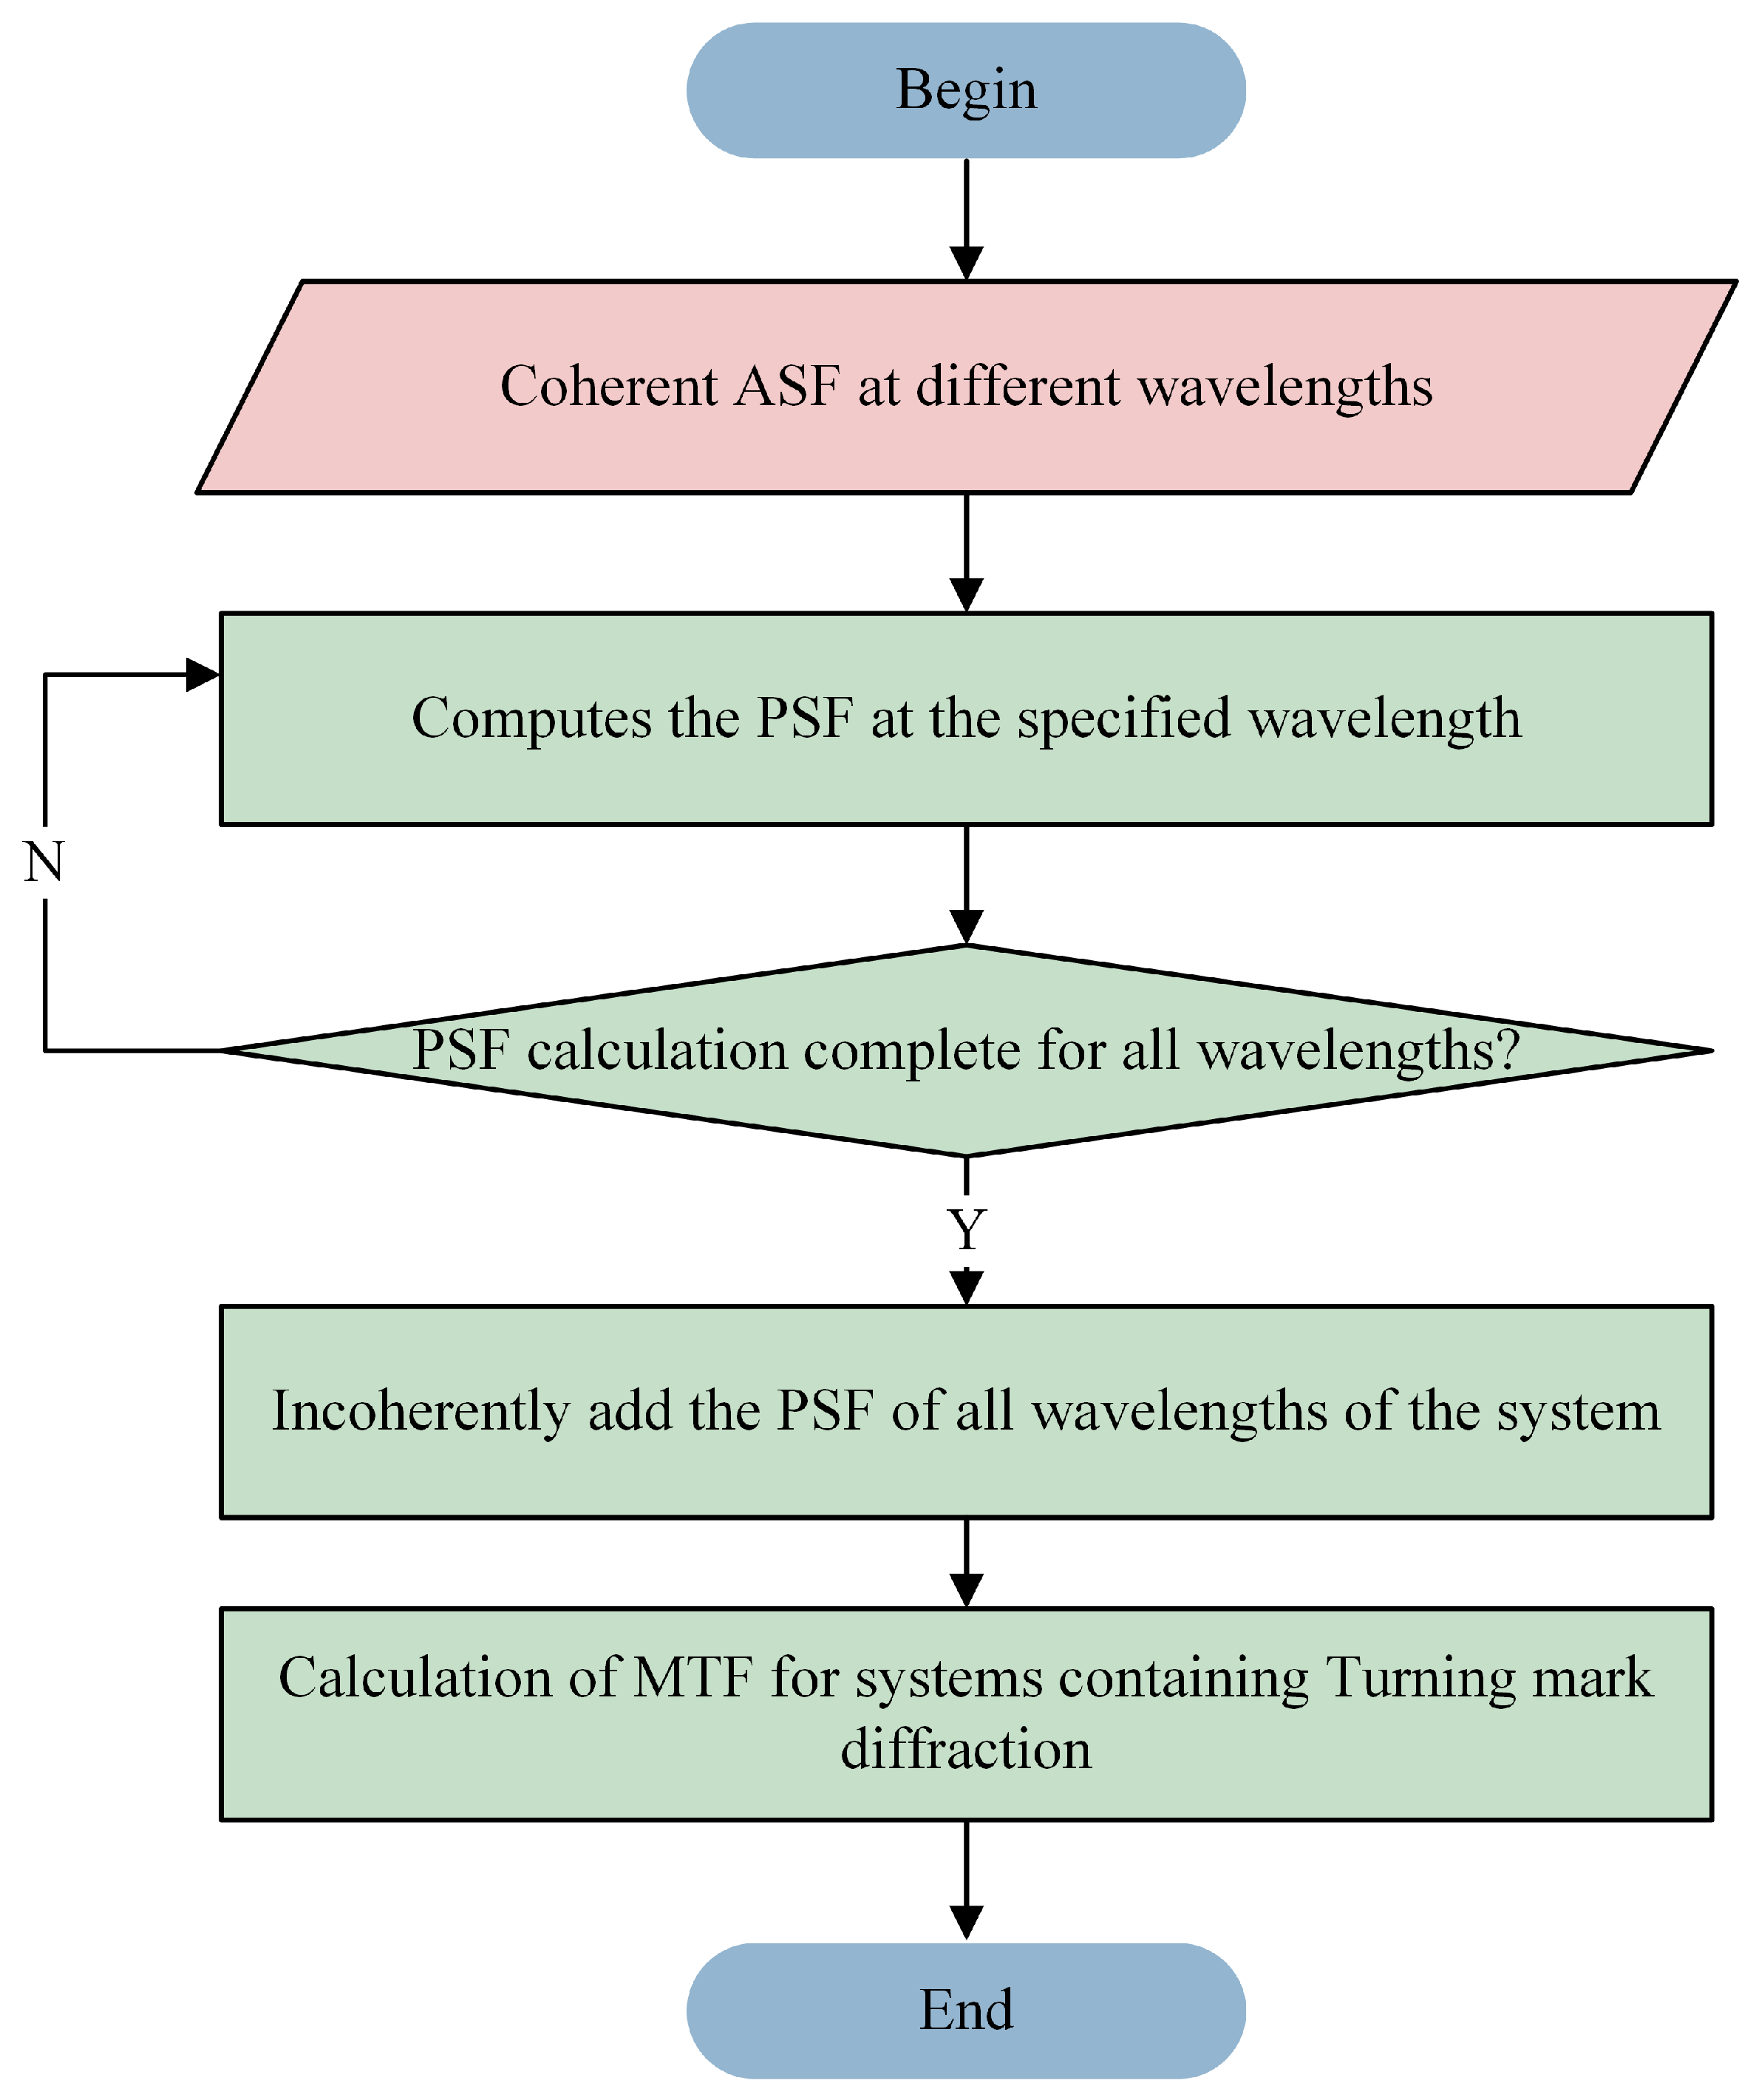
2.2. Proposed MTF Calculation Method for Turning Marks Diffraction

MTF is commonly used to evaluate the image quality of imaging optical systems. It provides information on the minimum structure size that can be expected to be imaged well by giving the image contrast as a function of spatial frequency in object space. In order to quantitatively analyze the degradation effect of turning marks diffraction on imaging quality, based on the ideal single-point diamond turning turning marks diffraction model established in this paper, a fast algorithm for estimating the optical modulation transfer function of the system under the influence of turning marks diffraction, TMTF, is proposed.
A grid of N × N rays uniformly distributed on the entrance pupil of an optical system is traced, and the wavefront aberration for each ray from the entrance pupil to the exit pupil spherical surface is recorded. The wavefront aberration for the mth order at wavelength λ w is denoted as O P D w m ,
O P D w m = Σ i = 1 S n i O P L i
where S is the number of surfaces in the optical system, n i is the refractive index in front of the ith surface, and O P L i is the optical path length between the ( i 1 ) th and ith surfaces. The amplitude spread function (ASF) on the image plane can be calculated as
A S F w m = F exp i 2 π λ w O P D w m
where A S F w m represents the amplitude spread function at the image plane for the mth order and the wth wavelength, and F denotes the two-dimensional Fourier transform [29],
F ( ξ , η ) = f ( x , y ) e i 2 π ( x ξ + y η ) d x d y
however, the A S F w m obtained by Equation (14) is not normalized and only represents the amplitude distribution within the corresponding order, not the corresponding energy contribution. Therefore, it is necessary to normalize the ASF with the diffraction efficiency, η w m , for the corresponding wavelength and diffraction order, i.e.,
A S F w m = A S F w m max A S F w m × η w m
where A S F w m is the normalized ASF of the mth order of the wth wavelength.
On the image plane, the fluctuations of different orders of light with the same wavelength are correlated because they come from the same source. In other words, interference can occur between complex amplitudes of the same wavelength [30,31], and therefore the amplitude spread functions for different orders at the same wavelength should be coherently added. After addition, the amplitude spread functions for the same wavelength can be expressed as
A S F w s u m = Σ m A S F w m
The above algorithms are all coherent calculations at the same wavelength; the flow of the coherent calculation algorithm is shown in Figure 3.
When designing optical systems, several representative wavelengths are usually chosen as sampling wavelengths within the spectral range. Since electromagnetic frequencies vary with wavelengths and do not interfere with each other, incoherent addition is used. According to the Fraunhofer diffraction theory,
g ( x , y ) h 0 F ν x , ν y
where ν x = x λ d and ν y = y λ d , and d is the propagation distance of the light wave, which refers to the distance from the exit pupil spherical surface to the ideal image point. F ν x , ν y = F f ( x , y ) , h 0 = ( j / λ d ) exp ( j k d ) , where k = 2 π / λ .
If different wavelengths of light are sampled with equal numbers of rays and equidistantly at the entrance pupil, the spatial coordinate spacing of the Point Spread Function (PSF) for different wavelengths will be different when the rays propagate to the image plane. Therefore, when performing non-coherent addition for the PSF of different wavelengths, high-frequency signals can be submerged by numerical errors, resulting in errors in the results. As a result, it is necessary to change the sampling strategy at the entrance pupil and sample fewer rays for longer wavelengths.
N R = K λ F / #
where N R denotes the number of sampling rays for the specified wavelength, K is an arbitrary constant, and F / # represents the working F-number of the system for the specified field-of-view and wavelength.
To obtain the PSF for each wavelength, the ASF should be first calculated for each wavelength, which involves repeating the system sampling process. The PSF can then be obtained through the following equation:
P S F w = A S F w s u m × A S F w s u m *
the multi-wavelength PSF can be obtained by performing non-coherent addition of the monochromatic intensity transfer function by the following equation:
P S F s u m = Σ w P S F w
furthermore, the MTF of the optical system can be calculated through the following equation:
M T F = F P S F s u m
the above algorithms are all incoherent calculations at the different wavelength, and the flow of the incoherent computing algorithm is shown in Figure 4.
By following the above steps, estimation of the worst-case impact of turning marks diffraction on the PSF and MTF of the optical system for specified machining parameters have been obtained.

3. Experiments and Results

The VirtualLab Fusion rigorous coupled wave analysis (RCWA) algorithm and TMTF algorithm were used to compare the diffraction efficiency, MTF results, and the calculation time of the metal-based mirror system. Then, the mid-wave infrared optical system was taken as an example to analyze and compare the results and prove the accuracy and speed of the TMTF algorithm. The computer processor used for the calculations was an Intel(R) Xeon(R) Platinum 8370C CPU @ 2.80 GHz, and the memory was 256 GB.

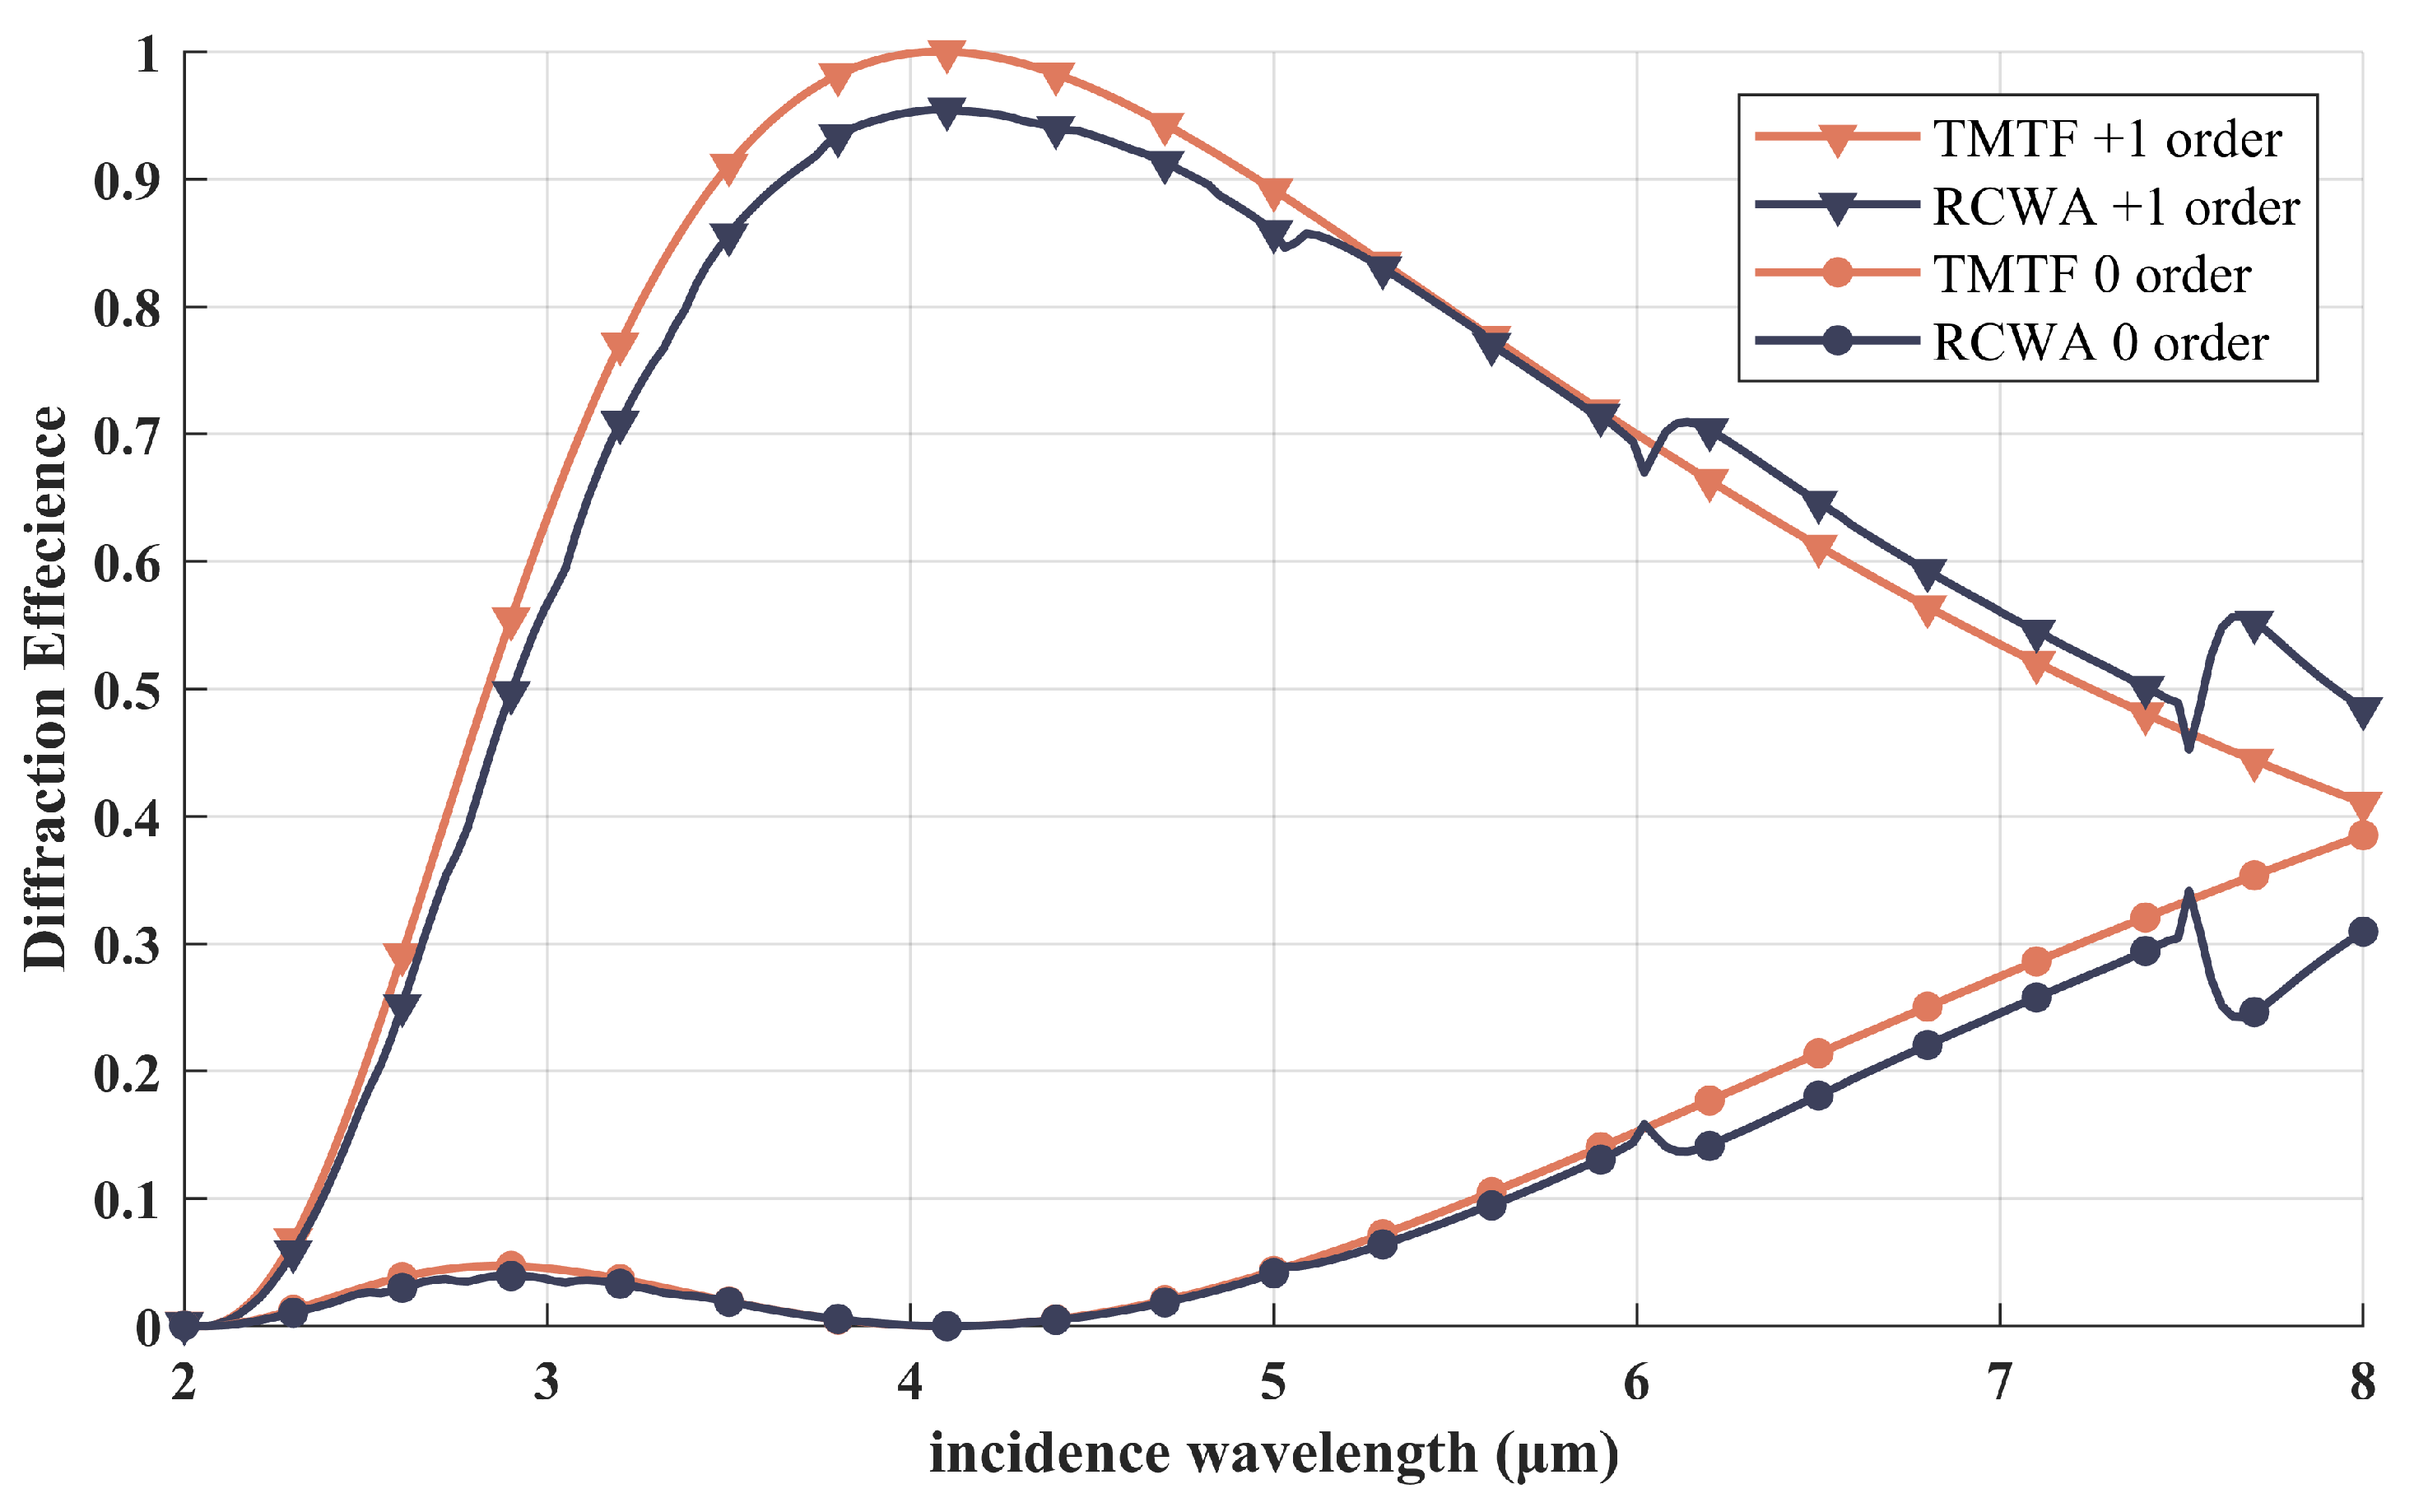
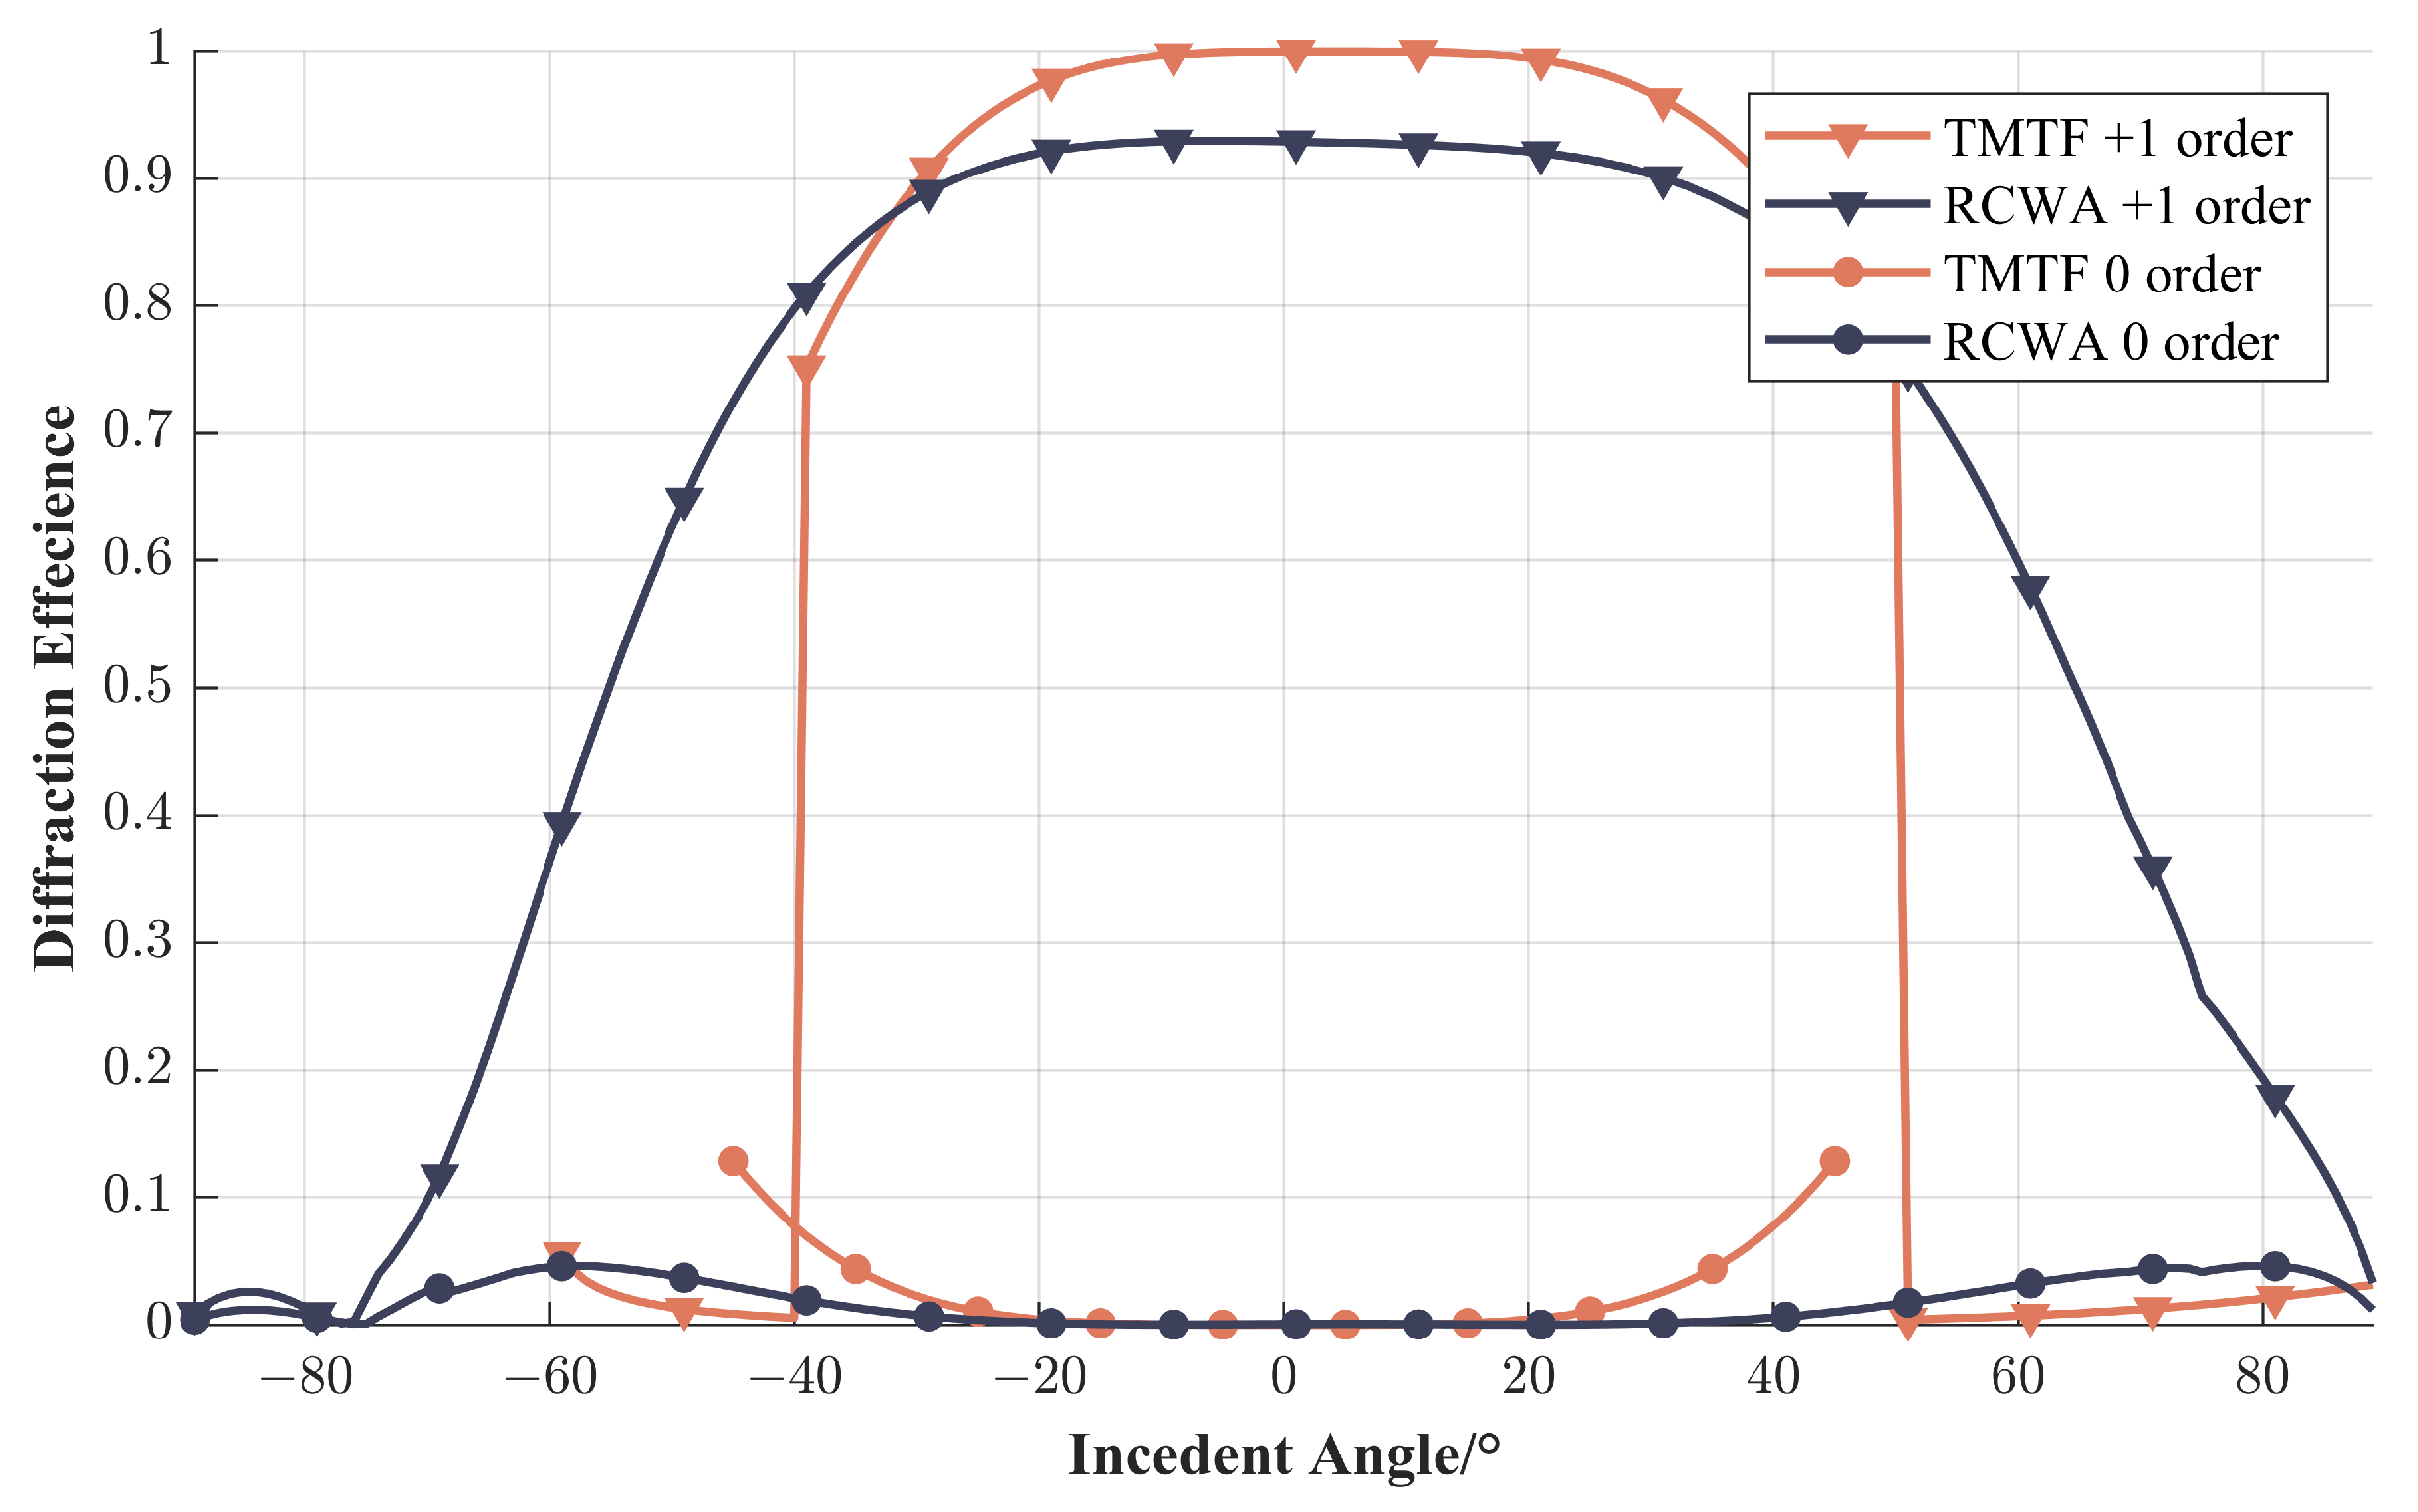
3.1. Simulation of Diffraction Efficiency Calculation by TMTF Algorithm and RCWA Algorithm

To validate the simulation results of the scalar TMTF algorithm for evaluating the impact of groove diffraction on imaging quality, optical simulations were performed using VirtualLab Fusion 2023 software. VirtualLab Fusion employs Field tracing theory to conduct physical optics system-level analysis of optical systems and uses the RCWA algorithm to calculate the diffraction efficiency of gratings. In contrast, the TMTF algorithm calculates the diffraction efficiency using scalar theory. Accordingly, the diffraction efficiency of a mid-wave infrared reflective blaze grating was calculated using both VirtualLab and the TMTF algorithm for different incident wavelengths. The design parameters of the blaze grating under test are shown in Table 1, and the obtained relationships between the diffraction efficiency and wavelength is illustrated in Figure 5.
As the wavelength changes, the trends in the results obtained using the scalar TMTF algorithm and vector RCWA algorithm are generally consistent. The maximum deviation between the two methods occurs at the blaze wavelength, with a value of 0.0525. Due to the design of the grating structure, the diffraction efficiency calculated through the scalar TMTF algorithm exhibits a sudden change at 7.5 μ m. However, the deviation remains within 10 % , indicating that the scalar TMTF algorithm achieves a high level of computational accuracy compared to the rigorous RCWA algorithm under general broadband requirements. This suggests that the use of the scalar TMTF algorithm is feasible.
In this study, we conducted incident angle tests on the same grating. The results are illustrated in Figure 6. Our calculations using the scalar TMTF algorithm and the RCWA algorithm were found to be quite similar for a range of 40 50 , with an absolute error of no more than 0.06. However, for larger incident angles, the diffraction efficiency curve drastically drops to 0 due to the numerical singularity and the grating blaze angle setting problem. This is a crucial consideration for optical system design, as such high surface incidence angles can lead to problems such as Fresnel aberration, increased tolerance sensitivity, and greater processing and assembly difficulties. Therefore, it is generally advisable to avoid excessive surface incidence angles in design. Nevertheless, our algorithm still demonstrates high reliability and robustness under a wide range of incident angles.

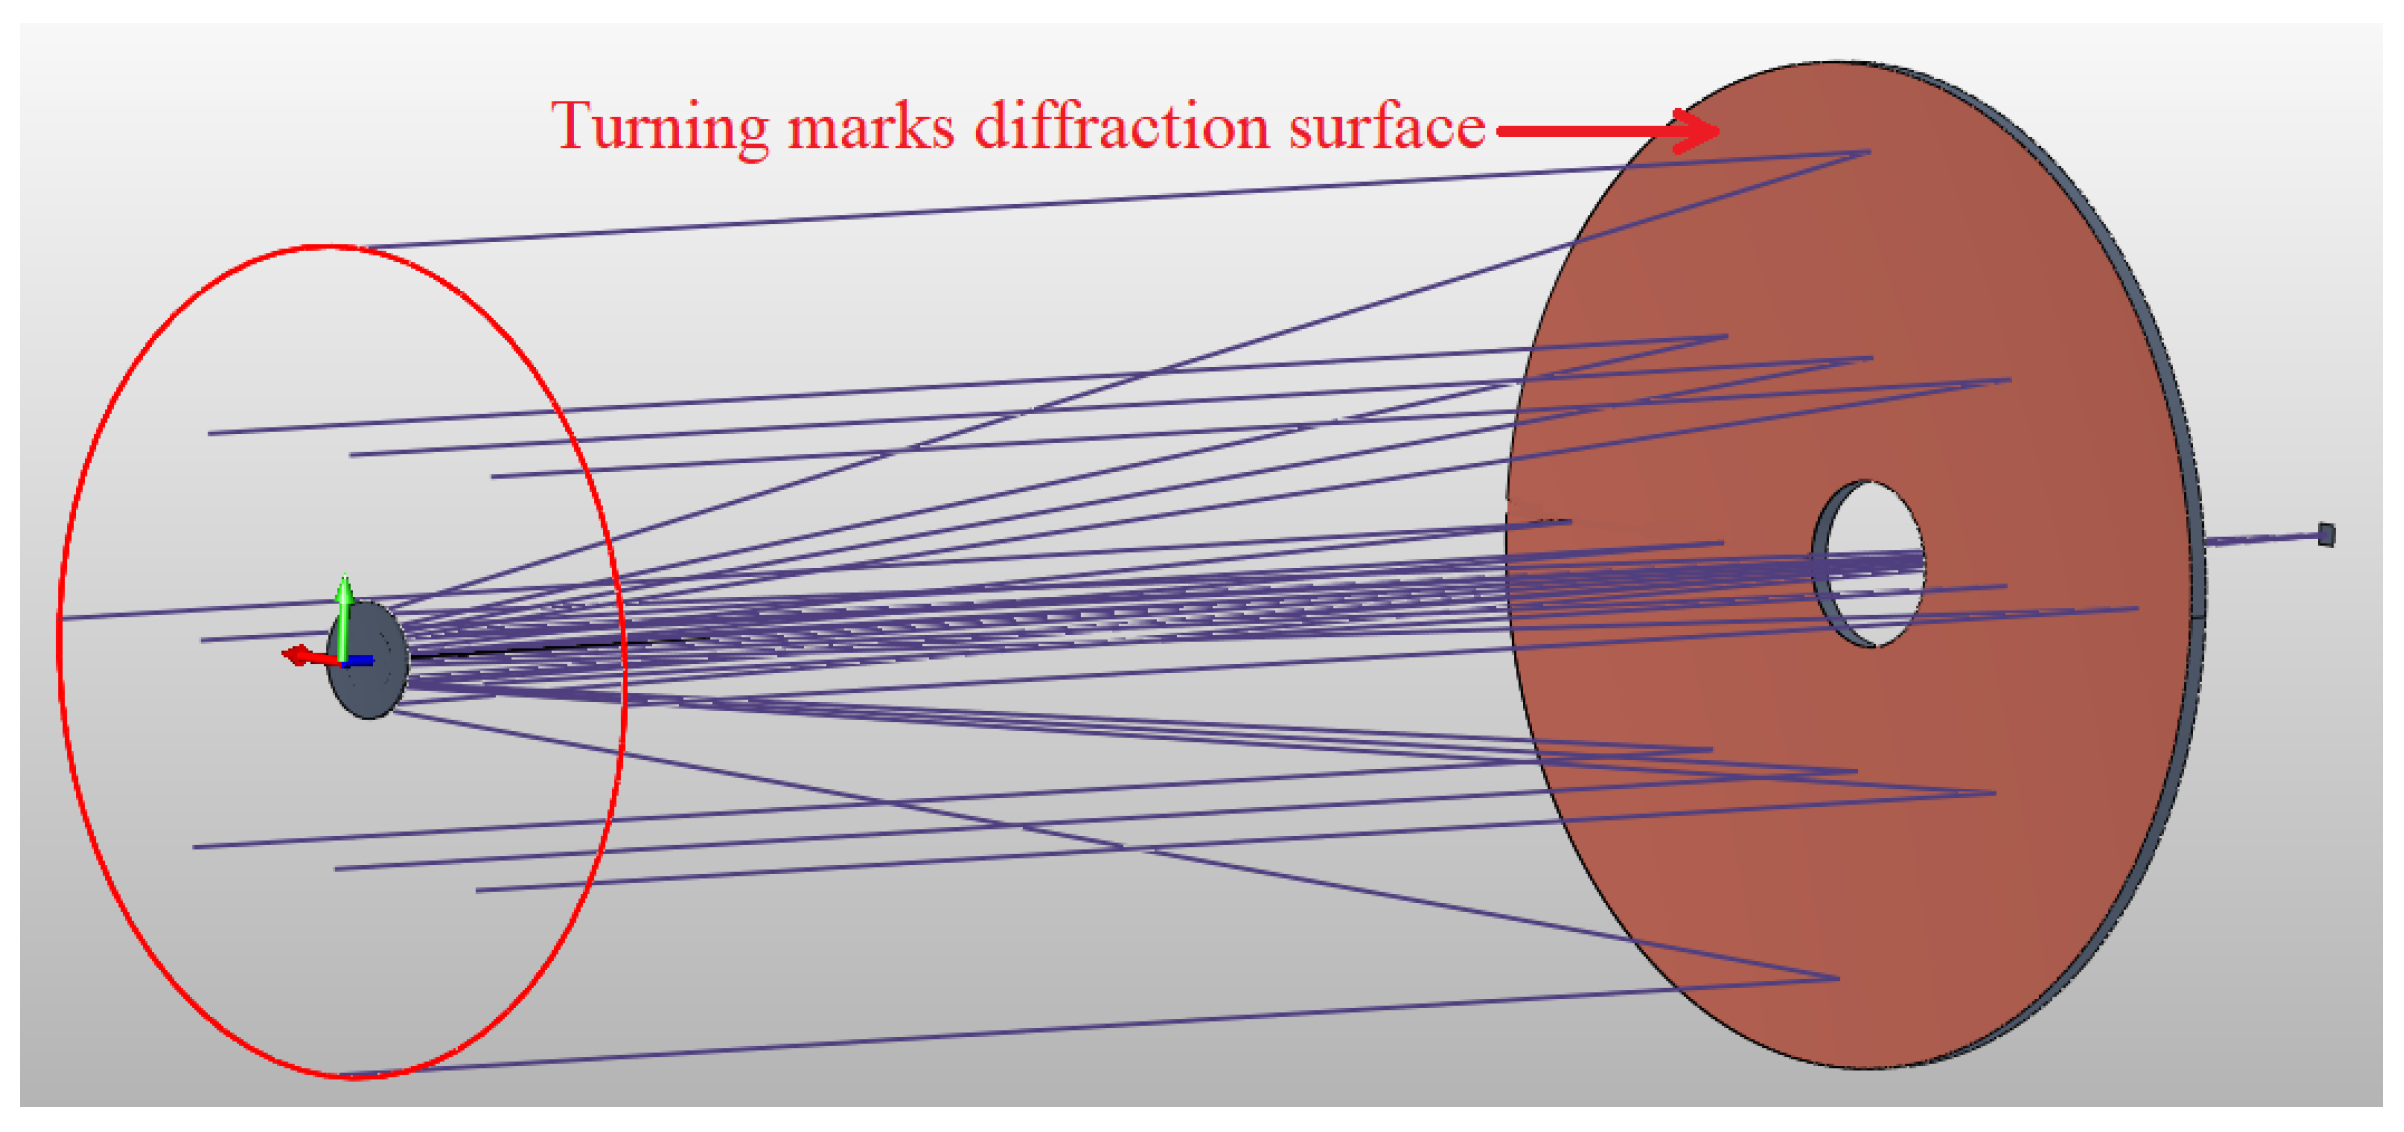
3.2. Simulation Experiment and Results of Metal-Based Mirror System

The Ritchey–Chrétien (RC) coaxial reflective optical system is one of the simplest forms of reflective optical systems, widely used in astronomy, defense, and other fields. The layout of the optical system is shown in Figure 7, and the system parameters are listed in Table 2. The system’s diffraction efficiency and MTF are calculated through both the TMTF algorithm and VirtualLab Fusion’s RCWA algorithm, and the results were analyzed and compared.

3.2.1. Diffraction Efficiency Calculation

During the actual manufacturing and assembly process, it is difficult to separate the MTF degradation caused by turning marks diffraction from other factors such as machining errors and adjustment errors due to their coupling. VirtualLab Fusion calculates the diffraction efficiency of gratings based on a vector-based RCWA algorithm by using ray tracing. However, the vector-based RCWA algorithm requires a large amount of memory resources for computation, making it more suitable for theoretical studies rather than practical optical systems. By comparing the results obtained using the RCWA algorithm with the scalar TMTF algorithm, the effectiveness of the scalar TMTF algorithm can be demonstrated, which is more suitable for practical optical system simulations.
The grooves formed by the machining tools on the optical surface is locally approximated as a linear grating, and its diffraction efficiency is the key factor affecting the imaging quality of the optical system. If the ±1st order diffraction efficiency of the grating is too high, pseudo-images will necessarily form around the 0th order light, which deteriorates the image quality of the optical system. As shown in Figure 8, the ±1st order PSF forms a ring-shaped PSF due to light deviation from the 0th order light; however, its diffraction efficiency is relatively low. The scalar TMTF algorithm has an absolute error in calculation accuracy with respect to the benchmark RCWA algorithm that is less than 3 % ,and is much faster in computation speed as compared to the vector-based RCWA algorithm. The comparison of the diffraction efficiencies and calculation times calculated by the TMTF algorithm and the RCWA algorithm are shown in Table 3.

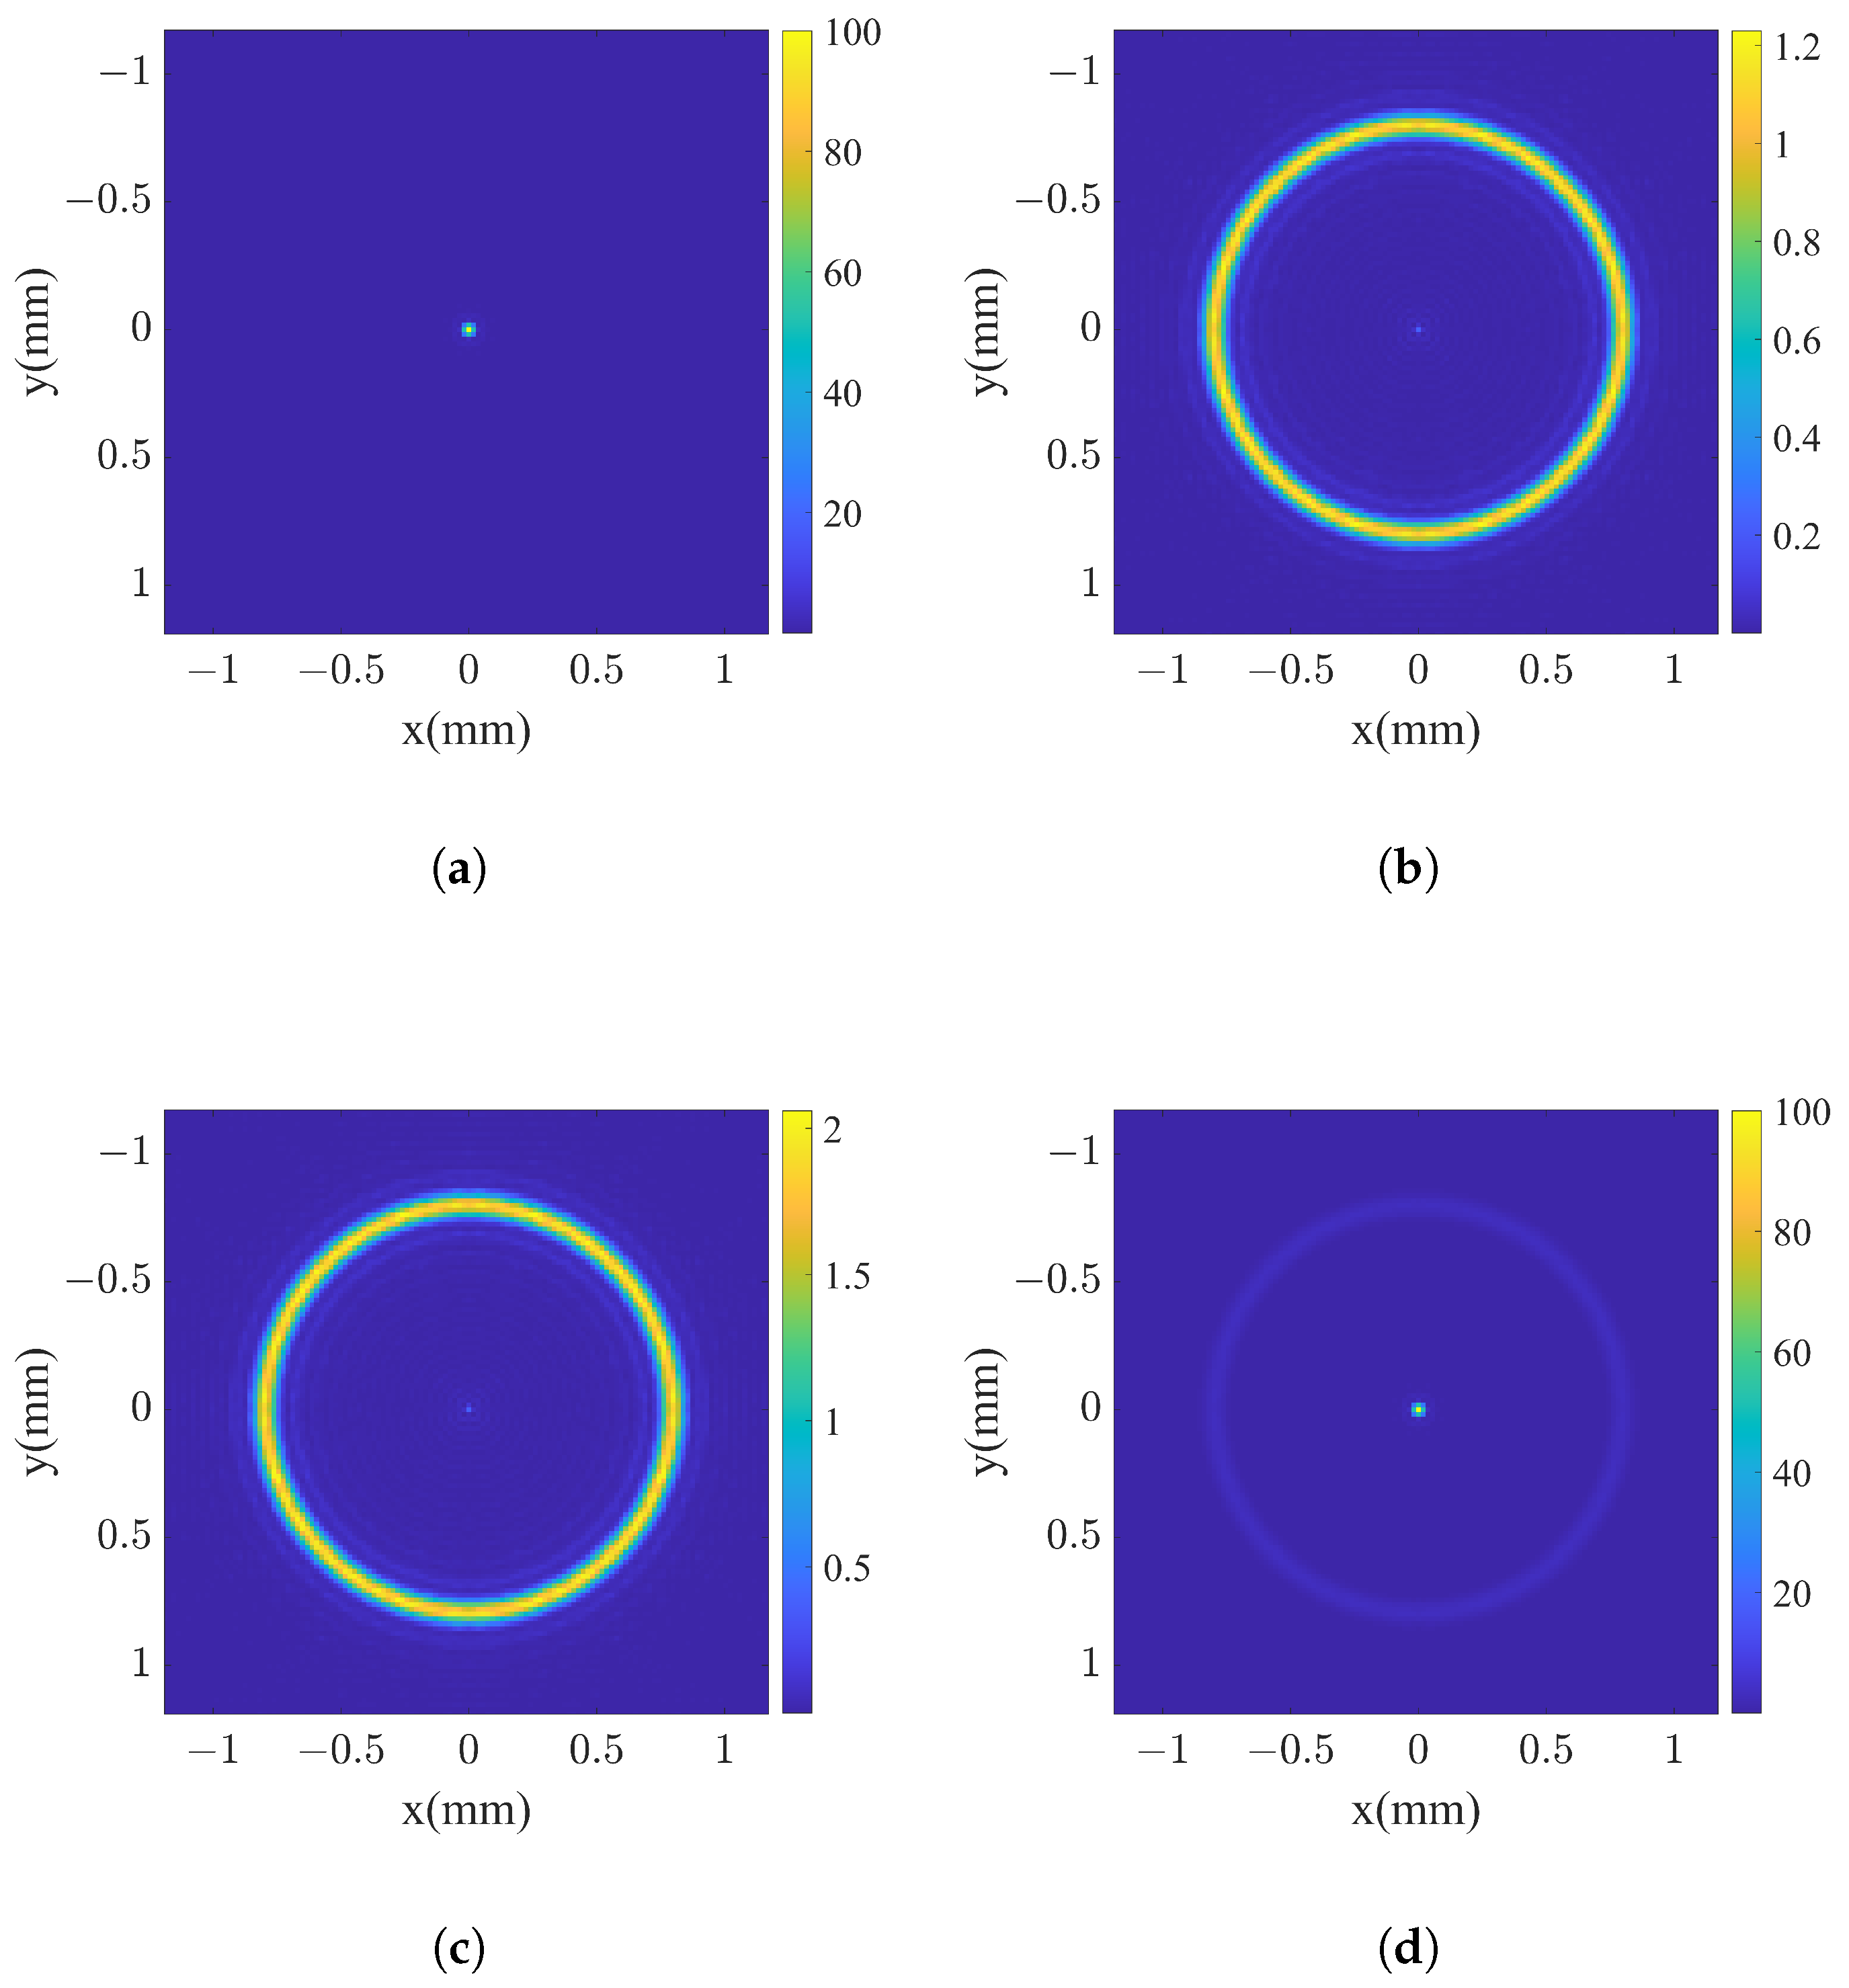
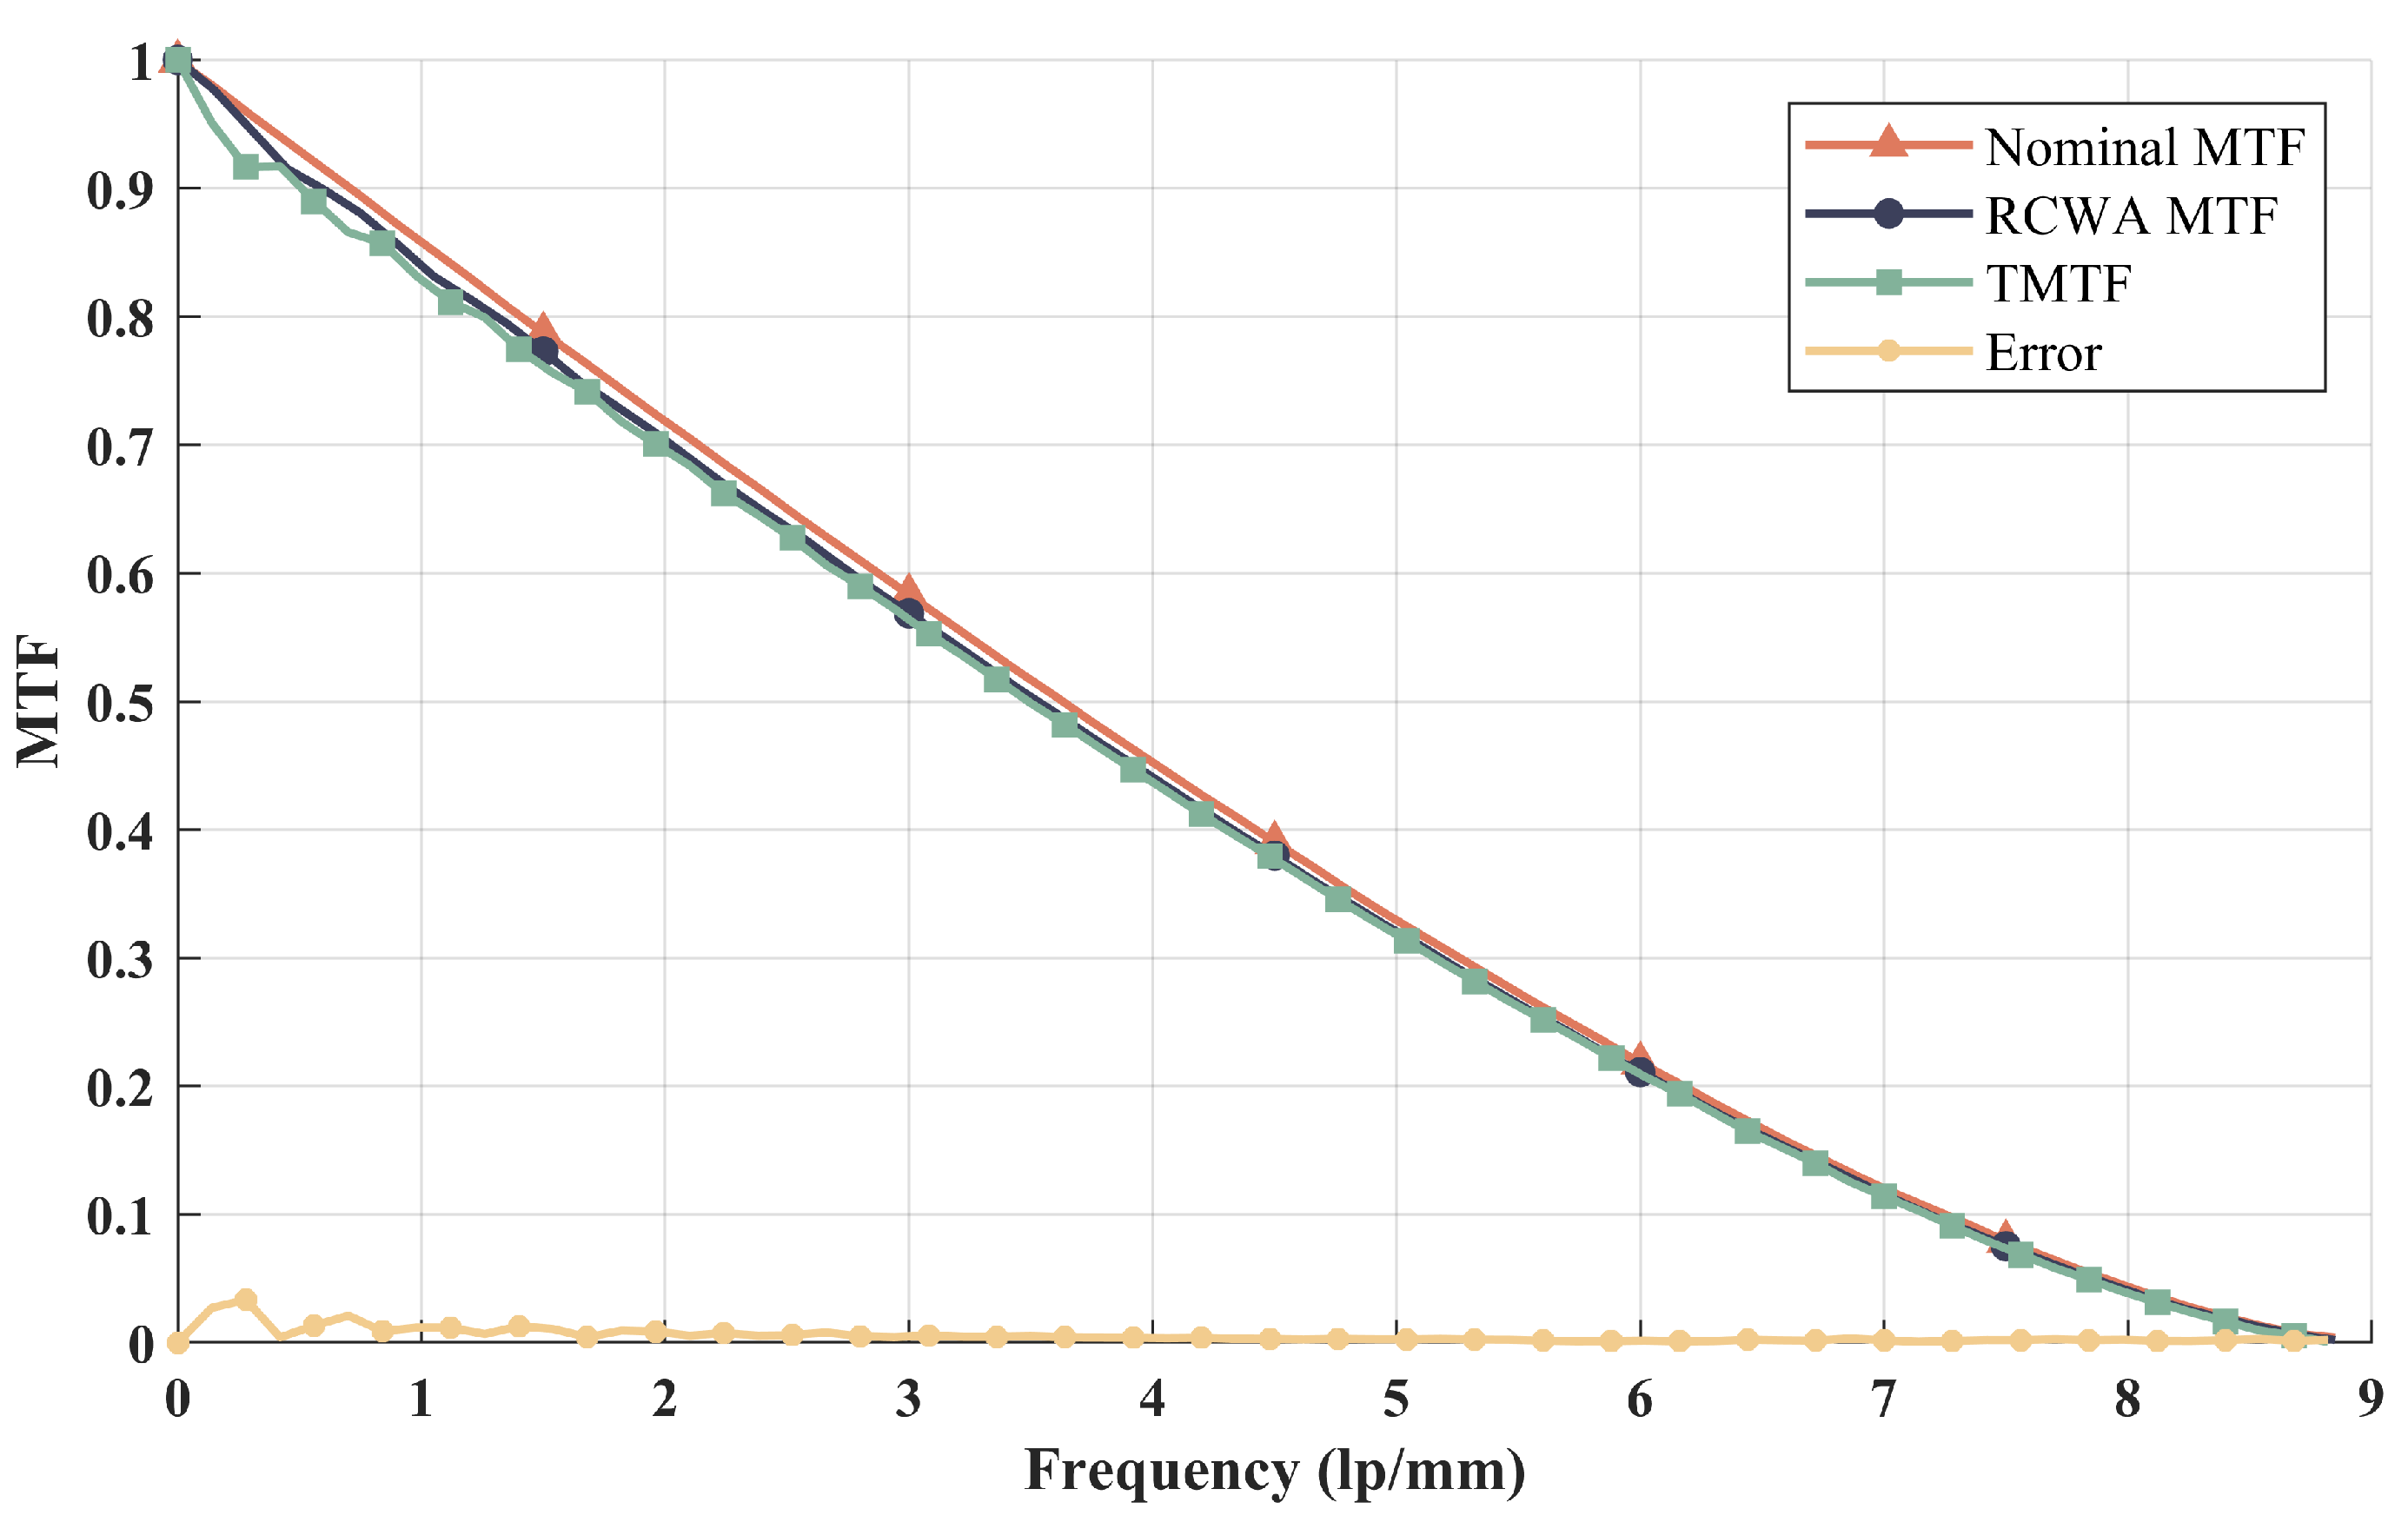
3.2.2. Calculation of MTF for Metal-Based Reflective Optical Systems

Based on the calculation of the multi-wavelength PSF, the MTF for a metal-based reflective optical system with turning marks diffraction was further calculated, and the results are shown in Figure 9. The cutoff frequency of the optical system can be determined using the formula f c = D λ f , where λ represents the shortest design wavelength of the system, f denotes the focal length, and D corresponds to the diameter of the entrance pupil. It is worth noting that the RCWA algorithm requires a substantial amount of memory, and its computational capacity is limited, resulting in calculations being restricted to small space sizes. Consequently, the application of the RCWA algorithm is hindered; therefore, limitation is especially relevant when considering the large-aperture system used. The maximum deviation of the MTF between the TMTF algorithm and VirtualLab Fusion software based on the field tracing RCWA algorithm is 0.033 at low frequencies, while the two algorithms essentially coincide at high frequencies.

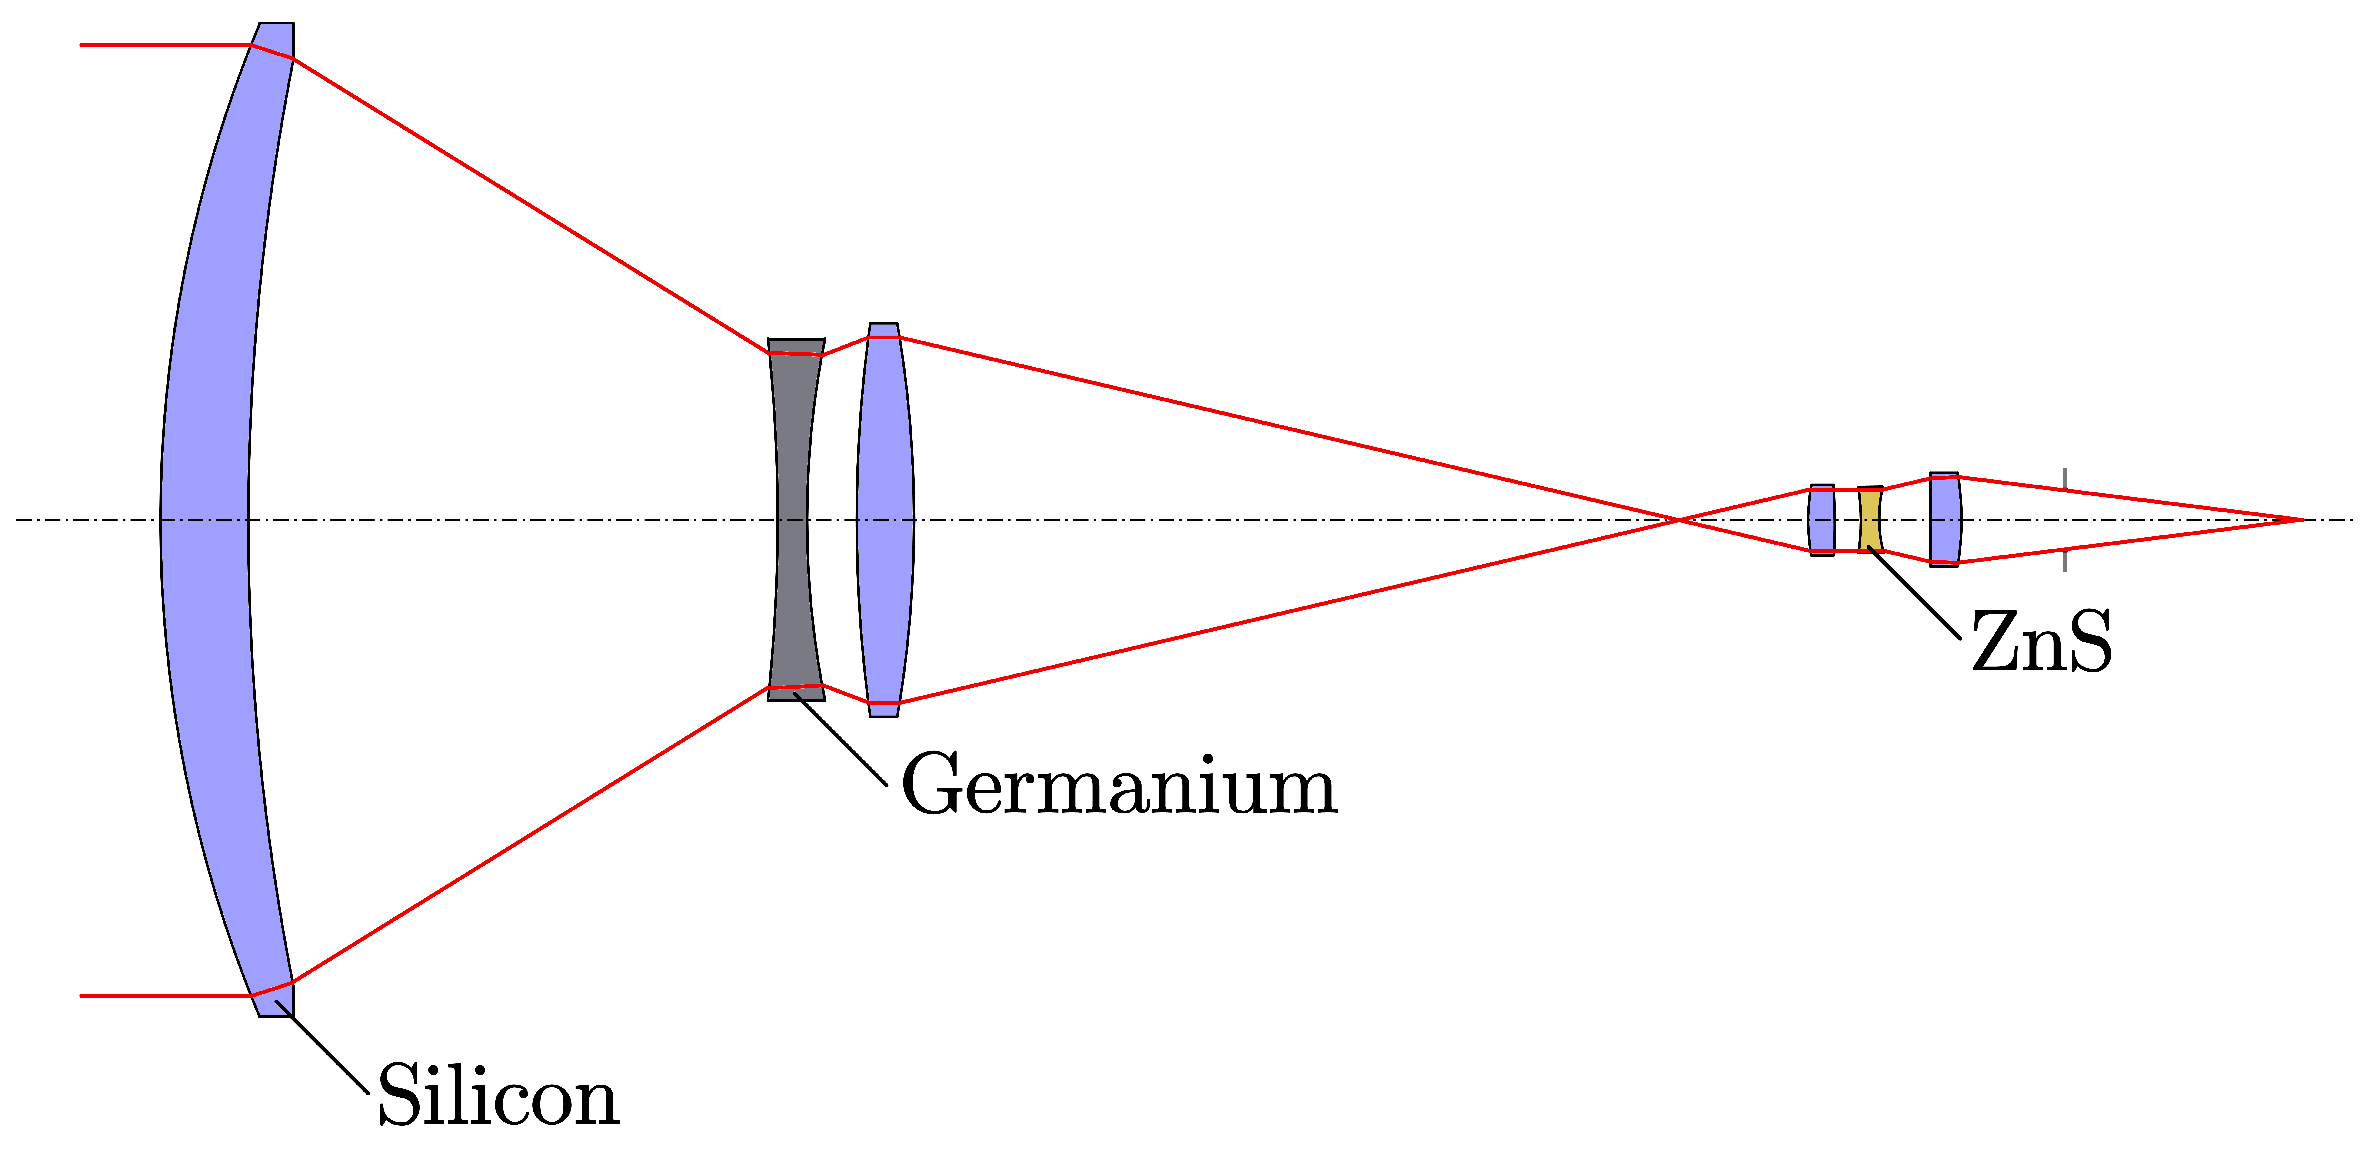
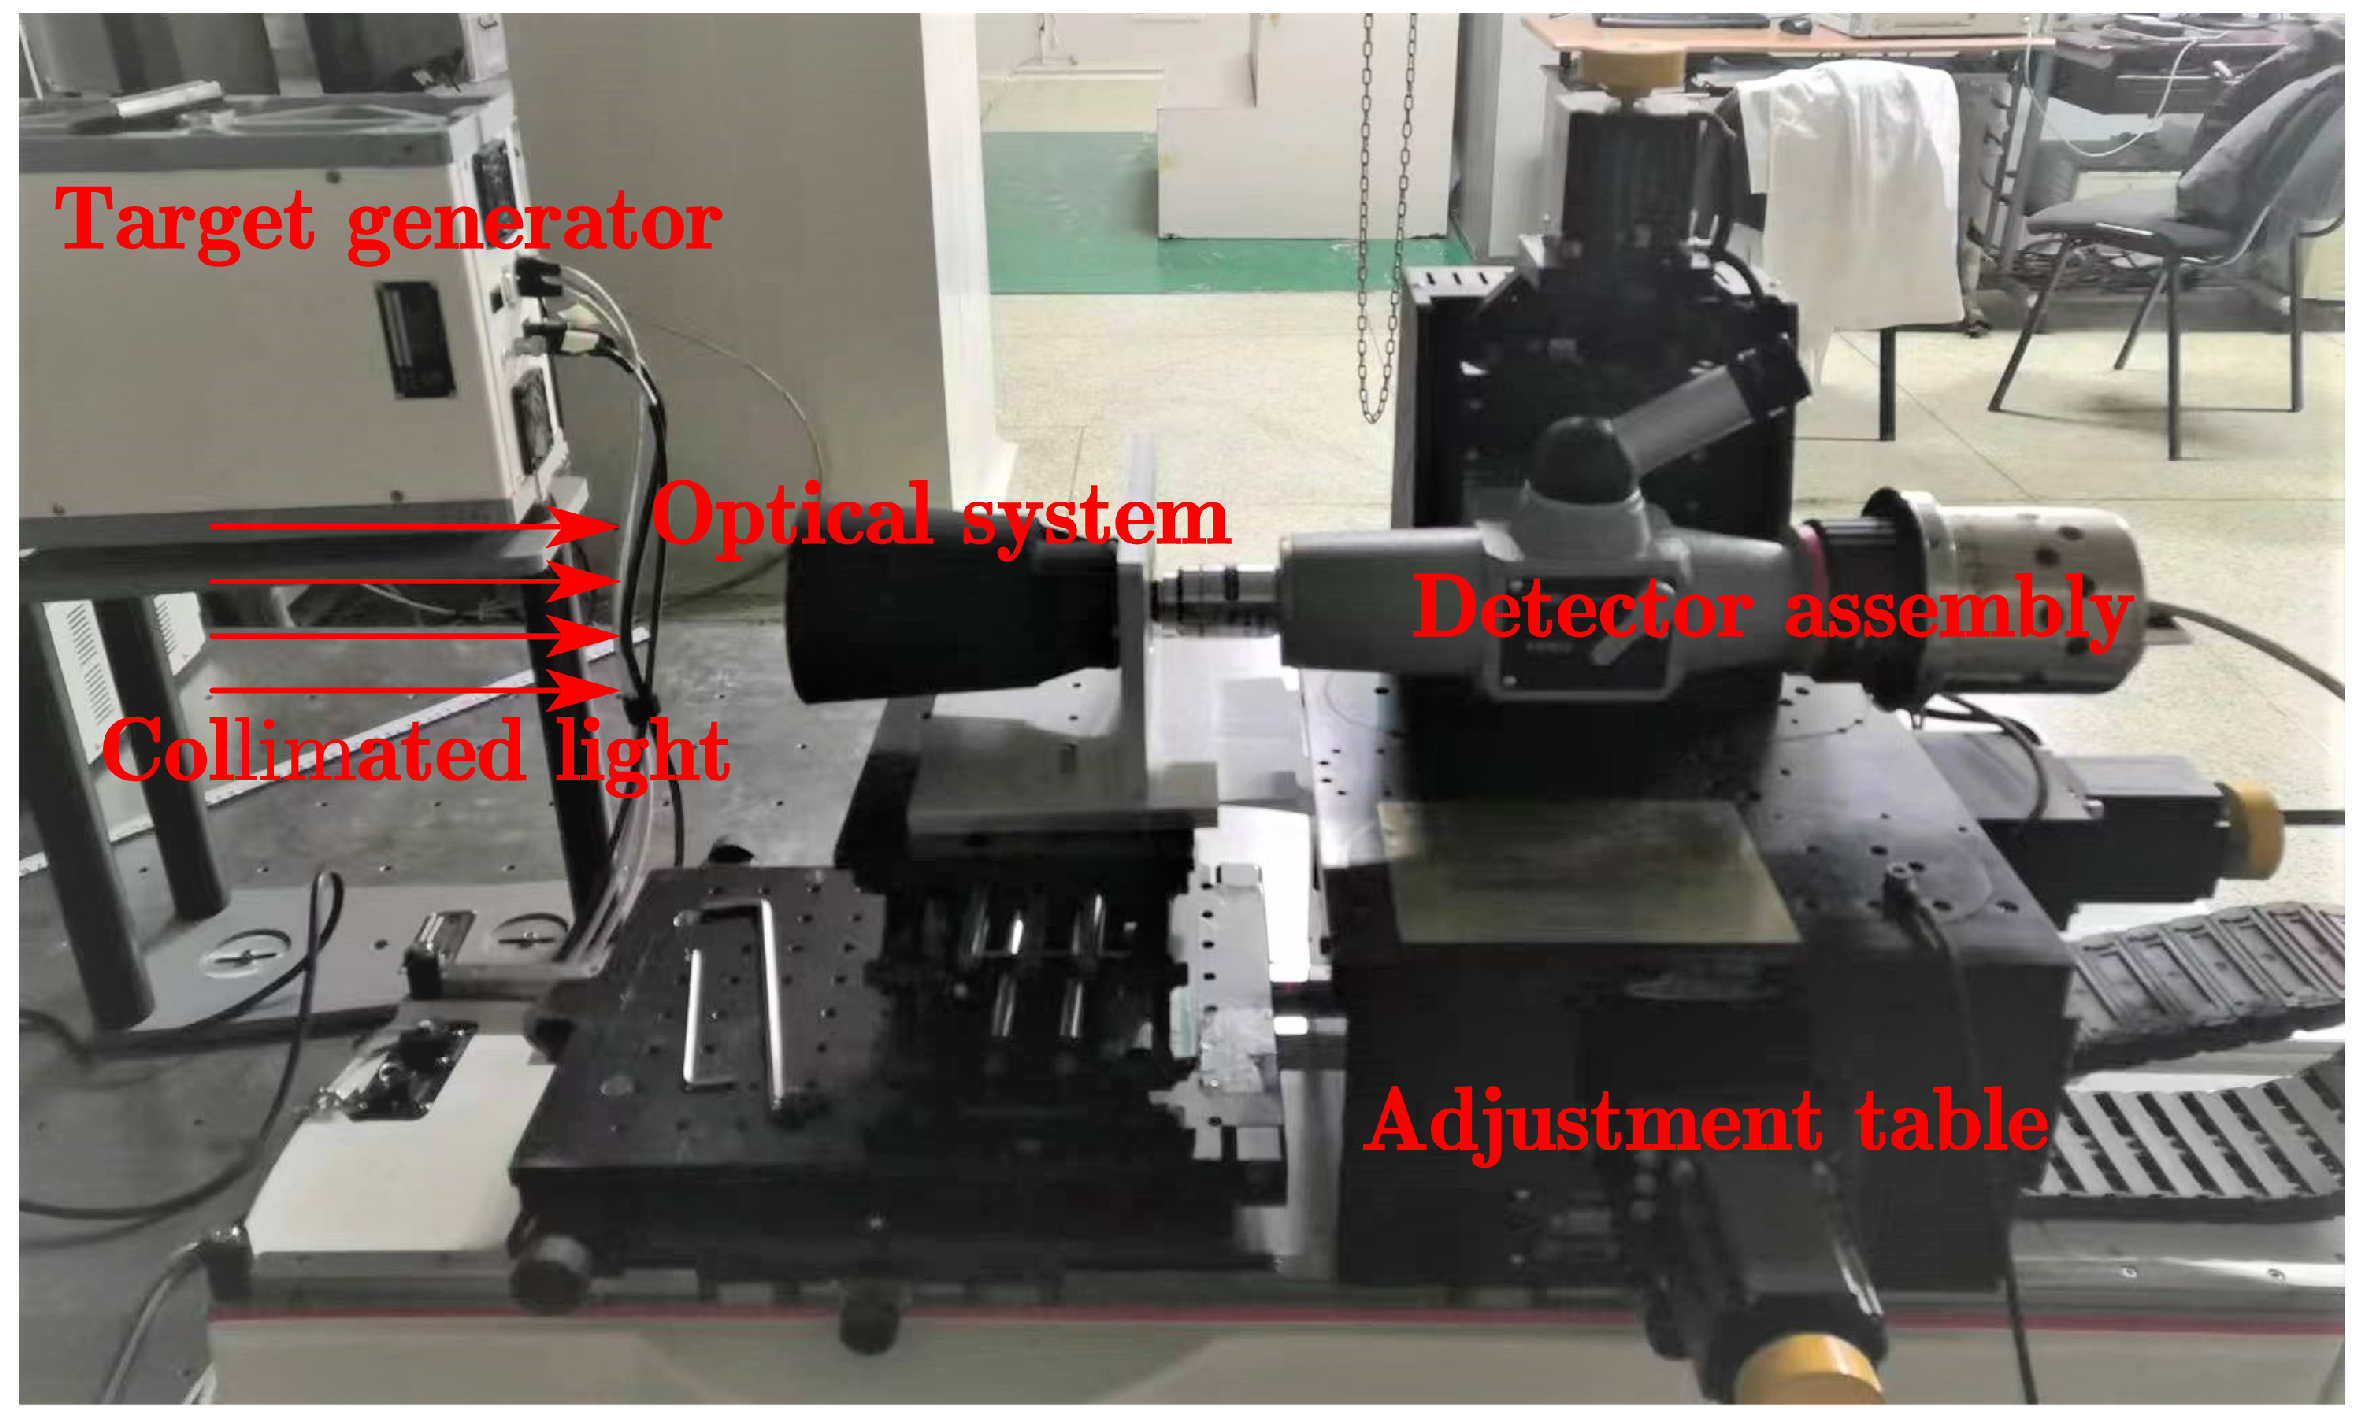
3.3. Experimental Results of Mid-Wave Infrared Optical System

Infrared systems with longer wavelengths are more susceptible to the effects of turning marks diffraction; as shown in Figure 10, the 1st, 3rd, 4th, and 6th lenses of the system use silicon, the 2nd lens uses germanium, and the 5th lens uses zinc sulfide material, operating in the spectral band of 3.7 μ m to 4.8 μ m.
The germanium lens utilized in the optical system under examination is fabricated to its intended shape through single-point diamond turning, following the surface profile equation. Following this, it undergoes a coating process to acquire favorable surface properties. Generally, additional polishing is not required beyond this stage. The processing procedure for silicon lenses follows a similar approach as that of germanium lenses. However, due to the significantly higher hardness of silicon compared to germanium, the cutting speed is slower. Consequently, it may be necessary to perform further polishing after processing. Nonetheless, it is important to note that noticeable turning marks are likely to persist even after the additional polishing step.
The third surface, located on the lens made of germanium, holds the most optical power in the system. In comparison to the initial lenses crafted from silicon, the germanium lens exhibits less visible turning marks on its surface due to its lower hardness. The presence of turning marks on the surfaces of both silicon and germanium lenses can result in diffraction, which ultimately leads to a reduction in system image quality. To assess the impact of turning marks diffraction on lens surfaces, a separate analysis of the third surface was conducted alongside an evaluation of the first, second, and third surfaces combined. The system design parameters and machining parameters are shown in Table 4.
As shown in Figure 11, the germanium lens surface has not been coated after turning, and the dispersion band phenomenon appears on the edge under the light irradiation. The MTF test setup of the mid-wave infrared optical system is shown in Figure 12.
In this study, the MTF was measured using an MTF tester. To generate the edge target, a target generator was utilized. The edge target was then illuminated by a parallel light emitted by a reflective collimator, which carried the edge information. The light passed through the optical system and generated an image signal in the detector assembly, resulting in the Edge Spread Function (ESF). By performing a Fourier transform on the ESF, the MTF of one direction, either the tangential or sagittal direction, was obtained. To obtain the MTF of different fields of view, the adjustment stage was rotated accordingly.
The MTF of the system was calculated using the TMTF algorithm, taking into account the effect of turning marks diffraction on the surface of the germanium lens, and then compared with the actual measured MTF data after assembly and adjustment of the system, as shown in Figure 13. Due to the effect of system misalignment being included, the MTF of the actual final system is lower than the MTF calculated by the TMTF algorithm. The maximum relative decrease in system MTF under the influence of turning marks diffraction is 0.0428 compared to the designed MTF value, while the maximum relative decrease in system MTF after assembly and adjustment is 0.1304 compared to the designed MTF value. It can be seen that the contribution of turning marks diffraction to the decrease in system MTF is approximately one-third of the total.

4. Discussions

The present study investigates the accuracy and applicability of an algorithm by analyzing and testing simple blazed gratings, metal-based reflective optical systems, and mid-wave infrared transmissive optical systems. The algorithm calculates the diffraction efficiency in the scalar field and can provide reliable results for a wide range of wavelengths. The variation trend of the diffraction efficiency with the incident wavelength is consistent with the results obtained by the RCWA algorithm, with an absolute error not exceeding 0.05. The algorithm can provide reliable results in the range of 40 50 , which is sufficient to meet the needs of general infrared optical systems. For extreme wide-angle infrared optical systems, the RCWA algorithm can calculate the diffraction efficiency under different incident angles, and the MTF calculation under the influence of turning marks diffraction can be realized by the look-up table method.
The metal-based reflective optical system is modeled in both the TMTF algorithm and the RCWA algorithm, and the MTF under the influence of turning marks diffraction is calculated. The scalar TMTF algorithm’s absolute error is less than 0.03 compared to the accurate RCWA algorithm. For mid-wave infrared transmissive optical systems, cases where only one surface and multiple surfaces are considered are analyzed separately. For multiple surfaces affected by turning marks, the diffracted light of different orders emitted by the previous surface becomes the incident light of the latter surface. Images formed by multiple ± 1st order diffractions have lower energy. The first three surfaces of the system are selected for analysis as surfaces affected by turning marks because the first lens is made of silicon, which is harder, and the turning marks are more obvious after single-point diamond turning. The test results show that the decrease of MTF caused by single surface turning marks diffraction is in line with expectations, while the MTF caused by multiple surface turning marks diffraction is closer to the actual MTF of the system.
Since the algorithm performs calculations in a scalar region, it is sensitive to the back focal length of the optical system and the aperture of the surface containing turning marks. These parameters are related to the F-number or numerical aperture of the optical system. After testing different systems, it is known that the algorithm can achieve good results in systems with an F-number of the optical system ≥ 2. Even in systems with larger relative apertures, the results obtained by the TMTF algorithm are still of reference value.

5. Conclusions

To quantitatively analyze the impact of turning mark diffraction on imaging quality degradation, an ideal single-point diamond turning marks diffraction model is established. Additionally, a calculation method based on scalar diffraction theory is proposed to rapidly predict the TMTF of SPDT turning marks diffraction on imaging quality. This computationally efficient method eliminates the need for RCWA calculations and provides a worst-case estimation of the effect of turning mark diffraction on image quality within the scalar theory framework. By incorporating this method into digital modeling during design and manufacturing, significant cost savings can be achieved by avoiding iterative manufacturing and testing stages. Comparing the results of the proposed algorithm with RCWA algorithm simulations, it is observed that the maximum deviation in MTF calculation is approximately 3%. The two methods exhibit good agreement at relatively high frequencies, thus validating the effectiveness of the proposed algorithm. Furthermore, considering the decrease in MTF caused by machining turning marks during the design stage allows for the incorporation of image quality degradation resulting from turning mark diffraction in the image quality analysis. This enables quantitative prediction of optical manufacturing tolerances required to meet specific image quality requirements during the design phase of projects. As a result, this approach finds wide applicability in optical system design and analysis and tolerance allocation and desensitization, as well as optical manufacturing and related fields.

Author Contributions

Conceptualization, J.Z. and H.Y.; methodology, M.L.; software, H.Y.; validation, H.Y.; formal analysis, H.Y.; investigation, H.Y.; resources, M.L.; data curation, H.Y.; writing—original draft preparation, H.Y.; writing—review and editing, S.Z.; visualization, H.Y.; supervision, X.Z.; project administration, X.Z.; funding, S.Z. All authors have read and agreed to the published version of the manuscript.

Funding

This research was supported by the National Natural Science Foundation of China (NSFC) (No. 62005271).

Institutional Review Board Statement

Not applicable.

Informed Consent Statement

Not applicable.

Data Availability Statement

Not applicable.

Acknowledgments

We gratefully acknowledge Shuanglong Tan and Ha Wang for useful discussion and help in optical manufacturing.

Conflicts of Interest

The authors declare no conflict of interest.

References

  1. Li, Z.; Fang, F.; Zhang, X.; Liu, X.; Gao, H. Highly efficient machining of non-circular freeform optics using fast tool servo assisted ultra-precision turning. Opt. Express 2017, 25, 25243–25256. [Google Scholar] [CrossRef]
  2. Gong, H.; Ao, S.; Huang, K.; Wang, Y.; Yan, C. Tool path generation of ultra-precision diamond turning: A state-of-the-art review. Nanotechnol. Precis. Eng. 2019, 2, 118–124. [Google Scholar] [CrossRef]
  3. Tan, S.; Zhang, X.; Wang, L.; Wu, H.; Fu, Q.; Yan, L.; Hu, M. Equivalent Modeling and Verification of a High-Steepness and Lightweight Elliptical Aluminum Mirror. Appl. Sci. 2022, 12, 9091. [Google Scholar] [CrossRef]
  4. Zhang, J.; Wang, C.; Qu, H.; Guan, H.; Wang, H.; Zhang, X.; Xie, X.; Wang, H.; Zhang, K.; Li, L. Design and Fabrication of an Additively Manufactured Aluminum Mirror with Compound Surfaces. Materials 2022, 15, 7050. [Google Scholar] [CrossRef]
  5. Church, E.L.; Zavada, J.M. Residual Surface Roughness of Diamond-Turned Optics. Appl. Opt. 1975, 14, 1788–1795. [Google Scholar] [CrossRef]
  6. Wu, D.; Kang, C.; Liang, F.; Yan, G.; Fang, F. Diffractive Optical Characteristics of Nanometric Surface Topography Generated by Diamond Turning. J. Manuf. Process. 2021, 67, 23–34. [Google Scholar] [CrossRef]
  7. Harvey, J.E.; Pfisterer, R.N. Understanding Diffraction Grating Behavior: Including Conical Diffraction and Rayleigh Anomalies from Transmission Gratings. Opt. Eng. 2019, 58, 087105. [Google Scholar] [CrossRef]
  8. Zhou, T.; Zhou, J.; Chen, H.; Wang, Z.; Ruan, B.; Zhao, W.; Wang, X. Study of diffractive fringes caused by tool marks for fast axis collimators fabricated by precision glass molding. Opt. Express 2022, 30, 26581–26596. [Google Scholar] [CrossRef]
  9. Zhou, P.; Xue, C.; Yang, C.; Liu, C.; Liu, X. Diffraction Efficiency Evaluation for Diamond Turning of Harmonic Diffractive Optical Elements. Appl. Opt. 2020, 59, 1537–1544. [Google Scholar] [CrossRef]
  10. Youngworth, R.N.; Stone, B.D. Simple Estimates for the Effects of Mid-Spatial-Frequency Surface Errors on Image Quality. Appl. Opt. 2000, 39, 2198–2209. [Google Scholar] [CrossRef]
  11. Liang, K.; Forbes, G.W.; Alonso, M.A. Validity of the Perturbation Model for the Propagation of MSF Structure in 2D. Opt. Express 2019, 27, 3390–3408. [Google Scholar] [CrossRef]
  12. Liang, K.; Forbes, G.W.; Alonso, M.A. Validity of the Perturbation Model for the Propagation of MSF Structures in 3D. Opt. Express 2020, 28, 20277–20295. [Google Scholar] [CrossRef] [PubMed]
  13. Li, L.; Collins, S.A., Jr.; Yi, A.Y. Optical Effects of Surface Finish by Ultraprecision Single Point Diamond Machining. J. Manuf. Sci. Eng. 2010, 132. [Google Scholar] [CrossRef]
  14. Fang, F.Z.; Huang, K.T.; Gong, H.; Li, Z.J. Study on the Optical Reflection Characteristics of Surface Micro-Morphology Generated by Ultra-Precision Diamond Turning. Opt. Lasers Eng. 2014, 62, 46–56. [Google Scholar] [CrossRef]
  15. Yin, Z.; Yi, Z. Direct polishing of aluminum mirrors with higher quality and accuracy. Appl. Opt. 2015, 54, 7835–7841. [Google Scholar] [CrossRef]
  16. Peng, W.; Hao, Z.; Yapeng, J.; Kun, Y.; Weihao, L. Removal of the single point diamond turning marks by spiral sine trace bonnet polishing process. Infrared Laser Eng. 2020, 49, 20200212-1–20200212-6. [Google Scholar] [CrossRef]
  17. Du, C.; Dai, Y.; Hu, H.; Guan, C. Surface roughness evolution mechanism of the optical aluminum 6061 alloy during low energy Ar+ ion beam sputtering. Opt. Express 2020, 28, 34054–34068. [Google Scholar] [CrossRef] [PubMed]
  18. Du, C.; Dai, Y.; Guan, C.; Hu, H. High efficiency removal of single point diamond turning marks on aluminum surface by combination of ion beam sputtering and smoothing polishing. Opt. Express 2021, 29, 3738–3753. [Google Scholar] [CrossRef]
  19. Chen, J.; Zhao, Q. A Model for Predicting Surface Roughness in Single-Point Diamond Turning. Measurement 2015, 69, 20–30. [Google Scholar] [CrossRef]
  20. He, C.L.; Zong, W.J.; Xue, C.X.; Sun, T. An Accurate 3D Surface Topography Model for Single-Point Diamond Turning. Int. J. Mach. Tools Manuf. 2018, 134, 42–68. [Google Scholar] [CrossRef]
  21. He, C.L.; Wang, S.J.; Zong, W.J.; Zhang, S.T. Influence of tool edge waviness on the diffraction effect of diamond-turned optics: Theoretical simulation and experimental validation. Appl. Opt. 2019, 58, 1596–1605. [Google Scholar] [CrossRef] [PubMed]
  22. He, C.L.; Zong, W.J. Diffraction Effect and Its Elimination Method for Diamond-Turned Optics. Optics Express 2019, 27, 1326–1344. [Google Scholar] [CrossRef]
  23. He, C.; Zong, W. Influencing Factors and Theoretical Models for the Surface Topography in Diamond Turning Process: A Review. Micromachines 2019, 10, 288. [Google Scholar] [CrossRef] [PubMed]
  24. Sheng, P.; Shen, Z.; Jiang, L.; Fang, S.; Wang, Z. Turning Parameters Optimization for Diffraction Effect Suppression of Diamond-Turned Surface Combining Surface Micro-Topography Model and Scattering Theory. J. Manuf. Sci. Eng. 2021, 143, 111011. [Google Scholar] [CrossRef]
  25. Gaskill, J.D. Linear Systems, Fourier Transforms, and Optics, 1st ed.; Wiley-Interscience: New York, NY, USA, 1978. [Google Scholar]
  26. Harvey, J.E. Integrating optical fabrication and metrology into the optical design process. Appl. Opt. 2015, 54, 2224–2233. [Google Scholar] [CrossRef]
  27. Andrews, L.C. Special Functions of Mathematics for Engineers, 2nd ed.; SPIE–The International Society for Optical Engineering: Bellingham, WA, USA, 1997. [Google Scholar]
  28. Gross, H. (Ed.) Handbook of Optical Systems, Volume 1: Fundamentals of Technical Optics, 1st ed.; Wiley-VCH: Weinheim, Germany, 2005. [Google Scholar]
  29. Riley, K.F.; Hobson, M.P.; Bence, S.J. Mathematical Methods for Physics and Engineering: A Comprehensive Guide, 3rd ed.; Cambridge University Press: Cambridge, UK; New York, NY, USA, 2006. [Google Scholar]
  30. Born, M.; Wolf, E. Principles of Optics: 60th Anniversary Edition, 7th ed.; Cambridge University Press: Cambridge, UK, 2019. [Google Scholar] [CrossRef]
  31. Wolf, E. Introduction to the Theory of Coherence and Polarization of Light; Cambridge University Press: New York, NY, USA, 2007. [Google Scholar]
Figure 1. Theoretical residual height.
Photonics 10 00937 g001
Figure 2. Phase tilt introduced by gratings.
Photonics 10 00937 g002
Figure 3. Flowchart of TMTF coherent part algorithm.
Photonics 10 00937 g003
Figure 4. Flowchart of TMTF incoherent part algorithm.
Photonics 10 00937 g004
Figure 5. The diffraction efficiency as a function of incident wavelength was calculated for the +1st and 0th orders of the tested grating using both the RCWA algorithm the scalar TMTF algorithm.
Photonics 10 00937 g005
Figure 6. The diffraction efficiency as a function of incident angle was calculated for the +1st and 0th orders of the tested grating using both the RCWA algorithm and the scalar TMTF algorithm.
Photonics 10 00937 g006
Figure 7. Layout of RC coaxial reflective optical system.
Photonics 10 00937 g007
Figure 8. PSF of the Ritchey–Chrétien system. Each PSF is normalized to their corresponding diffraction efficiencies. (a) 0th order diffraction PSF; (b) +1st order diffraction PSF; (c) −1st order diffraction PSF; (d) superimposed PSF.
Photonics 10 00937 g008
Figure 9. Nominal MTF, MTF calculated by RCWA algorithm, MTF calculated by TMTF algorithm for a metal-based reflective optical system, and error between RCWA and TMTF.
Photonics 10 00937 g009
Figure 10. Layout of mid-wave infrared refractive optical system.
Photonics 10 00937 g010
Figure 11. Germanium lens surface with turning marks.
Photonics 10 00937 g011
Figure 12. MTF experimental test of mid-wave infrared optical system.
Photonics 10 00937 g012
Figure 13. Diffraction-limited MTF, nominal MTF, measured tangential and sagittal MTF, and TMTF of the mid-wave infrared refractive optical system.
Photonics 10 00937 g013
Table 1. Design parameters of the tested reflective blazed grating.
Design ParametersDesign Value
Blaze wavelength λ = 4.1 μ m
Design periodg = 30 μ m
Blaze order m B = 1
Incident wavelength2 μ m∼8 μ m
Incident angle−89 ∼89
Substrate materialAluminum
Table 2. Design and fabrication parameters of RC metal-based reflective system.
System ParameterValue
Pupil Diameter4 mm
Central Wavelength1550 nm
Focal Length288 mm
Mirror Substrate MaterialAluminum
Tool Head Radius1 mm
Feed Rate2 μ m/r
Table 3. Comparison of results between TMTF algorithm and RCWA algorithm.
AlgorithmOrderWaste Time
0+1−1
TMTF94.67%1.23%2.06%<1 min
VirtualLab Fusion (RCWA algorithm)97.468%0.00021379%0.00021379%∼4 h
Table 4. Design and processing parameters of mid-wave infrared refractive optical system.
ParameterValue
Entrance pupil diameter76.6 mm
Effective focal length305 mm
Wavelength3.7 μ m, 4.1 μ m, 4.8 μ m
Tool radius1 mm
Feed rate1 μ m/r
Disclaimer/Publisher’s Note: The statements, opinions and data contained in all publications are solely those of the individual author(s) and contributor(s) and not of MDPI and/or the editor(s). MDPI and/or the editor(s) disclaim responsibility for any injury to people or property resulting from any ideas, methods, instructions or products referred to in the content.

