Article

Multi-Objective Optimization for Submarine Cable Route Planning Based on the Ant Colony Optimization Algorithm

1
School of Electronic Engineering, Beijing University of Posts and Telecommunications, Beijing 100876, China
2
Hainan Acoustics Laboratory, Institute of Acoustics, Chinese Academy of Sciences, Haikou 570105, China
3
School of Science, Lanzhou University of Technology, Lanzhou 730050, China
*
Author to whom correspondence should be addressed.
These authors contribute equally to this work.
Photonics 2023, 10(8), 896; https://doi.org/10.3390/photonics10080896
Submission received: 14 June 2023 / Revised: 21 July 2023 / Accepted: 28 July 2023 / Published: 2 August 2023
(This article belongs to the Special Issue State-of-the-Art Optical Communication in China)

Abstract

:
It is essential to design an appropriate submarine cable route to reduce costs and improve reliability. A methodology that can be used for multi-objective optimization in submarine cable route planning is proposed and numerically studied in this paper. The costs and risks are numerically assessed and mapped to the geographical map. The pheromone and heuristic functions of the ant colony optimization (ACO) algorithm are associated with the geographical map of costs and risks, which enables it to search for a submarine cable route with multi-objective optimization. The results show that the submarine cable route designed by the methodology can effectively avoid high-cost and high-risk regions, which means that the designed submarine cable route is cost-effective and highly reliability.

1. Introduction

Submarine cabling is a critical infrastructure for international communications, carrying 99% of communication services [1] and playing an important role in promoting the development of global economy and culture. With rapid global development, the demand for submarine cable will further increase thanks to its advantages of large capacity, low latency, low attenuation, and so on.
However, the deployment and maintenance of submarine cables are costly [2]. These cables face potential damage from various risks including natural and anthropological activities [3,4,5]. Submarine cable route planning, the process of determining the laying path of the submarine cable, has a profound impact on the construction cost of the submarine cable and the hazards that it will face in the future. Therefore, the costs and reliability of the submarine cables must be taken into account in the process of submarine cable route planning. However, the optimization of the cost and reliability of the submarine cable cannot be achieved at the same time. For example, increasing the protection level of submarine cables can reduce its potential breakage, improving its reliability, but will increase its costs. The multi-objective optimization problem of cable cost and cable breakage probability causing by earthquake was formulated and studied in references [6,7]. Wang et al. converted the multi-objective optimization of the construction costs and potential repair number of important infrastructures to a single one through a weighted sum method [8]. The problem of optimizing both the cable planning path as well as the choice of protection levels for submarine cables, with the two conflicting objectives of minimizing cable failures and minimizing laying cost, was formulated and studied as a multi-objective optimization problem [9,10]. In addition, other risk factor considerations, such as volcano, terrain slope, and marine protected areas, were taken into account in the optimization [11]. The method used for solving the multi-objective optimization in the previous works, converting the multi-objective optimization into a single one through the weighted sum method, means that appropriate empirical weight values were required for different optimization objectives.
In this paper, we propose a methodology that can be used for solving the multi-objective optimization in submarine cable route planning based on the ant colony optimization (ACO) algorithm. We improve the pheromone and heuristic functions of the ACO algorithm, so that the weighted sum method is not required in our scheme. In addition to the threat of human and natural disasters to submarine cables, the threat of marine organisms to submarine cables is also taken into account in this paper. The costs and risks are numerically assessed and then are mapped to the geographical map through a digital raster (DS) map. The pheromone and heuristic functions of ACO are modified so it can be used for searching the Pareto sets of submarine cable route with multi-objective optimization on the geographical map. The results show that the submarine cable path designed by the methodology proposed in this paper can clearly avoid high-cost and high-risk regions.
The remainder of this paper is organized as follows. The numerical models of DS map, total costs, and risks assessment are described in Section 2. The multi-objective optimization for the submarine cable route planning and its solution are presented in Section 3. The validity of methodology is investigated in Section 4. Section 5 concludes the paper.

2. Models

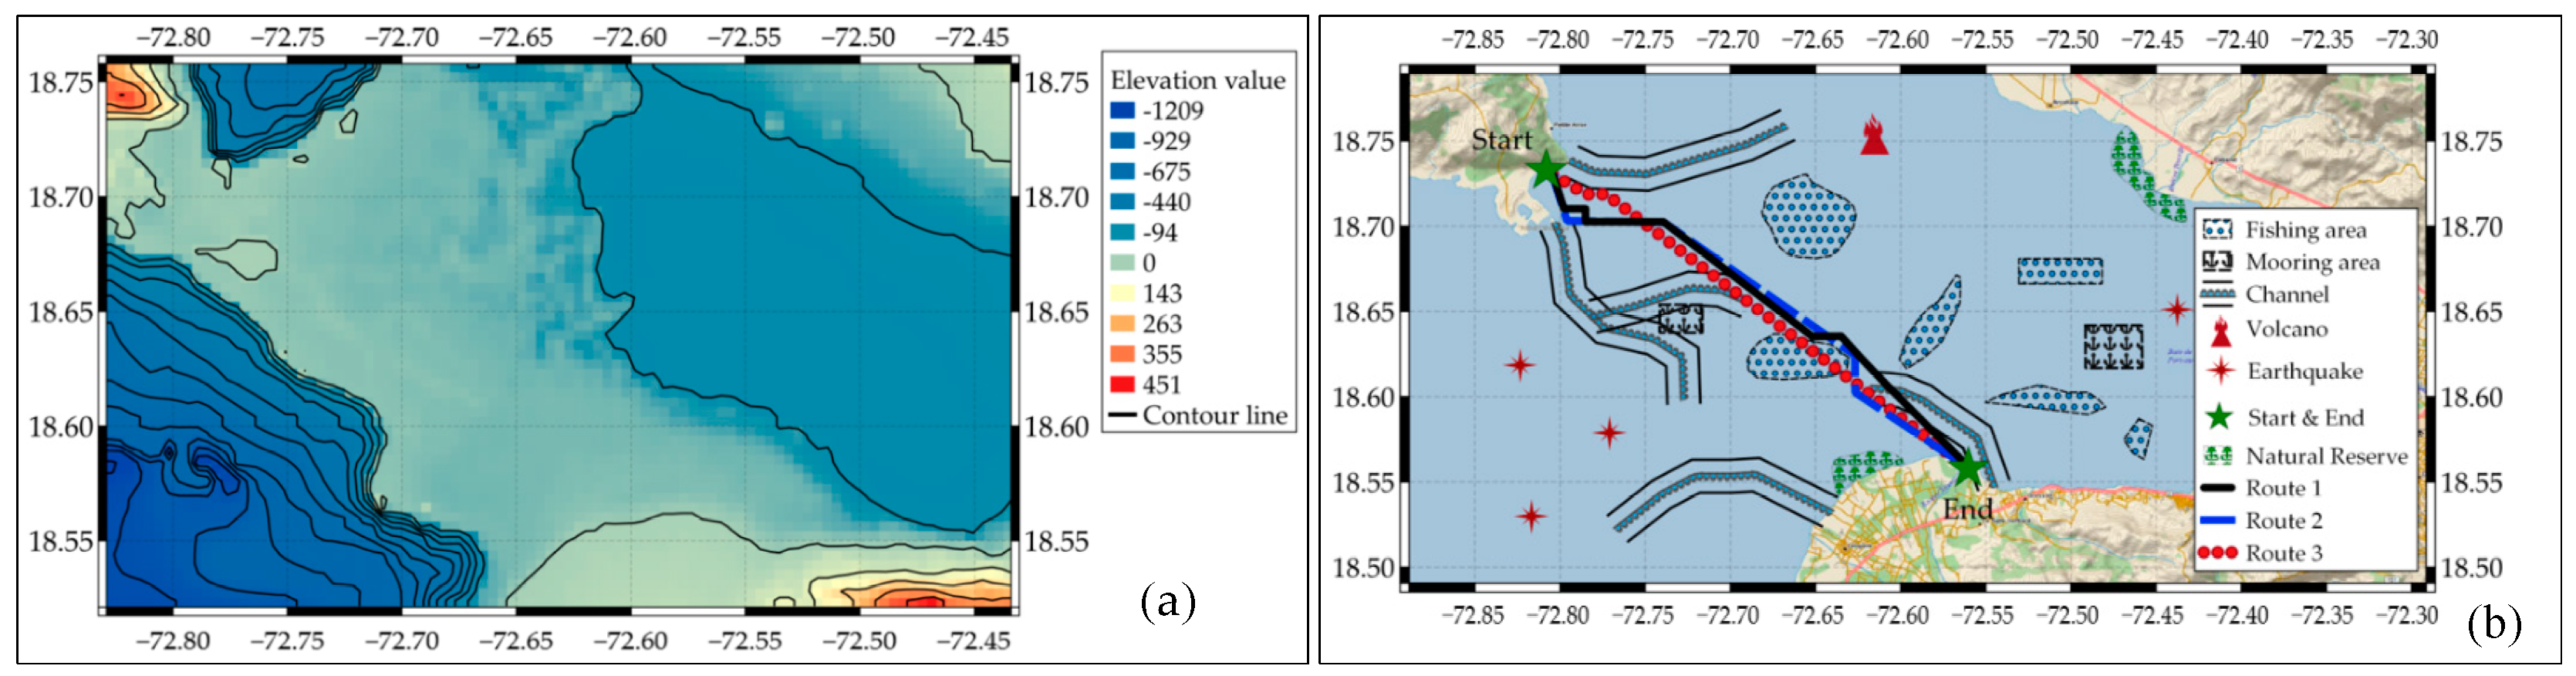
2.1. Model of Earth’s Surface

A digital elevation model (DEM) is used to depict the key factors that are closely related to submarine cable path planning. Any point in the target region can be described by a 3-dimensional coordinate ( x , y , z ) , z = ξ ( x , y ) . z is the elevation corresponding to the geographic location ξ ( x , y ) . The costs and risk assessment are simultaneously considered as key factors in cable path planning, and constructed into two elevation maps.
The DS map is used to depict the location of the X–Y plane, which is then used by the ant colony to search for the submarine cable path with muti-objective optimization. As shown in Figure 1, the target region is divided into a two-dimensional map of M × N grid cells, which are identified through a two-dimensional label of L 2 d ( I , J ) . For an ant that is located at grid cell ( i , j ) , there are eight candidate points as the next point of the target submarine cable route. To improve the efficiency of search, the one-dimensional label L 1 d is used to replace L 2 d to identify the grid cell in this paper. Assuming that a grid cell locates at l 2 d ( i , j ) in the two-dimensional map, and its one-dimensional label is l 1 d . Their relationship can be described as
l 1 d = N ( i 1 ) + j      i [ 1 , M ] ,   j [ 1 , N ]
{ i = l 1 d / N j = l 1 d N i
where represents the operation of rounding down.

2.2. Model of Costs

The costs including construction costs and material costs are considered in this paper.
(1)
Material costs
Material costs represent the costs of purchasing submarine cable, which is mainly related to the protection level of the submarine cable. Assuming that C L W (CNY 1000/km) is the material costs of light protection optical cable (LW). The material costs of the single-armor (SA) cable and double-armor (DA) cable are 1.3 times and 1.6 times that of the LW, respectively. The material costs of cable at location ξ can be described as
C 1 ( ξ ) = { C L W H > 1000   m 1.3 C L W 200   m < H < 1000   m 1.6 C L W 0 < H < 200   m | | R i = 1
where H represents the depth of water, and R i is the decision factor of submarine cable type, which is set to 1 if more reliable protection measures need to be taken; otherwise, it is set to 0.
(2)
Construction costs
The construction costs of the submarine cables are mainly related to its deployment way. Assuming that C L a y (CNY 1000/km) denotes the construction costs of laying the submarine cables on the seabed directly, and the construction costs of burying submarine cables increases exponentially with the burial depth. In addition, for some forbidden areas, e.g., military areas, the construction costs are set to a maximum value of C m a x . Therefore, the construction costs at ξ can be described as
C 2 ( ξ ) = { C m a x H < 0   m | | T i = 1 C L a y H > 1000   m C L a y e h / 2 other
where H and h represent the depth of water and that of burial, and T i denotes the decision factor of deployment, which is set to 1 if the location is a forbidden zone; otherwise, it is set to 0.
Assume a submarine cable path denoted with γ is made up of n nodes, which is described as γ = ( v 0 , v 1 , , v n 1 ) . e i = ( v i , v i + 1 ) ( v i v i + 1 ) represents the segment between nodes v i and v i + 1 , whose length is denoted with l v i v i + 1 . The total costs per kilometer at position ξ can be described as C ( ξ ) = C 1 ( ξ ) + C 2 ( ξ ) . The l v i v i + 1 is divided into two parts with identical length, and C ( v i ) and C ( v i + 1 ) is uses to calculate their total costs, respectively. Therefore, the total costs of e i = ( v i , v i + 1 ) and that of γ can be respectively described as
f c ( e , v i , v i + 1 ) = l v i v i + 1 2 C ( v i ) + l v i v i + 1 2 C ( v i + 1 )
F c ( γ , v 0 , v n 1 ) = i = 0 n 2 f c ( e i , v i , v i + 1 )  

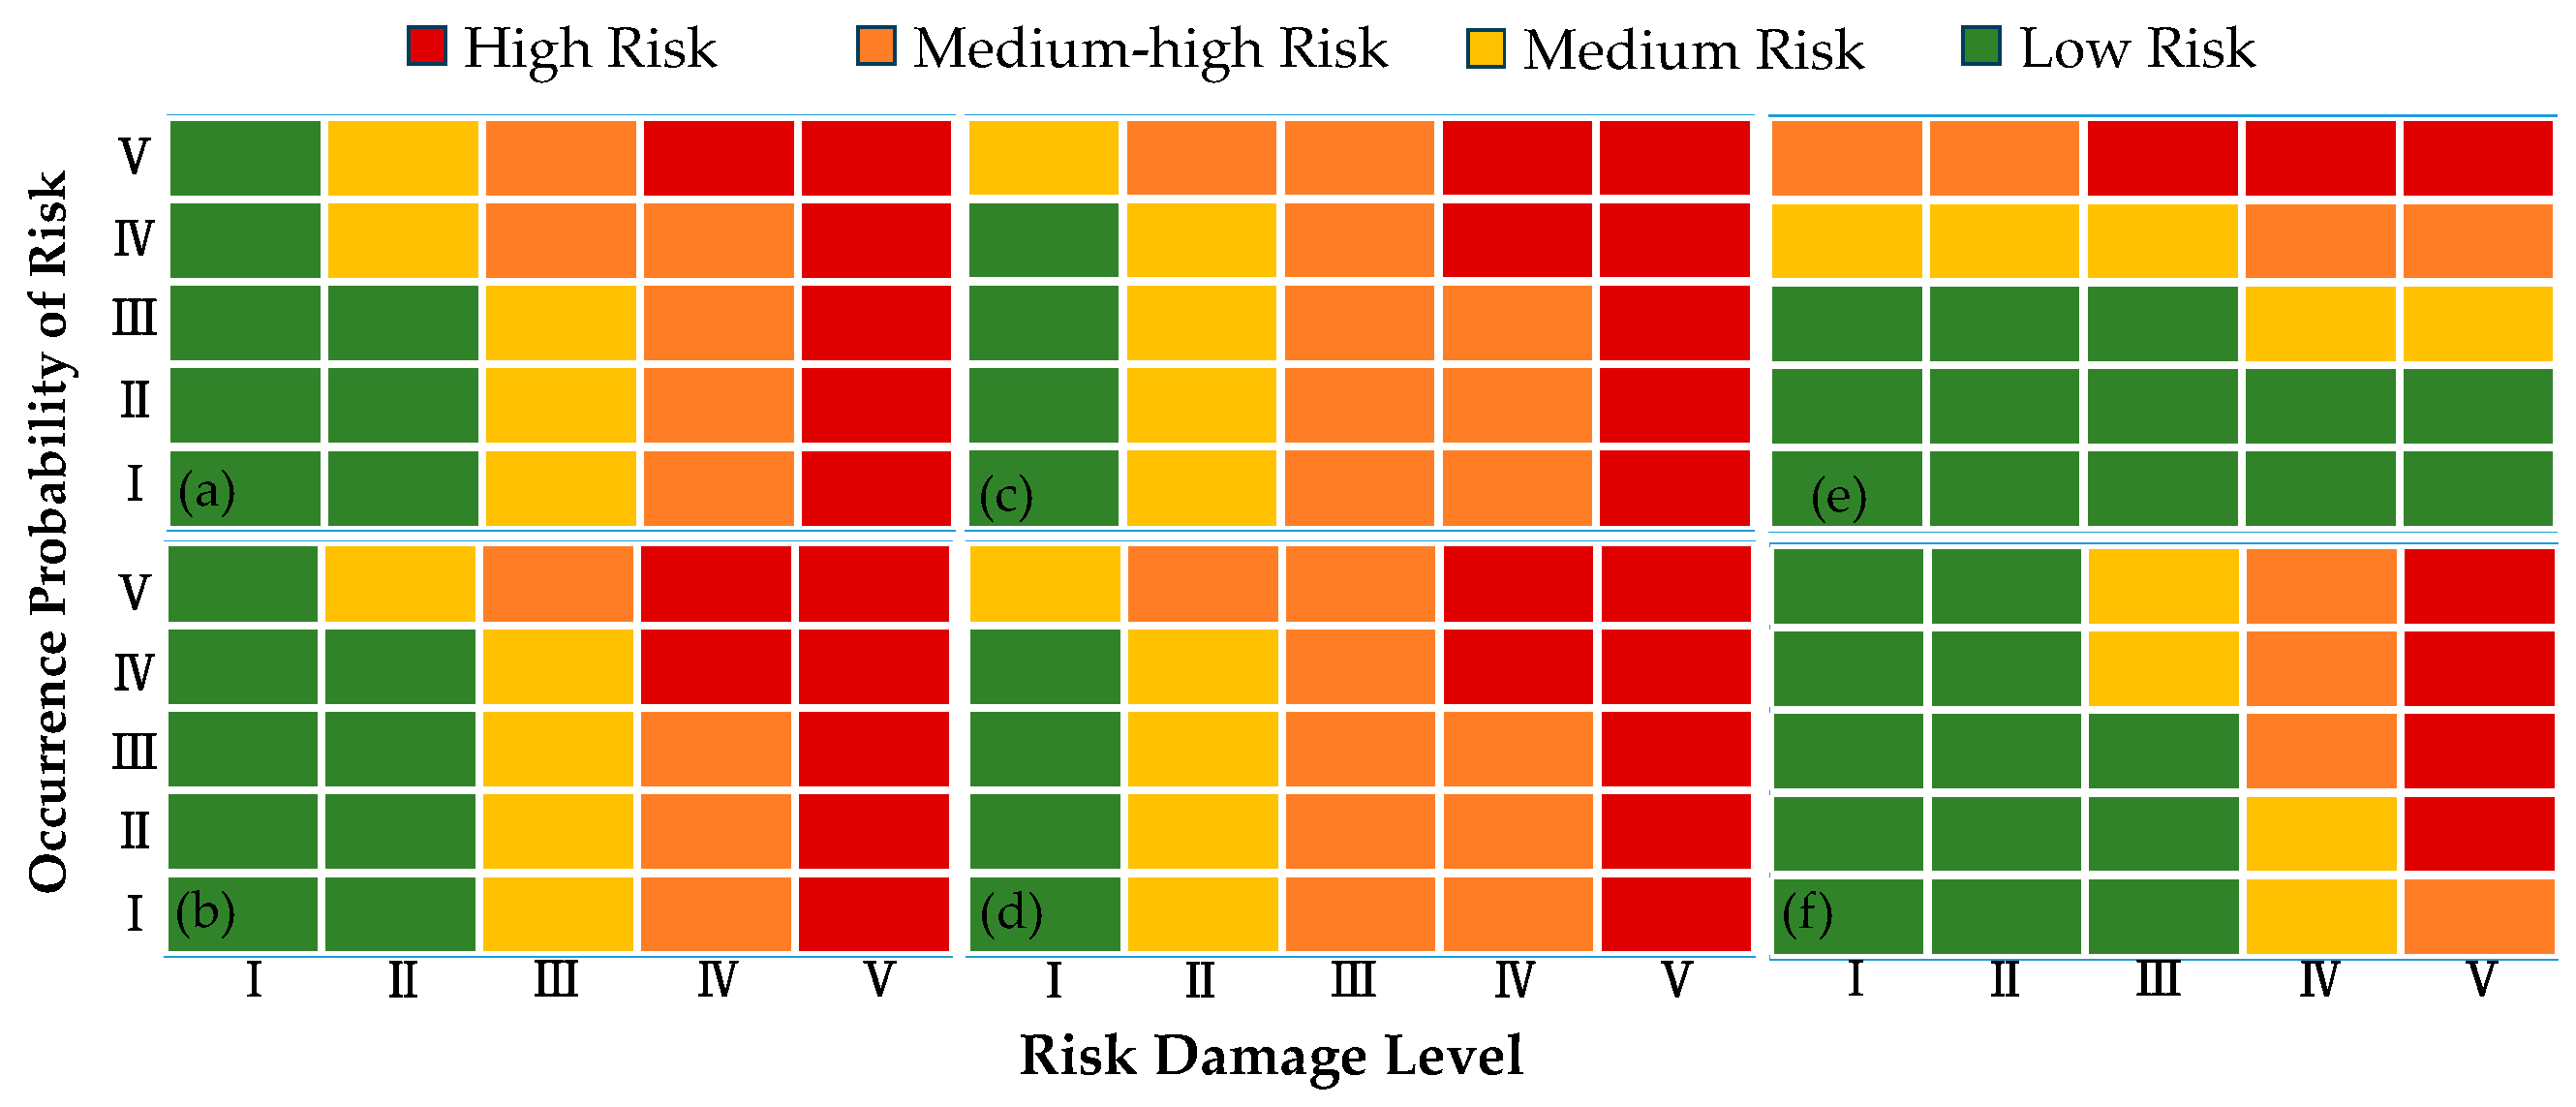
2.3. Model of Risk Assessments

Although the damage of some risks is not serious, they cannot be ignored because of their high probability of occurrence. Therefore, the damage level of risks and its occurrence probability should be taken into account simultaneously in the assessment. We define five classification levels for risk occurrence possibility and damage, respectively, as ranked in Table 1. The risk occurrence possibility covers the range from very low probability to very high probability, and the risk occurrence possibility covers the range from no cable damage to major cable damage. The classification levels of damage are defined based on the occurrence probability of risks and the protection measures experience in engineering. Therefore, the scheme proposed in this paper can comprehensively evaluate both risk occurrence possibility and different protection measures simultaneously. In this paper, six kinds of risks proven to have a significant impact on the reliability of submarine cables will be evaluated.
(1)
Fishery activities
The hazard arising from fishery activities on the submarine cables is trawling. The occurrence possibility of the submarine cable breakage caused by fishery activities can be assessed by the number of hits of submarine cable per kilometer in a year [12]. The number of hits of submarine cable per kilometer in a year denoted with P h i t , t r a w l are related to the number of trawls per ship, the density of fishing vessels, the speed of the trawler, the submarine cable length exposed to trawl path, and the angle of prevailing trawl direction relative to pipe vertical. The damage to submarine cables caused by fishing trawls is related to the trawls’ hitting depth and the burial depth of submarine cables [13]. The occurrence possibility and damage levels of the fishery activities are ranked in Table 2.
(2)
Shipping activities
The hazard arising from shipping activities on the submarine cables is anchoring. The occurrence possibility of submarine breakage resulting from shipping activities has been studied in [14], and can be evaluated as the probability that shipping anchors hit submarine cables. The probability that shipping anchors hit submarine cables denoted with P h i t , a n c h o r is related to the number of anchors, the probability of the ship dropping anchor in the submarine cable routing area, and the probability that the submarine cable could be hit in one time of anchoring. Damage to submarine cables resulting from anchoring is related to the depth of anchor penetration and the burial depth of submarine cables [15]. The occurrence possibility and damage levels of the shipping activities are ranked in Table 3.
(3)
Earthquakes
The seismic force caused by earthquake may lead to the sliding of the fault zone, which could further result in submarine cable interruption. Referring to [16], the occurrence possibility of submarine breakage caused by earthquakes can be assessed through peak ground velocity (PGV), and then using the PGV to calculate the repair rate of the submarine cable. The repair rate is denoted by P r r . P r r is further used to evaluate the probability of damage to submarine cables caused by earthquakes. The damage level of submarine cables caused by earthquakes is related to its margin length as the margin length of submarine cables can release the tension resulting from earthquakes [17]. The occurrence possibility and damage levels of the earthquakes are ranked in Table 4.
(4)
Volcanos
Volcanos could cause other disasters, such as earthquakes, tsunamis, and landslides and so on, which would further increase the tension of submarine cables resulting in breakage. The occurrence possibility of submarine breakage caused by volcanos can be assessed through volcanic explosivity index (VEI) [18]. The eruption probability of the volcano in the next year can be calculated based on the VEI, which is related to the number of volcanic eruptions with VEI level, and the time interval between the earliest eruption in history and the most recent one. The eruption probability denoted with P v o l is used to evaluate the probability of damage to submarine cables caused by volcanos. Since the volcanos cause damage to submarine cables by increasing the tension of submarine cables, which is similar to that of the earthquakes. Therefore, the damage levels of volcanoes are the same as that of earthquakes. The occurrence possibility and damage levels of the volcanos are ranked in Table 5.
(5)
Submarine slope
Seabed areas of higher slope are more prone to generate hazards, which would increase the tension of submarine cables, and could further lead to damage. Therefore, the possibility of damage to submarine cables caused by the slope can be assessed with its angle denoted with β . To improve the resistance of submarine cables to damage caused by the slope, some margin of submarine cable should be reserved [19]. The occurrence possibility and damage levels of the submarine slope are ranked in Table 6.
(6)
Marine organisms
The potential hazard to the submarine cable caused by marine organisms is that the submarine cable could be bitten by marine organisms, such as sharks in the deep sea. We use the proportion of submarine cables bitten by marine organisms denoted with P f i s h to evaluate the possibility of marine organism damage to the submarine cables. Previous research has revealed that P f i s h is correlated with latitude [20] and the depth of the water [21]. An effective way to prevent the submarine cables from being bitten by marine organisms is using submarine cables with proper protection measures. The occurrence possibility and damage levels of marine organism are summarized in Table 7.
The risk matrix is used to generate a hybrid assessment considering both the occurrence probability and damage levels of risks. To assess the relative importance of the six risks mentioned above, the ranking method and analytical hierarchical process (AHP) introduced in [22] are used to determine the weight values w i for the i th risk consideration. Assuming that A s i ( ξ ) denotes the hybrid assessment score of i risk at ξ and its weight is w i , the final evaluation score of i risk can be described as
A ( ξ ) = w i × A s i ( ξ ) E i × w i
where i represents six types of the risk and E i is a symbol factor. E i is set to 1 when the i risk consideration exists; otherwise, it is set to 0. Therefore, the risk assessment score of e i = ( v i , v i + 1 ) and that of γ can be respectively described as
f s ( e , v i , v i + 1 ) = l v i v i + 1 2 A ( v i ) + l v i v i + 1 2 A ( v i + 1 )
F s ( γ , v 0 , v n 1 ) = i = 0 n 2 f s ( e i , v i , v i + 1 )  

3. Problem Formulation and Solution

3.1. Multi-Objective Optimization

Based on the models of the costs and the risk assessments, the multi-objective optimization model of submarine cable path γ can be described as
min   Z ( γ ) = [ F c ( γ , s , d ) , F s ( γ , s , d ) ]
where F c ( γ , s , d ) and F s ( γ , s , d ) refer to the costs and the risk assessment score of the submarine cable path γ . The starting point and the ending point of γ are marked as s and d . Then, F c ( γ , s , d ) and F s ( γ , s , d ) can be described as
F c ( γ , v 0 , v n 1 ) = i = 0 n 2 f c ( e i , v i , v i + 1 )
F s ( γ , v 0 , v n 1 ) = i = 0 n 2 f s ( e i , v i , v i + 1 )
  • subject to: e i = ( v i , v i + 1 ) , e i γ
  • v 0 = s , v n 1 = d
  • v i γ , the number of segments containing v i does not exceed 2.

3.2. Solution

To solve the multi-objective optimization problem described in Formulas (10)–(12), the ACO is adopted in this paper. The ACO is generally used to solve distance-related or single-goal optimization problems. However, the costs and risks of the submarine cable path should be optimized simultaneously in submarine cable route planning. Therefore, some improvements to the ACO should be made for achieving multi-objective optimization of submarine cable route planning.
Assuming the total number of ants is N a n t , each ant is tagged with k ( k = 1 N a n t ) . The ant k located at v i position at the t moment, will go to v j with the probability of p i j k . p i j k can be described as
p i j k = { [ τ i j ( t ) ] α [ η i j ( t ) ] β j a l l o w e d i k [ τ i j ( t ) ] α [ η i j ( t ) ] β j a l l o w e d i k 0 other
where τ , η refer to pheromone and heuristic function, respectively; α , β are the pheromone factor and heuristic function factor, which indicate the importance of pheromone and heuristic function, respectively; a l l o w e d i k represents the node sets that can be selected by the ant k , which is composed of the neighbor points of v i excepting the nodes that have already been chosen by ant k . As mentioned above, τ and η need to be modified to make the ACO suitable for use in submarine cable route planning in the case of multi-objective optimization. The η i j considering both the costs and risks can be described as
η i j = 2 f c ( i , j ) M i n f c ( i ) M a x f c ( i ) M i n f c ( i ) f s ( i , j ) M i n f s ( i ) M a x f s ( i ) M i n f s ( i )
M i n f a ( i ) = min { f a ( i , j ) } ,   j a l l o w e d i k , a = c , s
M a x f a ( i ) = max { f a ( i , j ) } ,   j a l l o w e d i k , a = c , s
To accelerate the convergence process and to avoid falling into suboptimal solution, two strategies—global pheromone update and local pheromone update—are proposed in this paper. The global pheromone update uses the global information to calculate τ i j in the next moment after all the ants have already finished searching, which can be described as
τ i j ( t + 1 ) = ( 1 ρ ) × τ i j ( t ) + c k = 1 N a n t Δ τ i j k ( t , t + 1 )
where ρ is the pheromone volatilization factor and Δ τ i j k ( t , t + 1 ) is the pheromone released by ant k on the segment e i = ( v i , v j ) . Considering both the costs and risks, Δ τ i j k ( t , t + 1 ) can be described as
Δ τ i j k ( t , t + 1 ) = 1 [ ( f t o t _ c k M i n f t o t _ c M a x f t o t _ c M i n f t o t _ c ) + ( f t o t _ s k M i n f t o t _ s M a x f t o t _ s M i n f t o t _ s ) ]
where f t o t _ c k and f t o t _ s k represent the total costs and the total risk assessment score of a feasible submarine cable route searched by the ant k . The minimum costs and minimum risk assessment score of all the feasible submarine cable paths are denoted by M i n f t o t _ c and M i n f t o t _ s , respectively, and the corresponding the maximum ones are represented using M a x f t o t _ c and M a x f t o t _ s . In addition to the global pheromone update, the pheromone of the feasible submarine cable path should be updated when an ant has already arrived at the ending point, i.e., the local pheromone update. The local pheromone update can expand the search space, allowing the ACO to avoid falling into local optimum, and it can be described as
τ i j ( t + 1 ) = ( 1 γ ) × τ i j ( t ) + γ τ 0
where γ is the pheromone volatilization factor, which is set to be the same as ρ in the simulation, and τ 0 represents the initial pheromone. The combination rules of randomness and directionality is adopted for next node selecting to accelerate convergence and achieve global searching, which chooses the next node selecting rule through a random variable. Assuming that q 0 ( 0 < q 0 < 1 ) is a decision threshold constant, q is a random number in the range (0–1). The node of max j a l l o w e d i k { [ τ i j ( t ) ] α [ η i j ( t ) ] β } will be chosen as the next node if q q 0 , i.e., the directionality rule. Otherwise, the next node will be chosen from Equation (13) by means of a turntable, i.e., the randomness rule.
The flow chart of the ACO is shown in Figure 2. First, the method depicted in Section 2 is used to create the DS maps of costs and risks. Second, each ant will be placed at the starting point, and they will search for the feasible submarine cable paths point by point according to the methods described in Section 3.1. Finally, the Pareto sets could be obtained by analyzing all feasible submarine cable paths. It is worth emphasizing that the search ability of the ACO algorithm is closely related to N a n t , and the optimal N a n t will be studied later. Meanwhile, it is reasonable to divide N a n t into several ant subgroups, and these ant subgroups search in parallel to accelerate the convergence process in practice.

4. Results and Discussion

To verify the search ability of the ACO algorithm, we design an area with a high density of risks as the target region. A bay-like region R from the southwest point ( 18.52 ° N , 72.83 ° W ) to the northeast point ( 18.76 ° N , 72.4339 ° W ) is chosen to illustrate the methodology mentioned above. The DEM of R can be obtained from the website https://download.gebco.net, as shown in Figure 3a. The DS map is adopted to build the situation field of various factors, with a resolution of about 500   m × 500   m . Several risk factors, e.g., volcanos, are designed in region R to illustrate the effectiveness of the methodology, as shown in Figure 3b. It can be seen from Figure 3b that the risks are dense in region R , which is harsh enough to test the search ability of the ACO algorithm. The locations of the starting point and the ending point refer respectively to ( 18.7326 ° N , 72.8082 ° W ) and ( 18.5436 ° N , 72.4813 ° W ), which are marked with green pentagrams in Figure 3b.

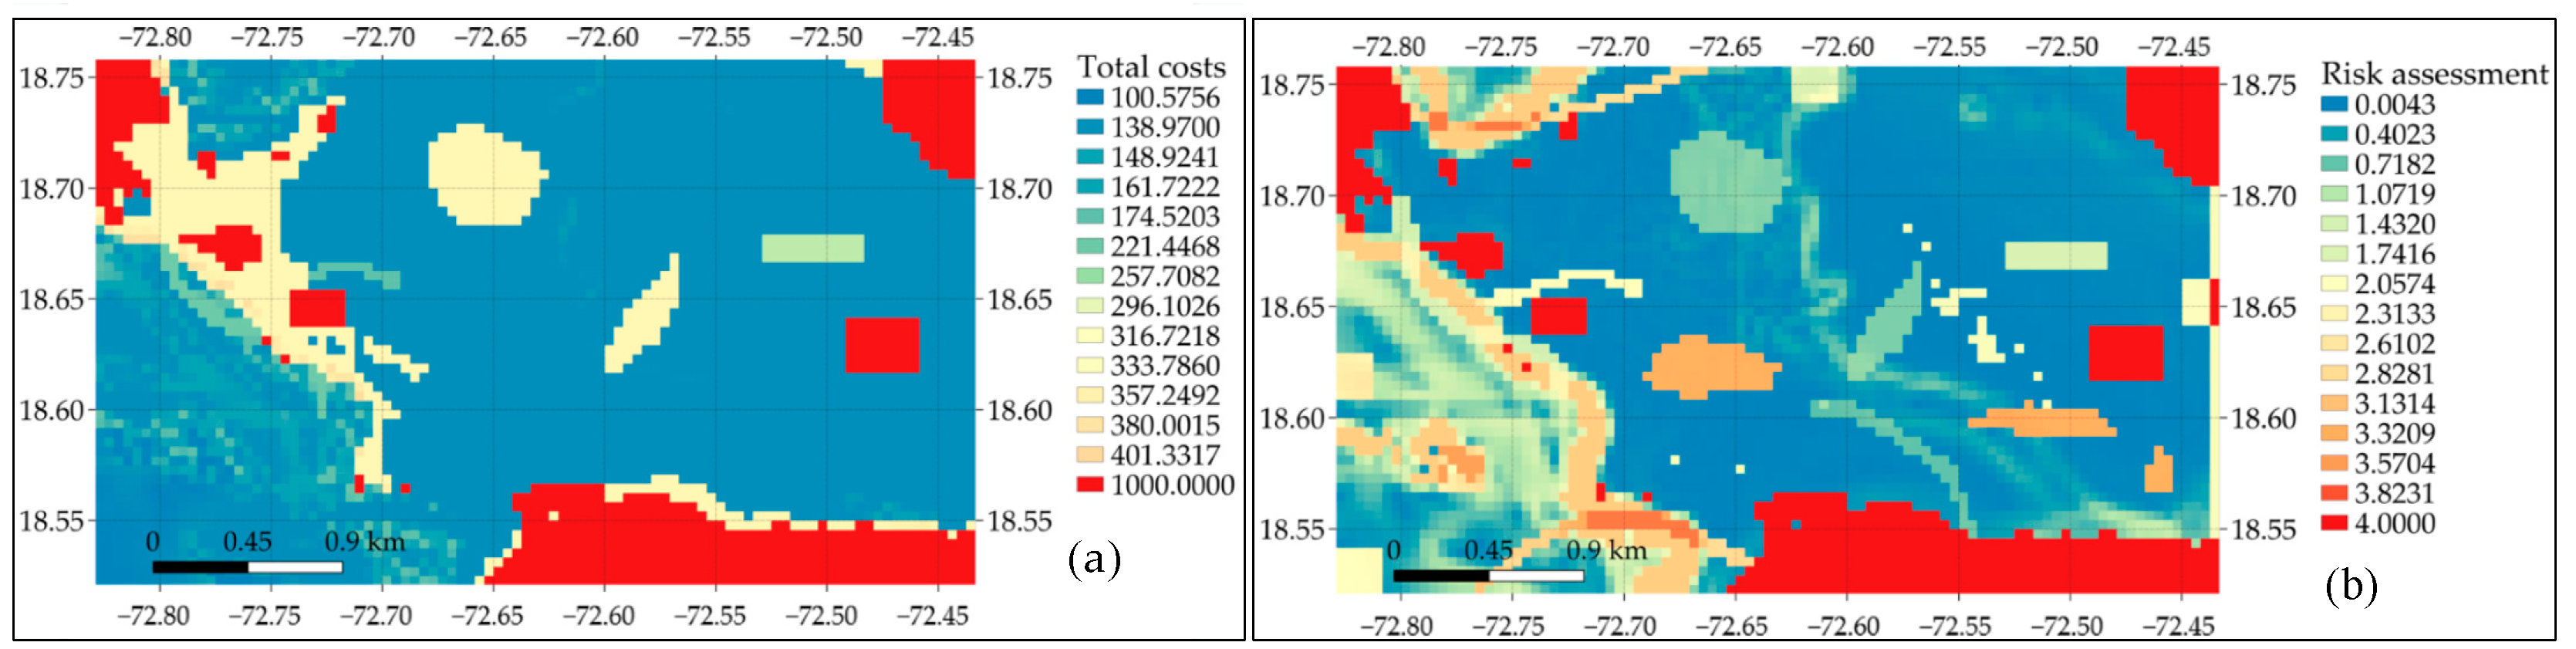
4.1. Quantification of Costs and Risks

The risk matrix is used to generate a hybrid assessment for the six risks given in the Table 2, Table 3, Table 4, Table 5, Table 6 and Table 7, in which both the risk occurrence probability and its damage levels are taken into account. The risk occurrence probability and its damage levels are distributed in two dimensions of risk matrix, respectively. The intersection of the two dimensions is evaluated and ranked according to practical experience, which is then used as the hybrid assessment. The hybrid assessments are categorized into four levels, high risk, medium-high risk, medium risk and low risk, with corresponding scoring bands of [ 0 , 1 ] , ( 1 , 2 ] , ( 2 , 3 ] , and ( 3 , 4 ] , respectively, as shown in Figure 4.
Saaty’s ranking method is used to calculate the w i of the i th risk considerations, for which the comparison matrix is summarized in Table 8. Assuming that n i j represents an element of the assessment matrix, then the i th risk is more important than the j th one if n i j > 1 . Then, the AHP introduced in [22] is utilized to translate the qualitative prioritization into weight values for the corresponding design considerations. The weight values for earthquake, volcano, marine organism, submarine slope, fishery activities, and shipping activities are 7.138%, 8.968%, 2.976%, 7.138%, 52.134%, and 21.645%, respectively.
Based on the quantification of costs and risks, we can calculate the distribution of various risk factors. According to engineering experience, the C L W is set to 70. The C max should be set to a high value so that the ACO algorithm can effectively avoid some forbidden areas, and the C max is set to 1000 in the simulation. The depth of water can be obtained by DEM. The total costs per kilometer of a node in region R can be calculated through Formulas (3) and (4), for which the distribution is shown in Figure 5a. To maximize the reliability of submarine cables, the occurrence probability of all risks is assumed to be the highest level. The distribution of risk assessment can be obtained through risk matrices and the AHP, as shown in the Figure 5b.

4.2. Optimal Setting Parameters of the Ant Colony Algorithm

As mentioned above, the search ability of the ACO algorithm is closely related to N a n t . To find the optimal number of ants, we set α , β , τ 0 , p 0 , and T max to 1, 1, 1, 0.9, and 150, respectively, and we set N a n t to 200, 500, 700, 1000, and 1200, respectively. The convergence process of the total costs and risk assessment score in the case of different ant numbers is shown in Figure 6a,b. It can be seen that the convergence process of the total cost and risk assessment scores first accelerates and then slows down as the number of ants increases. The fastest convergence of both total costs and risks assessment score can be achieved when N a n t is 500. However, the minimum of both total costs and risk assessment score can be obtained in the case of N a n t = 700 . As the target of this paper is to achieve multi-objective optimization of total cost and risk assessment, N a n t is set to 700 in the simulation. In addition, the number of iterations at which both total cost and risk assessment score reach convergence in the case of N a n t = 700 is less than 100. Therefore, T max is set to 100, which has reserved sufficient margin.

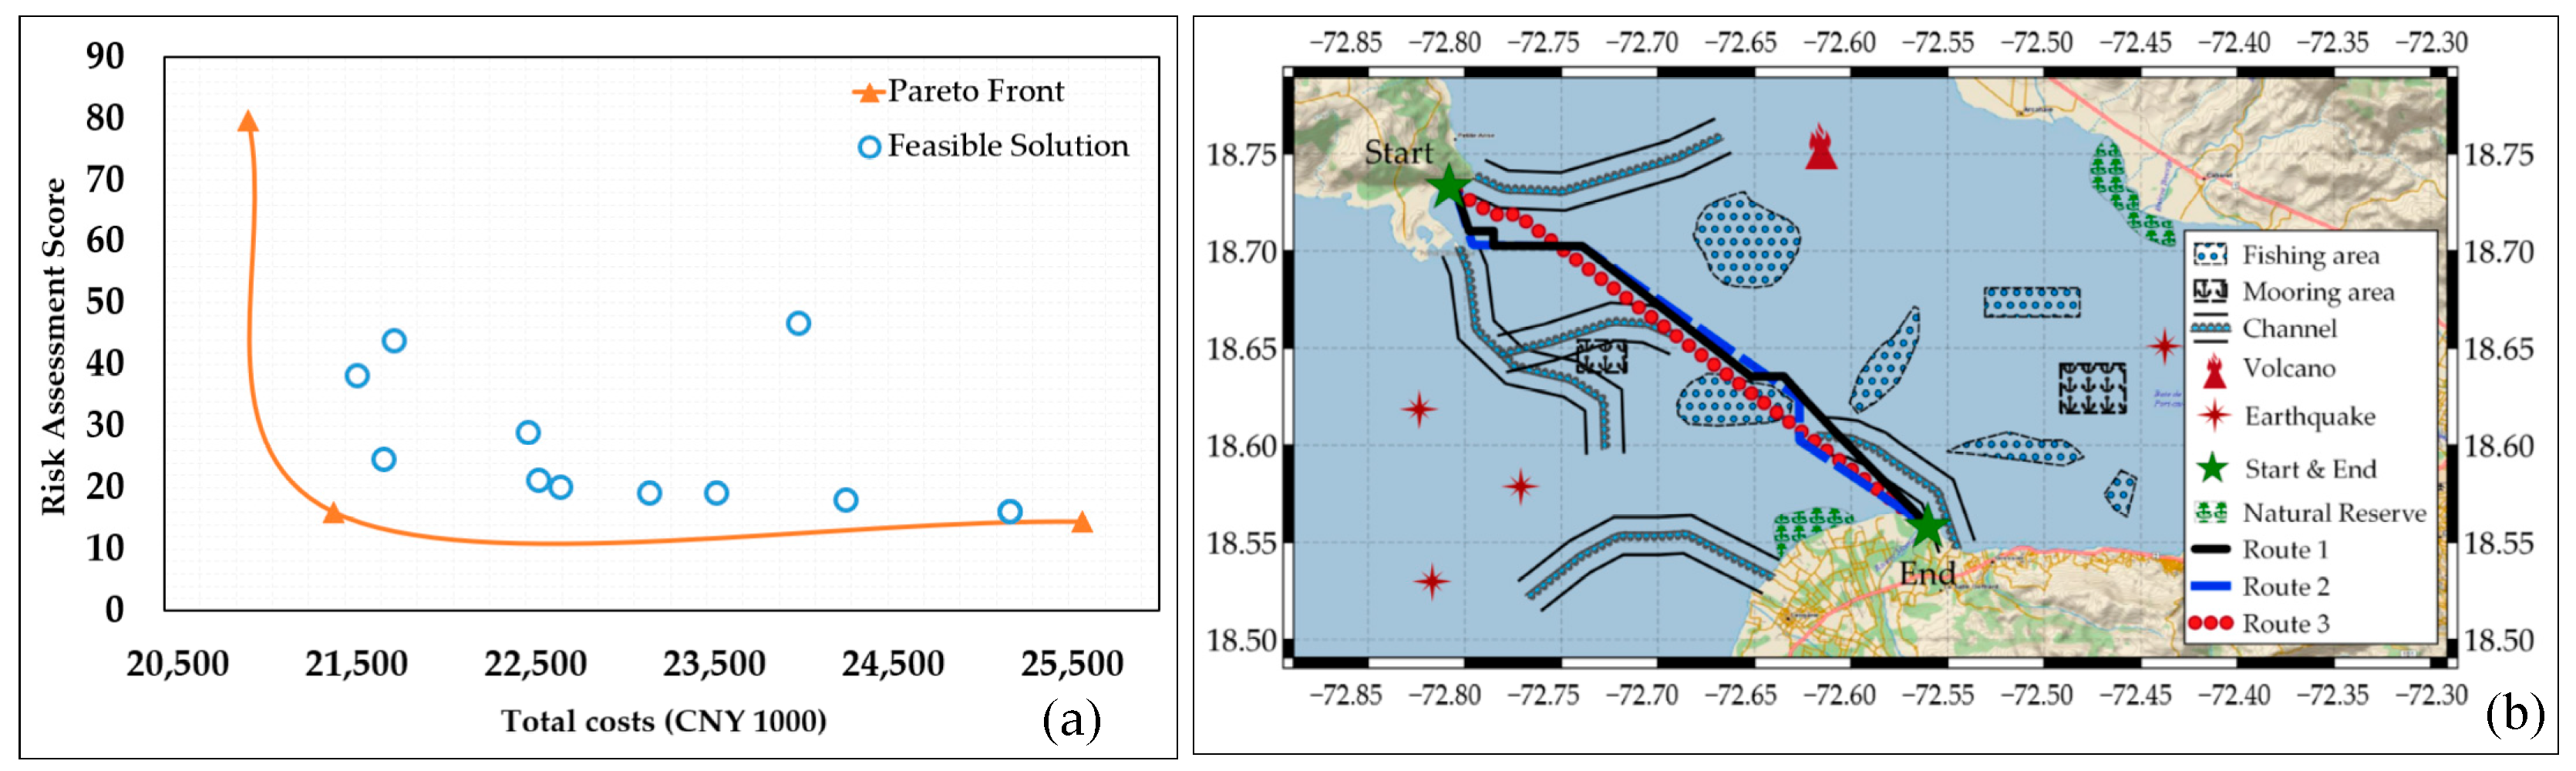
4.3. Multi-Objective Optimized Submarine Cable Path Planning

Based on the models described above, we plan to design a submarine cable path conforming to the multi-objective optimization described in Formulas (10)–(12). The feasible solution sets and Pareto frontier is shown in Figure 7a. Each point of feasible solution sets represents a feasible submarine cable route, which are dominated by the Pareto frontier. The Pareto frontier is the non-dominated feasible solutions, which provide us with the results of the optimization problems of minimizing total costs subject to a risk assessment score and minimizing risk assessment score subject to certain total costs. As can be seen from Figure 7a, there are three feasible solutions located at the Pareto frontier. When the costs of a Pareto submarine cable path are low, its risks are higher, such as route 3. When the costs of a Pareto submarine cable path are high, its risks are low, such as route 2. Therefore, the costs and risks of submarine cables are two conflicting optimization objectives.
The paths of three feasible solutions locate at the Pareto frontier are drawn in Figure 7b. Since the Pareto frontier may have more than one solution, we define a composite score based on total costs and risk assessment score to further judge which solution is the optimum. Assuming the number of Pareto sets is N p and the index of the Pareto solution is p ( p = 1 N p ), F c p and F s p are the total cost and risk assessment of the Pareto solution denoted with p . The average total cost and average risk assessment of the Pareto sets are F c a v g and F s a v g , respectively; then, the composite score of the solution p can be described as U p = F c a v g / F c p + F s a v g / F s p . The optimal solution of the Pareto sets is the one with the maximum composite score. The total costs of routes 1–3 are 21,437.9, 25,574.8, and 20,967, and their corresponding risk assessment scores are 15.9852, 14.4235, and 79.8103, respectively. Then, the composite score of submarine cable routes 1–3 are 3.3554, 3.4332, and 1.5411, respectively. The maximum composite score of the Pareto sets is 3.4332, corresponding to submarine cable route 2. It can be seen from Figure 7b, compared with route 1 and route 3, route 2 obviously avoids both high-cost and high-risk areas more effectively, which further confirms that the scheme proposed in this paper has a guiding function on submarine cable route planning in practice. Relying on the robust search ability of ACO, we can obtain the Pareto solutions for total cost and risk assessment score optimization for submarine cable route planning, which does not require converting the multiple objective optimization to the single one.

5. Conclusions

A methodology that can be used for submarine cable route planning under the conditions of multi-objective optimization was proposed and numerically studied in this paper, in which the total cost and six classical risks were taken into account simultaneously. The total cost and risks were numerically evaluated and mapped to the geographical location. An improved ACO algorithm was designed, making it suitable for searching the Pareto sets of submarine cable route under the condition of optimizing both the total cost and risks through associating its pheromone and heuristic functions with the total cost and risks. A composite score was defined to determine which solution of Pareto sets could be used as the optimum submarine cable path. Finally, the methodology was verified through a scenario of submarine cable route planning. The results show that the submarine cable route planned by the methodology clearly avoids both high-cost and high-risk areas, which confirms that the methodology has a guiding function on submarine cable route planning in practice.

Author Contributions

Conceptualization, G.G. and J.W.; methodology, J.W. and Z.Z.; software, J.W. and Z.Z.; validation, J.W., H.W. and Z.Z.; formal analysis, J.W. and Z.Z.; investigation, H.W.; resources, H.W.; data curation, H.W.; writing—original draft preparation, J.W. and Z.Z.; writing—review and editing, J.W., Z.Z., D.W. and G.G.; visualization, Z.Z. and D.W.; supervision, G.G.; project administration, G.G.; funding acquisition, G.G. and D.W. All authors have read and agreed to the published version of the manuscript.

Funding

This work was supported in part by National Key Research and Development Program of China (2022YFB2903300), State Key Laboratory of Information Photonics and Optical Communication Grant (IPOC2020ZZ02), and the National Natural Science Foundation of China (No. 62141505).

Institutional Review Board Statement

Not applicable.

Informed Consent Statement

Not applicable.

Data Availability Statement

The data used to support the findings of this study are available from the corresponding author upon request.

Conflicts of Interest

The authors declare no conflict of interest.

References

  1. Submarine Telecoms Industry Report; Submarine Telecoms Forum: Sterling, VA, USA, 2020; Available online: https://subtelforum.com/products/submarine-telecoms-industry-report/ (accessed on 10 March 2021).
  2. Submarine Telecoms Fourm. Subtel Cable Map. Available online: https://subtelforum.com/cablemap/ (accessed on 22 May 2023).
  3. Qiu, W. Submarine Cables Cut after Taiwan Earthquake in Dec 2006. Submarine Cable Netw. Available online: https://www.submarinenetworks.com/news/cables-cut-after-taiwanearthquake-2006 (accessed on 22 May 2023).
  4. Zhu, X.Y.; Hao, Q.L.; Zhang, J. Buried Depth of a Submarine Pipeline Based on Anchor Penetration. J. Mar. Sci. Eng. 2019, 7, 257. [Google Scholar] [CrossRef] [Green Version]
  5. TeleGeography. Submarine Cable Frequently Asked Questions. 2023. Available online: https://www2.telegeography.com/submarine-cable-faqs-frequently-asked-questions (accessed on 20 January 2023).
  6. Cao, C.; Wang, Z.F.; Zukerman, M.; Maton, J.H.; Bensoussan, A.; Wang, Y. Optimal Cable Laying Across an Earthquake Fault Line Considering Elliptical Failures. IEEE Trans. Reliab. 2016, 65, 1536–1550. [Google Scholar] [CrossRef]
  7. Zhao, M.B.; Chow, T.W.S.; Tang, P.; Wang, Z.F.; Guo, J.; Zukerman, M. Route Selection for Cabling Considering Cost Minimization and Earthquake Survivability Via a Semi-Supervised Probabilistic Model. IEEE Trans. Ind. Inform. 2016, 13, 502–511. [Google Scholar] [CrossRef]
  8. Wang, Z.F.; Wang, Q.; Zukerman, M.; Guo, J.; Wang, Y.; Wang, G.; Yang, J.; Moran, B. Multiobjective Path Optimization for Critical Infrastructure Links with Consideration to Seismic Resilience. Comput. Aided Civ. Infrastruct. Eng. 2017, 32, 836–855. [Google Scholar] [CrossRef]
  9. Wang, Z.F.; Wang, Q.; Moran, B.; Zukerman, M. Application of the Fast Marching Method for Path Planning of Long-haul Optical Fiber Cables With Shielding. IEEE Access 2018, 6, 41367–41378. [Google Scholar] [CrossRef]
  10. Wang, Z.F.; Wang, Q.; Moran, B.; Zukerman, M. Terrain constrained path planning for long-haul cables. Opt. Express 2019, 27, 8221–8235. [Google Scholar] [CrossRef] [PubMed]
  11. Wang, X.Y.; Wang, Z.F.; Wang, T.J.; Zukerman, M. Designing Cost-Effective and Reliable Submarine Communications Cable Path: Lessons from the Tonga Volcano Disaster. IEEE Commun. Mag. 2023, 1, 179–185. [Google Scholar] [CrossRef]
  12. Askheim, D.O.; Fyrileiv, O. New Design Code for Interference between Trawl Gear and Pipelines: Dnv Rp-F111. In Proceedings of the International Conference on Offshore Mechanics and Arctic Engineering, Hamburg, Germany, 4 June 2006. [Google Scholar]
  13. Chen, X.L.; Ye, Y.C.; Li, D. Analysis of the factors affecting submarine optical cable safety in the East China Sea. Ocean Eng. 2009, 27, 121–125. (In Chinese) [Google Scholar] [CrossRef]
  14. Allan, P.G. Selecting appropriate cable burial depths a methodology. In Proceedings of the IBC Conference on Submarine Communication, the Future of Network Infrastructure, Cannes, France, 1 November 1998. [Google Scholar]
  15. Wang, Y.S. Study on the Depth of Penetration of Anchors. Master’s Thesis, Dalian Maritime University, Dalian, China, 2014. [Google Scholar]
  16. Jeon, S.S.; O’Rourke, T.D. Northridge earthquake effects on pipelines and residential buildings. Bull. Seismol. Soc. Am. 2005, 95, 294–318. [Google Scholar] [CrossRef]
  17. Wells, D.L.; Coppersmith, K.J. New empirical relationships among magnitude, rupture length, rupture width, rupture area, and surface displacement. Bull. Seismol. Soc. Am. 1994, 84, 974–1002. [Google Scholar]
  18. Whelley, P.L.; Newhall, C.G.; Bradley, K.E. The frequency of explosive volcanic eruptions in Southeast Asia. Bull. Volcanol. 2015, 77, 1. [Google Scholar] [CrossRef] [PubMed] [Green Version]
  19. Dong, X.C.; Dong, X.H. Analysis of Effect of Marine Route Survey on submarine Fibre-optic Cable Engineering. Coast. Eng. 2007, 26, 11–14. (In Chinese) [Google Scholar]
  20. Berteaux, H.O.; Prindle, B.; May, D. The Deep Sea Moorings Fishbite Problem; OCEANS’87: Halifax, NS, Canada, 1987. [Google Scholar]
  21. Marra, L.J. Sharkbite on the SL submarine lightwave cable system: History, causes and resolution. IEEE J. Ocean. Eng. 1989, 14, 230–237. [Google Scholar] [CrossRef]
  22. Saaty, T.L. The Analytical Hierarchical Process: Planning, Priority Setting, Resource Allocation; McGraw-Hill: New York, NY, USA, 1980. [Google Scholar]
Figure 1. The schematic diagram of digital raster.
Photonics 10 00896 g001
Figure 2. Flow chart of multi-objective ant colony optimization algorithm.
Photonics 10 00896 g002
Figure 3. The (a) DEM and (b) risk distribution map in region R .
Photonics 10 00896 g003
Figure 4. The hybrid assessments of (a) fishery activities, (b) shipping activities, (c) earthquakes, (d) volcanos, (e) submarine slope, and (f) marine organism, respectively.
Photonics 10 00896 g004
Figure 5. The distribution of (a) total cost and (b) risk assessment in region R .
Photonics 10 00896 g005
Figure 6. The convergence of (a) total costs and (b) risks in cases of different N a n t .
Photonics 10 00896 g006
Figure 7. The (a) Pareto optimal frontier and (b) corresponding submarine cable route.
Photonics 10 00896 g007
Table 1. The rank of risk occurrence possibility and damage levels.
Rank LevelOccurrence PossibilityDamage Levels
Vvery high probabilitymajor cable damage
IVhigh probabilitysevere cable damage
IIImedium probabilitymoderate cable damage
IIlow probabilityslight cable damage
Ivery low probabilityno cable damage
Table 2. The occurrence possibility and damage levels of fishery activities.
Rank LevelOccurrence Possibility
(Number of Hits/km/Year)
Burial   Depth   h (m), Cable Type
V P h i t , t r a w l > 100 0 h 0.5 , SA
IV 80 < P h i t , t r a w l 100 0.5 h 1.5 , SA
III 40 < P h i t , t r a w l 80 1.5 h 2.5 , SA
II 20 < P h i t , t r a w l 40 2.5 h 3 , SA
I 0 P h i t , t r a w l 20 h > 3 , DA
Table 3. The occurrence possibility and damage levels from shipping activities.
Rank LevelOccurrence Possibility
(100%)
Burial   Depth   h (M), Cable Type
V 5 × 10 1 < P h i t , a n c h o r 10 0 0 < h 0.5 , SA
IV 10 1 < P h i t , a n c h o r 5 × 10 1 0.5 < h 1.5 , SA
III 10 2 < P h i t , a n c h o r 10 1 1.5 < h 2 , SA
II 10 3 < P h i t , a n c h o r 10 2 2 < h 3 , SA
I 0 P h i t , a n c h o r 10 3 h > 3 , DA
Table 4. The occurrence possibility and damage levels of earthquakes.
Rank LevelOccurrence Possibility Margin   Length   L (m), Cable Type
V 10 1 < P r r 10 0 0 < L 0.5 , SA
IV 10 2 < P r r 10 1 0.5 < L 1 , SA
III 10 3 < P r r 10 2 1 < L 3 , SA
II 10 4 < P r r 10 3 3 < L 12 , SA
I 0 P r r 10 4 L > 12 , DA
Table 5. The occurrence possibility and damage levels of volcanos.
Rank LevelOccurrence Possibility Margin   Length   L (m), Cable Type
V 10 1 P v o l < 10 0 0 < L 0.5 , SA
IV 10 2 P v o l < 10 1 0.5 < L 1 , SA
III 10 3 P v o l < 10 2 1 < L 3 , SA
II 10 4 P v o l < 10 3 3 < L 12 , SA
I 0 < P v o l 10 4 L > 12 , DA
Table 6. The occurrence possibility and damage levels of submarine slope.
Rank Level Occurrence   Possibility
(°)
Margin   Length   L (m), Cable Type
V β > 40 0 < L 0.5
IV 30 < β 40 0.5 < L 1
III 20 < β 30 1 < L 3
II 10 < β 20 3 < L 10
I 0 < β 10 L > 10
Table 7. The occurrence possibility and damage levels of marine organisms.
Rank LevelOccurrence Possibility (%)Cable Type
V P f i s h > 60 Light cable
IV 30 < P f i s h 60 SA
III 20 < P f i s h 30 Light protective cable
II 10 < P f i s h 20 DA
I 0 < P f i s h 10 Rock armored cable
Table 8. The comparison matrix for risks.
Risk TypesEarthquakeVolcanoMarine OrganismSubmarine SlopeFishery ActivitiesShipping Activities
Earthquake10.5410.1430.25
Volcano21320.1250.2
Marine organism0.250.33310.250.1110.167
Submarine slope10.5410.1430.25
Fishery activities789716
Shipping activities45640.1671
Disclaimer/Publisher’s Note: The statements, opinions and data contained in all publications are solely those of the individual author(s) and contributor(s) and not of MDPI and/or the editor(s). MDPI and/or the editor(s) disclaim responsibility for any injury to people or property resulting from any ideas, methods, instructions or products referred to in the content.

