Communication

The Effect of Electron Escape Rate on the Nonlinear Dynamics of Quantum Dot Lasers under Optical Feedback

1
School of Physical Science and Technology, Southwest University, Chongqing 400715, China
2
Chongqing Key Laboratory of Micro & Nano Structure Optoelectronics, Southwest University, Chongqing 400715, China
*
Author to whom correspondence should be addressed.
Photonics 2023, 10(8), 878; https://doi.org/10.3390/photonics10080878
Submission received: 9 July 2023 / Revised: 25 July 2023 / Accepted: 27 July 2023 / Published: 28 July 2023
(This article belongs to the Special Issue Lasers and Dynamic of Systems)

Abstract

:
When theoretically investigating the nonlinear dynamics of quantum dot lasers (QDLs), the parameter value of the electron escape rate (Ce) is sometimes approximated to zero to simplify the calculation. However, the value of Ce is dependent on the energy interval between the ground state (GS) and the excited state (ES) in the conduction band and is affected by the operation temperature. As a result, such simplified approximation treatments may lead to inaccurate results. In this study, after considering the effect of Ce, we investigate the nonlinear dynamics of QDLs with and without optical feedback based on the asymmetric electron-hole carrier rate equation model. The simulation results show that without optical feedback, the lasing conditions for ES and GS in free-running QDLs are dependent on the value of Ce. A larger Ce is more helpful for the ES emission, and the GS emission will stop lasing if Ce is large enough. Through analyzing the dynamical characteristics of GS and ES in QDLs with optical feedback under different Ce values, it can be found that the dynamical characteristics are strongly correlative with Ce.

1. Introduction

Semiconductor lasers (SLs) can exhibit diverse nonlinear dynamical behaviors under external perturbations, such as optical injection [1], optical feedback [2,3,4], and optoelectronic feedback [5]. These dynamical behaviors include: steady (S) state; period one (P1) state; period two (P2) state; multi-period (MP) state; chaotic (C) state; low frequency fluctuation (LFF) [6,7] and bistable state [8], which can be applied in photonic microwave generation [9,10]; all-optical logic gates [11]; reservoir computing [12,13]; chaotic secure communications [14]; random number generation [15,16]; and so on.
With the technical development of SLs and photonic integration [17], self-assembled nanostructured semiconductor quantum dot lasers (QDLs) have attracted the attention of many researchers [18,19]. The active region of QDLs is a zero-dimensional quantum dots (QD) nanostructure, which induces QDLs with discrete energy levels and state densities. Compared with traditional quantum well SLs, QDLs possess some advantages, such as low threshold current [20,21], temperature insensitivity [22,23], large modulation bandwidth [24], and low chirp [25]. Such unique properties make QDLs excellent candidate light sources in many fields, such as optical communications [26], all-optical logic gates [27], silicon photonic integrated circuits [28], photonic microwave generation [29,30], and so on. Related studies have demonstrated that QDLs can emit at the ground state (GS) and excited state (ES), either solely or simultaneously, by doping the active region of QDLs and changing the shape and size of QDs [31]. Since the GS and ES emission possesses a different wavelength and threshold current, it can be divided into three types: ground state quantum dot lasers (GS-QDLs), excited state quantum dot lasers (ES-QDLs), and dual-state quantum dot lasers (DSQDLs) [32,33]. For DSQDLs, there are two threshold currents. When the bias current arrives at the first threshold current, the GS starts to lase. With the further increase in the bias current, the number of carriers in the ES rapidly increases. Once the bias current exceeds the second threshold, the GS and ES can simultaneously emit and the wavelength difference between GS and ES emission is close to 100 nm [34]. For GS-QDLs and ES-QDLs, there is always only one threshold current as the bias current increases. GS-QDLs possess a lower threshold current compared with ES-QDLs owing to relatively low energy and strong damping of relaxation oscillation of GS-QDLs. In recent years, the nonlinear dynamics of QDLs under external perturbations have received extensive attention [35,36]. Under optical injection, hysteresis bistability has been observed in QDLs [37]. Under optical feedback, mode competition of QDLs [38], energy exchange between longitudinal modes [39], two-color oscillations [40,41], and low-frequency fluctuations (LFF) [42,43] have been experimentally and theoretically reported successively. Theoretically, there are two models for analyzing the nonlinear dynamics of QDLs under external perturbations. One is the symmetric exciton model [44], in which excitons are particles formed by the coulomb interactions between electrons and holes in different energy levels of QD semiconductor materials. As a result, the energy level of GS and ES of QDLs presents electrically neutral. This model can be applied to investigate the modulation characteristics [45], optical noise characteristics [46], and photonic microwave generation [29], etc. The other is the asymmetric electron-hole model [47], in which electrons and holes are heavily aggregated in different energy levels of QD semiconductor materials, respectively. Under this case, the coulomb interactions between electrons and holes are much smaller than the interactions between electrons and electrons, and holes and holes, and then the symmetry between electron-hole pairs is broken. The asymmetric electron-hole model can be adopted to explain some behaviors of QDLs, such as the hysteresis bistability in QDLs under optical injection [37], the external cavity mode competition [38], and all-optical switching [48] in QDLs under optical feedback, etc. We have noted that the parameter value of electron escape rate (Ce) is sometimes estimated to be zero in order to simplify calculations during adopting the asymmetric electron-hole model. In fact, as pointed out in [39], the different Ce values would affect the change in the GS-ES carrier number.
Based on above considerations, in this study, the effect of Ce on the nonlinear dynamics of QDLs under optical feedback is analyzed by adopting the asymmetric electron-hole model. The structure of the article is as follows: First, we analyze the factors influencing the parameter values of Ce. Second, we inspect the effect of different Ce on the lasing characteristics of QDLs without optical feedback. Next, via bifurcation diagrams, the nonlinear dynamics of QDLs under optical feedback are analyzed for different value Ce. Finally, through mapping the dynamical state distribution of QDLs in the space of phase offset and optical feedback intensity, the effect of Ce on the dynamical state distribution is revealed.

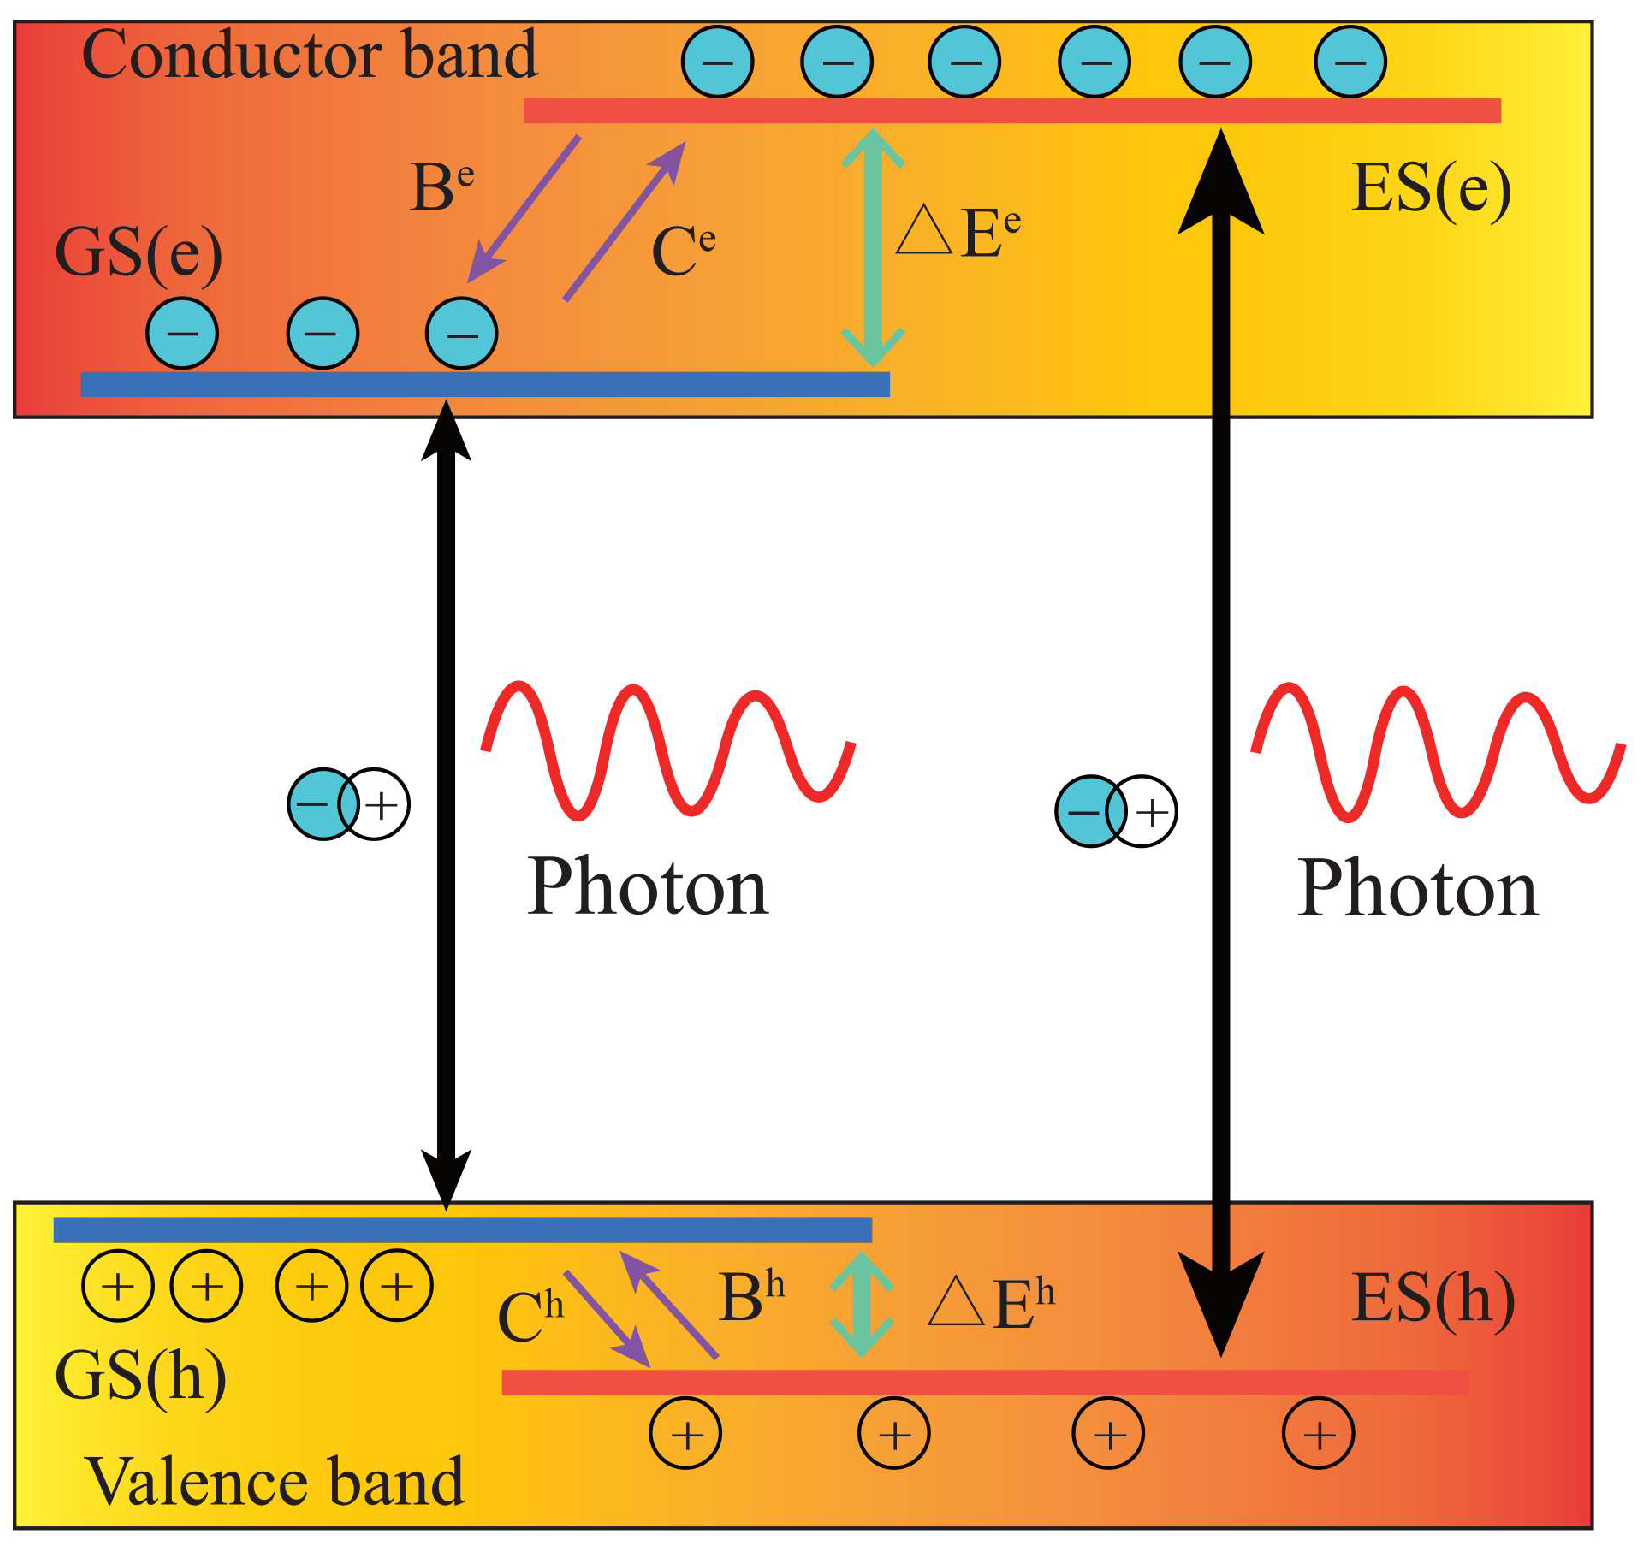
2. Asymmetric Electron-Hole Carrier Rate Equation Model

Figure 1 shows a schematic of asymmetric electron-hole carrier dynamics and energy level structure of QDLs, where the carriers include electrons with negative charge in the conduction band and holes with positive charge in the valence band. In this model, only two relatively low energy levels including the ground state (GS) and the first excited state (ES) energy level are considered. The active region of QDLs is assumed to contain only one type of QD ensemble; meanwhile, the effect of non-uniform broadening is ignored. The carriers can be injected directly into the ES level through electrodes. Parts of the carriers are captured into the GS energy level by carrier scattering and Auger recombination processes [49] with a capture rate of Be,h, where the superscripts e and h represent electrons and holes, respectively. Due to thermal excitation process [49], some carriers in the GS energy level escape into the ES energy level, with an escape rate of Ce,h. Based on the asymmetric electron-hole carrier dynamics and energy level structure model of QDLs, dimensionless rate equations [48] for the nonlinear dynamics of QDLs under optical feedback can be described as:
d E G S d t = 1 2 [ g G S ( n G S e + n G S h 1 ) 1 ] E G S i a G S ( n G S e + n G S h ) 2 E G S + k c e i ω G S τ E G S ( t τ )
d E E S d t = 1 2 [ g E S ( n E S e + n E S h 1 ) 1 ] E E S i a E S ( n E S e + n E S h ) 2 E E S + k c e i ω E S τ E E S ( t τ )
d n G S e d t = η [ 2 B e n E S e ( 1 n G S e ) 2 C e n G S e ( 1 n E S e ) n G S e ( n G S e + n G S h 1 ) | E G S | 2 ]
d n G S h d t = η [ 2 B h n E S h ( 1 n G S h ) 2 C h n G S h ( 1 n E S h ) n G S h ( n G S e + n G S h 1 ) | E G S | 2 ]
d n E S e d t = η [ J e ( 1 n E S e ) B e n E S e ( 1 n G S e ) + C e n G S e ( 1 n E S e ) n E S e ( n E S e + n E S h 1 ) | E E S | 2 ]
d n E S h d t = η [ J h ( 1 n E S h ) B h n E S h ( 1 n G S h ) + C h n G S h ( 1 n E S h ) n E S h ( n E S e + n E S h 1 ) | E E S | 2 ]
where the subscripts GS and ES represent the ground state and excited state, respectively. E and n represent the complex electric field and carrier number, respectively. J is the normalized injected current (Je = Jh = J). t represents the dimensionless time normalized to the photon lifetime τp, and τ is the external cavity round trip time. kc stands for the normalized optical feedback intensity. ω represents the angular frequency normalized to 1/τp. η represents the ratio of the photon lifetime to the non-radiative carrier lifetime. Considering that the GS and ES have two-fold degeneration and four-fold degeneration, respectively, we set gGS = 2g0 and gES = 4g0 (g0 is the effective gain factor). 1 − n describes Pauli blocking and a(nh + ne) represents the frequency change induced by the resonant carrier factor a [42]. The symmetric distribution of electron-hole pairs is broken due to the difference between Ce and Ch. To determine the escape rates Ce,h, here we use the Kramers relation [46]:
C e , h = B e , h e x p ( E e , h k b T )
where ΔEe and ΔEh are the energy level interval between GS and ES in the conduction band and in the valence band, respectively, and kb represents the Boltzmann constant. T represents the operation temperature of lasers. Generally, ΔEh is near to 0, and therefore ChBh. However, ΔEe is usually tens of meV. Referring to [37], we set ΔEe at 50 meV. In this case, the dependence of Ce on the operation temperature of QDLs is given in Figure 2, where Bh = Be = Ch = 150 [48]. Obviously, Ce is increased with the increase in the operation temperature of QDLs. At room temperature, kbT = 25 meV, and then Ce = 20.3.

3. Results and Discussion

Equations (1)–(6) can be numerically solved by the fourth-order Runge–Kutta method via MATLAB software, with the parameters [48]: η = 0.02, Be = Bh = Ch = 150, g0 = 0.75, aGS = aES = 5, ωGS ≈ 3015.9, ωES ≈ 3222.1.
Figure 3 shows the normalized output power of GS (blue) and ES (red) as a function of normalized injection current J for a free-running QDL under different Ce, and the threshold currents of ES and GS as a function of Ce for a free-running QDL. For Ce = 0 (Figure 3a), the QDL starts to lase when J arrives at 3.0. When J is within the range of 3.0–4.5, the free-running QDL is operating at the GS emission. Once J exceeds 4.5, the ES of QDL starts to lase. With a further increase in J, the output power of GS decreases while the output power of ES increases. When J is within the range of 4.5–10.0, the free-running QDL is operating at the coexistence of GS and ES. When J is more than 10.0, the GS emission is completely suppressed. As shown in Figure 3b, for Ce = 20.3 (corresponding to room temperature), the threshold current of QDL is 3.0, and only the ES emits. Obviously, for QDL operating at room temperature, adopting the approximate treatment of Ce = 0 will lead to inaccurate results. From Figure 3c, it can be seen that the threshold currents of GS and ES are depended on Ce. With the increase in Ce, the threshold current of ES decreases firstly and then maintains a constant level, while the threshold current of GS remains at a constant firstly and then the GS stops lasing. As a result, a relatively larger value of Ce (meaning a higher temperature) is more helpful for ES emission, which is consistent with the experimental observation in [50]. In the following, taking J = 3.5 and J = 5.7 as examples, we will analyze the effect of different Ce values on the nonlinear dynamics of QDL with optical feedback.
A bifurcation diagram is usually adopted to analyze the nonlinear dynamics evolution of QDLs with a certain parameter. The bifurcation diagram is obtained from a time series by sampling and plotting local peaks and valleys of the output waveform for different parameter values [51,52]. Figure 4 gives the bifurcation diagrams of power extreme and mean power of the GS (blue) and ES (red) as a function of optical feedback intensity (kc) under J = 3.5 and delayed time τ = 100. For Ce = 0 (Figure 4(a1)), the GS is stable (S) under kc < 0.0092. For kc is within the range of (0.0092, 0.015), the output waveform of GS emission has two extreme values corresponding to the peaks and valleys, and the GS can be judged to operate at period one (P1) oscillation. When kc is located within the range of (0.015, 0.016), the output waveform of GS possesses four extreme values corresponding to the peaks and valleys, and the GS can be determined to be period two (P2) oscillation. When kc is within the range of (0.028, 0.031), the output waveform of GS emission has multiple extreme values corresponding to the peaks and valleys, then the GS operates at the multi-period (MP) oscillation. When kc exceeds the value of 0.031, the output waveform shows irregular oscillation, and the GS evolves into chaotic (C) oscillation. For ES emission, one can observe only for 0.02 < kc < 0.028, in which the ES behaves C oscillation. When Ce = 5 (Figure 4(b1)), only the ES emits under kc < 0.012. When kc is located within the range of (0.012, 0.04), the GS undergoes an evolution from P1, S, P1, P2, MP to C oscillation. Once kc exceeds the values of 0.04, the GS appears as a new cascade bifurcation from S, MP into C oscillation. When kc is within the range of (0.012, 0.014), the ES enters P1 oscillation. When kc exceeds the values of 0.044, the ES evolves into C oscillation. When Ce = 10 (Figure 4(c1)), the ES has multiple dynamical states, including S, P1, P2, and MP oscillation when kc is in the range of (0, 0.035). When kc is located within the range of (0.057, 0.062) and (0.08, 0.083), the ES behaves as C oscillation. When kc is within the range of (0.036, 0.09), the GS exhibits from S, P2, MP to C oscillation. When Ce = 15 (Figure 4(d1)), the ES shows various dynamical states, such as S, P1, P2, MP, and C oscillation within the range of (0, 0.051). For GS emission, it only starts emission when the kc exceeds 0.053. When kc is located within the range of (0.053, 0.09), the GS exhibits multiply dynamical states such as S, P1, P2, and C oscillation. As shown in Figure 4(e1), when Ce = 20.3 (corresponding to the room temperature), only the ES emits for kc < 0.081, and S, P1 and C oscillation can be observed. For GS, it starts to emit for kc > 0.081, C and S oscillation can be observed. By comparing the bifurcation diagram of power extreme and mean power under different Ce, one can find that strongly optical feedback is favorable for GS emission under a given Ce; meanwhile, the dynamical evolution of GS and ES is significantly related to the value of Ce. Moreover, for a larger value of Ce (corresponding to a higher temperature), the region of feedback strength for realizing chaotic output is narrower.
Figure 5 shows the bifurcation diagrams of power extreme and mean power of the GS (blue) and ES (red) as a function of kc under injection current J = 5.7 and delay time τ = 100. For Ce = 0 (Figure 5(a1)), the GS and ES are stable under kc < 0.023. When kc is within the range of (0.023, 0.025), the GS and ES show various dynamical states such as P1, P2, and MP oscillation. When kc exceeds the values 0.034, the GS and ES enter C oscillation. When Ce = 5 (Figure 5(b1)), only the ES emits under kc < 0.018. When kc is located within the range of (0.018, 0.04), the GS starts emission and the GS and ES are S. The GS and ES exhibit multiple dynamical states, including P1, P2, and MP, under the range of (0.04, 0.042). When kc is within the range of (0.042, 0.1), the GS and ES evolve from S to C oscillation. When Ce = 10 (Figure 5(c1)), only the ES emits under kc < 0.037. With the increase in kc from 0.037 to 0.065, the GS and ES behave as S. Once kc exceeds 0.07, the GS and ES evolve into C oscillation. When Ce = 15 (Figure 5(d1)), the ES is S under the range of kc (0, 0.055). When kc is located within the range of (0.055, 0.075), the GS and ES show rich dynamical states, including P1, P2, and MP oscillation. When kc exceeds 0.075, the GS and ES enter C oscillation. As shown in Figure 5(e1), when Ce = 20.3 (corresponding to the room temperature), only the ES emits for kc < 0.065. When kc is within the range of (0.065, 0.098), the GS and ES emit simultaneously and multiple dynamical states such as P1, P2, and MP oscillations can be observed. When kc is located within the range of (0.098, 0.1), the GS emission operates at S, while the ES emission is suppressed. By comparing the bifurcation diagram of power extreme and mean power under different Ce, it can be found that the GS and ES always have the same dynamic evolution with the increase in kc. For a relatively large Ce, a lower kc is more favorable for the ES emission, and a stronger kc is more favorable for the GS emission. Similarly, in the case of QDL biased at 3.5, for a larger value of Ce (corresponding to a higher temperature), the chaos state can be observed within a narrower region of the feedback strength.
Besides the optical feedback intensity (kc), the phase offset (defined as ∆τwGS) caused by the slight variation in τ is another crucial factor to affect the nonlinear dynamics of QDLs. Finally, we simulate the dynamical evolution of QDL in the parameter space composed of such two crucial parameters; the corresponding results under J = 3.5 are given in Figure 6. For Ce = 0 (Figure 6(a1,a2)), while the dynamical states of GS include S, P1, P2, MP, and C, and the C state occupies the widest area. The dynamical states of ES include S, P1, P2, and MP, and most of the region is S state. When Ce = 5 (Figure 6(b1)), there are still various dynamical states, including S, P1, P2, MP, and C, but the C region is shrunken compared with that of Ce = 0. As shown in Figure 6(b2), although most areas still belong to the S region for ES, the regions for other dynamical states are expanded. For Ce = 10 (Figure 6(c1,c2)), multiple dynamical states including S, P1, P2, MP and C can be observed for the GS and ES. For Ce = 15 (Figure 6(d1,d2)) and Ce = 20.3 (Figure 6(e1,e2)), the S region for GS becomes larger and other dynamic states become smaller, and more dynamical states including S, P1, P2, MP and C oscillation can still be observed for ES emission.
For J = 5.7, the corresponding results are given in Figure 7. For Ce = 0 (Figure 7(a1,a2)), the dynamical states of GS and ES include S, P1, P2, MP, and C oscillation. In the dwhole parameter space, a small number of regions are located at S. For Ce = 5 (Figure 7(b1,b2)) and Ce = 10 (Figure 7(c1,c2)); there are also multiple dynamical states, such as S, P1, P2, MP, and C oscillation, and the C region is shrunken compared with that under Ce = 0. For Ce = 15 (Figure 7(d1,d2)) and Ce = 20.3 (Figure 7(e1,e2)), the S region of GS and ES widens in the whole space and other dynamic states of the region become smaller. From Figure 6 and Figure 7, it can be concluded that the dynamical states distribution of GS and ES in the parameter space of optical feedback intensity and phase offset is strongly dependent on the parameter value of Ce.

4. Conclusions

In summary, via an asymmetric electron-hole carrier rate equation model, the effects of the different parameter values of electron escape rate (Ce) on the nonlinear dynamics of quantum dot lasers (QDLs), with or without optical feedback, are theoretically investigated. The simulation results show that, for QDLs without optical feedback, the emission threshold of ground state (GS) and excited state (ES) strongly depends on the parameter value of Ce. A relatively larger value of Ce is more helpful for ES emission, and GS stops lasing when Ce is large enough. For QDLs with optical feedback, various dynamical states, such as stable (S), period one (P1) oscillation, period two (P2) oscillation, multi-period (MP) oscillation, and chaotic (C) oscillation of GS and ES for QDLs, can be observed. By comparing the dynamical state distributions for GS and ES in the parameter space of feedback intensity and phase offset under different Ce, it can be concluded that the dynamic state of QDLs with optical feedback is strongly correlative with the parameter value of Ce. As a result, when theoretically investigating the nonlinear dynamics of QDLs with or without optical feedback, the effect of Ce should be taken into account for obtaining accurate results.

Author Contributions

Conceptualization, Q.W. and G.X.; methodology, Q.W.; validation, Q.W., G.X. and Z.W.; formal analysis, Q.W. and Y.Z.; investigation, Q.W. and Y.Z.; resources, G.X. and Z.W.; data curation, Q.W.; writing—original draft preparation, Q.W.; writing—review and editing, G.X. and Z.W.; visualization, Q.W.; supervision, Z.W.; project administration, G.X.; funding acquisition, G.X. and Z.W. All authors have read and agreed to the published version of the manuscript.

Funding

This research was funded by the National Natural Science Foundation of China (61875167), the Chongqing Natural Science Foundation (CSTB2022NSCQ-MSX0313) and the Postgraduates’ Research and Innovation Project of Chongqing (CYB22111).

Institutional Review Board Statement

Not applicable.

Informed Consent Statement

Not applicable.

Data Availability Statement

Not applicable.

Conflicts of Interest

The authors declare no conflict of interest.

References

  1. Lin, F.Y.; Tu, S.Y.; Huang, C.C.; Chang, S.M. Nonlinear dynamics of semiconductor lasers under repetitive optical pulse injection. IEEE J. Sel. Top. Quantum Electron. 2009, 15, 604–611. [Google Scholar] [CrossRef]
  2. Zhong, Z.Q.; Chang, D.; Jin, W.; Lee, M.W.; Wang, A.B.; Jiang, S.; He, J.X.; Tang, J.M.; Hong, Y.H. Intermittent dynamical state switching in discrete-mode semiconductor lasers subject to optical feedback. Photonics Res. 2021, 9, 1336–1342. [Google Scholar] [CrossRef]
  3. Asghar, H.; Wei, W.; Kumar, P.; Sooudi, E.; McInerney, J.G. Stabilization of self-mode-locked quantum dash lasers by symmetric dual-loop optical feedback. Opt. Express 2018, 26, 4581–4592. [Google Scholar] [CrossRef] [PubMed] [Green Version]
  4. Alrebdi, T.A.; Asghar, M.; Asghar, H. All Optical stabilizations of nano-structure-based QDash semiconductor mode-locked lasers based on asymmetric dual-loop optical feedback configurations. Photonics 2022, 9, 376. [Google Scholar] [CrossRef]
  5. Chengui, G.R.G.; Jacques, K.; Woafo, P.; Chembo, Y.K. Nonlinear dynamics in an optoelectronic feedback delay oscillator with piecewise linear transfer functions from the laser diode and photodiode. Phys. Rev. E 2020, 102, 042217. [Google Scholar] [CrossRef] [PubMed]
  6. Dou, X.Y.; Qiu, S.M.; Wu, W.Q. Numerical demonstration of the transmission of low frequency fluctuation dynamics generated by a semiconductor laser with optical feedback. Photonics 2022, 9, 483. [Google Scholar] [CrossRef]
  7. Tiana-Alsina, J.; Masoller, C. Experimental and numerical study of locking of low-frequency fluctuations of a semiconductor laser with optical feedback. Photonics 2022, 9, 103. [Google Scholar] [CrossRef]
  8. Chen, J.J.; Zhong, Z.Q.; Li, L.F. Characteristics of polarization switching and bistability in vertical-cavity surface-emitting laser subject to continuous variable-polarization optical injection. Acta Opt. Sin. 2022, 42, 0714003. [Google Scholar]
  9. Chang, D.; Zhong, Z.Q.; Valle, A.; Jin, W.; Jiang, S.; Tang, J.M.; Hong, Y.H. Microwave photonic signal generation in an optically injected discrete mode semiconductor laser. Photonics 2022, 9, 171. [Google Scholar] [CrossRef]
  10. Ji, S.K.; Xue, C.P.; Valle, A.; Spencer, P.S.; Li, H.Q.; Hong, Y.H. Stabilization of photonic microwave generation in vertical-cavity surface-emitting lasers with optical injection and feedback. J. Light. Technol. 2018, 36, 4347–4353. [Google Scholar] [CrossRef]
  11. Qureshi, K.K. Realization of all-optical logic gates using injection locking in a distributed feedback laser diode. Microw. Opt. Technol. Lett. 2016, 58, 940–944. [Google Scholar] [CrossRef]
  12. Jiang, L.; Liang, W.Y.; Song, W.J.; Jia, X.H.; Yang, Y.L.; Liu, L.M.; Deng, Q.X.; Mou, X.Y.; Zhang, X. Characteristic study on parallel reservoir computation based on VCSEL dynamics with optoelectronic feedback. IEEE J. Quantum Electron. 2022, 58, 2400608. [Google Scholar] [CrossRef]
  13. Lin, B.D.; Shen, Y.W.; Tang, J.Y.; Yu, J.Y.; He, X.M.; Wang, C. Deep time-delay reservoir computing with cascading injection-locked lasers. IEEE J. Sel. Top. Quantum Electron. 2023, 29, 7600408. [Google Scholar] [CrossRef]
  14. Zhong, D.Z.; Zhao, K.K.; Hu, Y.L.; Zhang, J.B.; Deng, W.A.; Hou, P. Four-channels optical chaos secure communications with the rate of 400 Gb/s using optical reservoir computing based on two quantum dot spin-VCSELs. Opt. Commun. 2023, 529, 129109. [Google Scholar] [CrossRef]
  15. Cai, Q.; Li, P.; Shi, Y.C.; Jia, Z.W.; Ma, L.; Xu, B.J.; Chen, X.F.; Shore, K.A.; Wang, Y.C. Tbps parallel random number generation based on a single quarter-wavelength-shifted DFB laser. Opt. Laser Technol. 2023, 162, 109273. [Google Scholar] [CrossRef]
  16. Kawaguchi, Y.; Okuma, T.; Kanno, K.; Uchida, A. Entropy rate of chaos in an optically injected semiconductor laser for physical random number generation. Opt. Express 2021, 29, 2442–2457. [Google Scholar] [CrossRef]
  17. Yang, J.J.; Tang, M.C.; Chen, S.M.; Liu, H.Y. From past to future: On-chip laser sources for photonic integrated circuits. Light-Sci. Appl. 2023, 12, 16. [Google Scholar] [CrossRef]
  18. Moos, R.; Konieczniak, I.; Dos Santos, G.E.; Gobbi, Â.L.; Bernussi, A.A.; Carvalho, W.; Medeiros-Ribeiro, G.; Ribeiro, E. Assessing electronic states of InAsP/GaAs self-assembled quantum dots by photoluminescence and modulation spectroscopy. J. Lumin. 2019, 206, 639–644. [Google Scholar] [CrossRef]
  19. Mitsuru, S.; Kohki, M.; Yoshiaki, N.; Koji, O.; Hiroshi, I. Performance and physics of quantum-dot lasers with self-assembled columnar-shaped and 1.3-um emitting InGaAs quantum dots. IEEE J. Sel. Top. Quantum Electron. 2000, 6, 462–474. [Google Scholar]
  20. Al-Marhaby, F.A.; Al-Ghamdi, M.S. Experimental investigation of stripe cavity length effect on threshold current density for InP/AlGaInP QD laser diode. Opt. Mater. 2022, 127, 112191. [Google Scholar] [CrossRef]
  21. Jung, D.; Norman, J.; Kennedy, M.J.; Shang, C.; Shin, B.; Wan, Y.T.; Gossard, A.C.; Bowers, J.E. High efficiency low threshold current 1.3 mu m InAs quantum dot lasers on on-axis (001) GaP/Si. Appl. Phys. Lett. 2017, 111, 122107. [Google Scholar] [CrossRef]
  22. Mikhrin, S.S.; Kovsh, A.R.; Krestnikov, I.L.; Kozhukhov, A.V.; Livshits, D.A.; Ledentsov, N.N.; Shernyakov, Y.M.; Novikov, I.I.; Maximov, M.V.; Ustinov, V.M.; et al. High power temperature-insensitive 1.3 µm InAs/InGaAs/GaAs quantum dot lasers. Semicond. Sci. Technol. 2005, 20, 340–342. [Google Scholar] [CrossRef]
  23. Cong, D.Y.; Martinez, A.; Merghem, K.; Ramdane, A.; Provost, J.G.; Fischer, M.; Krestnikov, I.; Kovsh, A. Temperature insensitive linewidth enhancement factor of P-type doped InAs/GaAs quantum-dot lasers emitting at 1.3 μm. Appl. Phys. Lett. 2008, 92, 191109. [Google Scholar] [CrossRef]
  24. Qasaimeh, O. Modulation bandwidth of inhomogeneously broadened InAs/GaAs quantum dot lasers. Opt. Commun. 2004, 236, 387–394. [Google Scholar] [CrossRef]
  25. Saito, H.; Nishi, K.; Kamei, A.; Sugou, S. Low chirp observed in directly modulated quantum dot lasers. IEEE Photonics Technol. Lett. 2000, 12, 1298–1300. [Google Scholar] [CrossRef]
  26. Zhukov, A.E.; Kovsh, A.R. Quantum dot diode lasers for optical communication systems. Quantum Electron. 2008, 38, 409–423. [Google Scholar] [CrossRef]
  27. Kotb, A. Simulation of high quality factor all-optical logic gates based on quantum-dot semiconductor optical amplifier at 1 Tb/s. Optik 2016, 127, 320–325. [Google Scholar] [CrossRef]
  28. Dong, B.Z.; Chen, J.D.; Lin, F.Y.; Norman, J.C.; Bowers, J.E.; Grillot, F. Dynamic and nonlinear properties of epitaxial quantum-dot lasers on silicon operating under long- and short-cavity feedback conditions for photonic integrated circuits. Phys. Rev. A 2021, 103, 033509. [Google Scholar] [CrossRef]
  29. Wang, C.; Raghunathan, R.; Schires, K.; Chan, S.C.; Lester, L.F.; Grillot, F. Optically injected InAs/GaAs quantum dot laser for tunable photonic microwave generation. Opt. Lett. 2016, 41, 1153–1156. [Google Scholar] [CrossRef]
  30. Jiang, Z.F.; Wu, Z.M.; Yang, W.Y.; Hu, C.X.; Lin, X.D.; Jin, Y.H.; Dai, M.; Cui, B.; Yue, D.Z.; Xia, G.Q. Numerical simulations on narrow-linewidth photonic microwave generation based on a QD laser simultaneously subject to optical injection and optical feedback. Appl. Opt. 2020, 59, 2935–2941. [Google Scholar] [CrossRef]
  31. Li, Q.Z.; Wang, X.; Zhang, Z.Y.; Chen, H.M.; Huang, Y.Q.; Hou, C.C.; Wang, J.; Zhang, R.Y.; Ning, J.Q.; Min, J.H.; et al. Development of modulation p-doped 1310 nm InAs/GaAs quantum dot laser materials and ultrashort cavity fabry–perot and distributed-feedback laser diodes. ACS Photonics 2018, 5, 1084–1093. [Google Scholar] [CrossRef]
  32. Kelleher, B.; Dillane, M.; Viktorov, E.A. Optical information processing using dual state quantum dot lasers: Complexity through simplicity. Light-Sci. Appl. 2021, 10, 238. [Google Scholar] [CrossRef]
  33. Lin, L.C.; Chen, C.Y.; Huang, H.; Arsenijevic, D.; Bimberg, D.; Grillot, F.; Lin, F.Y. Comparison of optical feedback dynamics of InAs/GaAs quantum-dot lasers emitting solely on ground or excited states. Opt. Lett. 2018, 43, 210–213. [Google Scholar] [CrossRef] [Green Version]
  34. Xu, P.F.; Tao, Y.; Ji, H.M.; Cao, Y.L.; Gu, Y.X.; Liu, Y.; Ma, W.Q.; Wang, Z.G. Temperature-dependent modulation characteristics for 1.3 mu m InAs/GaAs quantum dot lasers. J. Appl. Phys. 2010, 107, 013102. [Google Scholar] [CrossRef]
  35. Jiang, Z.F.; Wu, Z.M.; Jayaprasath, E.; Yang, W.Y.; Xia, G.Q. Nonlinear dynamics of exclusive excited-state emission quantum dot lasers under optical injection. Photonics 2019, 6, 58. [Google Scholar] [CrossRef] [Green Version]
  36. Wang, X.H.; Wu, Z.M.; Jiang, Z.F.; Xia, G.Q. Nonlinear dynamics of two-state quantum dot lasers under optical feedback. Photonics 2021, 8, 300. [Google Scholar] [CrossRef]
  37. Tykalewicz, B.; Goulding, D.; Hegarty, S.P.; Huyet, G.; Dubinkin, I.; Fedorov, N.; Erneux, T.; Viktorov, E.A.; Kelleher, B. Optically induced hysteresis in a two-state quantum dot laser. Opt. Lett. 2016, 41, 1034–1037. [Google Scholar] [CrossRef] [PubMed] [Green Version]
  38. Virte, M.; Panajotov, K.; Sciamanna, M. Mode competition induced by optical feedback in two-color quantum dot lasers. IEEE J. Quantum Electron. 2013, 49, 578–585. [Google Scholar] [CrossRef]
  39. Virte, M.; Pawlus, R.; Sciamanna, M.; Panajotov, K.; Breuer, S. Energy exchange between modes in a multimode two-color quantum dot laser with optical feedback. Opt. Lett. 2016, 41, 3205–3208. [Google Scholar] [CrossRef]
  40. Kelleher, B.; Tykalewicz, B.; Goulding, D.; Fedorov, N.; Dubinkin, I.; Erneux, T.; Viktorov, E.A. Two-color bursting oscillations. Sci. Rep. 2017, 7, 8414. [Google Scholar] [CrossRef] [Green Version]
  41. Meinecke, S.; Kluge, L.; Hausen, J.; Lingnau, B.; Ludge, K. Optical feedback induced oscillation bursts in two-state quantum-dot lasers. Opt. Express 2020, 28, 3361–3377. [Google Scholar] [CrossRef] [PubMed]
  42. Viktorov, E.A.; Mandel, P.; O’Driscoll, I.; Carroll, O.; Huyet, G.; Houlihan, J.; Tanguy, Y. Low-frequency fluctuations in two-state quantum dot lasers. Opt. Lett. 2006, 31, 2302–2304. [Google Scholar] [CrossRef] [PubMed]
  43. Yamasaki, K.; Kanno, K.; Matsumoto, A.; Akahane, K.; Yamamoto, N.; Naruse, M.; Uchida, A. Fast dynamics of low-frequency fluctuations in a quantum-dot laser with optical feedback. Opt. Express 2021, 29, 17962–17975. [Google Scholar] [CrossRef] [PubMed]
  44. Wang, C.; Grillot, F.; Even, J. Impacts of wetting layer and excited state on the modulation response of quantum-dot lasers. IEEE J. Quantum Electron. 2012, 48, 1144–1150. [Google Scholar] [CrossRef] [Green Version]
  45. Kayhani, K.; Rajaei, E. Investigation of dynamical characteristics and modulation response function of InAs/InP (311) B quantum dot lasers with different QD size. Photonics Nanostruct. Fundam. Appl. 2017, 25, 1–8. [Google Scholar] [CrossRef]
  46. Zhou, Y.G.; Duan, J.N.; Grillot, F.; Wang, C. Optical noise of dual-state lasing quantum dot lasers. IEEE J. Quantum Electron. 2020, 56, 2001207. [Google Scholar] [CrossRef]
  47. Viktorov, E.A.; Mandel, P.; Tanguy, Y.; Houlihan, J.; Huyet, G. Electron-hole asymmetry and two-state lasing in quantum dot lasers. Appl. Phys. Lett. 2005, 87, 053113. [Google Scholar] [CrossRef] [Green Version]
  48. Virte, M.; Breuer, S.; Sciamanna, M.; Panajotov, K. Switching between ground and excited states by optical feedback in a quantum dot laser diode. Appl. Phys. Lett. 2014, 105, 121109. [Google Scholar] [CrossRef]
  49. Abusaa, M.; Danckaert, J.; Viktorov, E.A.; Erneux, T. Intradot time scales strongly affect the relaxation dynamics in quantum dot lasers. Phys. Rev. A 2013, 87, 063827. [Google Scholar] [CrossRef]
  50. Drzewietzki, L.; The, G.A.P.; Gioannini, M.; Breuer, S.; Montrosset, I.; Elsasser, W.; Hopkinson, M.; Krakowski, M. Theoretical and experimental investigations of the temperature dependent continuous wave lasing characteristics and the switch-on dynamics of an InAs/InGaAs quantum-dot semiconductor laser. Opt. Commun. 2010, 283, 5092–5098. [Google Scholar] [CrossRef]
  51. Kim, B.; Locquet, A.; Li, N.Q.; Choi, D.; Citrin, D.S. Bifurcation-cascade diagrams of an external-cavity semiconductor laser: Experiment and theory. IEEE J. Quantum Electron. 2014, 50, 965–972. [Google Scholar] [CrossRef] [PubMed]
  52. Mengue, A.D.; Essimbi, B.Z. Complex chaos and bifurcations of semiconductor lasers subjected to optical injection. Opt. Quantum Electron. 2011, 42, 389–407. [Google Scholar] [CrossRef]
Figure 1. Schematic diagram of asymmetric electron-hole carrier dynamics and energy level structure of QDLs. ES(e): electrons in excited state; ES(h): holes in excited state; GS(e): electrons in ground state; GS(h): holes in ground state.
Photonics 10 00878 g001
Figure 2. Electron escape rate Ce as a function of the operation temperature of QDLs.
Photonics 10 00878 g002
Figure 3. Normalized output power as a function of normalized the injection current for a QDL without optical feedback under Ce = 0 (a) and Ce = 20.3 (b), respectively, and threshold currents of ES and GS as a function of Ce (c).
Photonics 10 00878 g003
Figure 4. Bifurcation diagrams of power extreme and mean power as a function of feedback intensity of GS (blue) and ES (red) in QDL biased at 3.5 under optical feedback with τ = 100 and (a) Ce = 0, (b) Ce = 5, (c) Ce = 10, (d) Ce = 15, (e) Ce = 20.3, respectively.
Photonics 10 00878 g004
Figure 5. Bifurcation diagrams of power extreme and mean power as a function of feedback intensity of GS (blue) and ES (red) in QDL biased at 5.7 under optical feedback with τ = 100 and (a) Ce = 0, (b) Ce = 5, (c) Ce = 10, (d) Ce = 15, (e) Ce = 20.3, respectively.
Photonics 10 00878 g005
Figure 6. Mapping of the dynamical states of GS emission (the first row) and ES emission (the second row) in the parameter space of feedback intensity and phase offset for QDL biased at 3.5 under different Ce where (a) Ce = 0, (b) Ce = 5, (c) Ce = 10, (d) Ce = 15, (e) Ce = 20.3. S: stable, P1: period one, P2: period two, MP: multi-period, and C: chaos.
Photonics 10 00878 g006
Figure 7. Mapping of the dynamical states of GS emission (the first row) and ES emission (the second row) in the parameter space of feedback intensity and phase offset for QDL biased at 5.7 under different Ce where (a) Ce = 0, (b) Ce = 5, (c) Ce = 10, (d) Ce = 15, (e) Ce = 20.3. S: stable, P1: period one, P2: period two, MP: multi-period, and C: chaos.
Photonics 10 00878 g007
Disclaimer/Publisher’s Note: The statements, opinions and data contained in all publications are solely those of the individual author(s) and contributor(s) and not of MDPI and/or the editor(s). MDPI and/or the editor(s) disclaim responsibility for any injury to people or property resulting from any ideas, methods, instructions or products referred to in the content.

