Article

Spatial Spectral Characteristics of Partial Discharge with Different Electrode Models

1
Key Laboratory of Specialty Fiber Optics and Optical Access Networks, Joint International Research Laboratory of Specialty Fiber Optics and Advanced Communication, Shanghai University, Shanghai 200444, China
2
Photonics & Optical Communications, School of Electrical Engineering & Telecommunications, University of New South Wales, Sydney, NSW 2052, Australia
*
Author to whom correspondence should be addressed.
Photonics 2023, 10(7), 788; https://doi.org/10.3390/photonics10070788
Submission received: 5 June 2023 / Revised: 1 July 2023 / Accepted: 4 July 2023 / Published: 7 July 2023
(This article belongs to the Topic Advances in Optical Sensors)

Abstract

:
In this paper, the spatial spectral characteristics of partial discharge (PD) under different electrode models are mainly studied. In the initial corona discharge stage, the emission spectrum is mainly emitted by the N2(C3IIuB3IIg) energy level transition of the N2 second positive band system. The spectrum is in the ultraviolet range of 294–436 nm, and its main peak is at 337 nm. The streamer discharge stage spectrum is mainly emitted by the energy level transition of the second positive band system of N2, N+, NO, and O+ and the first positive band system of N2(B3IIgA3 Σ u + ). In the gap of different polarity electrodes, the ultraviolet spectrum content near the positive polarity is more abundant. The UV spectra ranges are 202–225 nm and 229–292 nm, respectively. The discharge of the needle–sphere system is more intense in visible light and near-infrared light, with peaks at 500 nm and 777 nm, respectively. In addition, the PD process based on the finite element method is simulated by COMSOL Multiphysics software. The simulation results show that the distribution of high-energy electron density varies with the electrode spacing and discharge model. The influence of particle energy level transition on the spatial spectral characteristics of PD is verified. This work provides important insights and possibilities for future fluorescent fiberoptic sensing and positioning for spatial PD detection and positioning using spectral characteristic peaks as detection quantities or excitations.

1. Introduction

Partial discharge (PD) is a discharge phenomenon that occurs when strong electric fields generated by applied voltage on electrical equipment lead to irregular discharge channels [1,2,3]. If left unaddressed, PD can cause internal and external damage to equipment, accelerating aging [4]. This type of insulation damage and aging is characterized by the accumulation of conductor terminal charges, ionization from the impact of charged particles on air molecules, chemical formation, and damage from ionizing radiation to insulation materials [5,6,7]. Therefore, it is of great importance to conduct research and develop an early warning and analysis methods for detecting PD occurrences to ensure the safety and normal operation of power transmission equipment [8,9,10].
Analyzing the mechanism of PD is crucial for timely identification and prevention of accidents. PD can be broadly classified into two stages. The first stage, known as corona discharge, refers to the discharge pattern that does not completely bridge the gap between two conductors. The charge transfer is minimal, typically lasts from a few nanoseconds to a few microseconds, and ranges from 10 to 1000 pC. The second stage, breakdown discharge, occurs when the gap between two conductors is completely bridged. The applied voltage required for this stage is higher. Following the formation of insulation breakdown, the power supply system generates a transient strong pulse current [11]. This process involves charge transfer, the loss of electric energy, and PD light generation.
The optical measurement method is used to detect the light signal generated during the discharge process and analyze the PD condition. The mechanism of the PD light effect is very complex, as the defect type, propagation path, and spectrum of the signal can affect the detection results [12]. Spectral analysis of PD light is a common research method for studying the PD phenomenon [13]. In addition, researchers have utilized high-speed cameras to capture the PD process, further analyzing the color information and spectral data of the visible light images obtained by the process in parallel [14,15,16]. This method can also facilitate the detection and location of the PD [17]. Wang et al. used spectral chromaticity coordinates to diagnose PD under different voltages and stages [18]. Xia et al. developed a multi-channel photoelectric detection system that could simultaneously perform multi-spectral detection on different types of PD [19]. In our previous work, we realized the sensing and localization of PD using a fluorescent fiber that had a fluorescence spectrum that matches the PD spectrum [20,21,22]. By optimizing multi-point acquisition, we were able to improve the sensing accuracy and better realize three-dimensional space sensing [22]. However, there are few studies on the spectral analysis of PD at different stages and spatial locations. To further advance PD sensing and improve the positioning accuracy, conducting a precise investigation and analysis of PD light is critical.

2. Methodologies

2.1. Spectral Characteristics of PD

The generation of PD light is related to the energy transition process of particles, such as electron collision ionization and space photoionization, in the gas molecule’s ionization process. Different particles emit light of specific wavelengths according to the energy released by their respective excited-state energy levels, which can be expressed by the ionization energy of gas molecules [23,24]. This characteristic can be used to diagnose the excited particles present in the gas discharge. The strength of the spectral lines reflects the number of atoms or molecules involved in emitting different lines.
In various PD spectrum studies, the needle–plate model corona discharge spectrum in transformer oil covers the entire visible light band, with the maximum spectral radiation intensity concentrated in the green and red bands. The spectrum generated by corona and breakdown discharges in inert gas SF6 is also concentrated in the range 300–800 nm [25,26]. The spectral band generated by arc discharge under aeronautical pressure conditions mainly lies within 280–420 nm, and the measured spectrum range of insulator PD is 200–400 nm. Previous researchers have studied AC and DC arc radiation, whereas Zhao et al. analyzed the typical PD spectra under different frequency and amplitude square wave voltages [27,28,29]. Spectral components in the 400–700 nm band mostly occur during spark discharge, resulting in white light between electrodes. In air, most of the spectral components during corona discharge are concentrated in the ultraviolet band of 280–400 nm. As the most common insulating medium, air mainly consists of N2, O2, a small amount of CO2, water vapor, and rare gases. Electrons with high mobility can be accelerated to 2–20 eV in the electric field. High-energy electrons will collide with air particles inelastically during migration. The particles will be stimulated from the ground state to the excited state; however, this state is not stable. When the particle returns to the ground state from the excited state, it will emit photons in the form of electromagnetic radiation energy and release excess energy. The ionized gas composition in the air determines the radiation spectrum of PD. Nitrogen and nitrogen compounds are the main contributors to the generation of ultraviolet light by PD in air [30,31].
The energy of electrons comes from the kinetic energy gained through electric field acceleration in the discharge space. The emission spectra of the second positive band system of N2(C3IIuB3IIg) in nitrogen molecules are mainly generated by the collision of high-energy electrons (>11 eV) with ground-state molecules [29,32]. The physical process can be expressed as follows:
e + N 2 e + N 2 ( C 3 I I u )
N 2 ( C 3 I I u ) N 2 ( B 3 I I g ) + h v
where h is the Planck constant and v is the frequency of light.
The intensity of the ultraviolet spectral line of the second positive band system of nitrogen molecules is expected to be proportional to both the density of ground-state nitrogen molecules and the high-energy electron density. Due to the low ionization rate in atmospheric air discharge, most nitrogen molecules remain in the ground state. Therefore, it can be assumed that the ground-state nitrogen molecular densities at different positions are the same. In other words, the intensity of the UV spectrum is determined by the high-energy electron density [18,33,34].

2.2. Experiments and Methods

The corona discharge spectra of needle–plate electrodes in air change with the applied voltage or distance between the electrodes. The radiation intensity in the visible region is much weaker than that in the near ultraviolet and near-infrared regions [26]. When the electrode spacing is constant, the radiation intensity in the near-infrared region decreases with an increase in applied voltage, whereas the radiation intensity in the near-ultraviolet region increases with an increase in applied voltage. When the applied voltage is constant, the radiation intensity in the near-infrared region increases with an increase in electrode spacing, whereas the radiation intensity in the near-ultraviolet region decreases with an increase in electrode spacing. In summary, the applied voltage, electrode spacing, and the type of air molecules all affect the associated spectrum of gas PD to varying degrees.
To obtain the spectrum of each spatial position in different stages of PD, the experimental setup was designed as shown in Figure 1. It consisted of a simulated high-voltage discharge source, a transmission fiber, a spectrometer (QEP02617, Ocean Optics, Orlando, FL, USA), and a PC data processing terminal. The simulated discharge source was composed of a high-voltage DC generator with an adjustable range of 30–39 kV. Two discharge models were used: sphere–sphere electrode discharge (SSED) and needle–sphere electrode discharge (NSED). In the experiment, single-point spectra at different positions between the two electrodes were reliably achieved. The primary performance parameters of the QEPRO spectrometer are shown in Table 1, with its detection spectral range being 195–1000 nm. The fixed electrode spacing D and the transmission fiber to PD distance were maintained. When a high voltage of 37–39 kV was applied to the high-voltage generator, PD was generated from both ends of the electrode. We gradually increased the voltage to test corona discharge and electric breakdown during the two stages of PD. The corona and electrical breakdown in the experiment are shown in Figure 2. By observing the corona stage of the electrode in the figure, it can be found that there is a clear blue-violet corona layer and that the instant of electrical breakdown consists of fine and bright streamer channels.

2.3. Simulation Models

In the discharge experiment, phenomena and information such as light, sound, and heat can be directly felt or obtained. However, the physical quantities such as electric field, potential, electron temperature, and electron density cannot be directly obtained. We utilized the plasma module of COMSOL Multiphysics for numerical simulation to study the microscopic nature of gas discharge, which was solved through partial differential equations based on the finite element method. This approach provided an accurate description of the gas discharge, and fluid dynamics were analyzed to reflect the motion characteristics and distribution law of particles in plasma discharge. We obtained the high-energy electron density distribution of the main role of collision ionization in the discharge process from the simulation. Both SSED and NSED were numerically simulated using a plasma physical interface, with a two-dimensional symmetric structure established as depicted in Figure 3. The red dotted line is the axis of symmetry. Based on the actual electrode model, the tip radius was set to 0.25 mm, whereas the sphere radius was set to 3 mm. The upper and lower electrodes were connected to the high-voltage and ground terminals, respectively. The initial value of electrode spacing D was set to 1 cm, and the charge in the whole plasma region was conserved.
To facilitate the convergence of simulation calculations and reduce complexity, we set parameters for the transient analysis of the plasma region. The secondary electron emission coefficient was set to 0.07, whereas the maximum electric field in the breakdown region was set to 3 × 10⁶ V/m. The minimum electric field specified for electron propagation was 4.7 kV/cm, and the surface electron work function of the specified metal electrode was 5 eV. Regarding plasma properties, we used reduced electron transfer properties and the reduced electron mobility ( μ e ) was set to 1 × 1025 (V·m·s)−1. We employed the local energy approximation to represent the average electron energy and the Maxwell function to represent the electron energy distribution function. Neglecting the electron convection effect caused by fluid motion, the drift–diffusion equations for calculating electron density ( n e ) and mean electron energy ( n ε ) are:
t ( n e ) + [ n e ( μ e · E ) D e · n e ] = R e ,
t ( n ε ) + [ n ε ( μ ε · E ) D ε · n ε ] +   E · Γ e = R ε ,
where R e is the electron source flux and R ε is the energy loss of electrons through inelastic collisions. T e = 2 3 k B ε is the electron temperature. k B is the Boltzmann constant. D e =   μ e T e is the electron diffusion coefficient. The energy mobility and energy diffusion coefficient are μ ε = ( 5 3 ) μ e and D ε = ( 5 3 ) D e , respectively [35]. Γ e = ( μ e · E ) n e D e · n e is the average electron flux (m2·s)−1.
For DC discharge, using the Townsend coefficient to define the reaction rate can lead to better results. Meanwhile, the Thomson coefficient can provide a more accurate description of the state of change [36]. When the electron flux is driven by the field, as in DC discharge, it can improve the stability of the numerical scheme. R e and R ε are determined by the plasma chemical reaction rate. We assume that M is the number of reactions that cause changes in the number of electrons. P is the number of inelastic collisions between electrons and neutral particles (P >> M). When utilizing the Townsend coefficient, the electron source term and electronic energy loss are given by:
R e = j = 1 M x j α j N n | Γ e | ,
R ε = j = 1 P x j k j N n n e Δ ε j ,
where x j is the mole fraction of the target substance of reaction j, N n is the total neutral number density (1/m3), α j is the Townsend coefficient of reaction j (m2), and Δ ε j is the energy loss of reaction j (V).
The rate coefficient is calculated from the cross-sectional data by the following integral:
k k = γ   0 ε σ k ( ε ) f ( ε ) d ε ,
where γ = ( 2 q / m e ) 1 / 2 is charge-mass ratio coefficient (C1/2/kg1/2), m e is electronic mass (kg), ε and σ k ( ε ) are the average electron energy (V) and collision cross section (m2), respectively, and f ( ε ) is the EEDF (electron energy distribution function) value of electron kinetic energy that conforms to Maxwell [35].
For non-electronic particles (neutral molecules, positive and negative ions), their transport equations are:
ρ t ( w k ) + ρ ( u · ) w k = · j k + R k
The electrostatic field is controlled by the Poisson equation · ε 0 ε k V = ρ . The space charge density ρ is automatically calculated according to the plasma chemical composition specified in the model. The formula is as follows:
ρ = q ( k = 1 N Z k n k n e ) .
With regard to the boundary conditions, the electron in the medium is captured at the boundary (wall) near the plate and the secondary emission occurs with the wall to gain. The electron flux and electron energy flux of the wall generated during the process are:
n · Γ e = ( 1 2 v e , t h n e ) p γ p ( Γ p n ) ,
n · Γ ε = ( 5 6 v e , t h n ε ) p ε p γ p ( Γ p n ) ,
where γ p is the secondary ionization efficiency, ε p is the secondary ionization electron energy expectation, v e , t h = 8 k B T π m e is the electron thermodynamic velocity [35], and T is the background gas temperature (300 K).
For heavy matter, ions will be lost on the wall under the action of the surface reaction, and the electric field points directly to the wall and satisfies:
n · j k = M w R k + M w c k Z μ k ( E · n ) [ Z k μ k ( E · n ) > 0 ] .
There is charge accumulation at the electrode and gas capture layer charge [37], which satisfies n · ( D 1 D 2 ) = ρ s . The surface charge density ρ s is constrained by the current generated by the density change of the plasma on the wall, that is, d ρ s d t = n · J i + n · J e .

3. Results and Discussion

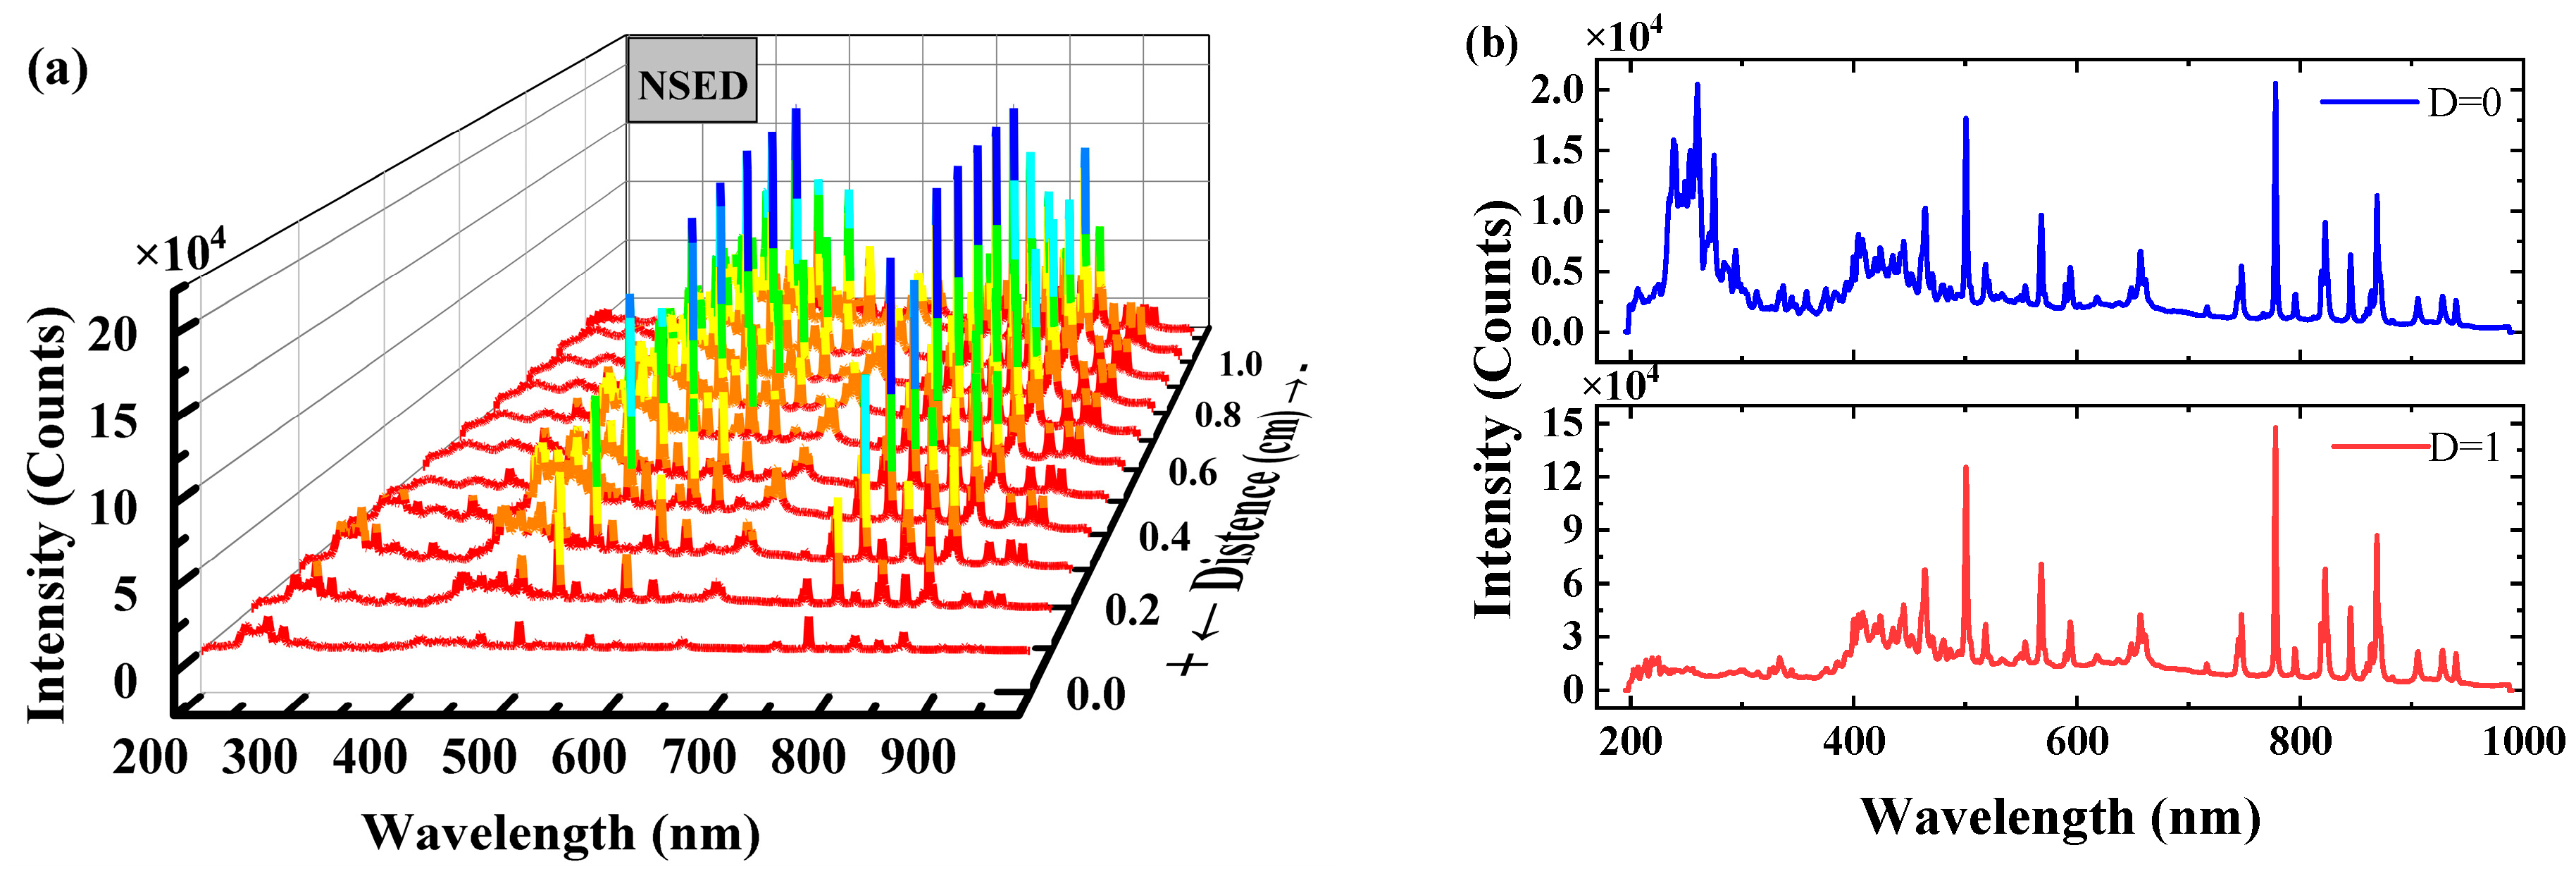
3.1. Experimental Results

Using the spectral analysis device described above, the electrode spacing D was set to 1 cm and the distance from the PD source to the crystal fiber transmission end face was set to 1.5 cm. The integration time of the Ocean View software capture was set to 500 ms. However, due to the discontinuity of the PD breakdown channel and the inhomogeneity of plasma distribution, the resulting spectral intensity was unstable, causing fluctuations in its amplitude intensity. To address this, each group of experiments was repeated several times to obtain the average spectral intensity. As a result, the PD spectra of the two models were obtained experimentally.

3.1.1. Corona Discharge

In the non-uniform electric field of the NSED electrode system, when a high voltage was applied but had not yet caused air gap breakdown, the large curvature of the electrodes exhibited a high charge density and first produced a purple corona layer. During the stable corona discharge stage of NSED with a voltage of 37 kV, its spectrum wavelength range was observed to be 300–400 nm, as shown in Figure 4. The peak of the spectrum is at 337 nm. The emission spectrum is generated by the transition of the second positive band system N2(C3IIu) to N2(B3IIg). Ultraviolet light was found to exist near the electrode, whereas no other locations in the spatial spectrum showed any light amplitude, which was consistent with the corona distribution observed in the experiment. On the other hand, due to the symmetry of the same electrode, SSED was relatively more susceptible to breakdown and reached the electric breakdown stage under the experimental conditions within the voltage range of 37–39 kV.

3.1.2. Breakdown Discharge

When a higher voltage of 39 kV was applied to both ends of the counter electrode, electrical breakdown occurred in both the SSED model and NSED model. The field strength of the electrode gap was further enhanced, resulting in the acceleration of the kinetic energy aggregation of electrons. At this time, an increase in high-energy electrons aggravates ionization. The electrical breakdown spectra from repeated experiments were observed and depicted in Figure 5 and Figure 6. In these figures, it can be seen that the PD spectrum covers ultraviolet, visible, and near-infrared spectral ranges. The higher amplitude in the near-infrared region indicates that more near-infrared photons are generated in intense intermediate ionization collisions. The spectral peaks in the visible and near-infrared light ranges are at 500 nm and 777 nm, respectively. It is mainly produced by the energy level transitions of the first positive band system N2(B3IIgA3 Σ u + ), N+, O and O+ produced by ionization in air. Comparing the two models, the needle–sphere electrode model (NSED) exhibits more intense discharges. Observing the spatial distribution of the ultraviolet region in the spectrum, a strong UV spectrum is present near the positive electrode. Additionally, there are weak ultraviolet photons generated at the negative electrode. The ultraviolet spectral ranges of the positive spherical electrode and the needle electrode are 202–225 nm and 229–292 nm, respectively. The spectral lines are mainly produced by the energy level transition lines of nitrogen oxides (NO) and the second positive band system of N2. Based on the previous theoretical analysis, the strong ultraviolet amplitude at the positive electrode indicates higher nitrogen ions and a large number of high-energy electron density distributions near the positive electrode.

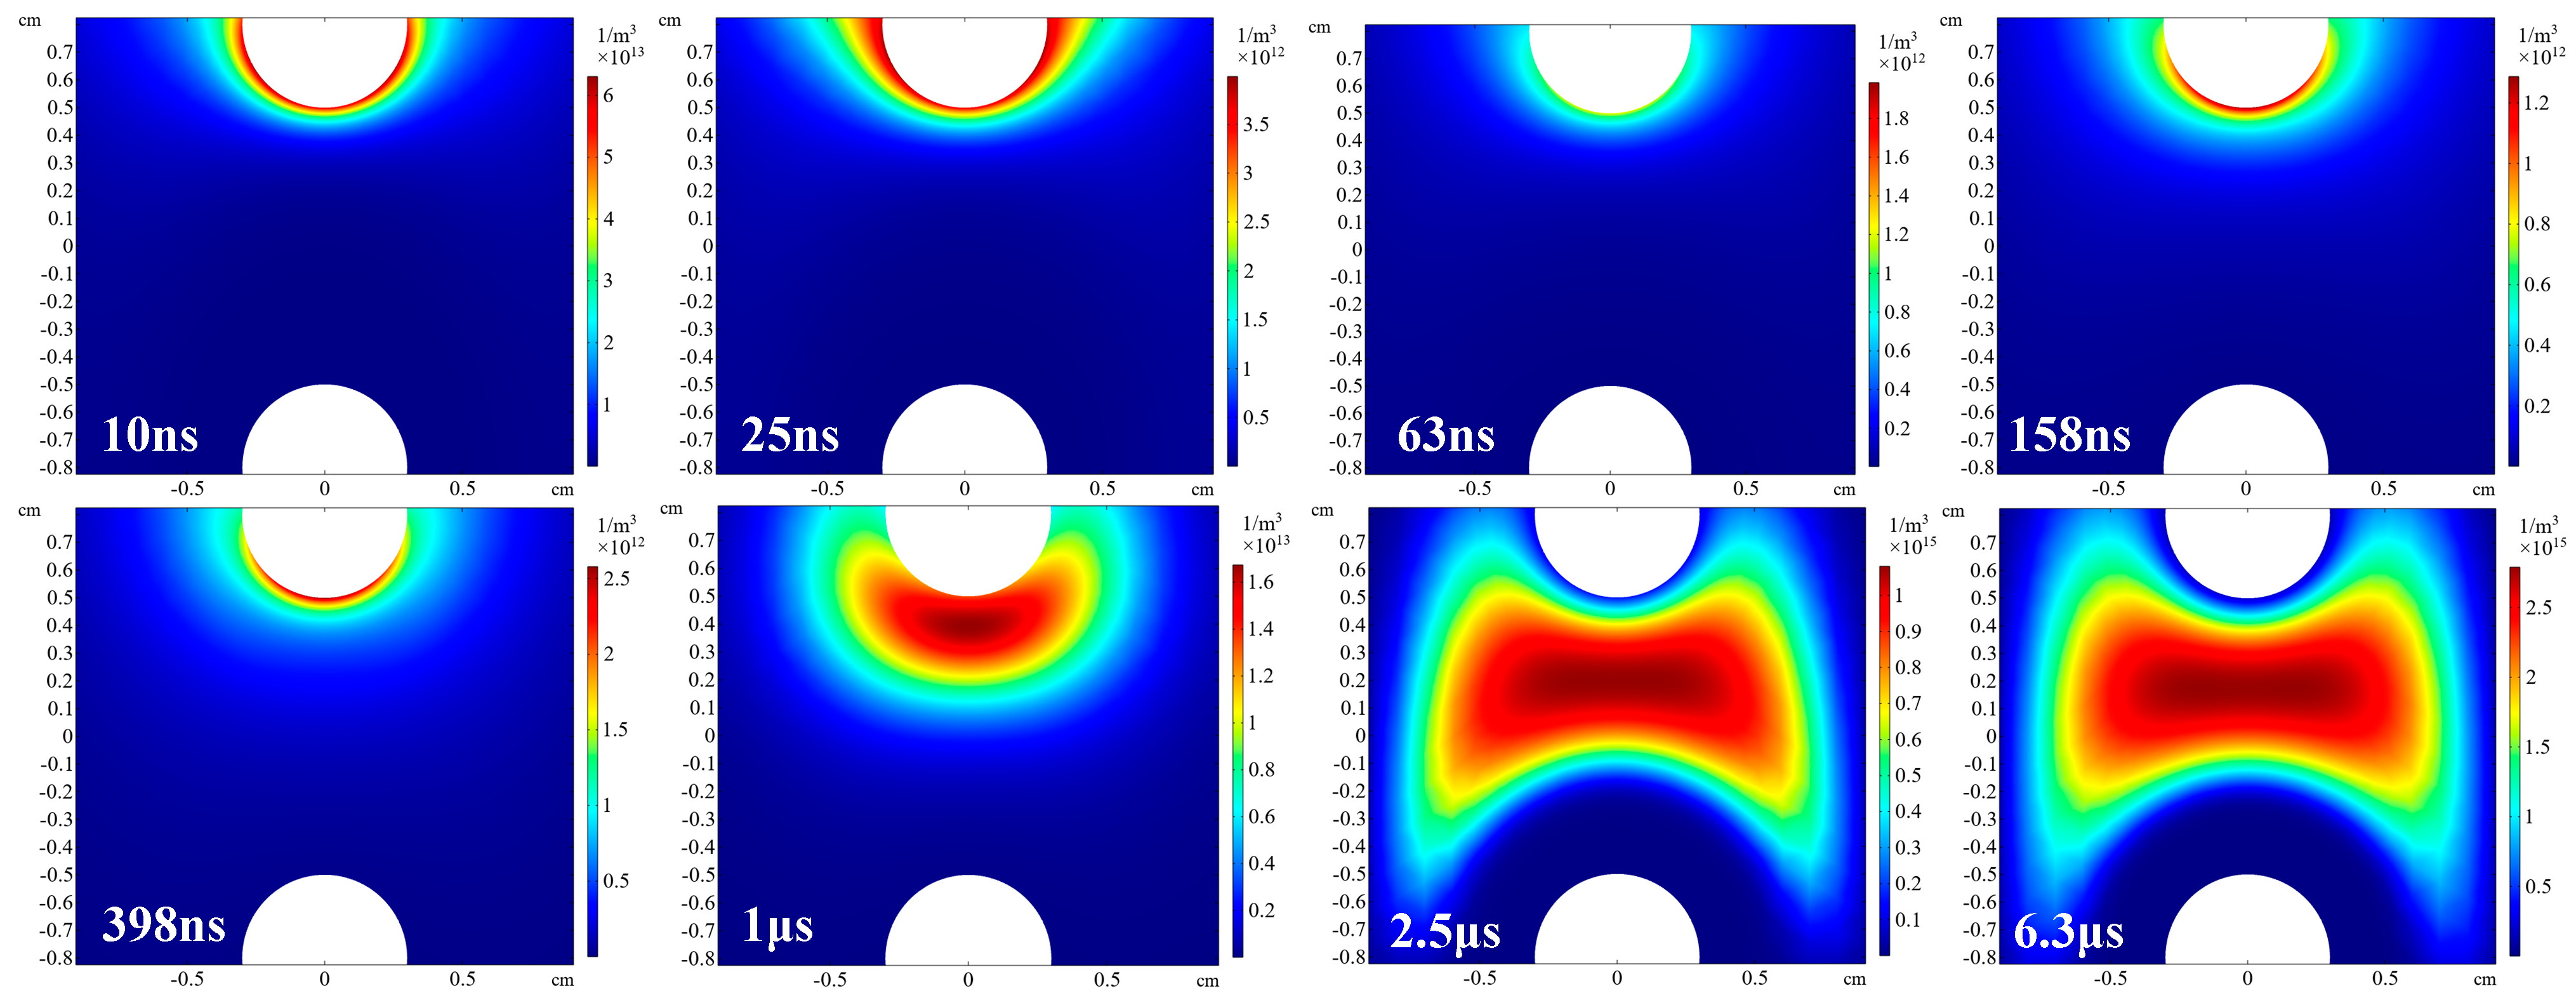
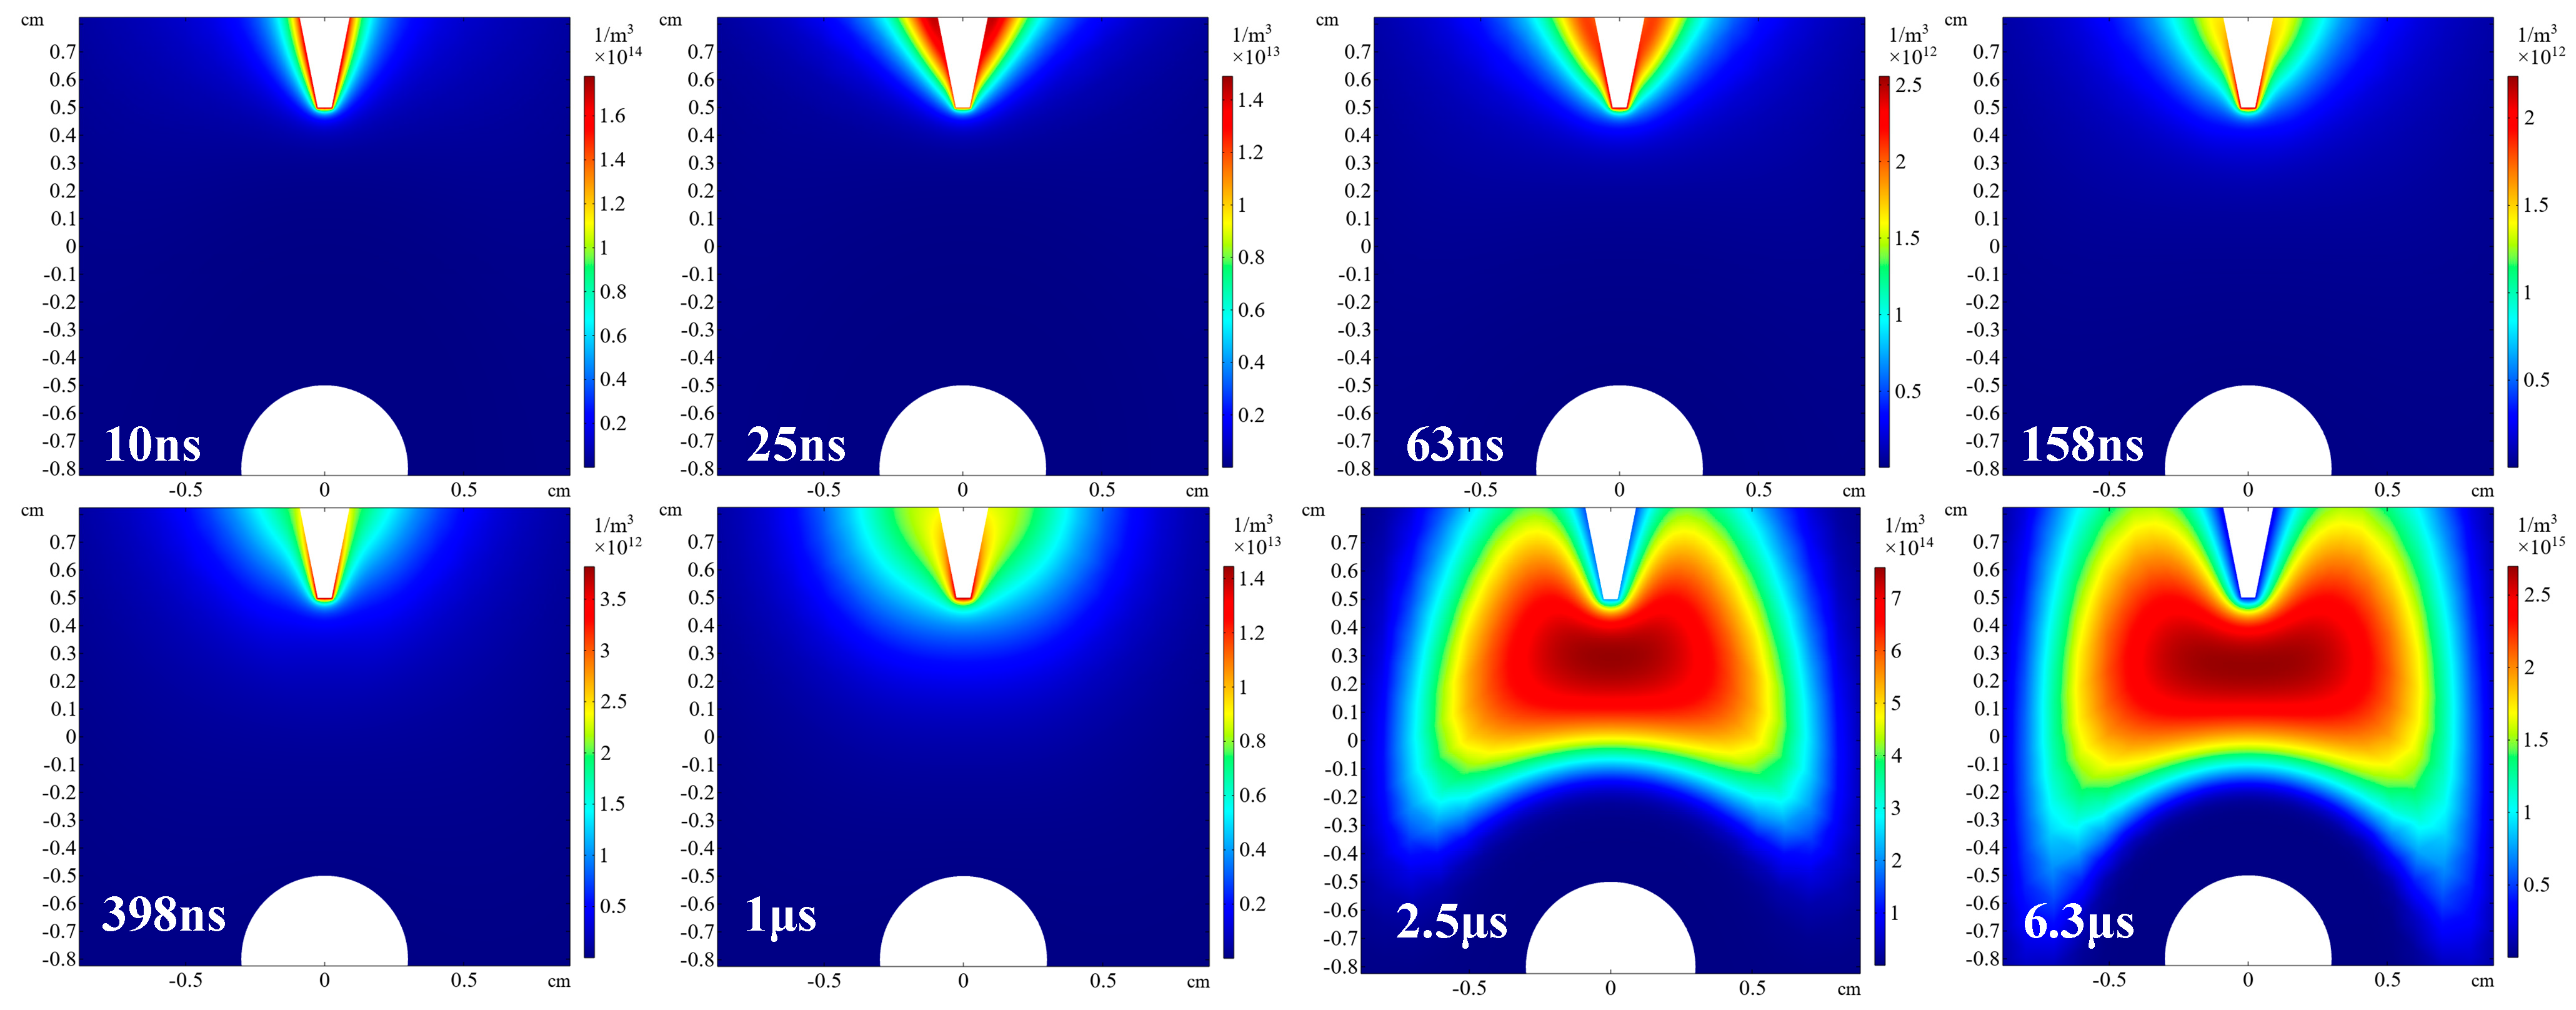
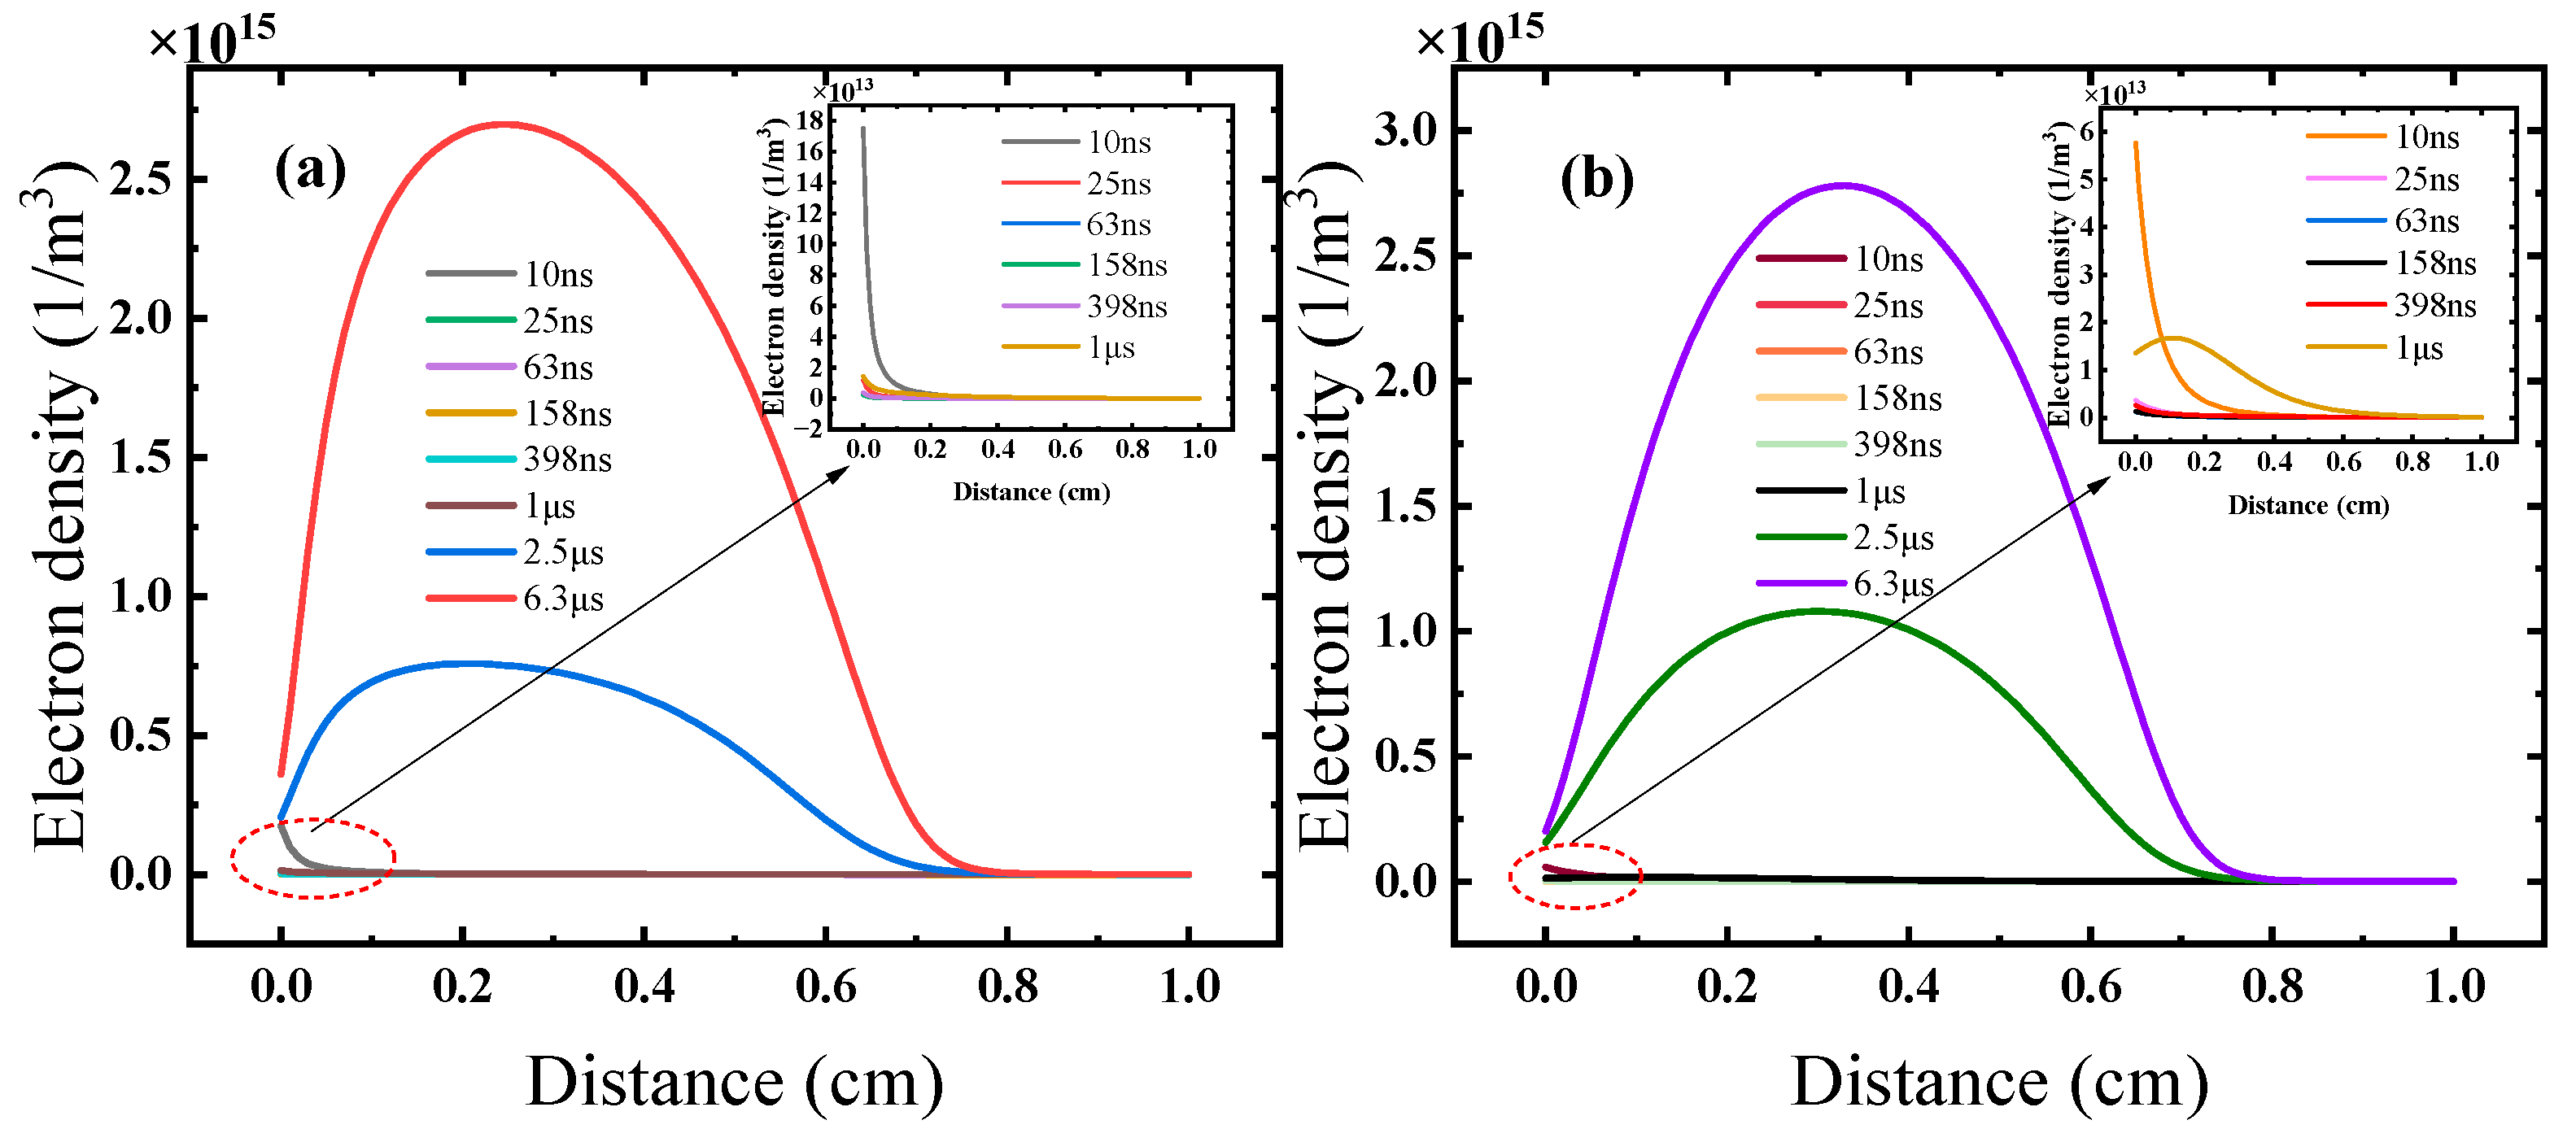
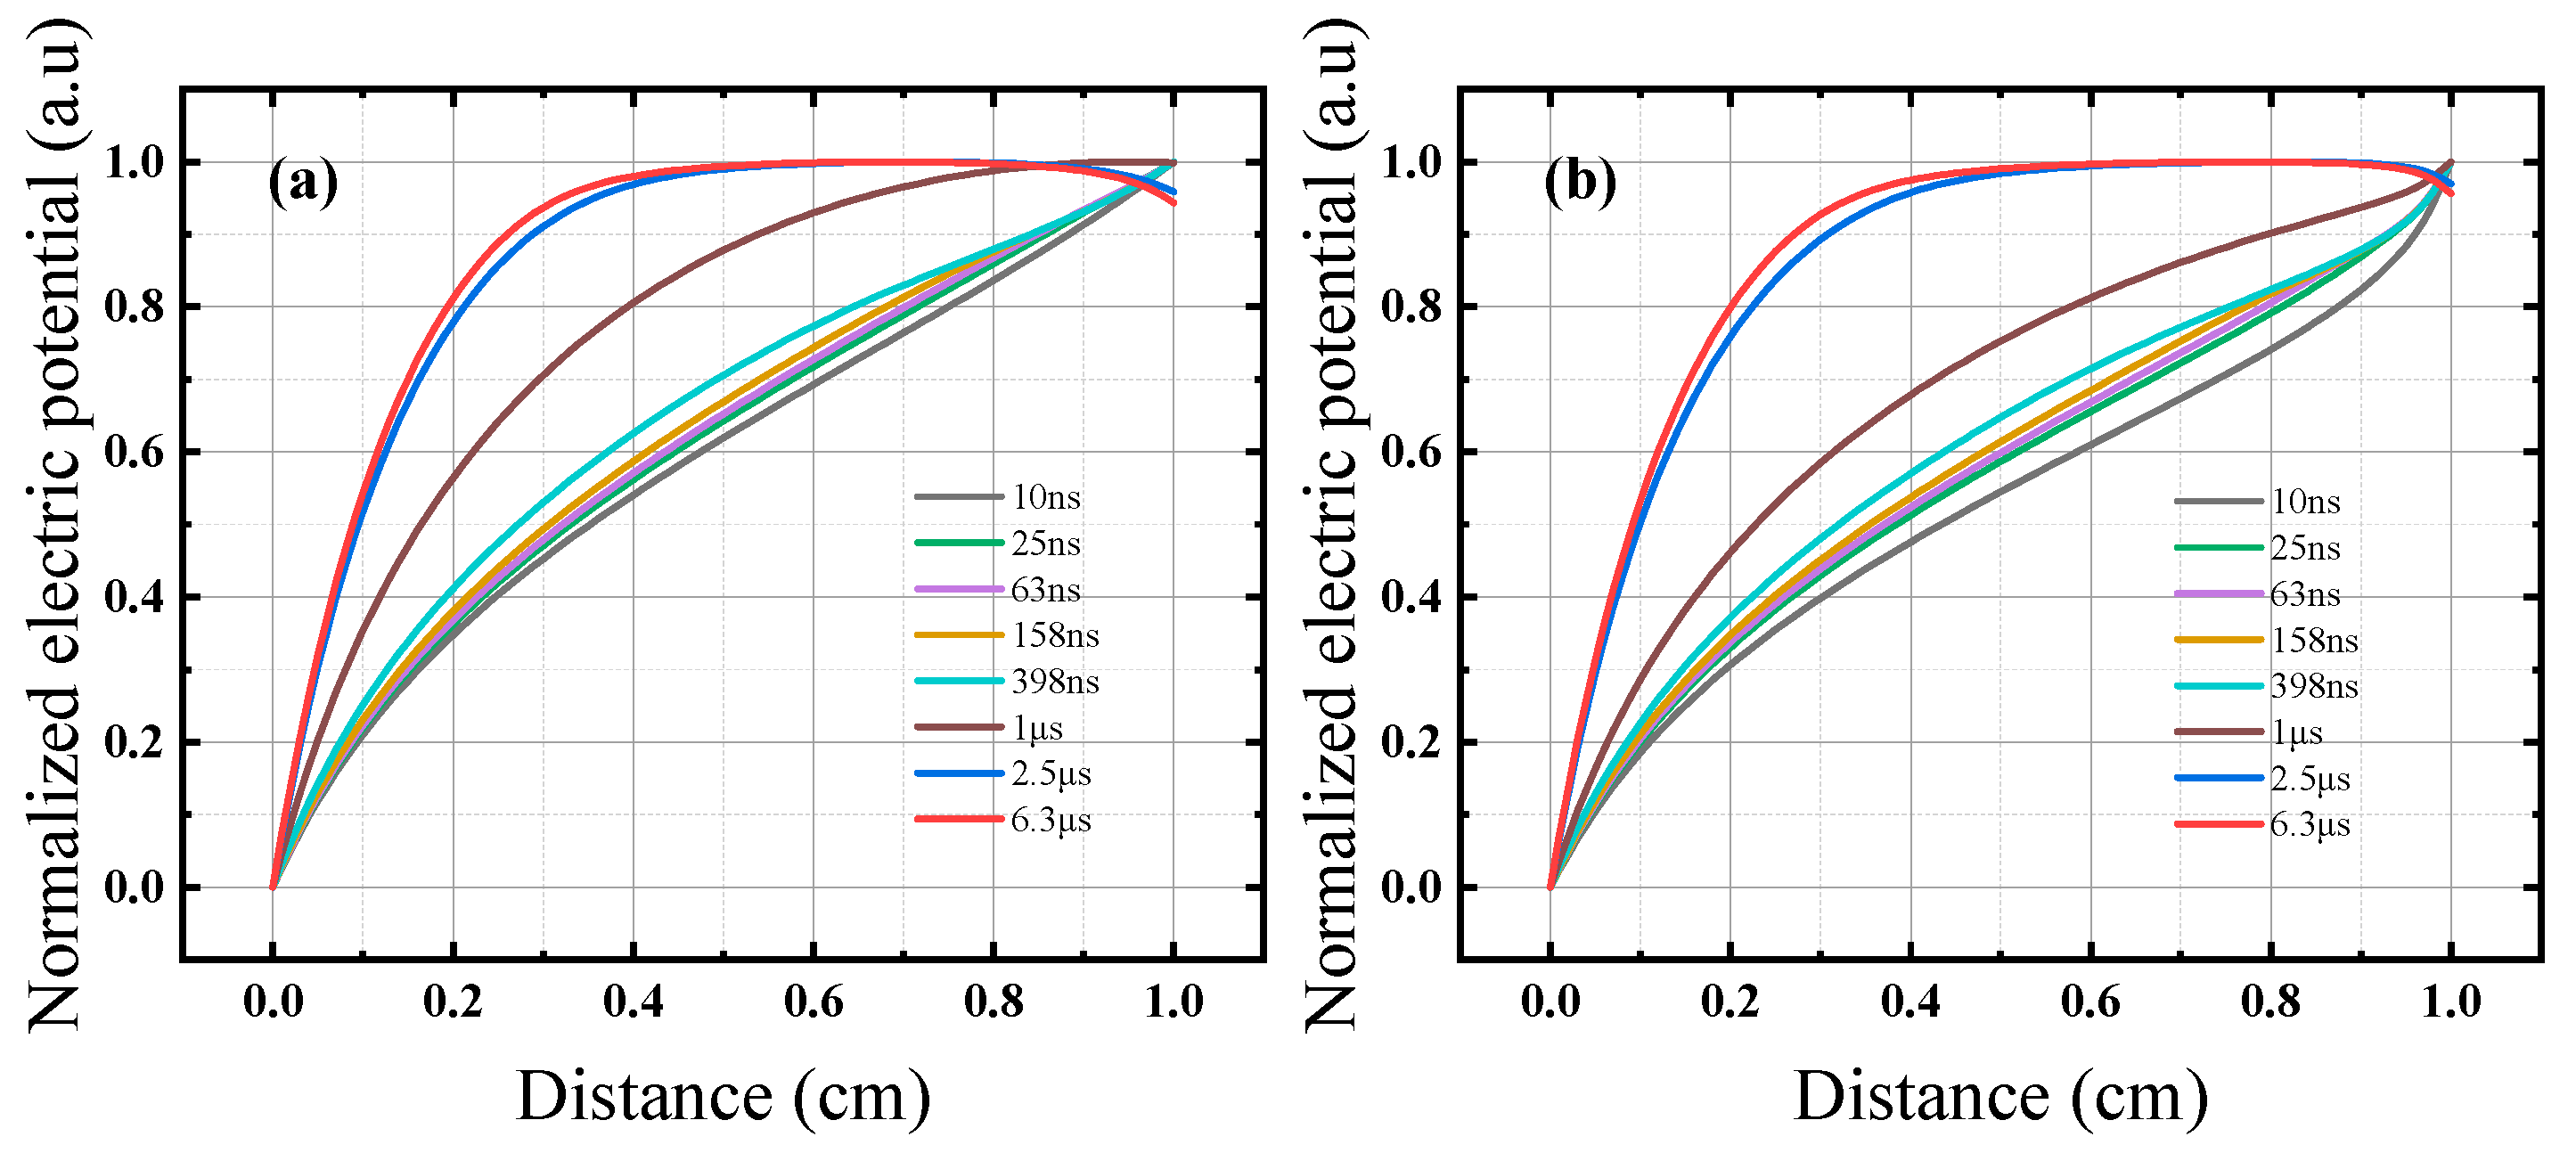
3.2. Simulation Result

Numerical simulations further aid in analyzing the spatial distribution of particles in the local process. The change in high-energy electron number density reflects the development of the plasma discharge channel during breakdown discharge and provides insights into the condition of ionization collisions in air. When satisfying the self-sustaining discharge, the discharge has the ability to continue to develop independently and no longer depends on the role of the external ionization factor. The condition for the occurrence of a breakdown discharge is usually the condition of self-sustaining discharge. That is, the head electron density of the main electron avalanche or the number of space charges generated must reach 108. The dynamic simulation results illustrate the motion state of electron density in both space and time. In Figure 7 and Figure 8, the simulated electron density distributions between the two electrodes for both SSED and NSED are shown over time. The electron number density is observed to have an uneven longitudinal and transverse distribution along the gas gap at different times. As time progresses, the electron group gradually increases and moves towards the negative electrode. This is because the electron avalanche near the negative electrode has not yet reached the positive electrode. Only a small number of initial electrons near the negative electrode move to the positive electrode under the influence of the initial electric field. Furthermore, the electric field formed between the head electron and the positive electrode of the main electron avalanche gradually decreases with the movement of the electron avalanche between 25 ns and 63 ns. Consequently, the electron number density near the positive electrode gradually decreases over time.
Between 398 ns and 1 μs, there is a sharp and significant increase in the electron number density. Initially, the electron number density increases and then decreases within a certain distance from the positive electrode. This is because the main electron avalanche has reached the surface of the positive electrode and a small number of electrons recombine with positive ions ahead and behind the main avalanche. As the main electron avalanche begins to form a plasma streamer on the surface of the positive electrode, the streamer channel develops towards the negative electrode. Consequently, the electron number density in the axial direction near the negative electrode decreases sharply. Once the streamer channel penetrates the entire discharge gap, the electron number density near the negative electrode remains relatively unchanged. Under the same conditions, different electrode shapes also affect the distribution of charged particles in space during discharge, thus affecting the discharge process. Due to the asymmetry of NSED, NSED is slower than SSED but the discharge is more intense. As both models discharge, the total electron density in the gas gap increases over time as the discharge deepens.
The simulation data are further used to plot the axial electron density distribution curve with time, as shown in Figure 9. The change in high-energy electron density in both SSED and NSED follows a similar trend. Due to the small average free path, a large number of high-energy electrons gather near the positive electrode during breakdown discharge in both models. The peak value for the electron density is biased towards the positive electrode, increasing the probability of ionization collision with nitrogen molecules in the air. As a result, the intensity of the second positive band transition peak of N2 increases. Additionally, electron recombination produces continuous spectral lines in the ultraviolet spectral range and the ionization of nitrogen compound molecules generates more photons in the ultraviolet range. Therefore, during discharge spectra containing ultraviolet, visible, and near-infrared spectra, a certain amplitude of ultraviolet light will be generated near the positive electrode when PD occurs. The distribution of simulated particles further confirms the spectral distribution observed in the experimental results.
In order to further investigate the time evolution of the electric potential associated with breakdown phenomena, the electric potential distribution in the interelectrode region was simulated. In Figure 10, we plot the potential curves of the two models from the negative electrode to the positive electrode. The potential between the two electrodes gradually increases from 0 to the maximum point. With the change in time, the potential of each point in the electrode gap increases and eventually tends to be stable. This is consistent with the potential change trend of Murphy BT et al. in simulated liquid environment discharge (negative streamer) [38]. The high potential near the positive electrode in the discharge gap is always maintained, which also accelerates the accumulation and collision of electron kinetic energy, making the types of energy level transitions generated by ionization collision and the content of each spectral component generated during the radiation transition more abundant.

4. Conclusions

The experiment involved building a spatial spectrum detection system with different PD electrodes to analyze the mechanism of PD generation. It was found that the distribution and motion stage of microscopic particles had an impact on the spectral components. The experimental results revealed that PD light exhibited a unique spectrum and that the spectral components varied under different spatial positions and discharge stages for the two electrodes. During the initial corona stage of discharge, the PD spectrum mainly fell within the ultraviolet range (294–436 nm), with a prominent peak at 337 nm. As the discharge progressed to the breakdown stage, the PD spectrum extended to 197–985 nm, encompassing ultraviolet, visible, and near-infrared bands, with the peak at 777 nm. The higher peak photon number observed in NSED indicated a more intense discharge compared with SSED. In this stage, ultraviolet light was generated at both electrodes, with a relatively rich ultraviolet spectrum (202–225 nm and 229–292 nm) near the positive electrode. The presence of the ultraviolet region in the PD spectrum was attributed to the ionization of nitrogen molecules by high-energy electron collisions. The simulation of the spatial and temporal distribution of electron density between the two electrodes during PD corroborated the distribution characteristics of the PD spatial spectrum. Consequently, the content distribution of the discharge spatial spectrum could be utilized to diagnose and identify the discharge stage, type, and positive and negative electrodes involved in PD. High-precision positioning of PD could be achieved by employing multiple sensors to detect specific peak wavelengths. The unique characteristics of the PD spatial spectrum offer practical applications in diagnosis, identification, sensing, and localization of PD. Overall, the spatial spectrum detection system and analysis of PD spectral components provide valuable insights and potential applications in understanding and monitoring partial discharge phenomena.

Author Contributions

Conceptualization, T.W.; methodology, G.P. and Q.G.; software, T.W. and Y.C.; validation, C.X.; formal analysis, T.W. and H.L.; investigation, T.W. and J.C.; resources, Q.G.; data curation, T.W.; writing—original draft preparation, T.W.; writing—review and editing, T.W., Y.C., and Q.G.; visualization, T.W.; supervision, Q.G.; project administration, Q.G. All authors have read and agreed to the published version of the manuscript.

Funding

This research was funded by the Higher Education Discipline Innovation Project of China, grant number D20031.

Institutional Review Board Statement

Not applicable.

Informed Consent Statement

Not applicable.

Data Availability Statement

Data are available from the corresponding author on request.

Conflicts of Interest

The authors declare no conflict of interest.

References

  1. Rosle, N.; Muhamad, N.A.; Rohani, M.N.K.H.; Jamil, M.K.M. Partial Discharges Classification Methods in XLPE Cable: A Review. IEEE Access 2021, 9, 133258–133273. [Google Scholar] [CrossRef]
  2. Guo, Z.; Huang, A.Q.; Hebner, R.E.; Montanari, G.C.; Feng, X. Characterization of Partial Discharges in High-Frequency Transformer Under PWM Pulses. IEEE Trans. Power Electron. 2022, 37, 11199–11208. [Google Scholar] [CrossRef]
  3. da Costa, I.B.V.; Weber, G.H.; Gomes, D.F.; Galvão, J.R.; da Silva, M.J.; Pipa, D.R.; Ozcáriz, A.; Zamarreño, C.R.; Martelli, C.; Cardozo da Silva, J.C. Electric discharge detection and localization using a distributed optical fiber vibration sensor. Opt. Fiber Technol. 2020, 58, 102266. [Google Scholar] [CrossRef]
  4. Stone, G.C. Partial discharge diagnostics and electrical equipment insulation condition assessment. IEEE Trans. Dielectr. Electr. Insul. 2005, 12, 891–904. [Google Scholar] [CrossRef]
  5. Ahmed, N.H.; Srinivas, N.N. On-line partial discharge detection in cables. IEEE Trans. Dielectr. Electr. Insul. 1998, 5, 181–188. [Google Scholar] [CrossRef]
  6. Brunt, R.J.V. Stochastic properties of partial-discharge phenomena. IEEE Trans. Electr. Insul. 1991, 26, 902–948. [Google Scholar] [CrossRef]
  7. Mason, J.H. Dielectric Deterioration due to Internal Discharges. Nature 1950, 165, 932. [Google Scholar] [CrossRef]
  8. Chen, G.J.; Xu, M.; Liu, T.T.; Ni, J.; Xie, D.; Zhang, Y.P. On-Line UHF Monitoring System of Partial Discharge for Electrical Equipment. Adv. Eng. Mater. 2013, 676, 306–311. [Google Scholar] [CrossRef]
  9. Koay, C.K.; Fock, K.M. Planning and design of a surgical intensive care unit in a new regional hospital. Ann. Acad. Med. Singap. 1998, 27, 448–452. [Google Scholar]
  10. Zhu, M.; Chen, G.; Xu, M.; Liu, T.; Xie, D.; Zhang, Y. Study on Monitoring System for Partial Discharge of Electrical Equipment. Telkomnika 2014, 12, 1053–1059. [Google Scholar] [CrossRef]
  11. Alrumayan, F.; Cotton, I.; Nelms, A. Partial Discharge Testing of Aerospace Electrical Systems. IEEE Trans. Aerosp. Electron. Syst. 2010, 46, 848–863. [Google Scholar] [CrossRef]
  12. Tang, J.; Wu, J.; Zhuo, R.; Xie, Y. Relationship Between VHF Signals and Discharge Magnitude of Partial Discharge from Needle Plate Electrode. High Volt. Eng. 2010, 36, 1083–1089. [Google Scholar]
  13. Ren, M.; Song, B.; Zhuang, T.; Yang, S. Optical partial discharge diagnostic in SF6 gas insulated system via multi-spectral detection. ISA Trans. 2018, 75, 247–257. [Google Scholar] [CrossRef]
  14. Yuan, Z.; Ye, Q.; Wang, Y.; Guo, Z. State Recognition of Surface Discharges by Visible Images and Machine Learning. IEEE Trans. Instrum. Meas. 2021, 70, 5004511. [Google Scholar] [CrossRef]
  15. Guo, Z.; Ye, Q.; Wang, Y.; Han, M. Study of the Development of Negative DC Corona Discharges on the Basis of Visible Digital Images. IEEE Trans. Plasma Sci. 2020, 48, 2509–2514. [Google Scholar] [CrossRef]
  16. Guo, Z.; Ye, Q.; Wang, Y.; Yuan, Z.; Wang, M. Colorimetric Method for Discharge Status Diagnostics Based on Optical Spectroscopy and Digital Images. IEEE Sens. J. 2020, 20, 9427–9436. [Google Scholar] [CrossRef]
  17. Riba, J.-R. Application of Image Sensors to Detect and Locate Electrical Discharges: A Review. Sensors 2022, 22, 5886. [Google Scholar] [CrossRef]
  18. Wang, Y.; Li, X.; Guo, Z.; Hu, J.; Ye, Q. Discharge status diagnosis based on chromaticity coordinates. Appl. Opt. 2021, 60, 4245–4250. [Google Scholar] [CrossRef]
  19. Xia, C.; Ren, M.; Chen, R.; Yu, J.; Li, C.; Chen, Y.; Wang, K.; Wang, S.; Dong, M. Multispectral Optical Partial Discharge Detection, Recognition, and Assessment. IEEE Trans. Instrum. Meas. 2022, 71, 7002911. [Google Scholar] [CrossRef]
  20. Guo, Q.; Xie, F.; Huang, X.; Zhang, C.; Li, M.; Yan, Y.; Wang, T.; Zheng, L. Different Electrodes Partial Discharge Detections via Fluorescent Fiber. In Proceedings of the Asia Communications and Photonics Conference 2021, Shanghai, China, 24–27 October 2021. [Google Scholar] [CrossRef]
  21. Wang, T.; Cheng, Y.; Xu, C.; Zheng, L.; Zhang, C.; Yan, Y.; Guo, Q.; Peng, G. YAG:Yb crystal fiber sensor for partial discharge. In Proceedings of the SPIE 12321, Advanced Sensor Systems and Applications XII, Online, 19 December 2022. [Google Scholar] [CrossRef]
  22. Guo, Q.; Huang, X.; Cheng, Y.; Wang, T.; Zheng, L.; Xu, C.; Zhang, C.; Peng, G. Localization of Partial Discharge Using All-Fiber System Based on Crystal Fluorescent Fiber. IEEE Sens. J. 2022, 22, 21699–21705. [Google Scholar] [CrossRef]
  23. Steinfeld, J. Molecules and Radiation: An Introduction to Modern Molecular Spectroscopy, 2nd ed.; Courier Corporation: New York, NY, USA, 2012; pp. 262–285. [Google Scholar]
  24. Herzberg, G.; Herzberg, L. Rotation-Vibration Spectra of Diatomic and Simple Polyatomic Molecules with Long Absorbing PathsXI. The Spectrum of Carbon Dioxide (CO2) below 1.25μ*. J. Opt. Soc. Am. 1953, 43, 1037–1044. [Google Scholar] [CrossRef]
  25. Kozioł, M.; Boczar, T.; Nagi, Ł. Identification of electrical discharge forms, generated in insulating oil, using the optical spectrophotometry method. IET Sci. Meas. Technol. 2019, 13, 416–425. [Google Scholar] [CrossRef]
  26. Zhao, W.; Zhang, X.; Jiang, J. Tip to plane Corona discharge spectroscopic analysis. Spectrosc. Spect. Anal. 2003, 23, 955–957. [Google Scholar]
  27. Riba, J.-R. Spectrum of Corona Discharges and Electric Arcs in Air under Aeronautical Pressure Conditions. Aerospace 2022, 9, 524. [Google Scholar] [CrossRef]
  28. Nagi, Ł.; Kozioł, M.; Zygarlicki, J. Comparative Analysis of Optical Radiation Emitted by Electric Arc Generated at AC and DC Voltage. Energies 2020, 13, 5137. [Google Scholar] [CrossRef]
  29. Zhao, Y.; Li, Y.; Li, K.; Han, D.; Qiu, Z.; Zhang, G. Emission Spectrum Analysis of Two Typical Partial Discharge Forms Under High Frequency Square Wave Voltages. IEEE Access 2020, 8, 219946–219954. [Google Scholar] [CrossRef]
  30. Wang, J.; Yuan, P.; Guo, F.; Qie, X.; Ouyang, Y.; Zhang, Y. The spectra and temperature of cloud lightning discharge channel. Sci. China Ser. D 2009, 52, 907–912. [Google Scholar] [CrossRef]
  31. Kalynova, G.; Kalynov, Y.; Savilov, A. Prospects for the Implementation of an Intense Source of Ultraviolet Radiation Based on a Gas-Discharge Plasma in a Quasi-Optical Cavity Excited by a Pulse of Terahertz Radiation. Photonics 2023, 10, 440. [Google Scholar] [CrossRef]
  32. Suchard, S.N.; Melzer, J.E. Spectroscopic Data: Volume 2 Homonuclear Diatomic Molecules, 2nd ed.; Springer Science & Business Media: Berlin, Germany, 2013; pp. 435–463. [Google Scholar]
  33. Choi, J.H.; Lee, T.I.; Han, I.; Baik, H.K.; Song, K.M.; Lim, Y.S.; Lee, E.S. Investigation of the transition between glow and streamer discharges in atmospheric air. Plasma Sources Sci. Technol. 2006, 15, 416. [Google Scholar] [CrossRef]
  34. Šimek, M. Optical diagnostics of streamer discharges in atmospheric gases. J. Phys. D 2014, 47, 463001. [Google Scholar] [CrossRef]
  35. Li, C.; Ebert, U.; Hundsdorfer, W. Spatially hybrid computations for streamer discharges with generic features of pulled fronts: I. Planar fronts. J. Comput. Phys. 2010, 229, 200–220. [Google Scholar] [CrossRef] [Green Version]
  36. Lieberman, M.A.; Lichtenberg, A.J. Principles of Plasma Discharges and Materials Processing; Wiley: New York, NY, USA, 2005; pp. 535–569. [Google Scholar] [CrossRef] [Green Version]
  37. Callender, G.; Golosnoy, I.O.; Rapisarda, P.; Lewin, P.L. Critical analysis of partial discharge dynamics in air filled spherical voids. J. Phys. D 2018, 51, 125601. [Google Scholar] [CrossRef] [Green Version]
  38. Murphy, B.T.; Hebner, R.E.; Kelley, E.F. Simulating mode transitions during breakdown in liquids. IEEE Trans. Dielectr. Electr. Insul. 2011, 18, 682–691. [Google Scholar] [CrossRef] [Green Version]
Figure 1. System schematic diagram of the PD spectrum experimental device. (a) Sphere-Sphere; (b) Needle-Sphere.
Photonics 10 00788 g001
Figure 2. Corona and electrical breakdown in the experiment: (a) the phenomenon of purple corona layer, (b) bright electrical breakdown channel.
Photonics 10 00788 g002
Figure 3. Two-dimensional axisymmetric grid generation and boundary: (a) SSED simulation model, (b) NSED simulation model.
Photonics 10 00788 g003
Figure 4. Spectrum near the needle electrode in corona discharge stage in NSED.
Photonics 10 00788 g004
Figure 5. (a) Spatial spectrum between electrodes in the SSED breakdown stage. (b) Spectra at two electric extremes.
Photonics 10 00788 g005
Figure 6. (a) Spatial spectrum between electrodes in the NSED breakdown stage. (b) Spectra at two electric extremes.
Photonics 10 00788 g006
Figure 7. Spatial distribution of electron density with time under SSED simulation.
Photonics 10 00788 g007
Figure 8. Spatial distribution of electron density with time under NSED simulation.
Photonics 10 00788 g008
Figure 9. (a) The axial electron density distribution curve with time under SSED simulation. (b) Distribution curve of axial electron density with time under NSED simulation.
Photonics 10 00788 g009
Figure 10. (a) The anti-axial electron potential variation with time under SSED simulation. (b) Variation curves of anti-axial electron potential with time under NSED simulation.
Photonics 10 00788 g010
Table 1. Performance Parameters of the QEP02617 spectrograph.
NameTypical Parameter
Resolution/nm1.2
Spectral response range/nm195 to 1000
Peak quantum efficiency90%
DetectorBack-thinned, TE Cooled, 1024 × 58 element CCD array
Integration time/s8 × 10−3 to 3600
Signal-to-noise ratio1000:1 (Single acquisition)
Disclaimer/Publisher’s Note: The statements, opinions and data contained in all publications are solely those of the individual author(s) and contributor(s) and not of MDPI and/or the editor(s). MDPI and/or the editor(s) disclaim responsibility for any injury to people or property resulting from any ideas, methods, instructions or products referred to in the content.

