Article

A Method for Obtaining Optical Properties of Two-Layer Tissue such as Thin-Skinned Fruits by Using Spatial Frequency Domain Imaging

1
School of Information Science and Engineering, Zhejiang Sci-Tech University, Hangzhou 310018, China
2
Zhejiang Main Laboratory of Planting Equipment Technology, Hangzhou 310018, China
*
Author to whom correspondence should be addressed.
Photonics 2023, 10(6), 622; https://doi.org/10.3390/photonics10060622
Submission received: 6 April 2023 / Revised: 10 May 2023 / Accepted: 24 May 2023 / Published: 28 May 2023

Abstract

:
As a new imaging inspection method with characteristics of a wide view field and non-contact, spatial frequency domain imaging (SFDI) is very suitable to evaluate the optical properties of agricultural products to ensure the sustainable development of agriculture. However, due to the unique forward scattering characteristics of fruit skin, only a few photons can return to the skin surface after interacting with the flesh, thus affecting the detection accuracy of the flesh layer. This study aims to propose a more accurate and wider applicable method to extract the optical properties of two-layer tissue from SFDI measurements. Firstly, a two-layer model was proposed by optimizing the reflectivity of the flesh layer through the optical properties and thickness of the skin layer. Secondly, the influence of the optical properties and thickness of different skin layers on the reflectivity optimization of the flesh layer was investigated by a Monte Carlo simulation, and then, the accuracy and effectiveness of the proposed model was evaluated for practical inspection by phantom experiments. Finally, this model was used to obtain the optical properties, layer by layer, of four thin-skinned fruits (pear, apple, peach and muskmelon) to verify its universality. The results showed that, for the skin layer, the average errors of the absorption coefficient (μa1) and the reduced scattering coefficient (μs1) were 10.87% and 7.91%, respectively, and for the flesh layer, the average errors of the absorption coefficient (μa2) and the reduced scattering coefficient (μs2) were 16.76% and 8.64%, respectively. This study provides the basis for the SFDI detection of optical properties of two-layer tissue such as thin-skinned fruits, which can be further used for nondestructive fruit quality evaluations.

1. Introduction

In the past decades of research on biological tissue optics, it has been shown that the optical properties of tissues can be used to characterize their structural and chemical properties. The reduced scattering coefficient (μs) and the absorption coefficient (μa) are two mainly involved parameters [1]. This provides a new path for fruit quality detection to promote the sustainable development of the fruit industry, such as apple quality parameters measurements [2], fruits’ subsurface bruises detection [3], peaches’ multiple-quality attributes assessment [4], etc. In recent years, spatial frequency domain imaging (SFDI) has been noticed by a large number of researchers due to its fast imaging, wide field of view and no contact characteristics. With the development of this technique, some researchers have also started to apply this technique to fruits’ optical properties detection.
In the beginning, researchers usually regarded fruits as a homogeneous signal-layer medium in order to simplify the problem [5,6,7]. However, actually, lots of fruits are composed of a skin layer and flesh layer. The two layers usually have different optical properties due to different internal physical structures and chemical compositions. If the effects of the skin layer are ignored, it may lead to a significant reduction in the detection accuracy. Therefore, stratified research of fruit tissue was considered by researchers, which means to detect the optical properties of the skin layer and the flesh layer, respectively.
Two-layer models, as well as multi-layer models, used in the biomedical field were adopted at first, but most of these models are point models through the photon migration theory [6,8,9]. Hu et al. [10] proposed a two-step method to detect apple samples. Their method used a single-layer model to obtain the optical property parameters in the skin layer at first, then improved the accuracy of the optical property parameters of the skin layer by frequency optimization and, finally, used a two-layer model to obtain the optical property parameters of the flesh layer. Comparing the results of Hu’s study with those detected by using the single integrating sphere technique, it was found that Hu’s method still had a large error (22%) in estimating the flesh layer’s absorption coefficient (μa2). As we know, the single integrating sphere technique can only detect a certain detection point. Comparing the results from a wide field to spot results undoubtedly increases the error. Therefore, the optical properties verified or obtained by using point models and methods are only suitable for the detection point. It is undoubtedly contrary to the technical characteristics of the wide view field in SFDI.
Furthermore, the models used in the biomedical field were mostly modeled and verified based on human tissues. Unlike human skin tissue, the cell wall is the dominant scatterer in the fruit skin layer in general, while water is the dominant scatterer in the flesh layer. It makes the fruit skin tissue have strong forward scattering characteristics, which means that the reduced scattering coefficient of the fruit skin layer is much larger than that of the flesh layer [11]. Through scattering, the path of light in the skin layer, as well as the light interaction time with tissues, become longer. Therefore, only a small fraction of photons is able to return to the skin surface after they penetrate the skin to the flesh layer. The influence of the skin layer’s optical properties becomes the dominant factor for the change in optical image information.
With the research proceeded, Monte Carlo (MC) simulations were used to study the light transmission law inside fruit such as citrus and blueberry [12,13]. The results of these studies showed that MC simulation can not only be used to study the effects exerted by various layers of fruit but also to construct multi-layer models of corresponding fruits. However, due to the singleness of the research object, the results obtained by such models cannot be widely used in the optical properties detection of various fruits. Hu et al. [14] aggregated the optical properties of various fruits for MC simulations in order to study the effect of four parameters (the skin layer absorption coefficient μa1, the skin layer reduced scattering coefficient μs1, the flesh layer absorption coefficient μa2 and the flesh layer reduced scattering coefficient μs2) on the prediction of reflectance. They found that the sensitivity of μa2 and μs2 changes was very small and difficult to separate at all spatial frequencies. Therefore, to solve this problem, the model should not only focus on accuracy but also on universality.
This study aims to propose a more accurate and wider applicable method to extract the optical properties of two-layer tissue from SFDI measurements. The objectives of this research were to (1) propose a method to build a two-layer model, (2) build two-layer model by using MC simulation data, (3) evaluate the effectiveness and accuracy of the model through phantom experiments and (4) detect the skin and flesh layers’ optical properties of four kinds of thin-skinned fruits.

2. Materials and Methods

2.1. Theory and Model

The interaction between light and medium can be transformed into a Radiative Transfer Equation (RTE) [15], which is based on the law of energy conservation, when only energy change in the penetration depth of light z is considered. However, because of the number of variables in the equation, the solution of the equation is too complicated, so researchers have added some constraints to solve the equation, which can be reduced to a Diffusion Approximation Equation (DAE) [16]. The principle of SFDI is based on this approximate equation for estimating optical properties subsequently, and the equation can be transformed into the following form.
2 φ z μ a D φ z + 1 D S z = 0
The first term on the left side of the equation is the scattering contribution term, the second term is the attenuation term due to scattering and absorption and the third term S(z) is the light source contribution term. In Equation (1), D = 3 μ a + μ s - 1  is the diffusion coefficient. φ ( z ) is the fluence rate. The constraints to be satisfied by the equation are (1) the distance from the light source to the detector should be greater than the mean free range   ( mf p = 1 μ a + μ s ) , (2) the scattering of the medium must be much larger than the absorption μ s   > >   μ a and (3) the light source is approximated as each homogeneous radiation after entering the medium for scattering.

2.1.1. Extraction of Optical Properties of Single-Layer Tissues

The previous literature [17] gave a one-dimensional solution of the DAE for a homogeneous semi-infinite medium that was under structured illumination with the incident light power P0. Firstly, through the derivation of the planar photon density wave reflectance [18], the extended source S(z) in the surface of medium can be modeled as Equation (2).
S ( z ) = P 0 μ s exp μ tr z
where z is the penetration depth of light. μ tr = μ a + μ s is the transport coefficient. Then, S(z) is brought into Equation (1). Using the partial current boundary conditions [16], the diffuse reflectance model can be obtained, as shown in Equation (3).
R d f x = - A φ 0 P 0 = 3 A   a μ eff / μ tr + 1 μ eff / μ tr + 3 A
where μ eff = 3 μ a μ tr +   2 π f x 2 1 / 2 is the scalar attenuation coefficient, fx is the spatial frequency, A = 1   -   R eff 2 1 + R eff is the proportionality constant,   a = μ s / μ tr is the reduced albedo, R eff = 0 . 0636 n + 0 . 668 + 0 . 71 / n   -   1 . 44 / n 2 is the effective reflection coefficient and n is the refractive index. Finally, by using the Partial Least Squares Nonlinear (PLSN) fitting method, it is possible to invert the optical property parameters of the single-layer medium.

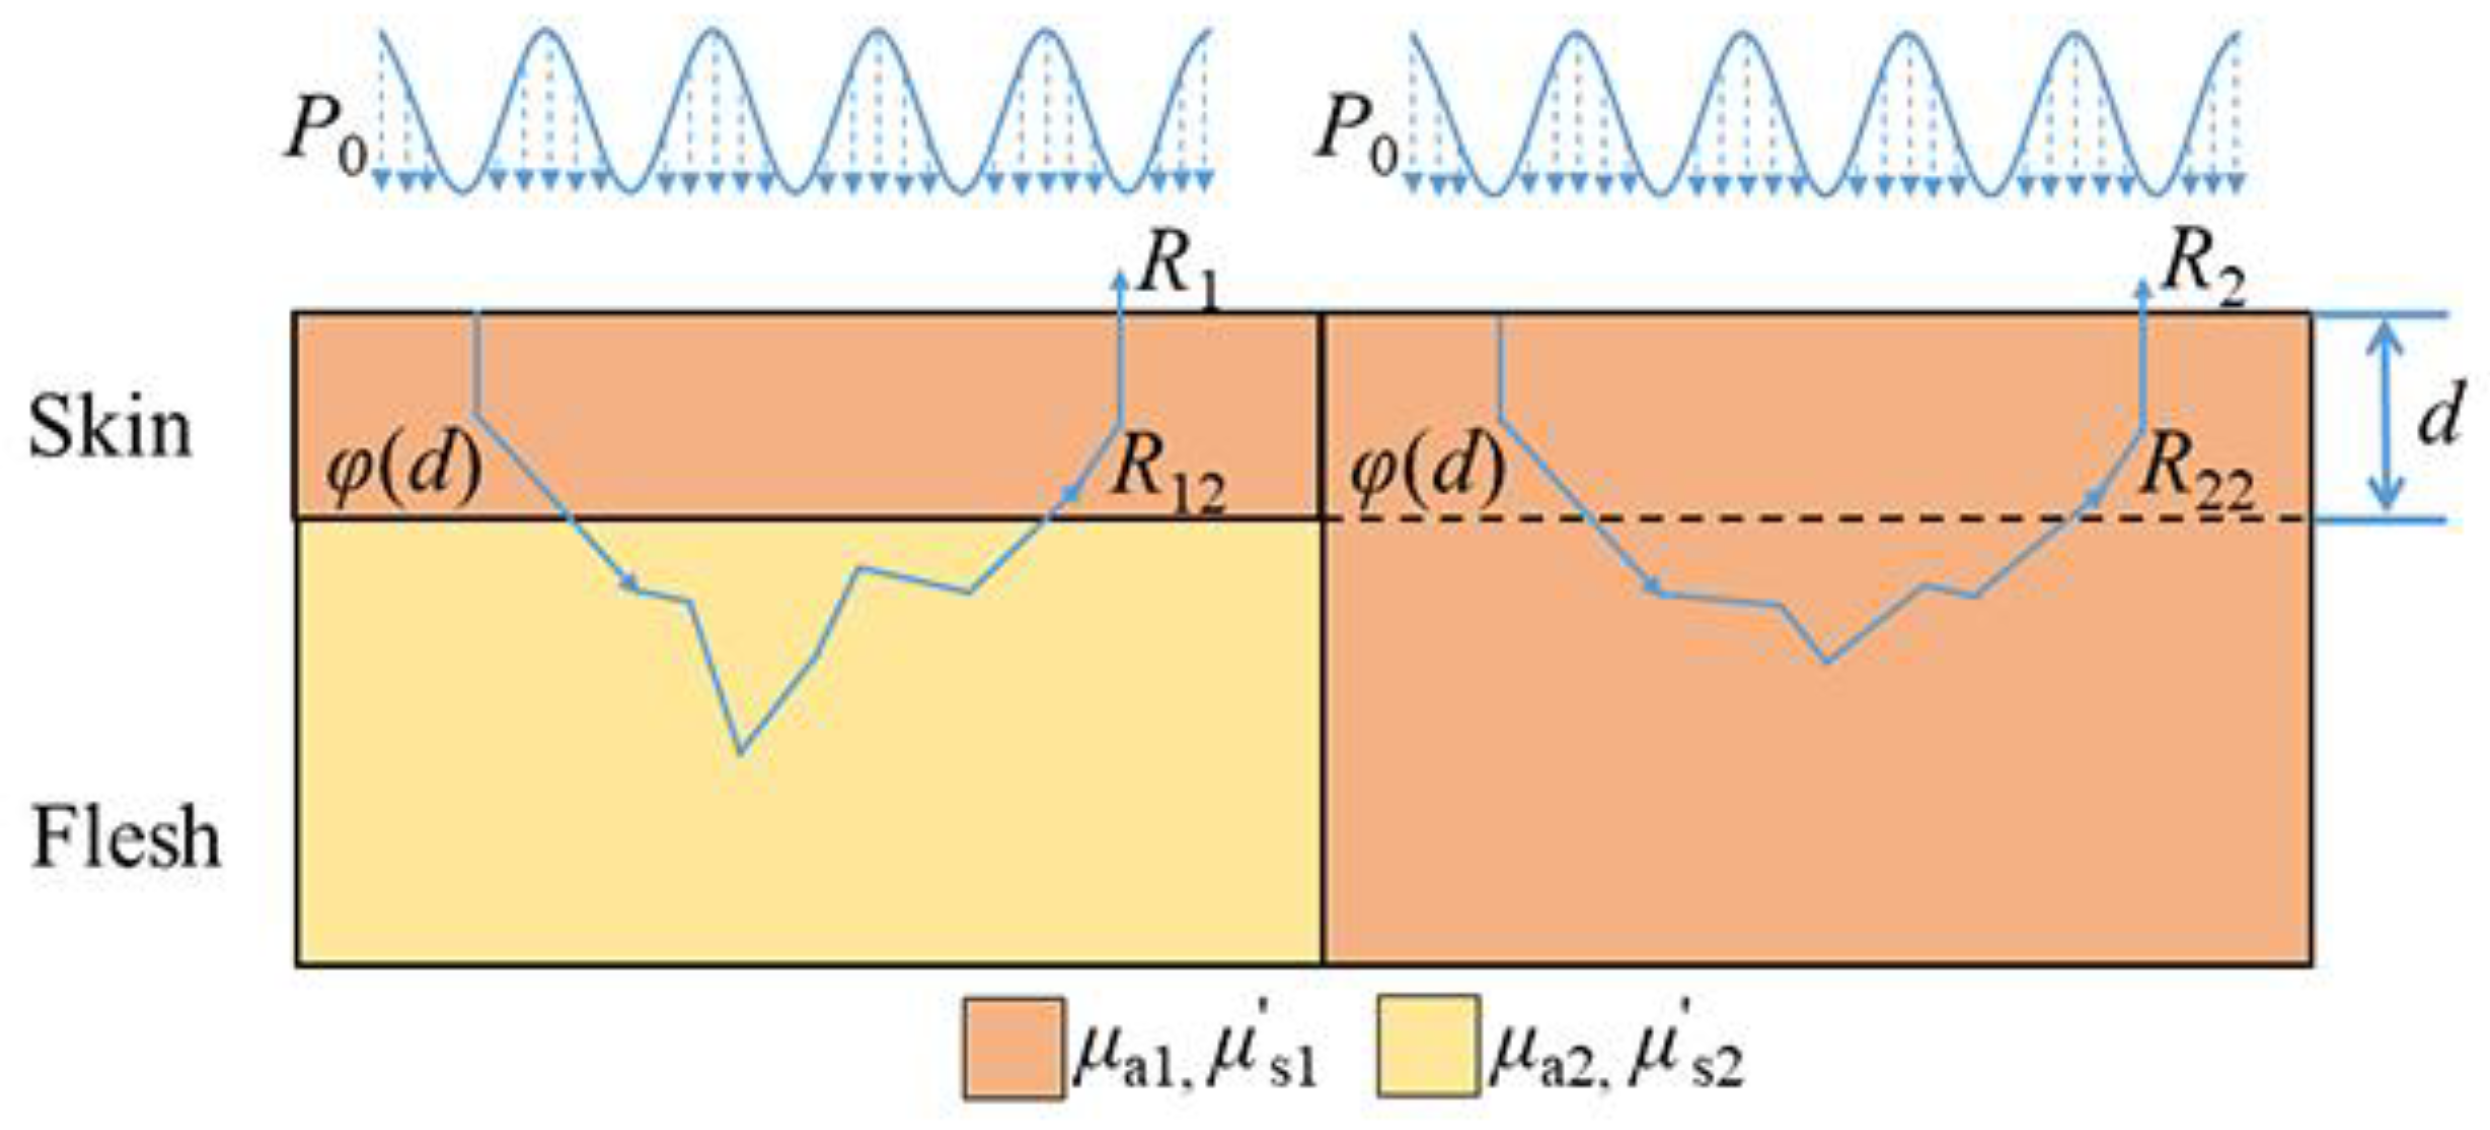
2.1.2. Extraction of Optical Properties of Two-Layer Tissues

Suppose that there are two homogeneous mediums, as shown in Figure 1. One is a single-layer medium of semi-infinite thickness, and the other is a two-layer medium (the thickness of the skin layer is d, and the flesh layer is semi-infinite). The single-layer medium has the same optical properties as the skin layer of the two-layer medium. A structured illumination with the incident light power P0 is used to irradiate the two mediums separately. When the penetration depth of the light is less than the thickness of the skin layer (z < d), the part of the two mediums interacting with light is the same, so they will acquire the same optical information. When the penetration depth is greater than the thickness of the skin layer (z > d), the flesh layer of the two mediums begins to show differences in the results of the light–medium interaction due to the different optical properties of the two mediums. According to the literature [14], it is known that the influence of the flesh layer optical properties changing on the total reflectance are far less than those of the skin layer optical properties changing. Assuming the second scattering and second absorption of light in the tissue are not considered, the amount of light energy loss in the skin layer of the two mediums is the same. Then, the difference in the total reflectance taken by the two mediums skin layers can be seen as the difference in flesh layers, which means   φ d · R 22   -   R 12 = P 0 · R 2   R 1 . φ(d) is the incident light power of the flesh layer. R1 and R2 are the total reflectance obtained from the surfaces of the two mediums, respectively. R12 and R22 are the reflectance obtained from the surfaces of the two mediums’ flesh layers, respectively.
From Equation (3), it can be seen that, when the incident energy in the flesh layer is P0, the reflectance of the two mediums’ flesh layers (Rflesh and R2) can be acquired by the single-layer model. Therefore, the results of the detection can be expressed by the reflectance of the two mediums with the following Equation (4).
R 2 R flesh R 2 R 1 = P 0 φ d R 22   R 12 φ d P 0 R 22   R 12 = P 0 φ d 2
For the two-layer medium, the optical properties of the flesh layer can be estimated from the skin layers’ optical properties and thickness. According to the low-pass filtering properties in biological tissues, the optical properties of the skin layer tissues can be obtained by high-frequency structured light. The reflectance of the flesh layer can be obtained from Equation (5) to invert its optical property parameters.
R flesh = R 2 P 0 φ d 2 ( R 2   R 1 )

2.2. Monte Carlo Simulation Experiment

It is evident from a large number of studies that a MC simulation is a very effective and accurate method to simulate the light transmission process within tissues [19]. The Monte Carlo Multi-Layered (MCML) program developed by Wang [20] was used to design MC simulation experiments for the two-layer model building. In the simulation, in order to increase the simulation rate without influencing the simulation accuracy, the tracking of 3 × 10⁶ photons was set in the MCML program [11,21]. The maximum radial depth was set to 50 mm to ensure that the sample satisfies the definition of semi-infinity. The spatial resolution of both the radial distance and depth was set to 0.1 mm. The average refractive indices and anisotropy coefficient were set to 1.35 and 0.7, respectively, to make the two-layer samples of the experiment more closely fit the real fruit [22,23]. The media between the illumination source and the surface of the two-layer sample was treated as air, with its refractive index of 1.0.
According to the literature [12,13,24], the optical property parameters range of fruits’ skin layer can be summarized as the absorption coefficients (0.001 mm−1 < μa1 < 0.1 mm−1), the reduced scattering coefficients (3.5 mm−1 < μs1 < 4.5 mm−1) and the thickness of the skin layer (0.1 mm < d < 2 mm). Therefore, 140 two-layer samples were prepared for the MC simulation. According to the reduced scattering coefficient of the skin layer, five gradients of 3.5, 3.8, 4.0, 4.2 and 4.5 mm−1 were set, respectively. According to the skin layer absorption coefficient, four gradients of 0.007, 0.06, 0.08 and 1.0 mm−1 were set, respectively, and according to the skin layer thickness, seven gradients of 0.1, 0.2, 0.4, 0.7, 1.0, 1.5 and 2.0 mm were set, respectively. In this simulation, the flesh layer’s optical property parameters μa2 and μs2 of all samples were set to 0.007 mm−1 and 1.5 mm−1, respectively. In this study, the reflectance of 140 double-layer samples obtained from the simulation in a low spatial frequency (0.4 mm−1–0.8 mm−1) was used to construct the coefficient model shown in Equation (4). Meanwhile, the study needed to use the skin layer optical property parameters to predict the reflectance of the flesh layer, so the parameters μa1, μs1 and d were also selected for investigating their effects on the coefficient model.

2.3. Phantom Experiment

In order to investigate the accuracy and effectiveness of the two-layer model in targeting real objects for detection, phantom experiments were designed and conducted. First, 25 single-layer phantoms were prepared to set up a 5 × 5 control experiment for system calibration and accuracy evaluation. Then, model validation was performed by preparing 10 two-layer phantoms.
In this study, solid optical phantoms were used for the experiments. India ink (Royal Talens, Apeldoorn, the Netherlands) and 20% lipid emulsion (Sichuan Guorui Pharmaceutical Co., Ltd., Leshan, China) were chosen as the absorbers and scatterers, respectively. Agarose has the same optical properties as cytosol [25,26], so agarose (Aladdin Biochemical Technology Corporation, Shanghai, China) was chosen as the substrate material. For the experiments, standard 50 mm × 50 mm × 50 mm acrylic containers (as shown in Figure 2b) were customized for shaping and carrying the optical phantoms, and the volume of the phantom was changed to control the skin layer thickness of the phantom.

2.3.1. Single-Layer Phantoms’ Preparation

For the single-layer solid phantoms’ preparation, the first step was to prepare the base material required for the optical phantoms. At first, 199 mL deionized water was taken into a beaker, and 1 g agarose was added to it, configuring a 0.5% volume concentration agarose solution. Then, it was put in bath water and heated to boiling to ensure that the agarose was fully dissolved. Secondly, a quantitative amount of India ink was added and stirred well; then, a portion of the solution was measured in a cuvette for the subsequent measurement of the optical property reference value. Thirdly, lipid emulsion was added into the ink mixture to make a total volume of 110 mL. The unconsolidated optical mimics were placed in an ultrasonic shaker (F-030S, Suzhou Maihong Electric Appliance Co., Ltd., Suzhou, China) for 30 s to mix the solution well. Then, a portion of the solution in the beaker was measured for the subsequent reference comparison of the optical properties. Finally, 100 mL homogeneous mixed solution was poured in the acrylic container and put in the freezer at −4 °C to cool for 20 min, and it was removed after solidification, as shown in Figure 2a. In this experiment, the μa reference value of the phantoms was obtained by using a spectrometer (QE65pro, Ocean Insight, Orlando, FL, USA) according to Beer Lambert’s law, and then, the μs reference value in the phantom of the same volumetric concentration was obtained from the reduced scattering coefficient in a pure solution of 20% lipid emulsion [27].

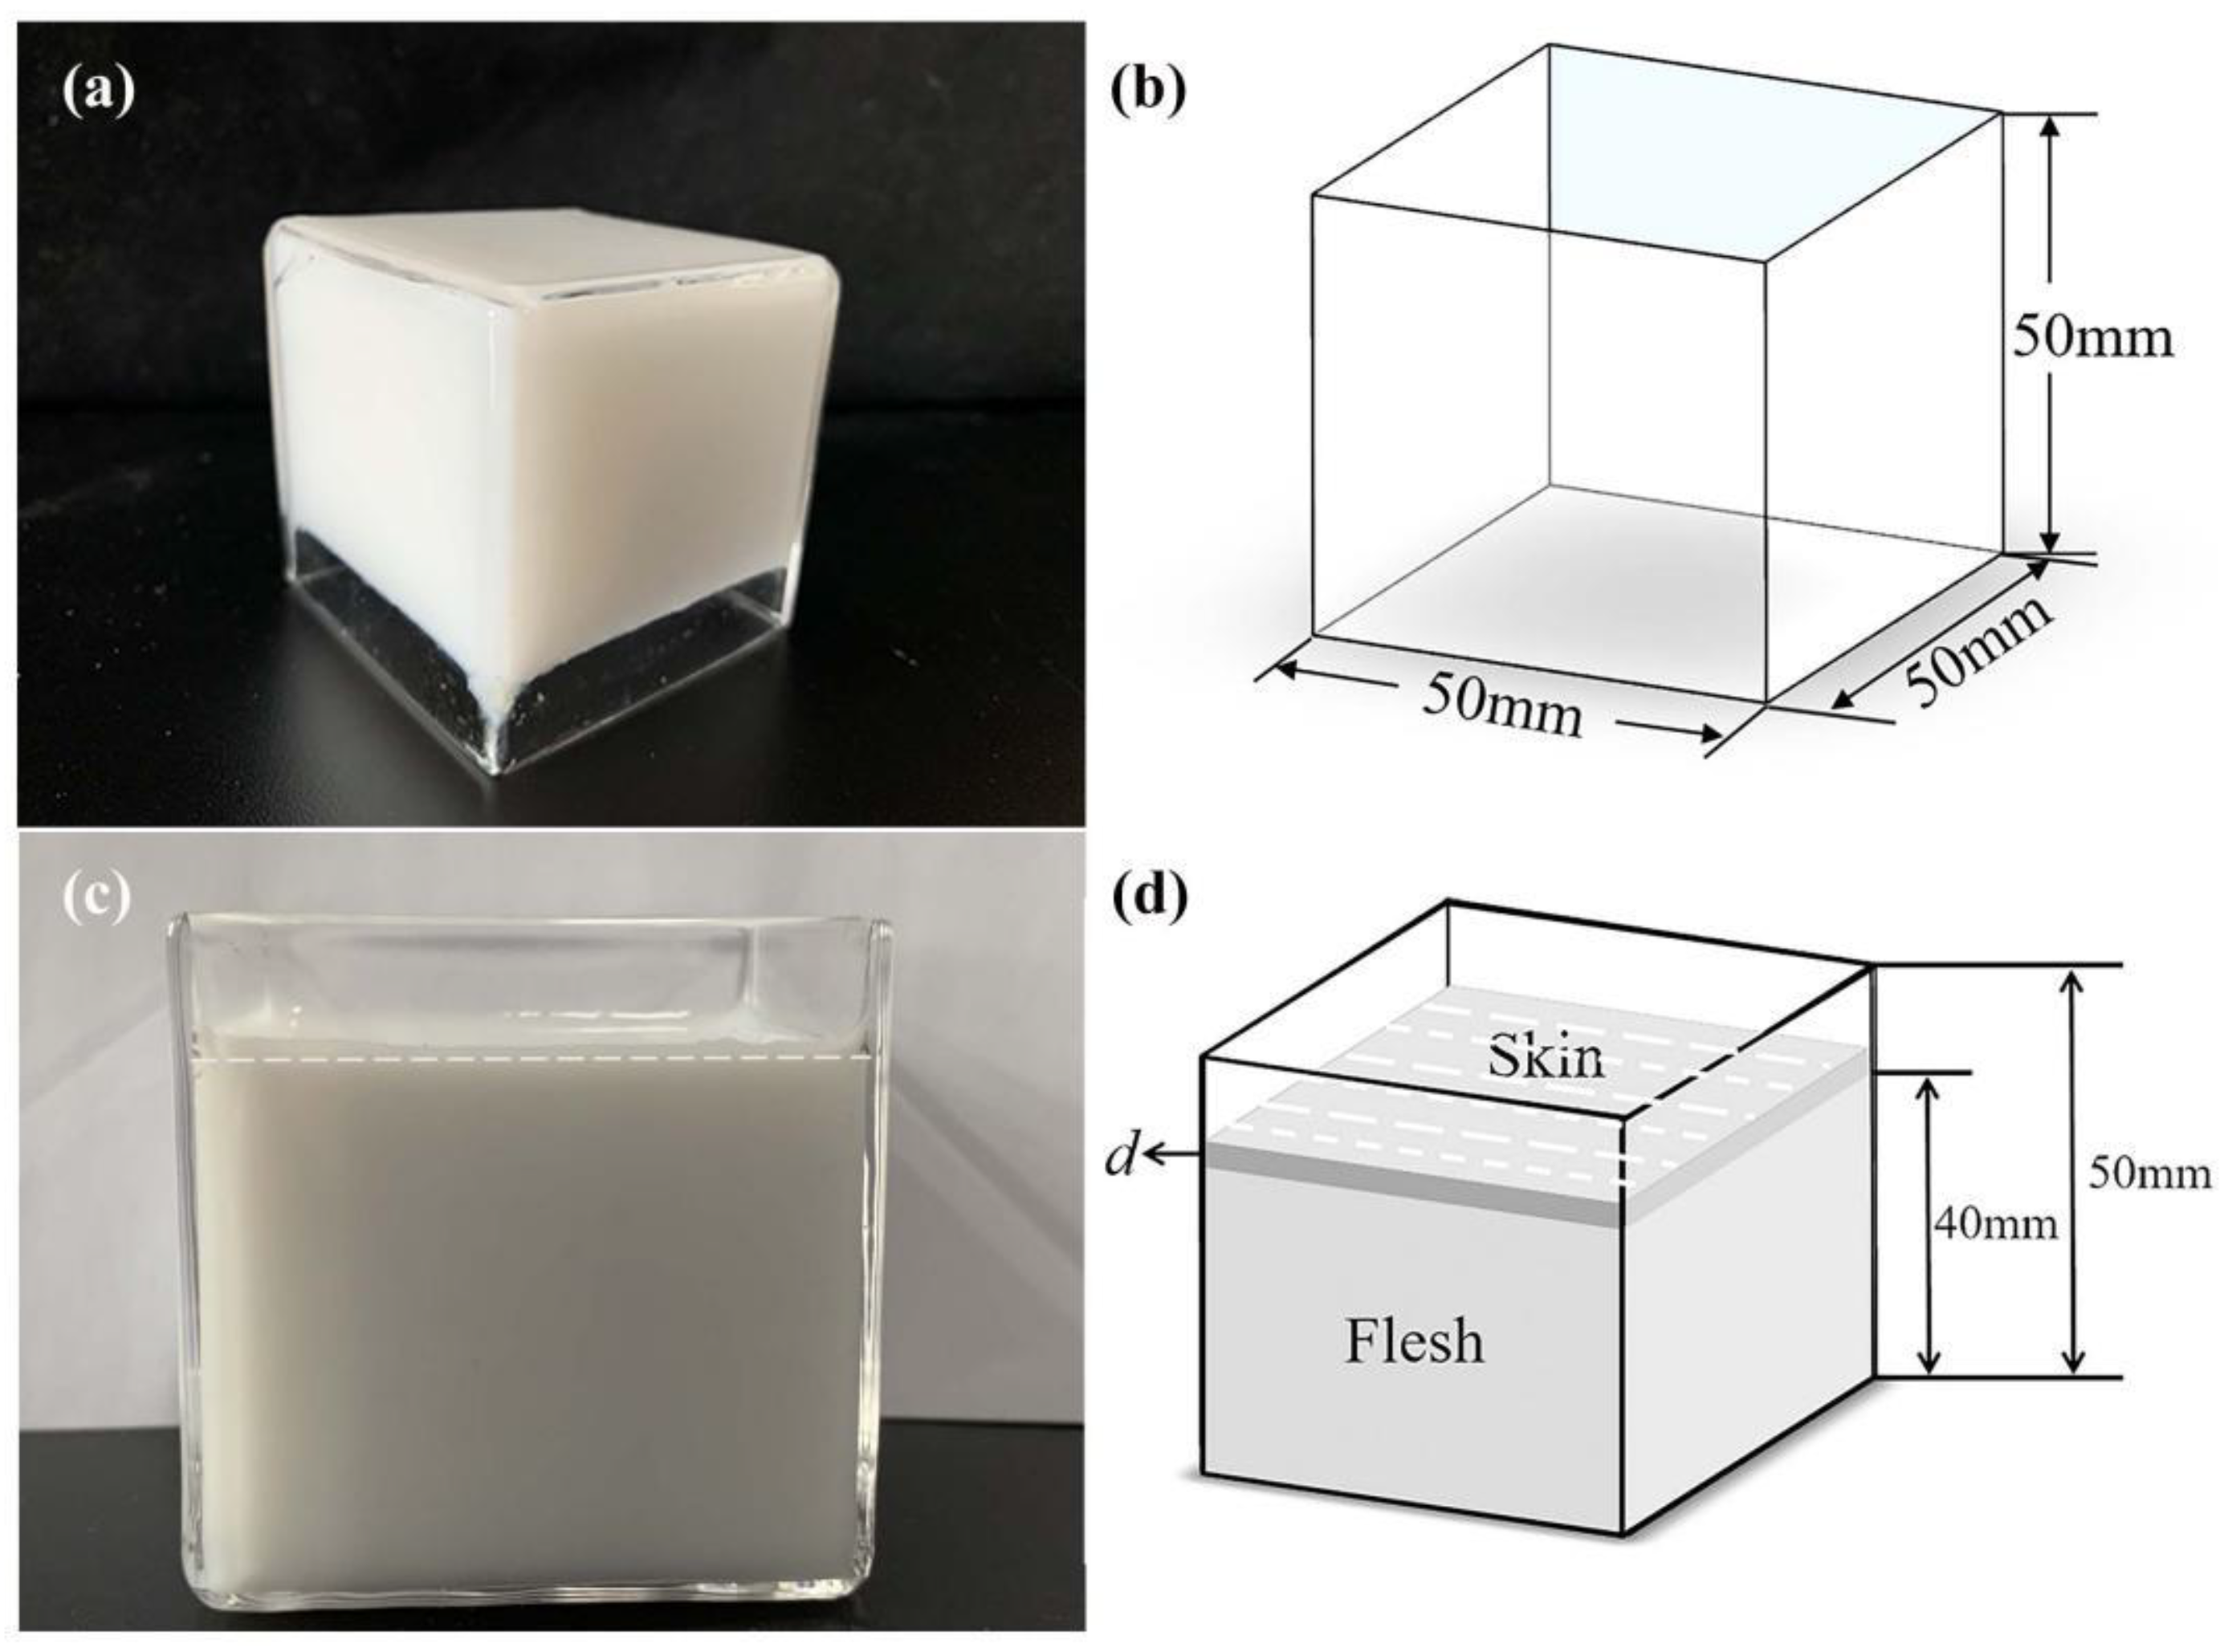
2.3.2. Two-Layer Phantoms Preparation

In this study, the two-layer optical phantoms were prepared by using a solid–liquid combination, which means that the solid phantom was used for the flesh layer and the liquid phantom for the skin layer. The preparation method can achieve precise control of the thickness of the skin layer and reduce the possibility of air generation between the two layers. Firstly, the bottom optical solid phantom was configured and set in a constant temperature water bath at 30℃, and then, the top optical liquid phantom was configured. The skin layer of the liquid phantom was slowly poured onto the flesh layer of the solid phantom to ensure that no air bubbles were generated.
In this study, 10 two-layer optical phantoms were prepared for the experiment to verify the accuracy and effectiveness of the proposed method. In order to provide the phantom with forward scattering characteristics as well, more scattering agent was added to the skin layer (liquid) of the optical phantom than the flesh layer (solid). For the thickness of the skin layer, 0.4 mm, 0.7 mm, 1.0 mm, 1.5 mm and 2 mm were chosen. The volume of the liquid phantom of the skin layer was controlled to ensure that the thickness of the skin layer phantom in this experiment could meet this constraint. In this experiment, the optical properties of each layer in the two-layer phantom preparation were also configured in accordance with the optical properties of the relevant fruit, and its configuration data are shown in Table 1.

2.4. Fruit Sample Experiment

In order to verify the effectiveness of the proposed method for piratical application, four kinds of thin-skinned fruits (‘Crown’ pear, ‘Golden Delicious’ apple, wild peach and white muskmelon) were detected. The fruit samples were purchased randomly from the local supermarket. The samples of the selected fruit varieties were large in size and had a clean surface without defects. The region of interest (ROI) with a size of 100 × 100 pixels was selected for demodulation to reduce the impact of the accuracy caused by the 3D shape. In the experiment, four different kinds of fruits were divided into four groups, and each group included five samples with different shapes and sizes. Figure 3a shows the flow of the whole experiment, starting with the image acquisition of the sample by the SFDI system introduced in Section 2.5. After the image collection was completed, each sample was sectioned, and then, the microstructure of the fruit skin and flesh were photographed by using an electron microscope (IX2-ILL100, OLYMPUS, Japan) in combination with a digital camera (DP70, OLYMPUS, Japan). The thicknesses of the skins were calculated by comparing the pixel size d1 with the actual size d2, d = 0 . 5   ×   d 1   /   d 2 , as shown in Figure 3b.

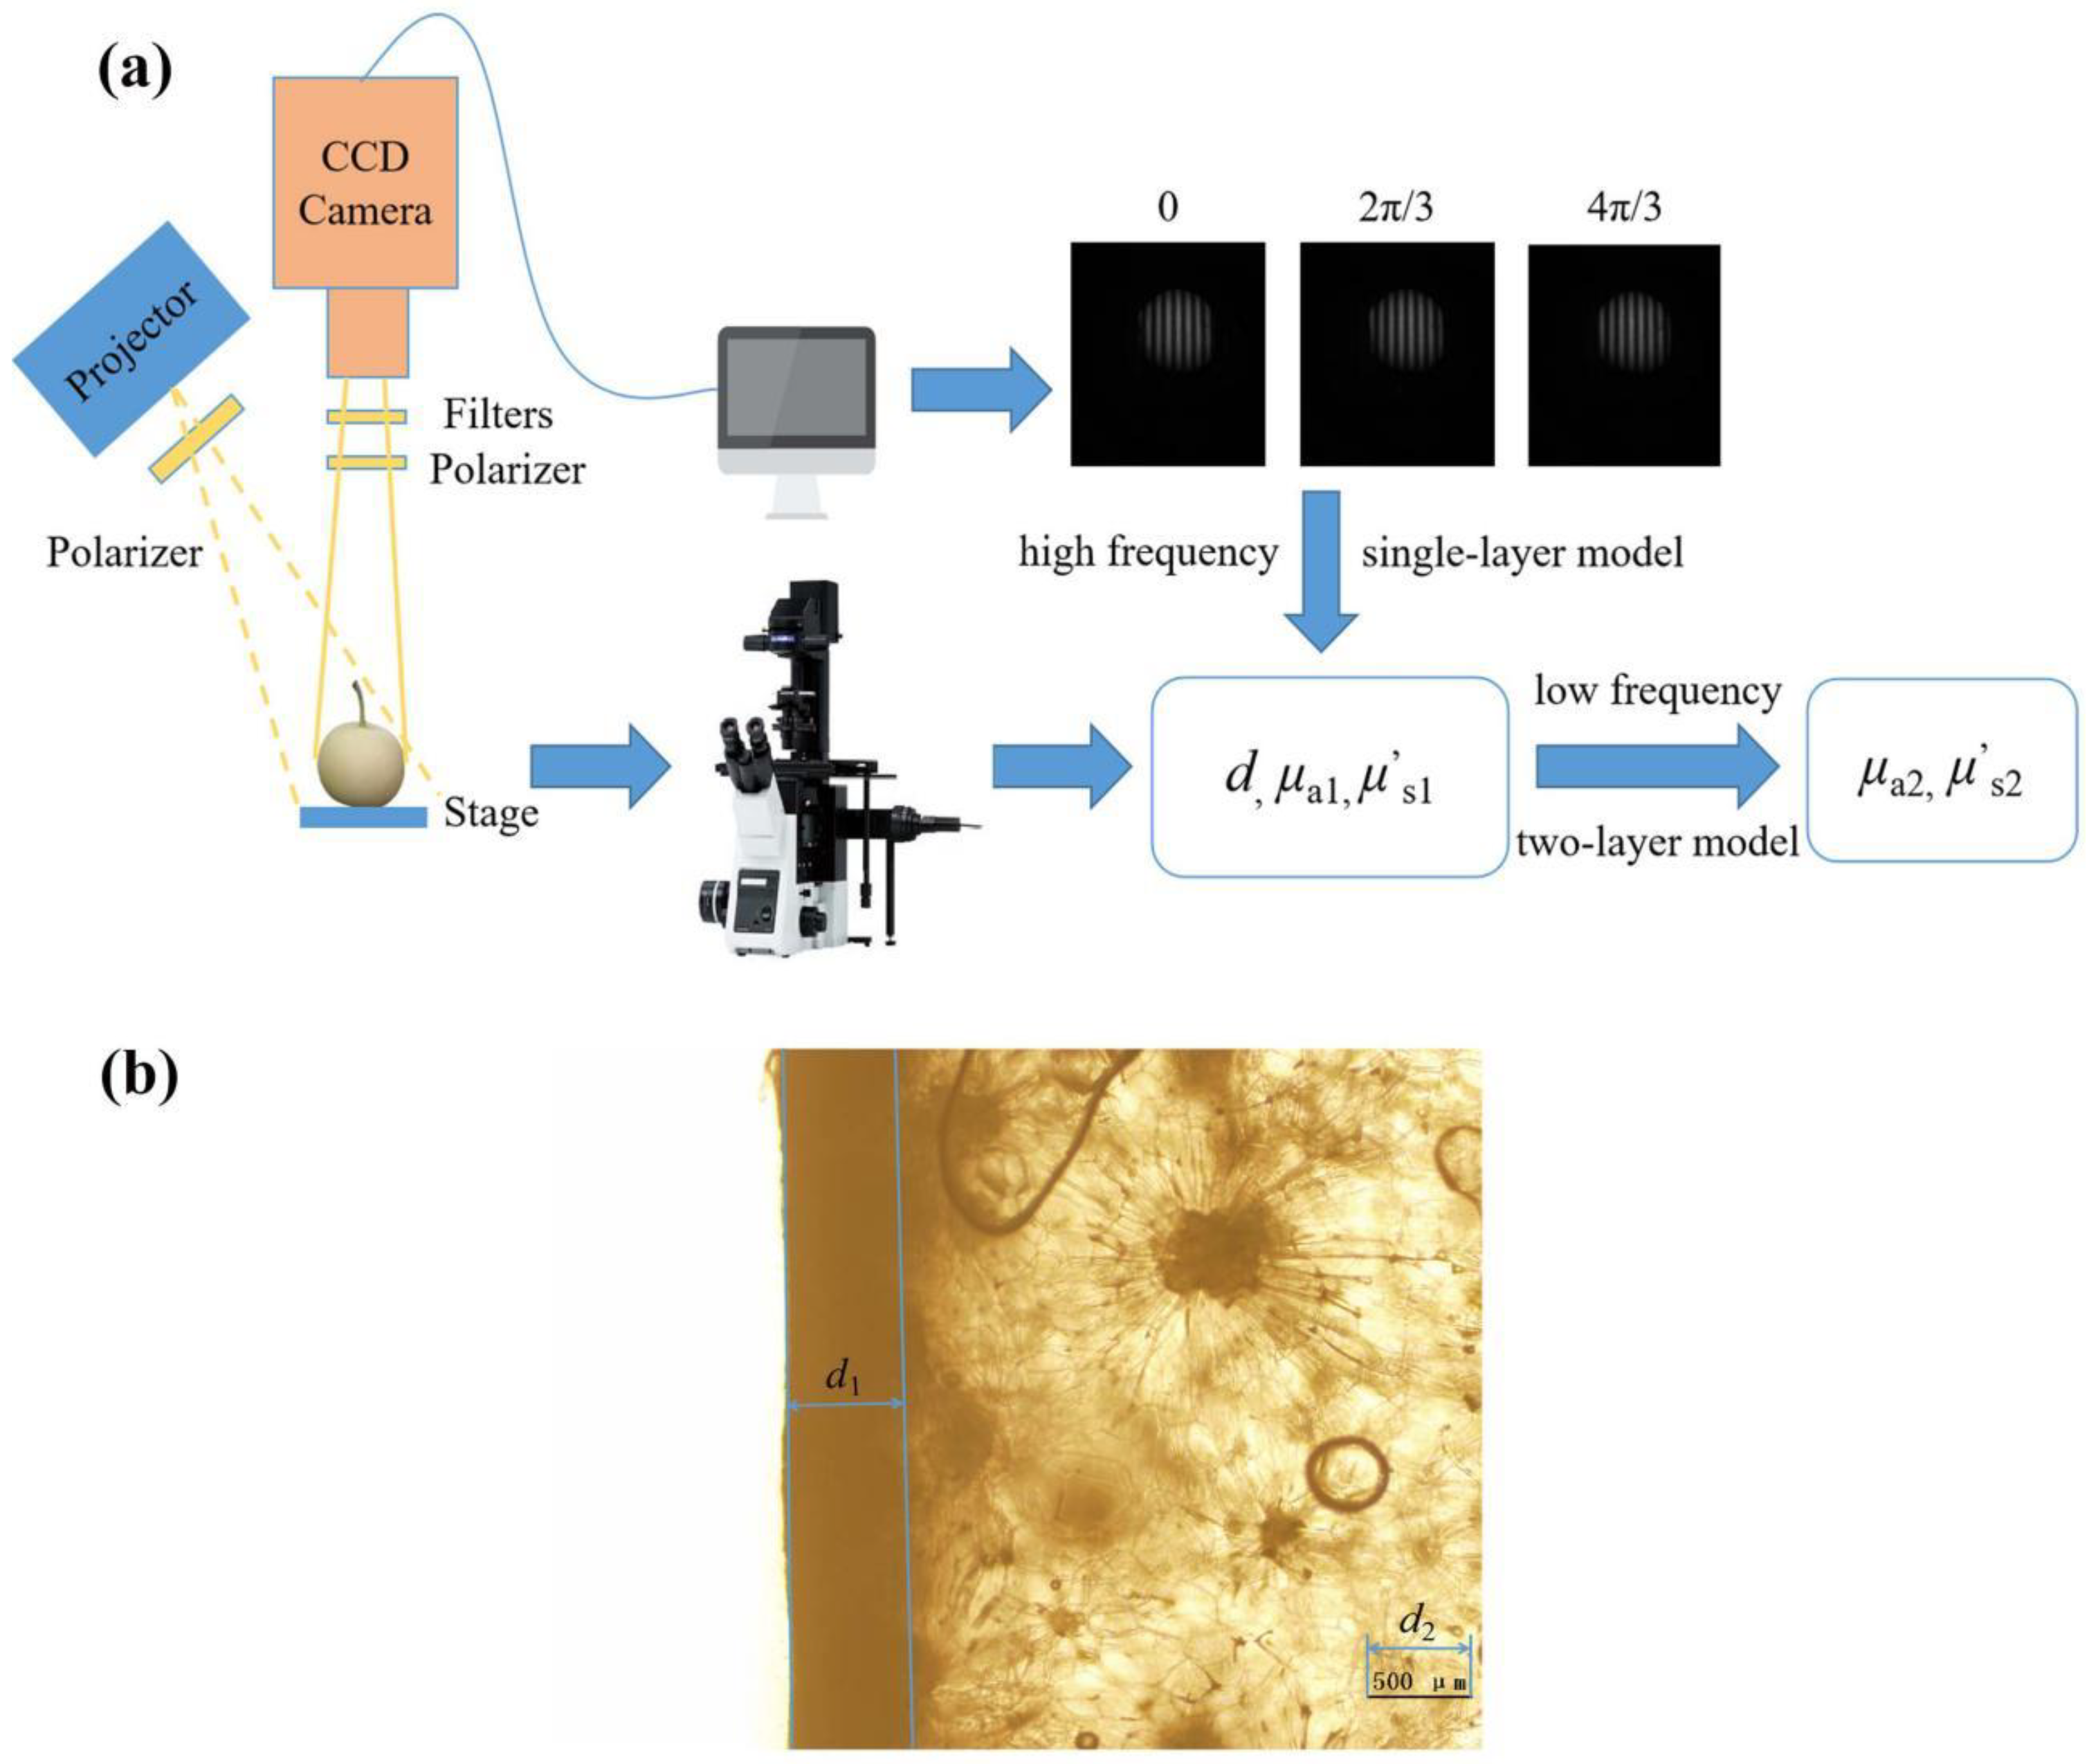
2.5. Instruments of Experiment

In this study, the system developed in our lab [28] mainly consists of (1) a 16-bit high-performance sCMOS (Iris 9TM, Photometrics, Inc., Tucson, AZ, USA) camera for image collection with an area array of 2960 × 2960 pixels. There is a large-diameter lens, a polarizer and a filter rotor fitted with six bandpass filters in front of the camera. The field of view is about 150 × 150 mm2. (2) A NEC projector (NEC NP-V302WC, NEC Corporation, Tokyo, Japan) without the color wheel as the light source, and there is a neutral density filter and polarizer in front of the projector. (3) A sample stage consisting of a horizontal displacement stage and a vertical displacement stage with a rangefinder. The distance between the camera and sample stage is adjustable (about 300 mm–400 mm). The horizontal displacement stage has a travel length of 300 mm, and the displacement resolution is 0.032 μm. The vertical displacement stage has a travel length of 55 mm, and the displacement resolution is 1 μm. The image acquisition part uses automatic image acquisition software developed based on LabVIEW. Before the sample image acquisition, a 0.97 standard diffuse reflection plate was used for light intensity correction. In the image analysis phase, the Curve Fitting toolbox integrated in MATLAB (2019(a)) was used to perform the subsequent processing of the MC simulation data and surface fitting. MATLAB was also used to program the acquisition of relevant optical property parameters.
In this study, all experiments were completed at 527 nm. In total, 20 spatial frequencies were used, with low frequencies of 0, 0.01, 0.02, 0.03, 0.04, 0.05, 0.06, 0.07, 0.08 and 0.09 mm−1 and high frequencies of 0.1, 0.2, 0.3, 0.4, 0.5, 0.6, 0.7, 0.8, 0.9 and 1.0 mm−1. After eliminating the frequencies with excessive fluctuations by using the frequency optimization method that Hu et al. [10] proposed in 2019, the frequencies used in the low-frequency part were 0, 0.04 and 0.08 mm−1 and, in the high-frequency part, were 0.2, 0.4, 0.6, 0.8 and 1.0 mm−1.

3. Results

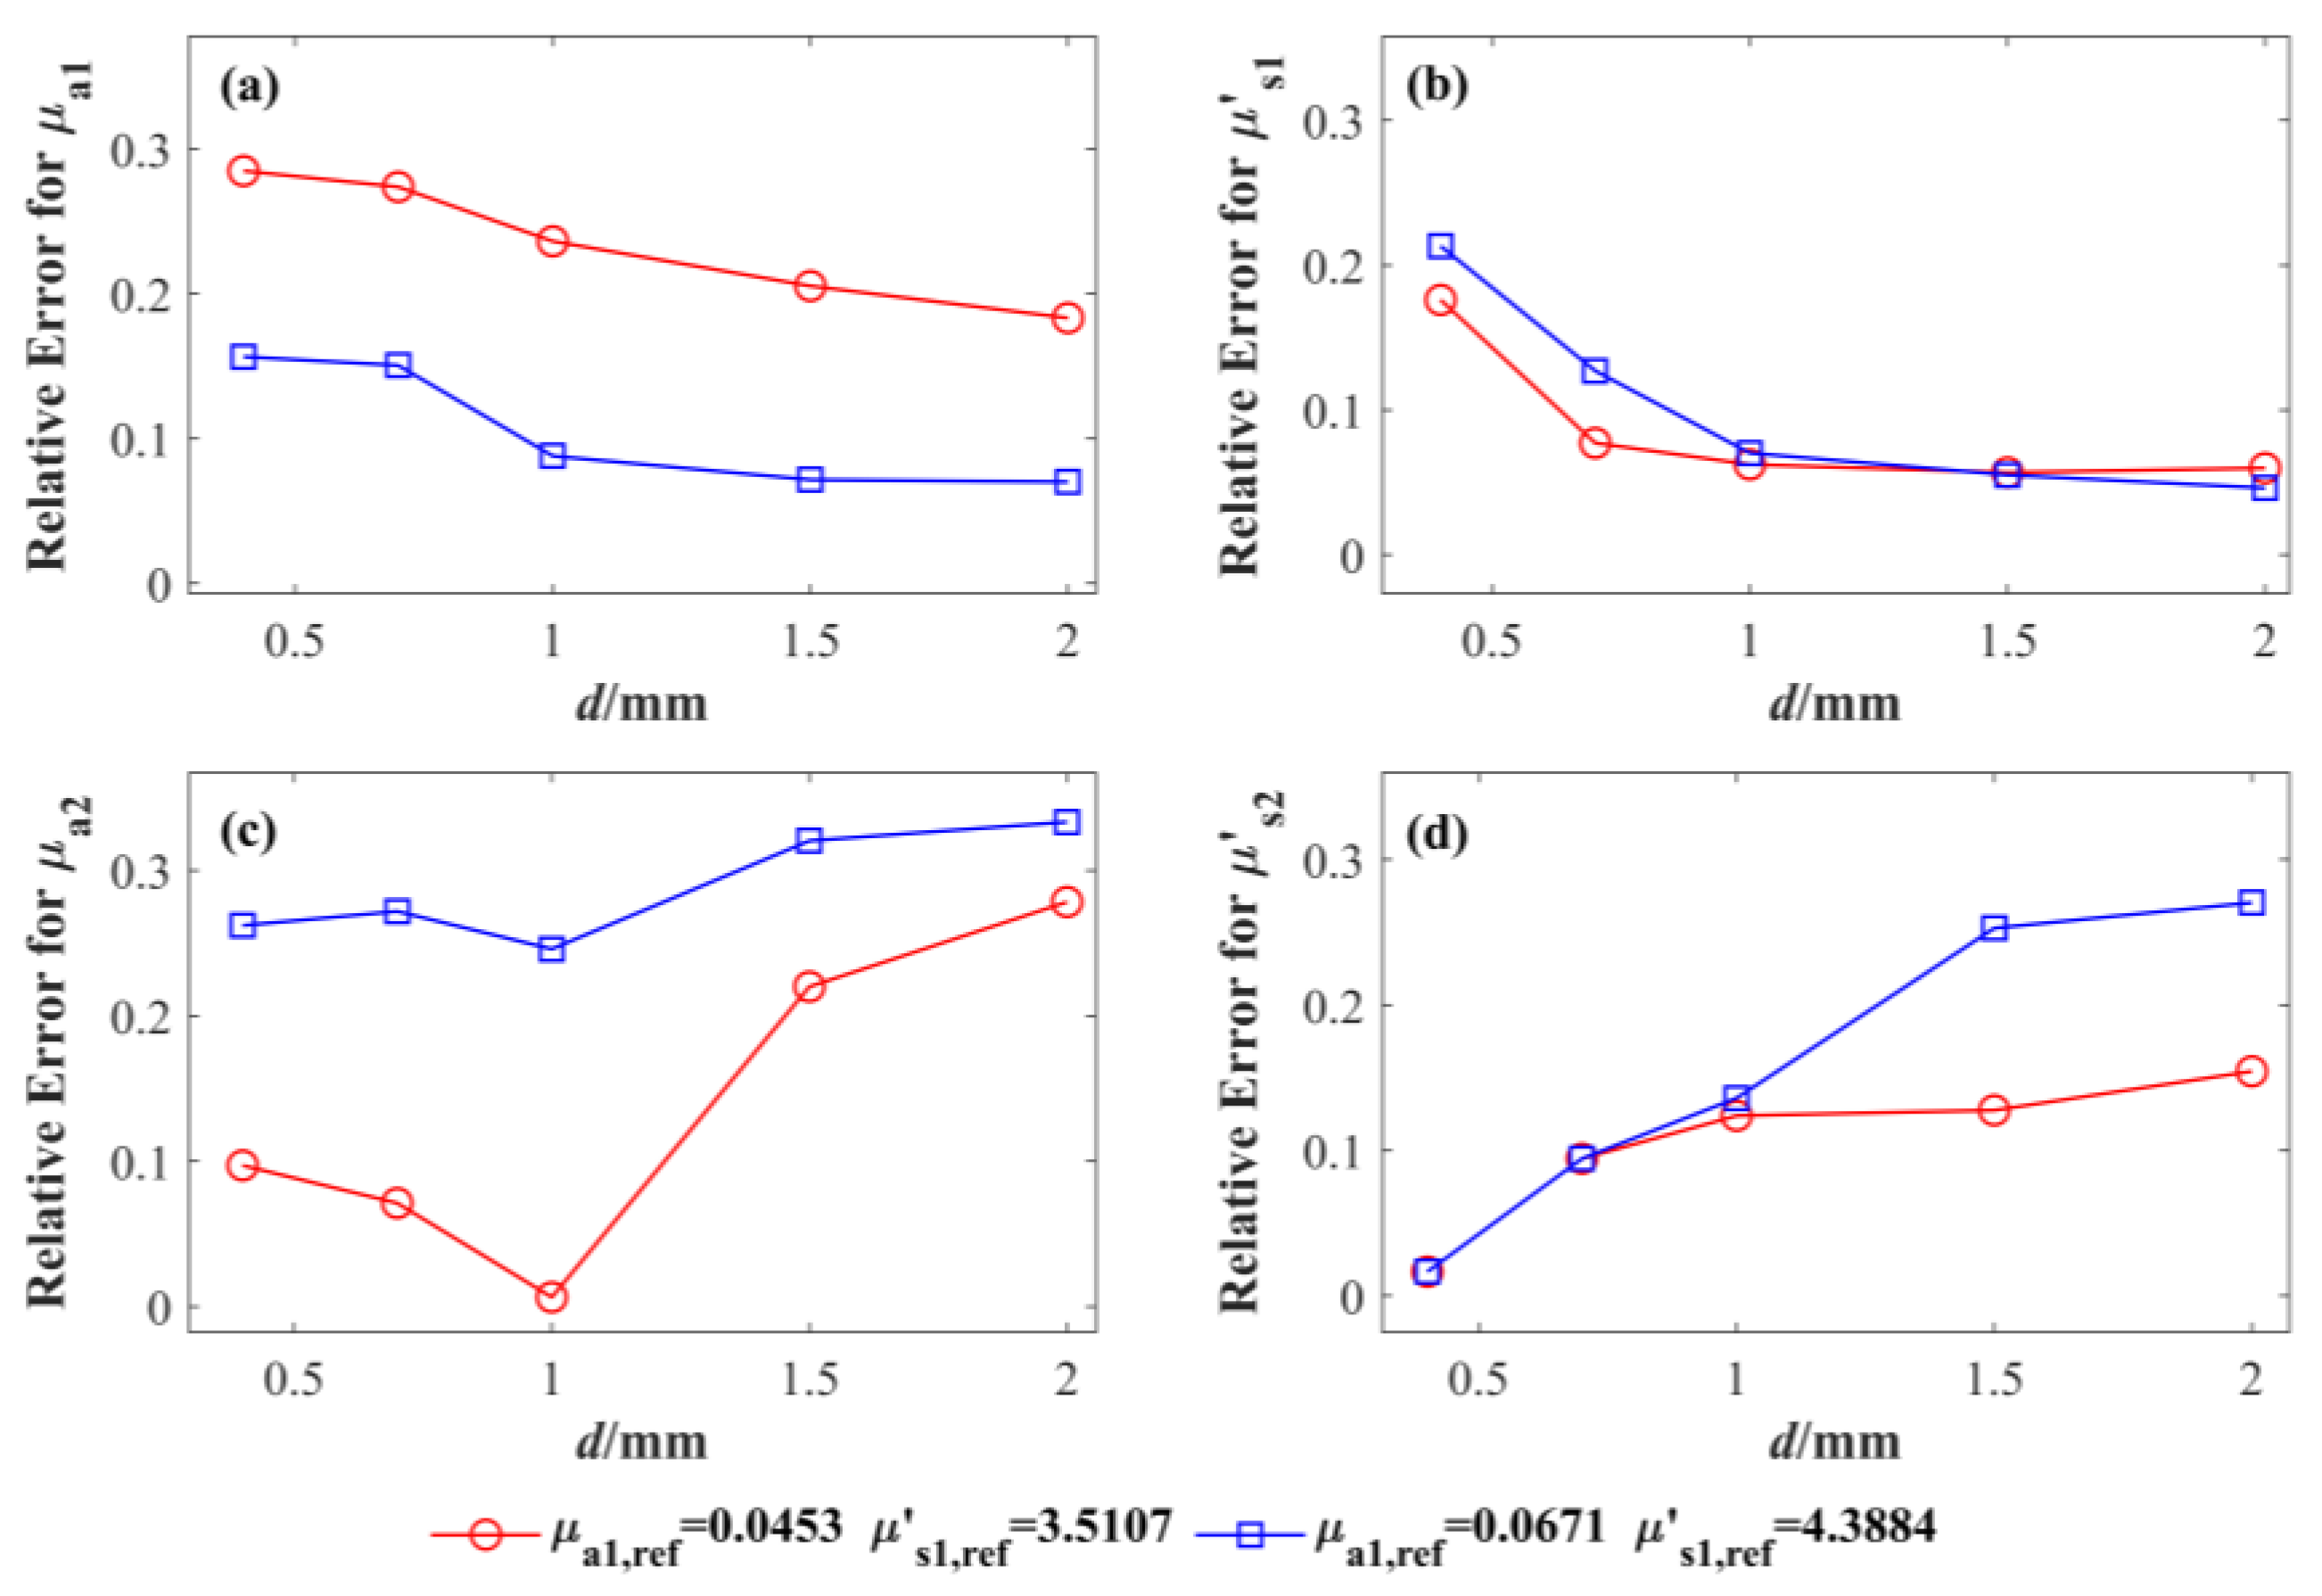
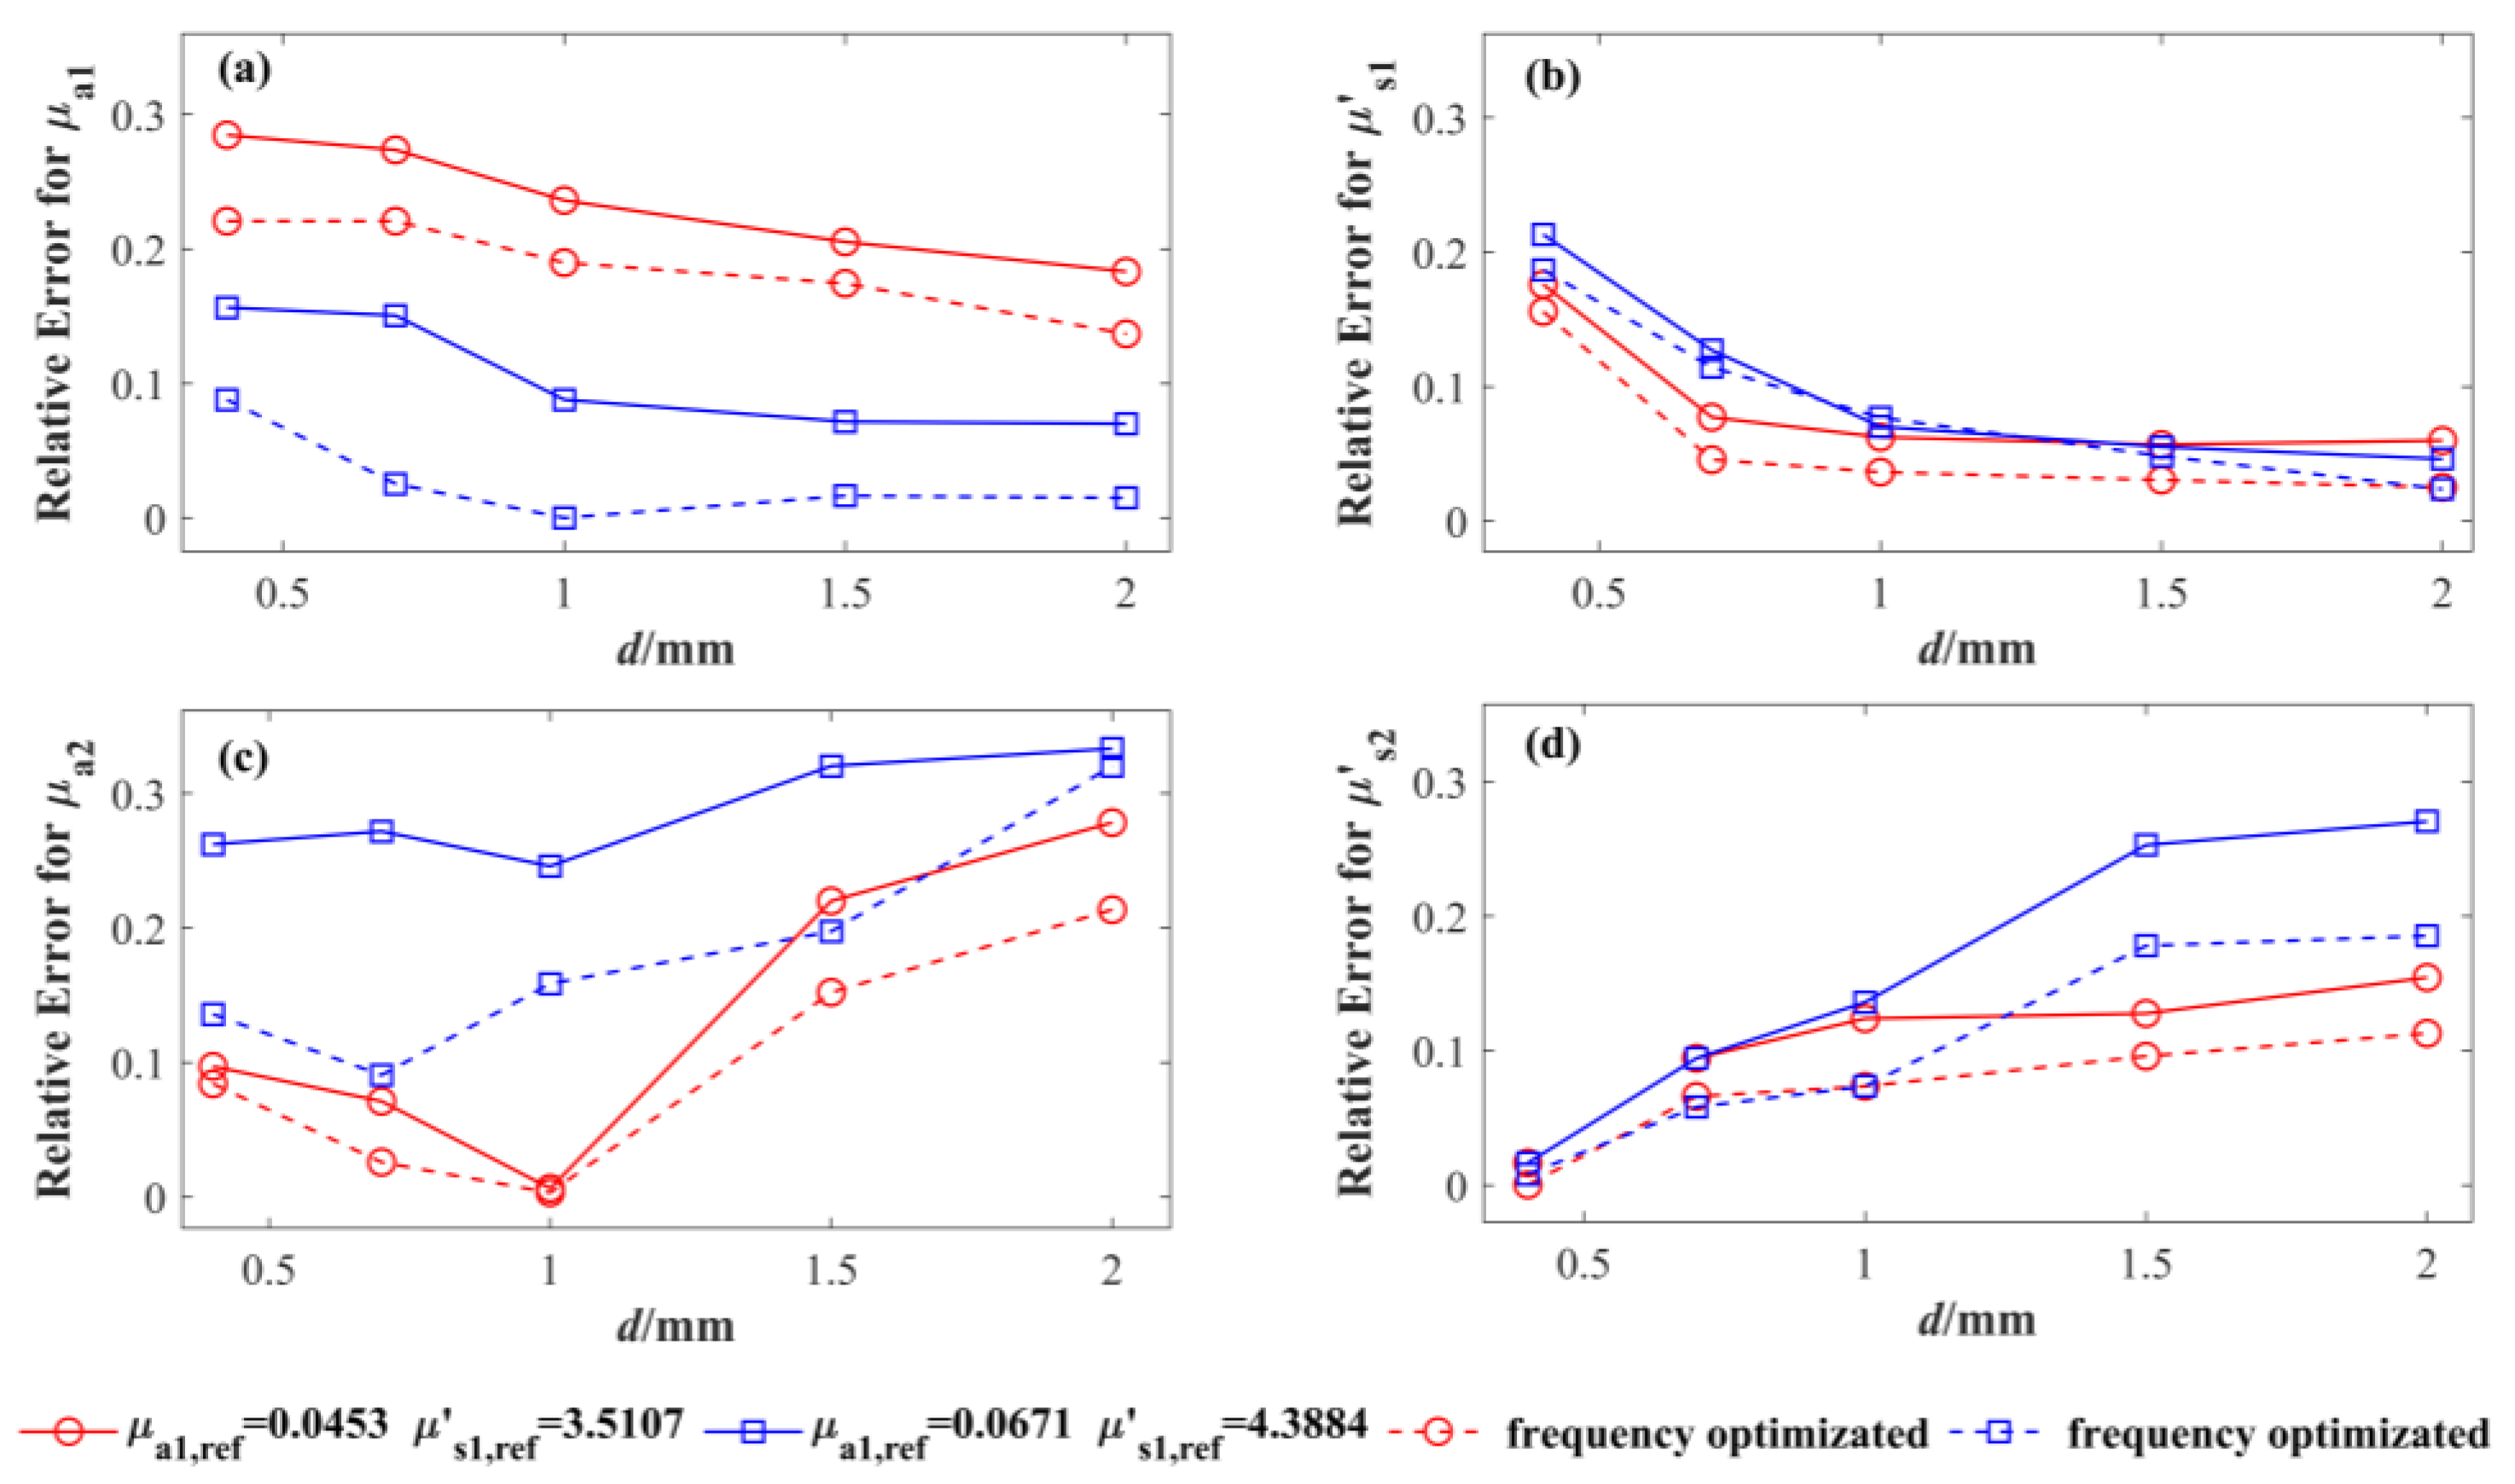
3.1. Monte Carlo Simulation Results

When two spatial frequencies were chosen for the experiment, the correspondence between the coefficient P 0 φ d 2 and spatial frequency fx could be obtained by the form P 0 φ d 2 = kf x + b . In order to simplify the problem, it was only needed to study how the thickness d of the skin layer, the skin layer absorption coefficient μa1 and the reduced scattering coefficient μs1 influenced the k and b values and then combine that with the two-layer model to obtain the optical properties of the flesh layer tissue. Figure 4a,b show the relationship between the k and b values with the variation of the skin layer’s thickness d, μa1 and μs1, respectively. As observed in Figure 4a, when d increases, the k value increases, and when μs1 increases, the k value increases exponentially. However, the k value shows two situations when μa1 increases: when d is larger than 1.5 mm, the k value shows a trend of decreasing and then increasing, while the k value increases with μa1 when d is smaller than 1.5 mm. Due to the fact that, the larger d is, the more photons interact with the skin layer, which causes less photons to reach the flesh layer and less optical information to be obtained from the flesh layer, this will lead to the total reflectance being more similar to the skin layer reflectance, and the k value will increase at this time. When d is smaller than 0.2 mm, almost all photons can reach the flesh layer, and more optical information can be obtained. Therefore, the total reflectance of the sample is closer to the flesh layer reflectance, and the k value will tend to be one. In Figure 4b, it can be seen that, when d increases, the b value also increases, and when μs1 increases, the b value increases exponentially, but when μa1 increases, the b value shows a trend of increasing at first and then decreasing. In the same way as the change of the k value, with the d increasing, the b value is more influenced by the skin layer optical properties. When d is smaller than 0.2 mm, the obtained flesh layer optical information is more, and the change is less. At this time, the b value will tend to be zero.

3.2. Phantom Experimental Results

In this study, the skin layer optical properties are demodulated by PLSN fitting through the high-frequency images (fx > 2 mm−1) and zero-frequency (fx = 0 mm−1) images. Figure 5 and Figure 6 show the errors of the two-layer phantom experiment measurements of the optical property parameters of each layer before and after the frequency optimization, respectively. The frequency optimization scheme aims to eliminate frequencies with excessive perturbation fluctuations to improve the model inversion accuracy. Before frequency optimization, the average errors of μa1 and μs1 of the skin layer are 16.53% and 9.44%, and the average errors of μa2 and μs2 of the flesh layer are 21.06% and 20.84%.
Figure 6 shows the results after frequency optimization: the average errors of μa1 and μs1 of the skin layer are 10.87% and 7.91%, and the average errors of μa2 and μs2 of the flesh layer are 16.76% and 8.64%. As the figure shows, when the optical property parameters of the skin layer are larger or the thickness d is larger, the detection accuracy of the optical property parameters in the skin layer is higher, and the detection accuracy of the optical property parameters in the flesh layer is lower. The detection accuracy of μa2 is much lower than the other three coefficients, and this can also be found in other research [10,29].
In the phantom experiments, the main sources of experimental errors can be divided into two categories. One is systematic errors brought about by the experimental equipment. The systematic errors were examined by conducting a single-layer liquid phantom experiment before the start of the two-layer phantom experiment. The average error of μa and μs was 7.75% and 4.75%. The other is the errors introduced by the inversion algorithm. The inversion of the skin layer’s optical properties is a curve fitting the reflectance through the high-frequency image by using PLSN fitting. The drawback of this inversion method is that, in the case of losing low-frequency information, PLSN fitting will choose to fit the curve that is closer to the high-frequency information, thus leading to an excessive absorption coefficient of the fitted curve model. Therefore, to improve the reliability of the curve model, zero-frequency images were added to the inversion as a way to avoid the problem of PLSN fitting.
Generally, the thicker the skin tissue is, the fewer photons can reach the flesh tissue, and the highly scattered skin tissue reduces the proportion of these photons that propagate back into the air through the skin [20]. Therefore, it leads to a gradual decrease in the detection accuracy of the flesh layer.

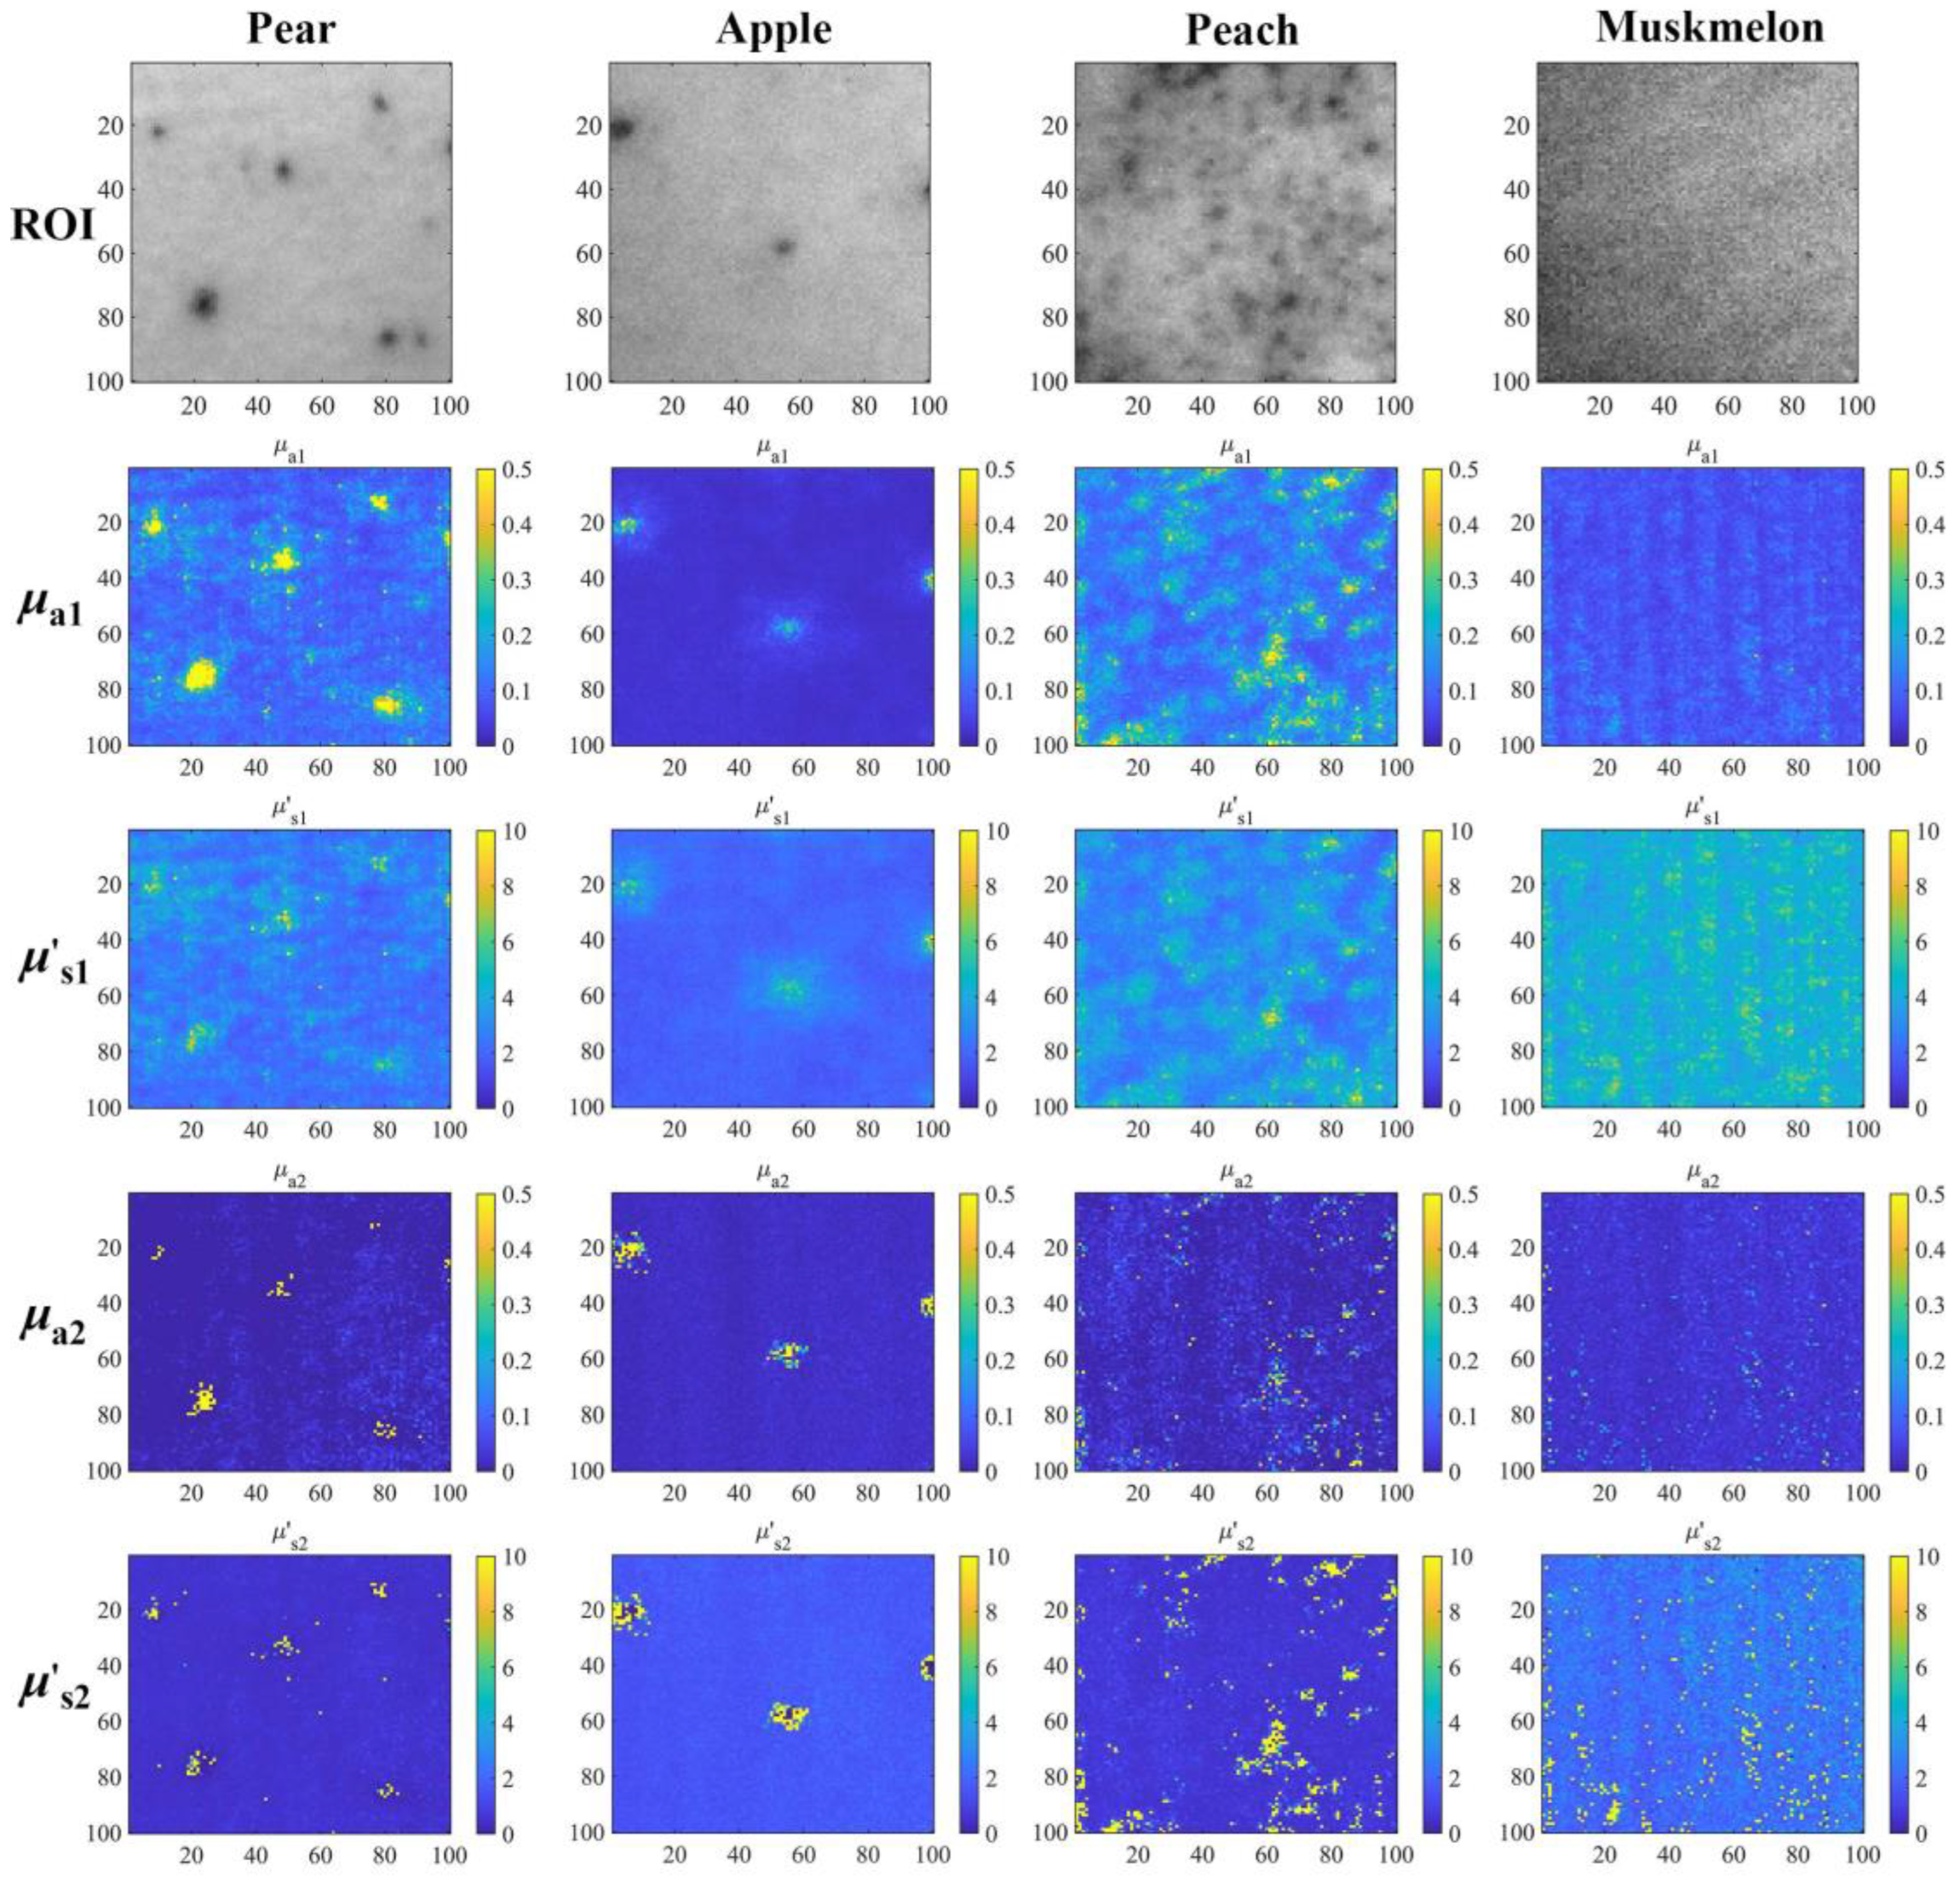
3.3. Fruit Sample Experimental Results

Figure 7 shows the results of the experiments with four kinds of thin-skinned fruit samples. More conspicuous yellow regions appear in the pear and apple figures, where it can be seen that the absorption coefficient and the reduced scattering coefficient in this region reach the upper limit values that are set in the experiment. These regions correspond to the black spot in the ROI. The comparison of the experimental images confirmed that these areas are the breathing pores with pigment accumulation, which are distributed on the skins of the pear and apple. These breathing pores are dark in color and are unevenly distributed on the skin layers, and the areas of the breathing pores intercepted in the ROI are different in the different experimental samples.
Since the absorption coefficients and reduced scattering coefficients of the breathing pore regions are generally high, when the areas of the breathing pores in the ROI are larger, the average value of the optical property parameters of the region is also larger. Furthermore, it is found that black dots can also be seen in the flesh layer when the skin of the sample is removed. Thus, when both the skin and flesh layers are respiratory pore tissues, these tissues may be equivalent to a single layer. Since the actual measured reflectivity may be slightly lower than the reflectivity after single-layer model fitting, the use of a two-layer model will lead to negative values in Equation (5) (R1R2) for the inversion of the optical property parameters and further lead to the inversion results reaching the upper limit set. This is the reason for the appearance of the yellow areas in the figure mentioned above.
Meanwhile, it can be seen that yellow areas also appear in the peach figure, but unlike the previous breathing pore areas, in these yellow areas, the color of the skin tissue is dark pink, which is caused by the high anthocyanin. According to the literature [30], 527 nm is the absorption peak of anthocyanin, so the absorption coefficient in this area is very large, and most of the light is absorbed into the skin layer and cannot reach the flesh layer. Therefore, the optical properties of the flesh layer obtained by using the two-layer model in these regions are inaccurate. In the muskmelon figure, it can be seen that the absorption and reduced scattering coefficients in the skin and flesh layers are slightly higher than those in the other three kinds of fruits. This can be seen in Table 2. This may relate to the characteristics of the muskmelon variety, which has a white color rind and invisible breathing pores (without pigment accumulation) on the skin layer, which may lead to high reflectance.
Throughout the experimental results, it could be seen that the absorption coefficients and reduced scattering coefficients of the skin layer were higher than those of the flesh layer. This was consistent with the findings of Shi et al. [11] and Saeys et al. [24]. Meanwhile, the optical properties of the flesh layer were more homogeneous than those of the skin layer.

4. Discussion

Table 2 shows the results of the fruit experiments. The estimation of μs1 and μa1 in the skin layer are within the acceptable range, and the results of μs2 and μa2 in the flesh layer are similar to the ranges of the detection results of other SFDI studies [31,32]. In their study, the μa2 of the pear’s flesh layer was 0.0520 mm−1, and the μs2 was 0.7730 mm−1 at 527 nm. For the apple’s flesh layer, the μa2 was 0.0212 mm−1, and the μs2 was 0.5450 mm−1 at 527 nm. Saeys et al. [24] used the integrating sphere technique to measure the optical properties of apple skin at 350–2200 nm and the optical properties of apple flesh at 250–1900 nm. The range of the absorption coefficients of apple skin were 0.1–7 mm−1, and the reduced scattering coefficients were 3.5–10.0 mm−1. For the apple flesh, the range of the absorption coefficients were 0.1–2.8 mm−1, and the reduced scattering coefficients were 1.2–1.5 mm−1. Qin et al. [33] measured the optical properties of peach flesh tissue at 500–1000 nm using a spatially resolved method. The range of the absorption coefficients of peach flesh were 0.012–0.030 mm−1, and the reduced scattering coefficients were 1.200–1.550 mm−1.
The results of the experiments verify the reliability of the two-layer model proposed in this study for the detection of thin-skinned fruits’ optical properties. The accuracy of the flesh layer optical property parameters is largely related to the accuracy of the skin layer. The thicker the skin layer is, the less photons can reach the flesh layer, which leads to the detection accuracy of the flesh layer not being as good as that of the skin layer. For fruits such as peaches, the roughness of the skin can also lead to differences in the detected results. At the same time, due to the physical and chemical differences of different skin tissues, such as pears and apples, after losing the skin tissue protection, the flesh tissue will soon be oxidized by the air, and the chemical composition of the internal tissue is also changed, which will cause huge experimental errors. Therefore, this study did not detect and analyze peeled fruit samples.
The proposed two-layer model is only for thin-skinned fruits with forward scattering characteristics. If this model is applied to objects that do not have such conditions, it may lead to a loss of confidence in the results due to excessive errors. Therefore, subsequent studies can be extended to other objects. Meanwhile, in the selection of the optical properties’ inversion algorithm, the PLSN method only predicts and regresses the data by simply modeling the mathematical mapping relationships among the variables. At the same time, these mathematical mapping relationships are established based on ideal situations. Therefore, the fitting by the PLSN method is unavoidably filled with certain errors. In the future, a more accurate inversion algorithm should be selected to extract the optical property parameters.

5. Conclusions

In this study, a two-layer model was proposed based on the forward scattering of layered fruits and the low-pass filtering characteristics of biological tissues. A model using the SFDI technique was realized to estimate the optical property parameters of each layer of thin-skinned fruits. The results showed the effectiveness of the two-layer model in measuring the optical properties of both the skin layer and flesh layer of thin-skinned fruits. This study promotes the further application of SFDI in the nondestructive quality detection of fruits. In future work, neural network methods will be tried and investigated to improve the accuracy of the optical property parameters by using multi-dimensional effective features and using those optical property parameters to predict fruit quality, such as the sugar level, hardness, etc.

Author Contributions

J.Z.: Methodology, Formal analysis, Data curation and Writing—original draft. X.F.: Conceptualization, Supervision, Resources, Writing—review and editing, Project administration and Funding acquisition. Y.L.: Investigation and Writing—review and editing. S.X.: Validation, Writing—review and editing and Supervision. Y.Y.: Writing—review and editing. All authors have read and agreed to the published version of the manuscript.

Funding

This research was supported by the National Natural Science Fund of China (32071904) and the Natural Science Fund of Zhejiang Province (LY20C130008).

Institutional Review Board Statement

Not applicable.

Informed Consent Statement

Not applicable.

Data Availability Statement

The data that support the findings of this study are available from the corresponding author upon reasonable request.

Acknowledgments

The authors thank the editors and anonymous reviewers for providing helpful suggestions for improving the quality of this manuscript.

Conflicts of Interest

The authors declare no conflict of interest.

References

  1. Cen, H.; Lu, R.; Mendoza, F.; Beaudry, R.M. Relationship of the Optical Absorption and Scattering Properties with Mechanical and Structural Properties of Apple Tissue. Postharvest Biol. Technol. 2013, 85, 30–38. [Google Scholar] [CrossRef]
  2. Hasanzadeh, B.; Abbaspour-Gilandeh, Y.; Soltani-Nazarloo, A.; Cruz-Gámez, E.D.L.; Hernández-Hernández, J.L.; Martínez-Arroyo, M. Non-Destructive Measurement of Quality Parameters of Apple Fruit by Using Visible/Near-Infrared Spectroscopy and Multivariate Regression Analysis. Sustainability 2022, 14, 14918. [Google Scholar] [CrossRef]
  3. Liu, N.; Chen, X.; Liu, Y.; Ding, C.; Tan, Z. Deep Learning Approach for Early Detection of Sub-Surface Bruises in Fruits Using Single Snapshot Spatial Frequency Domain Imaging. Food Meas. 2022, 16, 3888–3896. [Google Scholar] [CrossRef]
  4. Cen, H.; Lu, R.; Mendoza, F.A.; Ariana, D.P. Assessing Multiple Quality Attributes of Peaches Using Optical Absorption and Scattering Properties. Trans. ASABE 2012, 55, 647–657. [Google Scholar] [CrossRef]
  5. Kienle, A.; Patterson, M.S.; Dögnitz, N.; Bays, R.; Wagnières, G.; van den Bergh, H. Noninvasive Determination of the Optical Properties of Two-Layered Turbid Media. Appl. Opt. 1998, 37, 779. [Google Scholar] [CrossRef] [PubMed]
  6. Liemert, A.; Kienle, A. Analytical Approach for Solving the Radiative Transfer Equation in Two-Dimensional Layered Media. J. Quant. Spectrosc. Radiat. Transf. 2012, 113, 559–564. [Google Scholar] [CrossRef]
  7. Wang, A.; Wei, X. A Sequential Method for Estimating the Optical Properties of Two-Layer Agro-Products from Spatially-Resolved Diffuse Reflectance: Simulation. Artif. Intell. Agric. 2019, 3, 69–78. [Google Scholar] [CrossRef]
  8. Ripoll, J.; Ntziachristos, V.; Culver, J.P.; Pattanayak, D.N.; Yodh, A.G.; Nieto-Vesperinas, M. Recovery of Optical Parameters in Multiple-Layered Diffusive Media: Theory and Experiments. J. Opt. Soc. Am. A 2001, 18, 821. [Google Scholar] [CrossRef] [PubMed]
  9. Hollmann, J.L.; Wang, L.V. Multiple-Source Optical Diffusion Approximation for a Multilayer Scattering Medium. Appl. Opt. 2007, 46, 6004. [Google Scholar] [CrossRef]
  10. Hu, D.; Lu, R.; Ying, Y. Spatial-Frequency Domain Imaging Coupled with Frequency Optimization for Estimating Optical Properties of Two-Layered Food and Agricultural Products. J. Food Eng. 2020, 277, 109909. [Google Scholar] [CrossRef]
  11. Shi, S.; Tan, Z.; Xie, J.; Lu, J. The Effects of Skin Thickness on Optical Transmission Characteristics in Fruits Tissues. Spectrosc. Spectr. Anal. 2015, 35, 1817–1823. [Google Scholar]
  12. Sun, C.; Aernouts, B.; Van Beers, R.; Saeys, W. Simulation of Light Propagation in Citrus Fruit Using Monte Carlo Multi-Layered (MCML) Method. J. Food Eng. 2021, 291, 110225. [Google Scholar] [CrossRef]
  13. Zhang, M.; Li, C.; Yang, F. Optical Properties of Blueberry Flesh and Skin and Monte Carlo Multi-Layered Simulation of Light Interaction with Fruit Tissues. Postharvest Biol. Technol. 2019, 150, 28–41. [Google Scholar] [CrossRef]
  14. Hu, D.; Huang, Y.; Zhang, Q.; Yao, L.; Yang, Z.; Sun, T. Numerical Simulation on Spatial-Frequency Domain Imaging for Estimating Optical Absorption and Scattering Properties of Two-Layered Horticultural Products. Appl. Sci. 2021, 11, 617. [Google Scholar] [CrossRef]
  15. Wang, L.V.; Wu, H.-I.; Masters, B.R. Biomedical Optics, Principles and Imaging. J. Biomed. Opt. 2008, 13, 049902. [Google Scholar] [CrossRef]
  16. Haskell, R.C.; Svaasand, L.O.; Tsay, T.-T.; Feng, T.-C.; Tromberg, B.J.; McAdams, M.S. Boundary Conditions for the Diffusion Equation in Radiative Transfer. J. Opt. Soc. Am. A 1994, 11, 2727. [Google Scholar] [CrossRef]
  17. Cuccia, D.J.; Bevilacqua, F.; Durkin, A.J.; Ayers, F.R.; Tromberg, B.J. Quantitation and Mapping of Tissue Optical Properties Using Modulated Imaging. J. Biomed. Opt. 2009, 14, 024012. [Google Scholar] [CrossRef]
  18. Svaasand, L.O.; Spott, T.; Fishkin, J.B.; Pham, T.; Tromberg, B.J.; Berns, M.W. Reflectance Measurements of Layered Media with Diffuse Photon-Density Waves: A Potential Tool for Evaluating Deep Burns and Subcutaneous Lesions. Phys. Med. Biol. 1999, 44, 801–813. [Google Scholar] [CrossRef]
  19. Hu, D.; Sun, T.; Yao, L.; Yang, Z.; Wang, A.; Ying, Y. Monte Carlo: A Flexible and Accurate Technique for Modeling Light Transport in Food and Agricultural Products. Trends Food Sci. Technol. 2020, 102, 280–290. [Google Scholar] [CrossRef]
  20. Wang, L.; Jacques, S.L.; Zheng, L. MCML—Monte Carlo Modeling of Light Transport in Multi-Layered Tissues. Comput. Methods Programs Biomed. 1995, 47, 131–146. [Google Scholar] [CrossRef]
  21. Ding, C.; Shi, S.; Chen, J.; Wei, W.; Tan, Z. Analysis of Light Transport Features in Stone Fruits Using Monte Carlo Simulation. PLoS ONE 2015, 10, e0140582. [Google Scholar] [CrossRef]
  22. Lu, R.; Van Beers, R.; Saeys, W.; Li, C.; Cen, H. Measurement of Optical Properties of Fruits and Vegetables: A Review. Postharvest Biol. Technol. 2020, 159, 111003. [Google Scholar] [CrossRef]
  23. Xie, D.; Guo, W. Measurement and Calculation Methods on Absorption and Scattering Properties of Turbid Food in Vis/NIR Range. Food Bioprocess Technol. 2020, 13, 229–244. [Google Scholar] [CrossRef]
  24. Saeys, W.; Velazco-Roa, M.A.; Thennadil, S.N.; Ramon, H.; Nicolaï, B.M. Optical Properties of Apple Skin and Flesh in the Wavelength Range from 350 to 2200 Nm. Appl. Opt. 2008, 47, 908. [Google Scholar] [CrossRef]
  25. Mustari, A.; Nishidate, I.; Wares, M.d.A.; Maeda, T.; Kawauchi, S.; Sato, S.; Sato, M.; Aizu, Y. Agarose-Based Tissue Mimicking Optical Phantoms for Diffuse Reflectance Spectroscopy. JoVE 2018, 138, e57578. [Google Scholar] [CrossRef]
  26. Zhang, R.; Zhang, J.; Xie, M.; Chen, J. Optical Characteristics of Agarose Gel. Infrared Laser Eng. 2016, 45, 0721003. [Google Scholar] [CrossRef]
  27. Ninni, P.D.; Martelli, F.; Zaccanti, G. Intralipid: Towards a Diffusive Reference Standard for Optical Tissue Phantoms. Phys. Med. Biol. 2010, 56, N21–N28. [Google Scholar] [CrossRef]
  28. Luo, Y.; Jiang, X.; Fu, X. Spatial Frequency Domain Imaging System Calibration, Correction and Application for Pear Surface Damage Detection. Foods 2021, 10, 2151. [Google Scholar] [CrossRef] [PubMed]
  29. Cen, H.; Lu, R. Quantification of the Optical Properties of Two-Layer Turbid Materials Using a Hyperspectral Imaging-Based Spatially-Resolved Technique. Appl. Opt. 2009, 48, 5612. [Google Scholar] [CrossRef]
  30. Sun, Y.; Li, Y.; Pan, L.; Abbas, A.; Jiang, Y.; Wang, X. Authentication of the Geographic Origin of Yangshan Region Peaches Based on Hyperspectral Imaging. Postharvest Biol. Technol. 2021, 171, 111320. [Google Scholar] [CrossRef]
  31. He, X.; Fu, X.; Rao, X.; Fu, F. Nondestructive Determination of Optical Properties of a Pear Using Spatial Frequency Domain Imaging Combined with Phase-Measuring Profilometry. Appl. Opt. 2017, 56, 8207. [Google Scholar] [CrossRef]
  32. Hu, D.; Fu, X.; He, X.; Ying, Y. Noncontact and Wide-Field Characterization of the Absorption and Scattering Properties of Apple Fruit Using Spatial-Frequency Domain Imaging. Sci. Rep. 2016, 6. [Google Scholar] [CrossRef]
  33. Qin, J.; Lu, R. Measurement of the Optical Properties of Fruits and Vegetables Using Spatially Resolved Hyperspectral Diffuse Reflectance Imaging Technique. Postharvest Biol. Technol. 2008, 49, 355–365. [Google Scholar] [CrossRef]
Figure 1. Schematic of the two-layer model: medium 1 has different optical property parameters in the skin and flesh layers (left); medium 2 has the same optical property parameters in the skin and flesh layers (right).
Photonics 10 00622 g001
Figure 2. Phantom production process. (a) A single-layer optical solid phantom; (b) acrylic containers; (c) a two-layer phantom; (d) two-layer phantom production.
Photonics 10 00622 g002
Figure 3. Fruit sample experiment. (a) Experimental procedure and (b) fruit sample skin thickness measurements; d1 is actual measured size and d2 is the scale bar.
Photonics 10 00622 g003
Figure 4. Model of the relationship of the k value and b value as a function of d (mm), μa1 (mm−1) and μs1 (mm−1) by using the Monte Carlo simulation: (a) the k value variation relationships and (b) the b value variation relationships.
Photonics 10 00622 g004
Figure 5. The experimental results before frequency optimization: (a) the skin layer absorption coefficient μa1; (b) the skin layer reduced scattering coefficient μs1; (c) the flesh layer absorption coefficient μa2; (d) the flesh layer reduced scattering coefficient μs2.
Photonics 10 00622 g005
Figure 6. The experimental results after frequency optimization: (a) the skin layer absorption coefficient μa1; (b) the skin layer reduced scattering coefficient μs1; (c) the flesh layer absorption coefficient μa2; (d) the flesh layer reduced scattering coefficient μs2.
Photonics 10 00622 g006
Figure 7. The results of the fruit sample experiments. The detection results at 527 nm of the pear, apple, peach and muskmelon, respectively. From top to bottom is the ROI intercepted from the original image taken, the absorption coefficient and the reduced scattering coefficient of the skin layer and the absorption coefficient and the reduced scattering coefficient of the flesh layer.
Photonics 10 00622 g007
Table 1. The optical property parameters’ configuration of each layer in the two-layer optical phantom.
Sampled/mmμa1/mm−1μs1/mm−1μa2/mm−1μs2/mm−1
10.40.04533.51070.03091.2662
20.70.04533.5107
31.00.04533.5107
41.50.04533.5107
52.00.04533.5107
60.40.06714.3884
70.70.06714.3884
81.00.06714.3884
91.50.06714.3884
102.00.06714.3884
Table 2. The results range (min–max) of the skin and flesh layers’ optical property parameters and skin thickness of four fruits at 527 nm.
Sampled/mmLayerμa/mm−1μs/mm−1
Pear0.4841–0.5714skin0.0542–0.13482.1036–2.7041
flesh0.0159–0.04840.6731–0.9491
Apple0.0505–0.1289skin0.0329–0.04472.0893–2.6380
flesh0.0284–0.04391.8152–2.1261
Peach0.4765–0.4974skin0.1634–0.48442.5242–3.5306
flesh0.0274–0.05531.4552–1.6873
Muskmelon0.0426–0.1776skin0.0800–0.16413.0345–4.3898
flesh0.0347–0.04472.0353–3.0714
Disclaimer/Publisher’s Note: The statements, opinions and data contained in all publications are solely those of the individual author(s) and contributor(s) and not of MDPI and/or the editor(s). MDPI and/or the editor(s) disclaim responsibility for any injury to people or property resulting from any ideas, methods, instructions or products referred to in the content.

