Communication

Operating Characteristic Curves of Optical Packet-Switching Using Optical Code-Division Multiplexing for Label Switching

1
School of Electrical and Computer Engineering, Nanfang College Guangzhou, Guangzhou 510970, China
2
School of Accounting, Nanfang College Guangzhou, Guangzhou 510970, China
*
Author to whom correspondence should be addressed.
Photonics 2023, 10(6), 613; https://doi.org/10.3390/photonics10060613
Submission received: 4 March 2023 / Revised: 15 May 2023 / Accepted: 19 May 2023 / Published: 25 May 2023
(This article belongs to the Section Optical Communication and Network)

Abstract

:
In this paper, the operating characteristic curves (OCCs) of optical code-division multiplexing (OCDM) technology for label switching of an optical packet-switching (OPS) network was evaluated. A node structure for processing the packets, with spectral-amplitude-coding (SAC) labels, considering a balanced detector and an optical switch, was developed and modeled. The effects of decoding noises on the performance of both M-sequence and stuffed quadratic congruence (SQC) labeling systems were addressed. Hypothesis testing was applied to the decoder to investigate the results of label recognition. The null and alternative hypotheses were, respectively, defined as a decoder receiving the matching and mismatching labels. Due to the noise effects, the decoder output may not reflect the label status correctly. Type I error occurs when the null hypothesis is true while accepting the alternative one. Type II error occurs when the alternative hypothesis is true while accepting the null one. Analytic equations of both errors were given, considering a desired packet that was missed and an undesired packet shown in a switched path. The trade-off between these two errors, regarding the decoder threshold, was demonstrated in operating characteristic curves (OCCs). A better OCC could be found when a packet had more labeled payload bits, or when the utilized label code had a lower auto-to-cross-correlation ratio.

1. Introduction

The emergence of real-time services drives increased bandwidth demand, particularly for packet switching and routing. Optical packet-switching (OPS) has been considered for providing significant bandwidth with diverse applications for many years [1,2,3,4,5,6,7]. In OPS, the bottleneck of the slowness of electronic switching is managed by removing optical-electrical-optical (OEO) conversions at every forwarding node. Since the data are expressed in the optical domain during the entire process, the optical network capability is fully exploited. High-transmission speeds and great data transparency make OPS a promising candidate to be implemented as an internet protocol (IP) in the optical domain for all-optical networks. Generalized multi-protocol label switching (GMPLS) has been proposed for OPS due to the efficient management of network resources and the simplified implementation of the layer structure [8,9,10,11,12,13]. Data connections are oriented by establishing label-switching paths (LSPs) expressed by packet labels that are used to perform packet switching in the time, wavelength, and fiber domains.
In past decades, research on OPS has drawn much attention. Routing and switching functions in OPS are primarily implemented via label processing at forwarding nodes. Based on the packet structures composed of payload and labels, optical labeling can be broadly categorized into serial and parallel labeling [14]. In serial labeling, the label is placed in front of the payload in the time domain [15], and strict synchronization among nodes is required. As for parallel labeling, the label and payload are multiplexed on separate wavelengths or wavelength bands so that they can be processed in parallel [16]. Other parallel labeling schemes modulate the label in a different signal dimension from the payload, such as the frequency, phase, or polarization domains [17,18,19]. Moreover, hybrid labeling schemes express the label format in more than one parameter [20].
This data switching utilizing labels considered to be optical codes is known as code-division multiplexing (OCDM)-based routing in optical core networks [21,22,23,24,25,26]. OCDM labels have a larger label space due to finer granularity in the sub-wavelength domain. Furthermore, differentiated quality of services (QoSs) and asynchronous accessibility are other attractive characteristics. Two labeling strategies, the optical code-labeled path and the OCDM path, have been studied to address the OCDM switching problem [21,22]. The first attaches an optical code label to a packet’s head, but the lengthened packet duration limits the switching throughput. The second encodes a specific optical code on the entire packet, including the header. The OCDM path is efficient for packet switching since multiple labels on a single wavelength can be processed in parallel. Moreover, the label dimension can be extended from OCDM to hybrid wavelength-division multiplexing (WDM)/OCDM, where the label is identified as both the code and wavelength of a received packet [23,24,25,26].
This paper considered an OCDM path strategy, exploiting spectral amplitude coding (SAC) [22,27,28,29,30,31,32] for packet switching. Since the label is placed at a packet’s head, the packet duration is increased with the existing label length of time-spreading codes [14,15,16,17,18,19]. When a label is decoded, detecting fast code chips is required, increasing the node complexity. On the other hand, a SAC label is implemented in the spectrum domain, so the label length is irrelevant to the packet duration. A long SAC label can be decoded at a fixed packet or payload rate. Moreover, since multiplexed SAC labels can be decoded without multiple-access interference (MAI), they can be adopted for label stacking, where a packet simultaneously carries multiple labels.
In our previous work [32], a modified decoding scheme of SAC labels was introduced, where the framework of balanced detection, assisted with hypothesis testing, was developed. The importance of the number of the labeled bits in a packet on packet-loss probability (PLP) was demonstrated. Increasing the labeled bits reduced the decoder noise effects and improved PLP accordingly. However, two error scenarios of label recognition due to the noise presence led to an incorrect switching decision. First, a given decoder did not have any output signal when receiving a matching label. Second, when receiving a mismatching label, a given decoder had a significant output signal. The first scenario was considered and analyzed in our previous work [32]. This paper considered both scenarios and aimed to develop an adequate model for evaluating OPS performance. We adopted the hypothesis testing concept and modeled the two scenarios as Type I and Type II errors. Some critical works of this paper included deducting the signal and noise expressions at the decoder output to derive the probabilities of both errors. The trade-off between the two errors regarding the decoder threshold was demonstrated in operating characteristic curves (OCCs). The switching conditions for achieving a better OCC were also analyzed and presented.

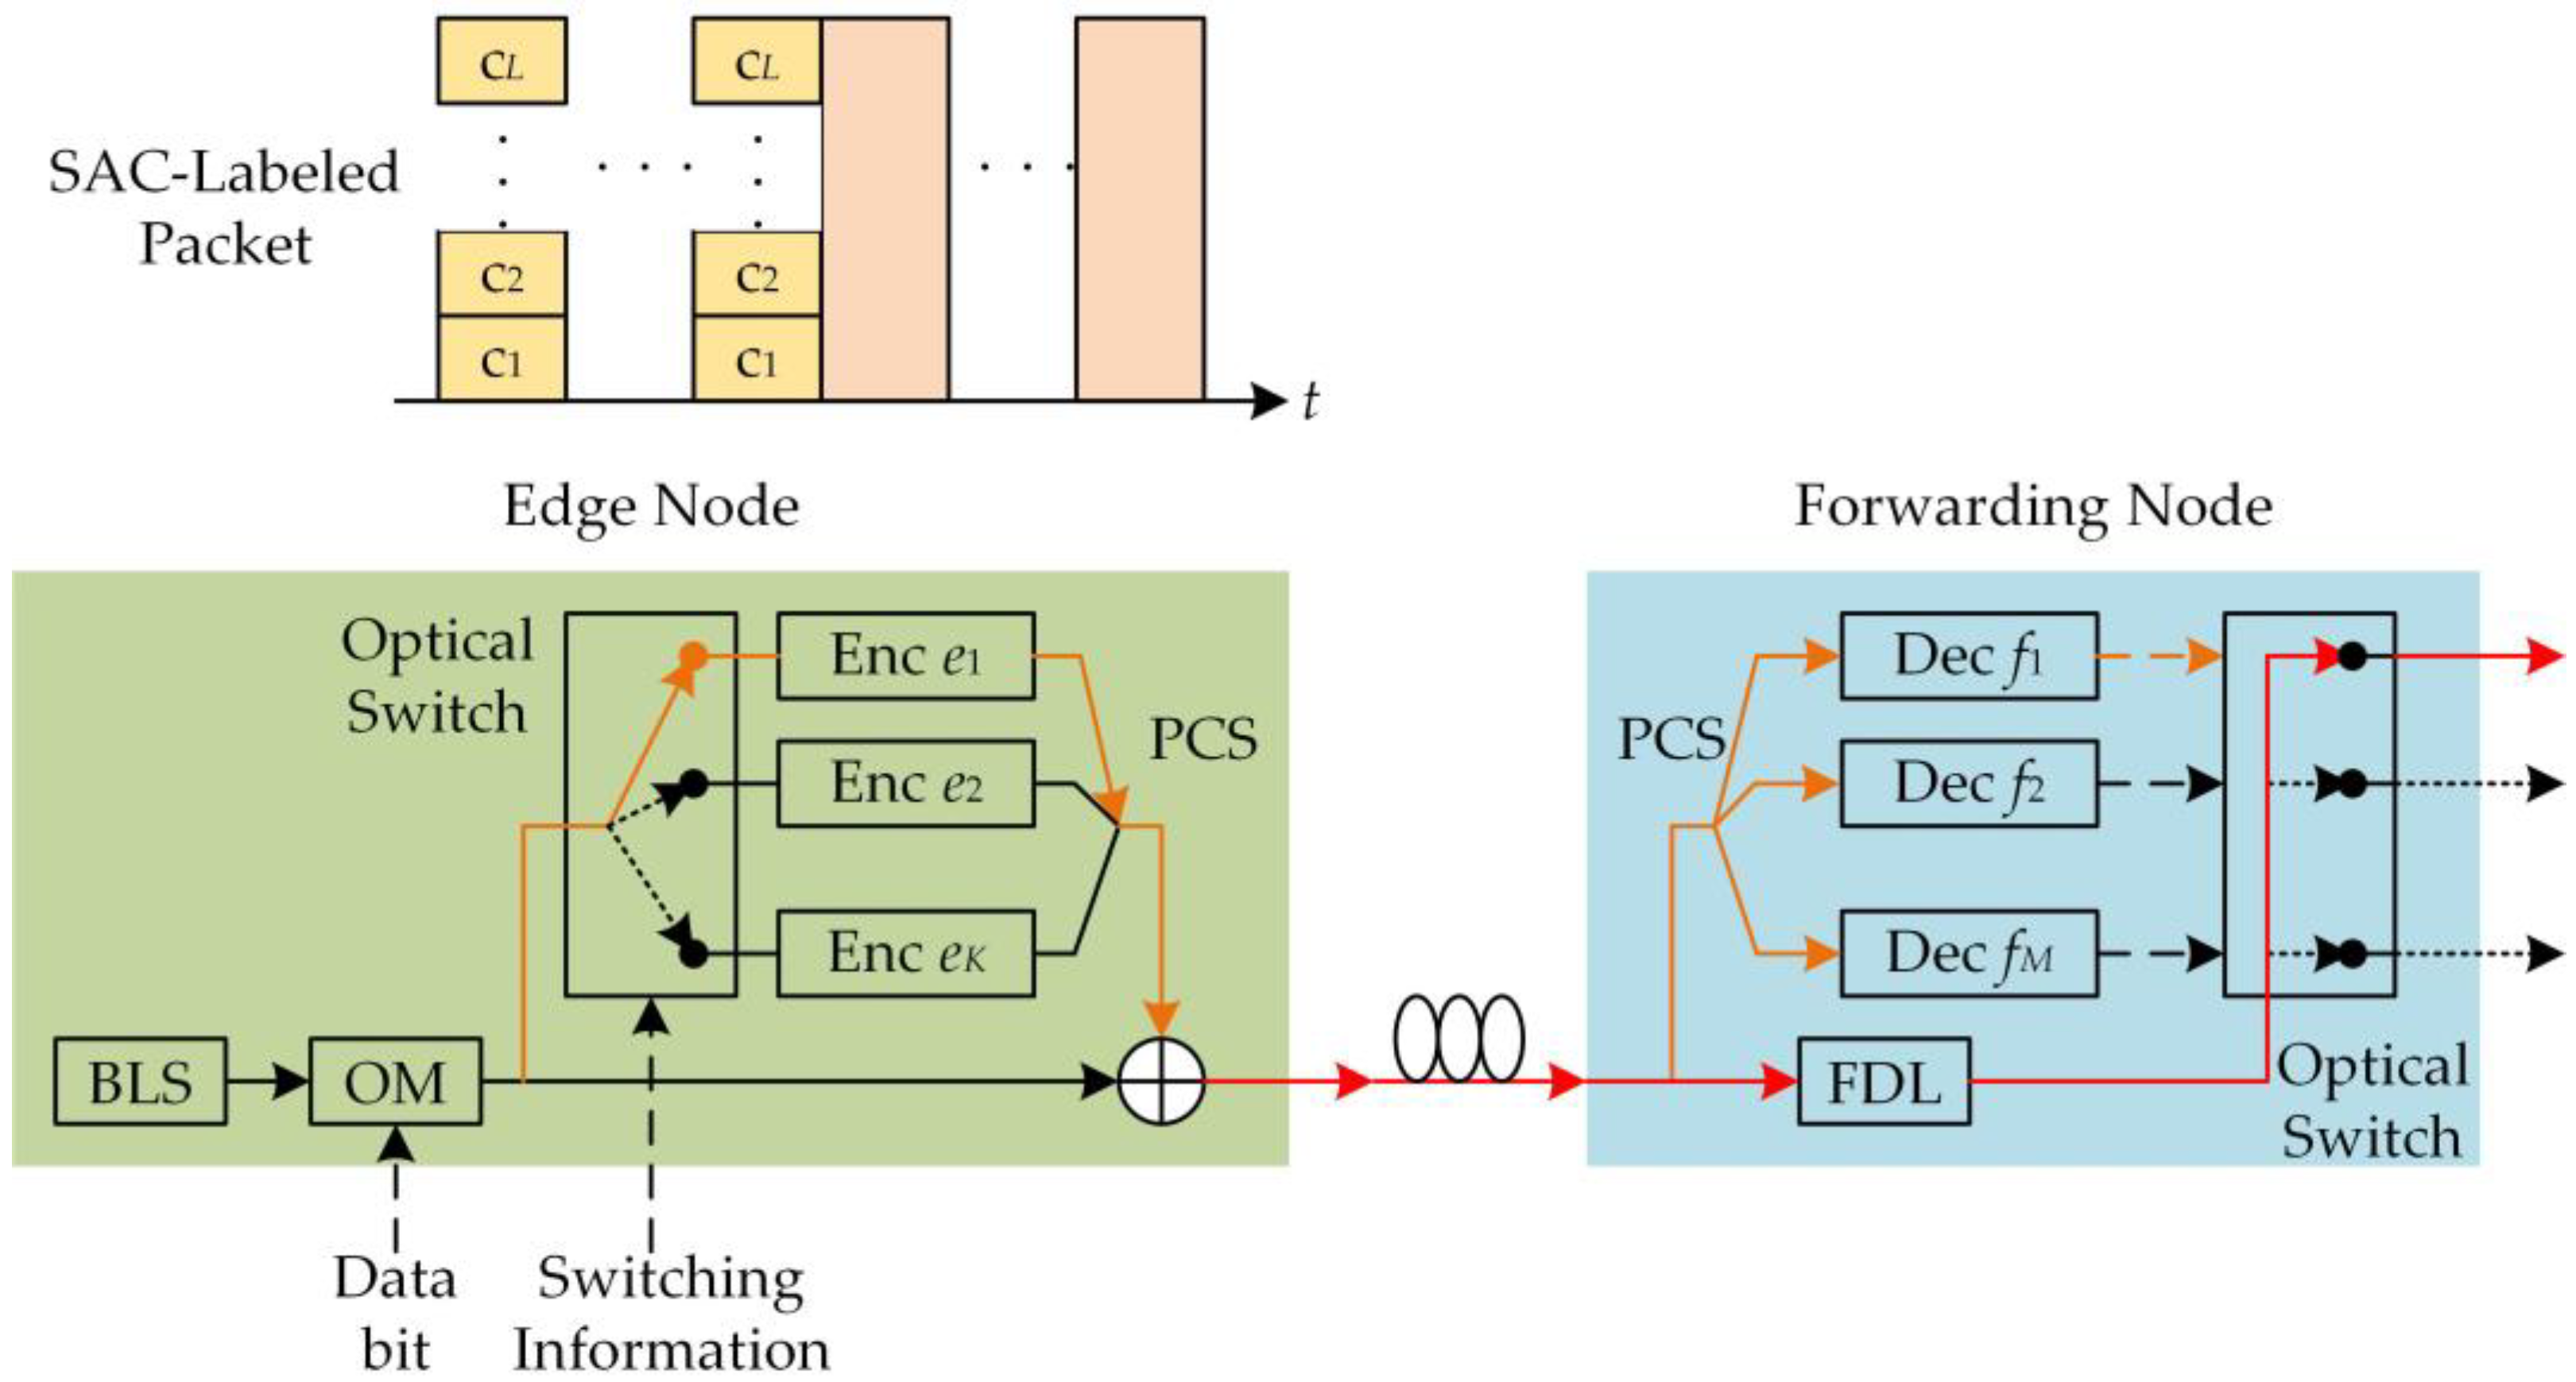
2. Optical Code-Division Multiplexing (OCDM) Switching System with Spectral-Amplitude-Coding (SAC)

Figure 1 illustrates the principle of the investigated SAC-based OPS. Each link between two nodes in the network was differentiated using a specific optical code. The edge node transmitted an optical packet with each payload bit of duration Tb. There were two inputs at the edge nodes, which, respectively, carried the data and switching information of an optical packet. The optical carrier generated from a broadband light source (BLS) was modulated with the electrical data to form an optical payload. Then, the switching information was attached to the optical packet by sending the modulated carrier to the corresponding encoders for labeling. A portion of the bit pulse in a packet was assigned with a SAC label stack by passing them to a set of encoders. Then, the labeled packet traveled through each forwarding node along a label-switched path (LSP) to complete the switching process. In this figure, we assumed that there were K encoders in the edge node structure, and L out of K labels was selected to represent the switching information along the LSP. The red and orange lines, respectively, denoted the packet and label path.
At a forwarding node, a part of the label power was tapped, and the information of the summed labels was extracted by decoders. While the decoder array performed label recognition, the optical packet was queued by a fiber delay line (FDL). The delay was set to the decision time of the switched path. When one of the labels in the stack matched a decoder, an autocorrelation spike was observed. Features of the auto-correlation pulse were used to assess the label information, indicating an output path. The specific decoder matching one of the labels carried by the packet generated a control signal to set up a connection to the desired switched path. Then the packet was forwarded to one of the output ports of the forwarding nodes to finish packet switching. We assumed that label e1 in the stack matches decoder f1, so the packet left the forwarding node from the first output port. If the label recognition worked well, only a relatively high signal existed among the decoder outputs. However, detection noises could cause the wrong estimation of the receiving label at the mismatching decoders. The code cardinality and the probability of correct label detection under the decoder noise level limited the label capacity.
Figure 2 shows two implementations of the SAC encoder/decoder array used in the OPS edge/forwarding node. A generic SAC codec includes passive splitters/combiners (PSCs), fiber Bragg gratings (FBGs), and circulators. In Figure 2a, each grating in the encoder structure reflected a specific wavelength band, corresponding to chip “1” of a preset SAC code. A circulator was required to produce the wavelengths reflected from all gratings. The packet-generating scheme obviated additional light sources for labeling, reducing the component count and bandwidth occupancy. The FBG group functioned as the filters for achieving optical encoding/decoding in the spectrum domain. For example, to generate the M-sequence label of (1110010) in SAC format, four FBGs with the centered wavelengths of λ1, λ2, λ3, and λ6 were deployed in the encoder structure, as shown in Figure 2a. The SAC label expressed as {λ1, λ2, λ3, 0, 0, λ6, 0} was generated by collecting four reflected wavelengths from the FBGs. Different SAC labels can be generated from the encoders with FBGs with different central wavelengths. The wavelength reflection and transmission of FBGs realized the filtering functions of the codec.
Figure 2b details the label-detecting block, where an identical FBG-based structure was considered for the decoding operation in a forwarding node. A practical implementation of balanced detection for interference cancellation is illustrated as well. It is important to note that a label would be matched to one of the switched paths, so no more than one decoded signal with a high amplitude could exist at the decoder outputs. Depending on the decoding result of the desired label, the optical switch selected the corresponding path to forward the packet to the next node.
The interference statistics of the label-switched system depended on the code properties and the labeled number carried by a packet. The overlapping pulses from codes with common wavelengths contributed to the interference components. The OCDM-based switching system suffered less interference than optical code-division multiple access (OCDMA) systems since the labels in the former were much less than the active users in the latter. Moreover, balanced detection is an excellent strategy to eliminate interference but can also create dominant noises that influence the label decoding performance [27]. In this paper, two code families, M-sequence and stuffed-quadratic congruence (SQC) codes [27], were considered as SAC labels, with the properties expressed as:
N , ω , λ c = ( 2 n 1 , 2 n 1 , 2 n 2 ) , for   M - sequence   codes p 2 + p + 1 , p + 1 , 1 , for   SQC   codes
In the above expressions of both code properties, N, ω, and λc are the code length, code weight, and cross-correlation value. The parameters of n and p are, respectively, a positive integer greater than 1 and a positive prime number greater than 2. The selected code length N is related to the network size and routing length. It was assumed that the code cardinality covered the label assignments to all paths in the network area.

3. Switching Performance Analysis

3.1. Decoded Signal and Noises Statistics

By utilizing the label codes with fixed cross-correlation values and balanced detection, only the noise sources contribute to the degradation of the decoded signal in a measured interval. Once the packet arrives at a forwarding node, the decoder is notified to process each labeled bit with the exact duration Tb. Based on the system assumptions in [33], the power spectral density (PSD) of the label signal at the input of decoder i is written as:
r λ = 1 M ξ i n = 1 N c i n Π λ n + k = 1 , k i K ξ k m = 1 N c k m Π λ m
The variable ξs ∈ {0,1} denotes the status of label selections based on the packet’s switching path, where 1 ≤ kK, and K is the code cardinality. Vector Ck = [ck(1), ck(2), ..., ck(N)] represents the code sequence with length N. Π n) denotes the rectangular function with a width of N/v and centered at λn, where v is the width of the light source spectrum and 1 ≤ nN. If one of the label codes Ck matches the decoder i (ξi = 1), the first term in (2) corresponds to the desired autocorrelation signal. The second term, which can be seen as the cross-correlation signals, is the interference from other undesired labels in the stack. If none of the label codes match the decoder (ξi = 0), only the interference term enters the decoder. Moreover, the label signal experiences an insertion loss of 1/M due to splitting to M decoders to determine which one of M outputs is the desired switched port. The photodetectors in the balanced detector used a square-law model for label detection, inducing several decoding noises. The total photocurrent at the balanced detector output can be written as:
i B D = i L + i P I I N + i T N
The terms iL, iPIIN, and iTN denote the detected optical label and the noise sources of phase-induced intensity noise (PIIN) and thermal noise of the receiver. The first noise term was signal dependent, while the second was signal independent.
In the following analysis, a fixed label number L carried by a packet (ξ1 + ξ2 + ... + ξK = L) was considered. Based on the deduction method in [33], the signal part iL is the difference between the two output photocurrents of the photodetectors in the balanced receiver, which can be written as:
i L = R P s r M N k = 1 K n = 1 N c i n c ¯ i n α ξ k c k n = R P s r ω M N , ξ i = 1 0 , ξ i = 0 ,
where R is the responsivity of the photo-detector, Psr is the power of a single label over Tb, and α is the decoding parameter defined as λc/(ωλc). Element c ¯ k n denotes the chip of the complementary code of Ck.
Considering the noise contribution of photodetection of the incoherent light signals, the equations of the power of iPIIN were developed. According to the noise expressions in [33], the PIIN equations can be decomposed into two noise terms at the outputs of the upper and lower photo-detectors in Figure 2, written as:
i P I I N u 2 = R 2 P s r 2 B M 2 α 2 N v n = 1 N ξ i c ¯ i n 2 k = 1 , k i K ξ k c k n + j = 1 , j i K ξ j c j n m = 1 , m i K ξ m c m n
and
i P I I N l 2 = R 2 P s r 2 B M 2 N v n = 1 N ξ i c i n 1 + 2 k = 1 , k i K ξ k c k n + j = 1 , j i K ξ j c j n m = 1 , m i K ξ m c m n
where B is the electrical bandwidth of the photodetector. PIIN raises from the beating between code chips with the same center wavelength. In (6), the three terms are defined as signal-to-signal, signal-to-interference, and interference-to-interference beating noises. The average power of the first beating was proportional to the code weight ω, and the second and the third beatings increased with the code cross-correlation λc. Therefore, no signal-to-signal beating existed in the decoding process performed in the upper branch of the FBG decoder, as shown in (5). In addition, the interference-to-interference beating term had the following properties, which are written as:
0 n = 1 N c ¯ i n c k n c j n ω λ c ,   for   i j k
and
0 n = 1 N c i n c k n c j n λ c ,   for   i j k
When the maximum interference-to-interference beatings are considered, the expressions of PIIN variances of (5) and (6) can be deducted as:
i P I I N u 2 = R 2 P s r 2 B M 2 N v λ c 2 ω λ c L 2 1 , ξ i = 1 R 2 P s r 2 B M 2 N v λ c 2 ω λ c L 2 , ξ i = 0
and
i P I I N l 2 = R 2 P s r 2 B M 2 N v ω + λ c L 2 1 , ξ i = 1 R 2 P s r 2 B M 2 N v λ c L 2 , ξ i = 0
From the above equations, the raised noises at a decoder’s upper and lower outputs during the detecting process of a SAC label stack were demonstrated. Each equation has two different expressions depending on whether label Ci is included in the stack received by decoder Ci (ξi = 1) or not (ξi = 1). The total PIIN also depended on the statistics of label selection, particularly on the LSP of the switched packet.
Thermal noise is characterized as a white Gaussian process with a zero mean. The PSD of thermal noise was denoted as NTN with the unit of W/Hz, and the noise power at the balanced detector output can be written as [33]:
i T N 2 = N T N B
As all decoder noises have identical and independent statistics, the total noise power at the receiver can be seen as the summation of (9)–(11).

3.2. Type I and Type II Errors Measurement

In the label-detection process, all labeled payload bits were down-converted to photocurrent to estimate the desired labeled status through balanced detection. The output photocurrent could be seen as the decision variable, with DC power of iL2 and AC power of <i2piin(u)> + <i2piin(l)> + <i2TN>. The current values of the S-decoded label signals were then averaged and compared to the decision threshold η, as shown in Figure 3.
Any error in estimating the desired label status in forwarding nodes degrades the switching performance. The node failure to switch a packet to the correct path due to noisy decoding leads to user dissatisfaction and complaints about switching services. Alternately, declaring a fault-switching decision when no packets exist in the path results in extensive and unnecessary retransmissions from the service provider. The investigated switching system was similar to a hypothesis testing scenario, where both Type I and Type II errors were considered. In this paper, two types of errors were defined and then analyzed by deriving the corresponding probabilities. In hypothesis testing, null and alternative hypotheses were employed to extrapolate whether the samples with mean x came from the matrix with mean μ0. The two hypotheses fitting the switching scenario were expressed as:
H 0 : μ R P s r ω M N H 1 : μ < R P s r ω M N
The sample mean x is calculated from S photocurrent values of the decoded label, and the matrix mean μ0 is defined as iL = RPsrw/MN of the label-matching condition. If the samples with mean x come from the matrix with mean μ0, or label code Ci is included in the input signals of decoder i, then H0 is true. However, due to noise effects, x has a significant deviation from μ0, resulting in rejecting H0 and accepting H1. This false case of exploration is known as the Type I error or α-error. The probability of Type I error, P(Accept H1|H0 is true), is denoted as α, also denoted as significance level [34]. Moreover, if label code Ci is not included in the input signals, the average decoder output would be zero, according to (3). In this case, the samples do not come from the matrix with mean μ0, so H0 is false, while H1 is true. However, if x is significantly close to μ0, an exploration error occurs, leading to the acceptance of H0. This is called the Type II error, with the probability denoted as β = P(Accept H0|H1 is true) [34].
In the decision-making process, based on the conclusion derived from the hypothesis, the probability of Type I errors varied with significance level α, which could be determined by adjusting the network parameters. However, the Type II error could not be directly controlled. Therefore, in decision-making situations, β was also considered for evaluation of the error probability of accepting null hypothesis H0; the smaller the values of α and β, the higher the testing accuracy. Moreover, the two probabilities were correlated. A minimum α value could be achieved if the label presence were always claimed, but the β value would be trivial. To demonstrate the trade-off between α and β, operating characteristic curves (OCCs) of the studied switching technology for different network parameters were plotted in the next section.
By definition, α is the probability of wrongly declaring the label absence when label i exists, or α = Pr(x(ξi = 1) ≤ η), where η is the decision threshold in Figure 3. Similarly, β is the probability of declaring label i presence when it does not exist, or β = Pr(ηx(ξi = 0)). Assuming that the distribution of the noise values is Gaussian, the sample mean x follows a Gaussian distribution with mean μ0 = iL and σn2 = <i2piin(u)> + <i2piin(l)> + <i2TN> for ξi = 0, 1. When η is chosen as (RPsrw/MN)/2, based on the definition of Type I error in [34], α can be written as:
α = Pr Z η i L σ n / S = Pr Z R P s r ω 2 M N σ n / S ,   for   ξ i = 1
where Z is the random variable following normalized Gaussian distribution, or Z ~ N(0,1). Based on the definition in [34], the probability of Type II error β, which considers the condition of H1 being true, is written as:
β = Pr Z η i L σ n / S = Pr Z R P s r ω 2 M N σ n / S ,   for   ξ i = 0

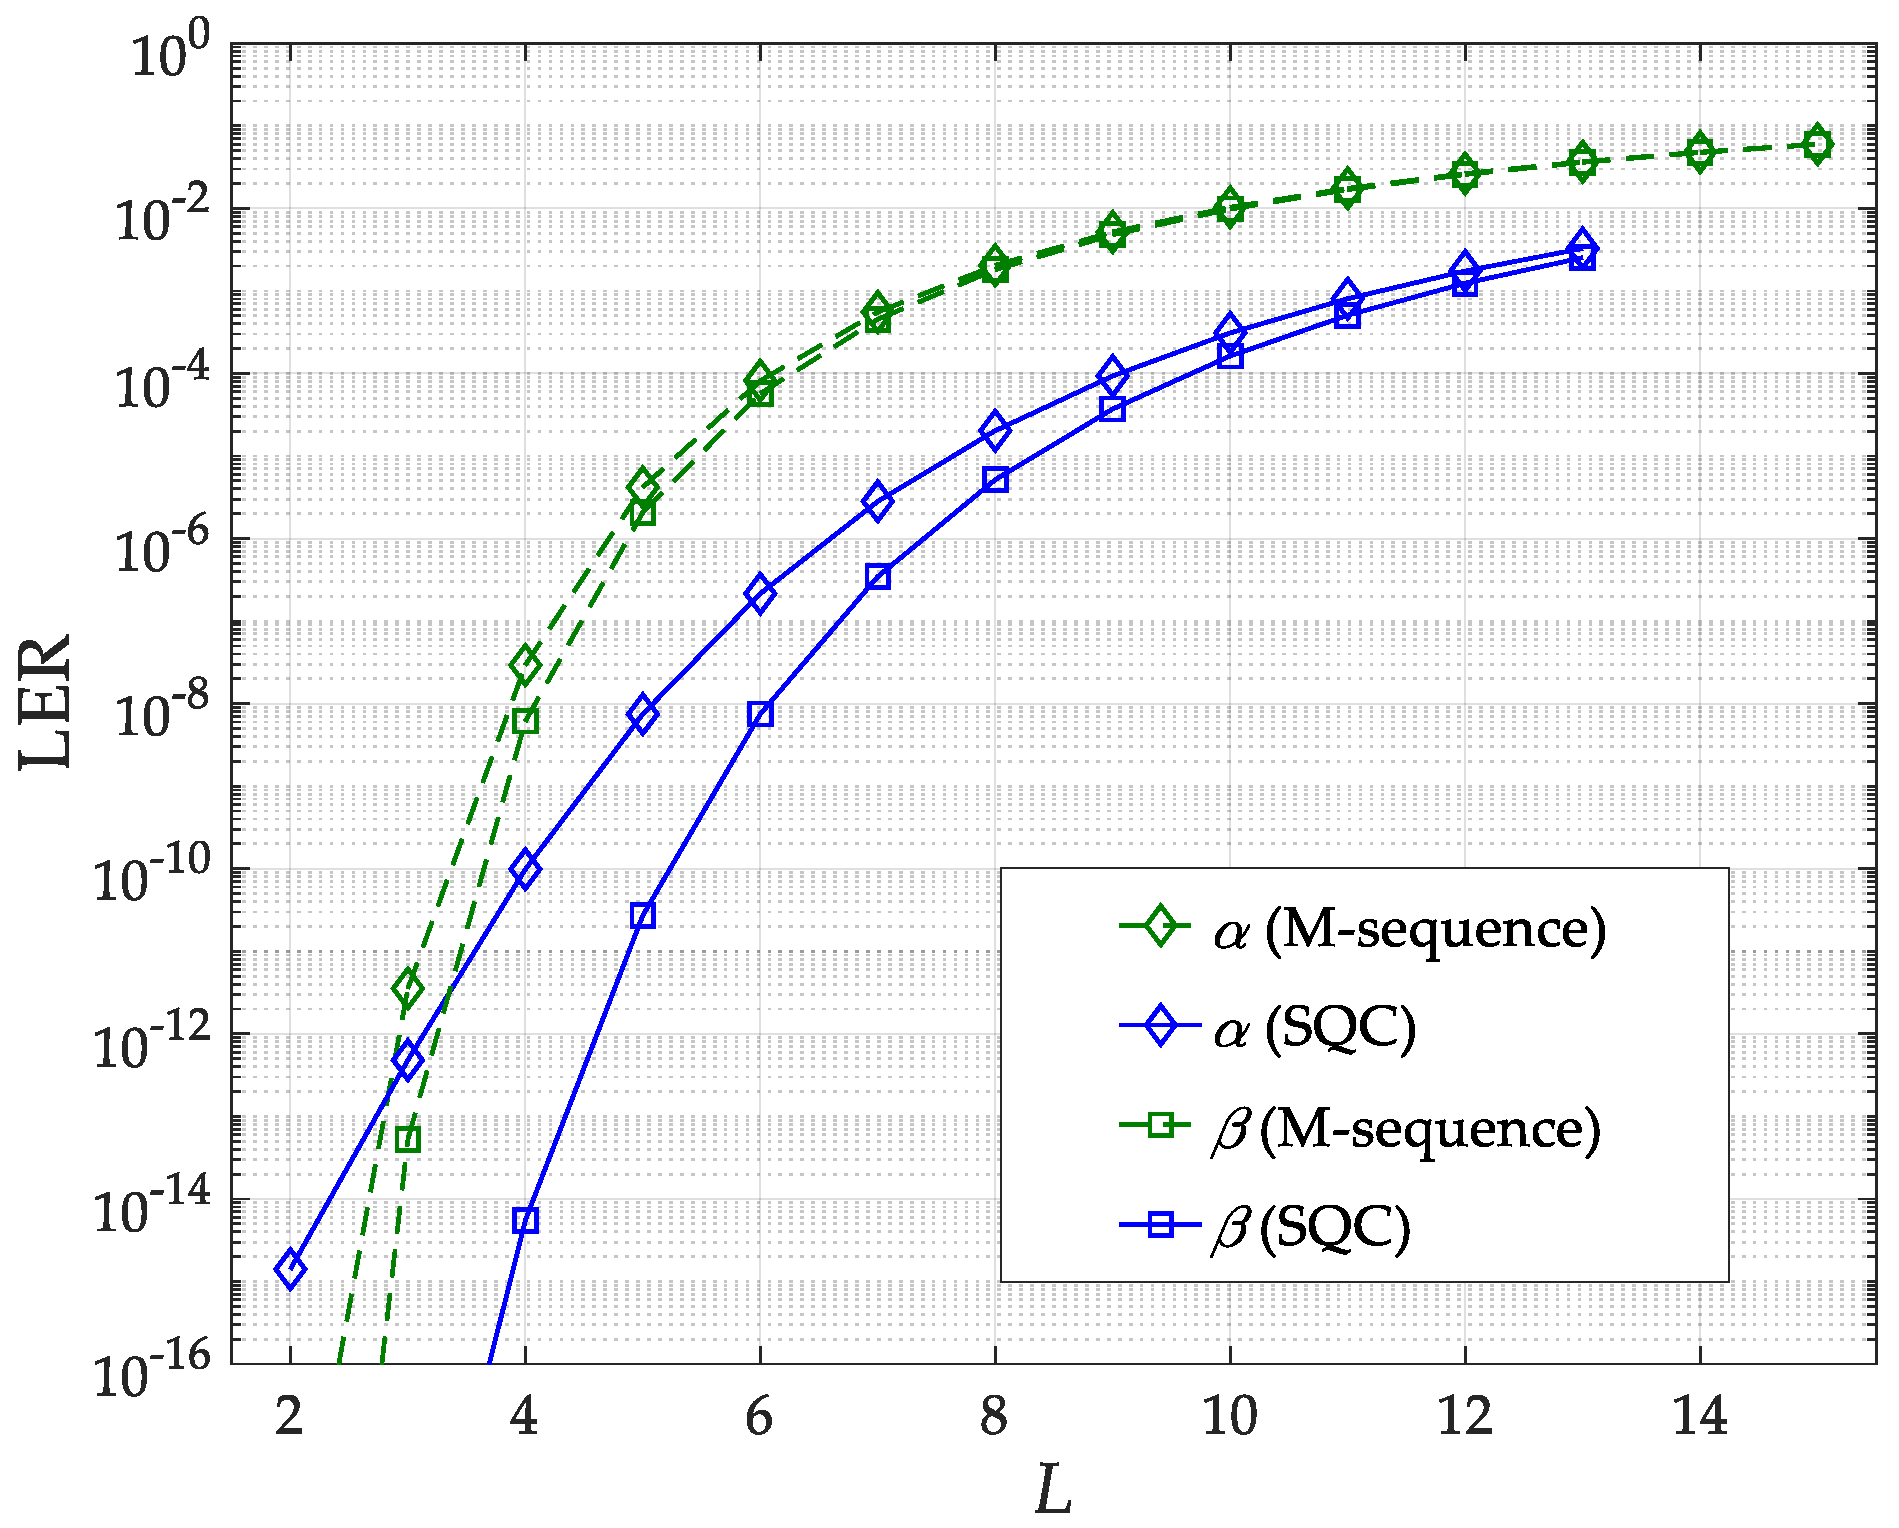
4. Numerical Results and Discussions

In Figure 4, the label error rates (LERs) in terms of Type I and II errors of the studied switching scenario versus the carried label number for different label codes are plotted. The lengths of the M-sequence and SQC labels were 15 and 13, respectively. The switched port number (M = 4) and the labeled bit number (S = 4) were considered. The performances of α and β for both codes were limited by the label number due to the increased detection noise. Compared to SQC, the difference between α and β for the M-sequence was relatively negligible. The noise elements causing Type II errors were solely signal-to-interference and interference-to-interference beatings, and the ones causing Type I errors had extra signal-to-signal beatings. Therefore, a significant gap existed between the α and β curves for SQC labels due to the higher weight-to-cross-correlation ratio. It was also observed that SQC labels provided more acceptable performance than M-sequence labels for both error indices. The reason was that SQC labels had lower cross-correlation values, inducing fewer beatings and contributing to the detection noises.
The LERs versus label power for both M-sequence and SQC schemes were plotted in Figure 5. Increasing the label power improved LERs due to the increased signal-to-noise ratio (SNR). However, the LERs could not be further lowered when the label power was greater than −4 dBm, since the power-dependent noise source of PIIN became dominant. It was observed that employing SQC labels led to considerable improvement in both types of switching errors due to the reduced PIIN variance.
Another interpretation of Figure 5 is that the wavelength-sensitive influences, such as four-wave mixing (FWM), could be modeled as the dissipated power in the label bandwidth. FWM appeared during the propagation of a SAC label expressed as a set of different carrier wavelengths. The wavelengths interacted with each other and induced the FWM sidebands. Although some sidebands were located inside, most of them were located outside the label bandwidth. Since the sideband components were contributed by the power transfer from the label wavelengths, the main effect of FWM can be approximated to the reduced power over the entire label bandwidth.
The LERs versus the number of switched paths for SQC labels are plotted in Figure 6. The stacked label number was chosen as L = 6. Increasing node outputs degraded α and β due to the increasing splitting loss in the switching process at forwarding nodes. However, despite higher error probabilities, a larger M indicated the switching process could be performed in a network with a larger size or a more complicated topology. Different labeled bit numbers, S = 2 and 4, were also considered. Increasing S led to a noticeable improvement in α and β. Therefore, implementing more labeled bits in an optical packet was a viable solution to keep switching performance acceptable for large network sizes.
In Figure 7, LERs versus the labeled bit number for SQC labels are plotted. For a large stacked number L, or equivalently high-received power at the decoding end, the performance was degraded by the large power of signal-dependent PIIN. As the labeled bit number increased, both error probabilities improved. For a large S, the dominant noise effect at the decoder was mitigated by repeating the decoding process of the specific label information. For high-noise power or low-photocurrent mean, such as a large L or a large M, the increased sample number of optical labels could still provide performances with low α and β. However, a larger S indicated that more payload bits in a packet went through the labeling, leading to moderate power loss in the encoding process.
In Figure 4, Figure 5, Figure 6 and Figure 7, the threshold of the comparator in Figure 3 is fixed to iL/2 for ξi = 1. Varying the threshold values demonstrated the OCC, with each point corresponding to a specific choice of α and β. Figure 8 shows the OCCs of switching configurations based on M-sequence and SQC labels. OCCs tend to be flat as the threshold lowers. Employing SQC labels advances OCCs, as the detection noises are suppressed by their low cross-correlation value. For a given L, requiring a small α of SQC, labels remained at a low β, indicating a better performance than M-sequence labels.
In Figure 9, OCCs of the switching system with SQC labels are plotted. The OCCs were considerably advanced when the number of labeled bits S increased. For S = 6, a small α = 10−10 could be achieved, and the probability of Type II error was kept very low simultaneously (β = 10−11). Increasing the labeled bit number S reduced the β value for a given α, resulting in an improved OOC curve. As illustrated in Figure 7 and Figure 8, both employing low-cross-correlation codes, such as SQC, and labeling more payload bits supported the switching service with low-operation costs while satisfying the error performance of packet loss. In the above figures, the common parameters used for demonstrating the results were shown in Table 1.

5. Conclusions

This paper analyzed the performance of a SAC-based switching technique that provided an OPS network with a promising switching solution. Detection noises and practical network parameters were included in the analysis model. The effects of wavelength beatings in the square-law photodetection process of optical labels were mainly considered in terms of the noise of PIIN. Using the label-detection scheme, combined with hypothesis testing, the importance of the stacked label, switched port, label bit numbers, and code types on the switching performance was addressed.
Probabilities of Type I and II errors demonstrating incorrect switching scenarios were interpreted as LER. For a given set of simulation parameters, the probability of a Type I error is greater than a Type II error due to the signal beating contributing to an extra PIIN variance. Both LERs were increased with the label number as the increased noise power was induced. Moreover, the performance of LER degraded for an increased switched port number due to the high-insertion loss. However, the limitations of the label and switched port numbers on LER can be relieved by increasing the labeled bit number. The OOC curves showed the tradeoff between the probabilities of Type I and II errors. The conditions for achieving a better OOC fitted the results of LER analysis, such as employing low-cross-correlation code in labeling and increasing the labeled bit number.

Author Contributions

Conceptualization, methodology, writing, K.-S.C.; validation and formal analysis, C.-L.P. All authors have read and agreed to the published version of the manuscript.

Funding

This research was funded by the Guangzhou Municipal Science and Technology Bureau, grant number 202002030464, and the Guangdong Engineering Technology Center of Regular Universities, grant number 2021GCZX001. The APC was funded by 202002030464.

Institutional Review Board Statement

Not applicable.

Informed Consent Statement

Not applicable.

Data Availability Statement

The data presented in this study are available upon request from the corresponding author.

Conflicts of Interest

The authors declare no conflict of interest.

References

  1. Meyer, H.; Sancho, J.C.; Mrdakovic, M.; Miao, W.; Calabretta, N. Optical packet switching in HPC. An analysis of applications performance. Future Gener. Comp. Sys. 2018, 82, 606–616. [Google Scholar] [CrossRef]
  2. Andreades, P.; Clark, K.; Watts, P.M.; Zervas, G. Experimental demonstration of an ultra-low latency control plane for optical packet switching in data center networks. Opt. Switch. Netw. 2019, 32, 51–60. [Google Scholar] [CrossRef]
  3. Minakhmetov, A.; Ware, C.; Iannone, L. Hybrid and optical packet switching supporting different service classes in data center network. Photonic Netw. Commun. 2020, 40, 293–302. [Google Scholar] [CrossRef]
  4. Tsakyridis, A.; Terzenidis, N.; Giamougiannis, G.; Moralis-Pegios, M.; Vyrsokinos, K.; Pleros, N. 25.6 Tbps capacity and sub-µsec latency switching for datacenters using >1000-port optical packet switch architectures. IEEE J. Sel. Top. Quant. 2020, 27, 3600211. [Google Scholar] [CrossRef]
  5. Minakhmetov, A.; Ware, C.; Iannone, L. TCP congestion control in datacenter optical packet networks on hybrid switches. J. Opt. Commun. Netw. 2018, 10, B71–B81. [Google Scholar] [CrossRef]
  6. Wang, L.; Wang, X.; Tornatore, M.; Kim, K.J.; Kim, S.M.; Kim, D.U.; Han, K.E.; Mukherjee, B. Scheduling with machine-learning-based flow detection for packet-switched optical data center networks. J. Opt. Commun. Netw. 2018, 10, 365–375. [Google Scholar] [CrossRef]
  7. Moralis-Pegios, M.; Terzenidis, N.; Mourgias-Alexandris, G.; Vyrsokinos, K.; Pleros, N. A 1024-port optical uni-and multicast packet switch fabric. J. Light. Technol. 2019, 37, 1415–1423. [Google Scholar] [CrossRef]
  8. Singh, S.; Wason, A. Performance investigations on data protection algorithms in generalized multi-protocol label switched optical networks. Sci. Rep. 2023, 13, 425. [Google Scholar]
  9. Singh, S.; Wason, A. Performance evaluation of bandwidth allocating algorithms in generalized multi-protocol label switched optical networks to enhance quality of service. IEEE Access 2022, 10, 40731–40742. [Google Scholar]
  10. Reddy, M.B.; Thangaraj, J.; Priye, V. Multiservice provisioning optical code switched generalized multiprotocol label switching optical networks. Wirel. Pers. Commun. 2023, 128, 1651–1669. [Google Scholar] [CrossRef]
  11. Hadian, A.; Bagherian, M.; Ayat, S.S. A new mathematical model considering the multi-protocol label switching and the routing and spectrum allocation problems jointly in elastic optical networks. Photonic Netw. Commun. 2022, 44, 10–20. [Google Scholar] [CrossRef]
  12. Bhumi Reddy, M.; Thangaraj, J.; Priye, V. Connection provisioning for PCE-based GMPLS optical networks. Wirel. Pers. Commun. 2018, 103, 2775–2790. [Google Scholar] [CrossRef]
  13. Zaman, F.A.; Jarray, A.; Karmouch, A. Software defined network-based edge cloud resource allocation framework. IEEE Access 2019, 7, 10672–10690. [Google Scholar] [CrossRef]
  14. Lallas, E.N. A survey on all optical label swapping techniques: Comparison and trends. Opt. Switch. Netw. 2019, 31, 22–38. [Google Scholar] [CrossRef]
  15. Matthew, M.; Dummer, J.K.; Anna, T.P.; Larry, A.C. 40 Gb/s field-modulated wavelength converters for all-optical packet switching. IEEE J. Sel. Top. Quant. Electron. 2009, 15, 494–503. [Google Scholar]
  16. Calabretta, N.; Jung, H.D.; Llorente, J.H.; Tangdiongga, E.; Koonen, T.A.; Dorren, H.J. All-optical label swapping of scalable in-band address labels and 160-Gb/s data packets. J. Light. Technol. 2009, 27, 214–223. [Google Scholar] [CrossRef]
  17. Kodama, T.; Cincotti, G. Hybrid QAM-based labels generated by two multi-level PSK codes. IEICE Trans. Commun. 2019, 102, 2199–2204. [Google Scholar] [CrossRef]
  18. Surenkhorol, T.; Kishikawa, H.; Goto, N.; Gonchigsumlaa, K. Waveguide-type optical circuits for recognition of optical 8QAM-coded label. Opt. Eng. 2017, 56, 107101. [Google Scholar] [CrossRef]
  19. Lu, Y.; Wang, Y.; Hu, L.; Du, X.; Li, J.; Li, H.; Bi, M. Optical label switching based on Manchester code+ NRZ modulation. Opt. Fiber Technol. 2021, 61, 102387. [Google Scholar] [CrossRef]
  20. Matsumoto, R.; Kodama, T.; Morita, K.; Wada, N.; Kitayama, K.I. Scalable two-and three-dimensional optical labels generated by 128-port encoder/decoder for optical packet switching. Opt. Express 2015, 23, 25747–25761. [Google Scholar] [CrossRef]
  21. Huang, S. Variable-bandwidth optical paths: Comparison between optical code-labelled path and OCDM path. J. Light. Technol. 2006, 24, 3563–3573. [Google Scholar] [CrossRef]
  22. Seddighian, P.; Ayotte, S.; Rosas-Fernandez, J.B.; Penon, J.; Rusch, L.A.; LaRochelle, S. Label stacking in photonic packet-switched networks with spectral amplitude code labels. J. Light. Technol. 2007, 25, 463–471. [Google Scholar] [CrossRef]
  23. Farghal, A.E.; Shalaby, H.M.; Kawasaki, Z. Multirate multiservice all-optical code switched GMPLS core network utilizing multicode variable-weight optical code-division multiplexing. J. Opt. Commun. Netw. 2014, 6, 670–683. [Google Scholar] [CrossRef]
  24. Beyranvand, H.; Salehi, J.A. Application of optical multilevel transmission technique in WDM/OCDM-based core networks. IEEE Commun. Mag. 2014, 52, 116–125. [Google Scholar] [CrossRef]
  25. Kazemi, R.; Rashidinejad, A.; Nashtaali, D.; Salehi, J.A. Virtual optical buffers: A novel interpretation of OCDMA in packet switch networks. J. Light. Technol. 2012, 30, 2964–2975. [Google Scholar] [CrossRef]
  26. Farghal, A.E.; Shalaby, H.M.; Kato, K.; Pokharel, R.K. Performance analysis of multicode OCDM networks supporting elastic transmission with QoS differentiation. IEEE Trans. Commun. 2015, 64, 741–752. [Google Scholar] [CrossRef]
  27. Sharma, T.; Kumar Maddila, R. Optical code construction based on enhanced quantum logic gate (EQLG) technique for spectral amplitude coding optical CDMA systems. Wirel. Pers. Commun. 2020, 113, 2587–2609. [Google Scholar] [CrossRef]
  28. Cherifi, A.; Jellali, N.; Najjar, M.; Aljunid, S.A.; Bouazza, B.S. Development of a novel two-dimensional-SWZCC–Code for spectral/spatial optical CDMA system. Opt. Laser Technol. 2019, 109, 233–240. [Google Scholar] [CrossRef]
  29. Ahmed, H.Y.; Zeghid, M.; Imtiaz, W.A.; Sharief, Y.; Abdalla, O.M. A configurable transmitter-receiver structure to support QoS for spectral amplitude coding-optical code division multiple access. Opt. Fiber Technol. 2020, 58, 102232. [Google Scholar] [CrossRef]
  30. Rosas-Fernández, J.B.; Ayotte, S.; Rusch, L.A.; LaRochelle, S. Ultrafast forwarding architecture using a single optical processor for multiple SAC-label recognition based on FWM. IEEE J. Sel. Top. Quant. 2008, 14, 868–878. [Google Scholar] [CrossRef]
  31. Chen, K.S. Packet switching strategy and node architecture of extended spectral-amplitude-coding labels in GMPLS networks. Appl. Sci. 2019, 9, 1513. [Google Scholar] [CrossRef]
  32. Chen, K.S. Implicit label number for optical packets in label switching networks based on spectral amplitude coding and OCDM path. IEEE Photonics J. 2022, 14, 7239807. [Google Scholar] [CrossRef]
  33. Wei, Z.; Shalaby, H.M.H.; Ghafouri-Shiraz, H. Modified quadratic congruence codes for fiber Bragg-grating-based spectral-amplitude-coding optical CDMA systems. J. Light. Technol. 2001, 19, 1274. [Google Scholar]
  34. DeGroot, M.H.; Schervish, M.J. Probability and Statistics; Pearson Education: London, UK, 2012. [Google Scholar]
Figure 1. Principle of the investigated SAC-based switching technique. BLS: broadband light source; OM: optical modulator; Enc: encoder; PCS: passive combiner/splitter; Dec; decoder; FDL: fiber delay line.
Photonics 10 00613 g001
Figure 2. Implementations of SAC (a) encoding and (b) decoding operation. FBG: fiber Bragg grating; PD: photodetector.
Photonics 10 00613 g002
Figure 3. Illustration of the label decoding structure.
Photonics 10 00613 g003
Figure 4. Label error rates (LERs) versus the stacked label number for different coding schemes.
Photonics 10 00613 g004
Figure 5. LERs versus the label power for different coding schemes.
Photonics 10 00613 g005
Figure 6. LERs versus the switched path number for SQC labels.
Photonics 10 00613 g006
Figure 7. LERs versus the labeled bit number for SQC labels.
Photonics 10 00613 g007
Figure 8. OCCs for packet switching with different coding schemes.
Photonics 10 00613 g008
Figure 9. OCC for packet switching with different labeled bit numbers.
Photonics 10 00613 g009
Table 1. Common parameters for numerical simulations.
ParameterValueUnit
Responsivity0.745A/W
Effective power−10dBm
Line-width of light source3.75THz
Electrical bandwidth10GHz
PSD of thermal noise1.706 × 10−23W/Hz
Disclaimer/Publisher’s Note: The statements, opinions and data contained in all publications are solely those of the individual author(s) and contributor(s) and not of MDPI and/or the editor(s). MDPI and/or the editor(s) disclaim responsibility for any injury to people or property resulting from any ideas, methods, instructions or products referred to in the content.

