Photobiomodulation Therapy Mitigates Salivary Gland Damage Induced by Radioactive Iodine Ablation

 , and
, and 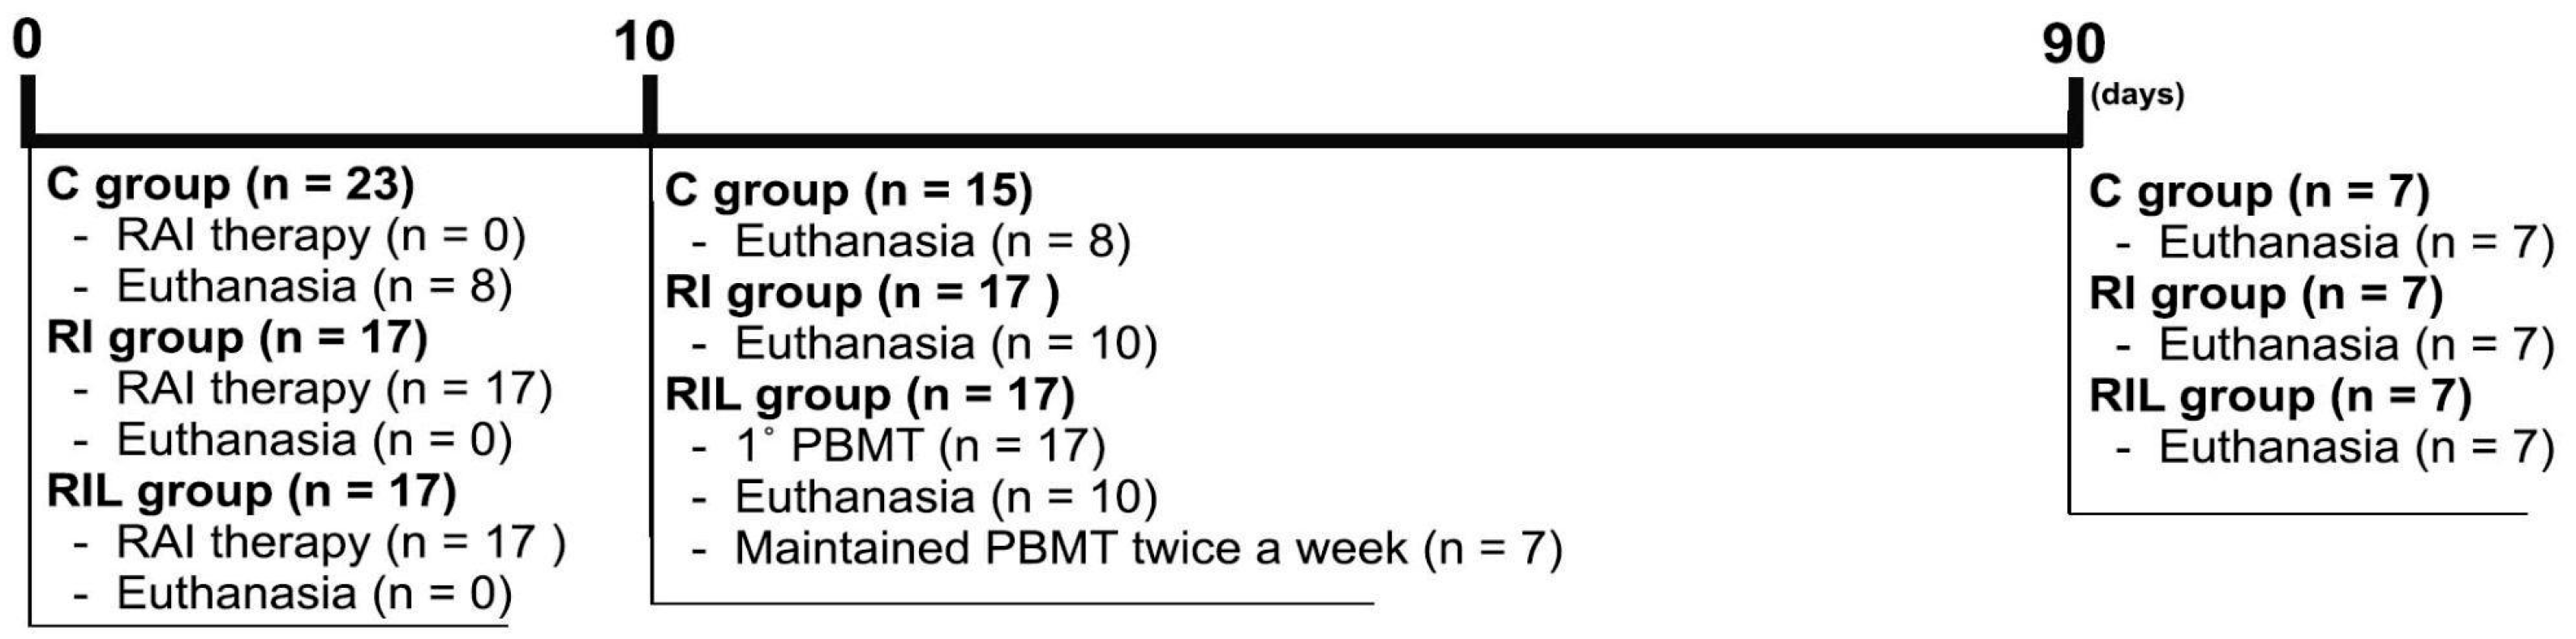
Abstract
:1. Introduction
2. Materials and Methods
2.1. Animals
2.2. PBMT Protocol
2.3. Clinical Analysis
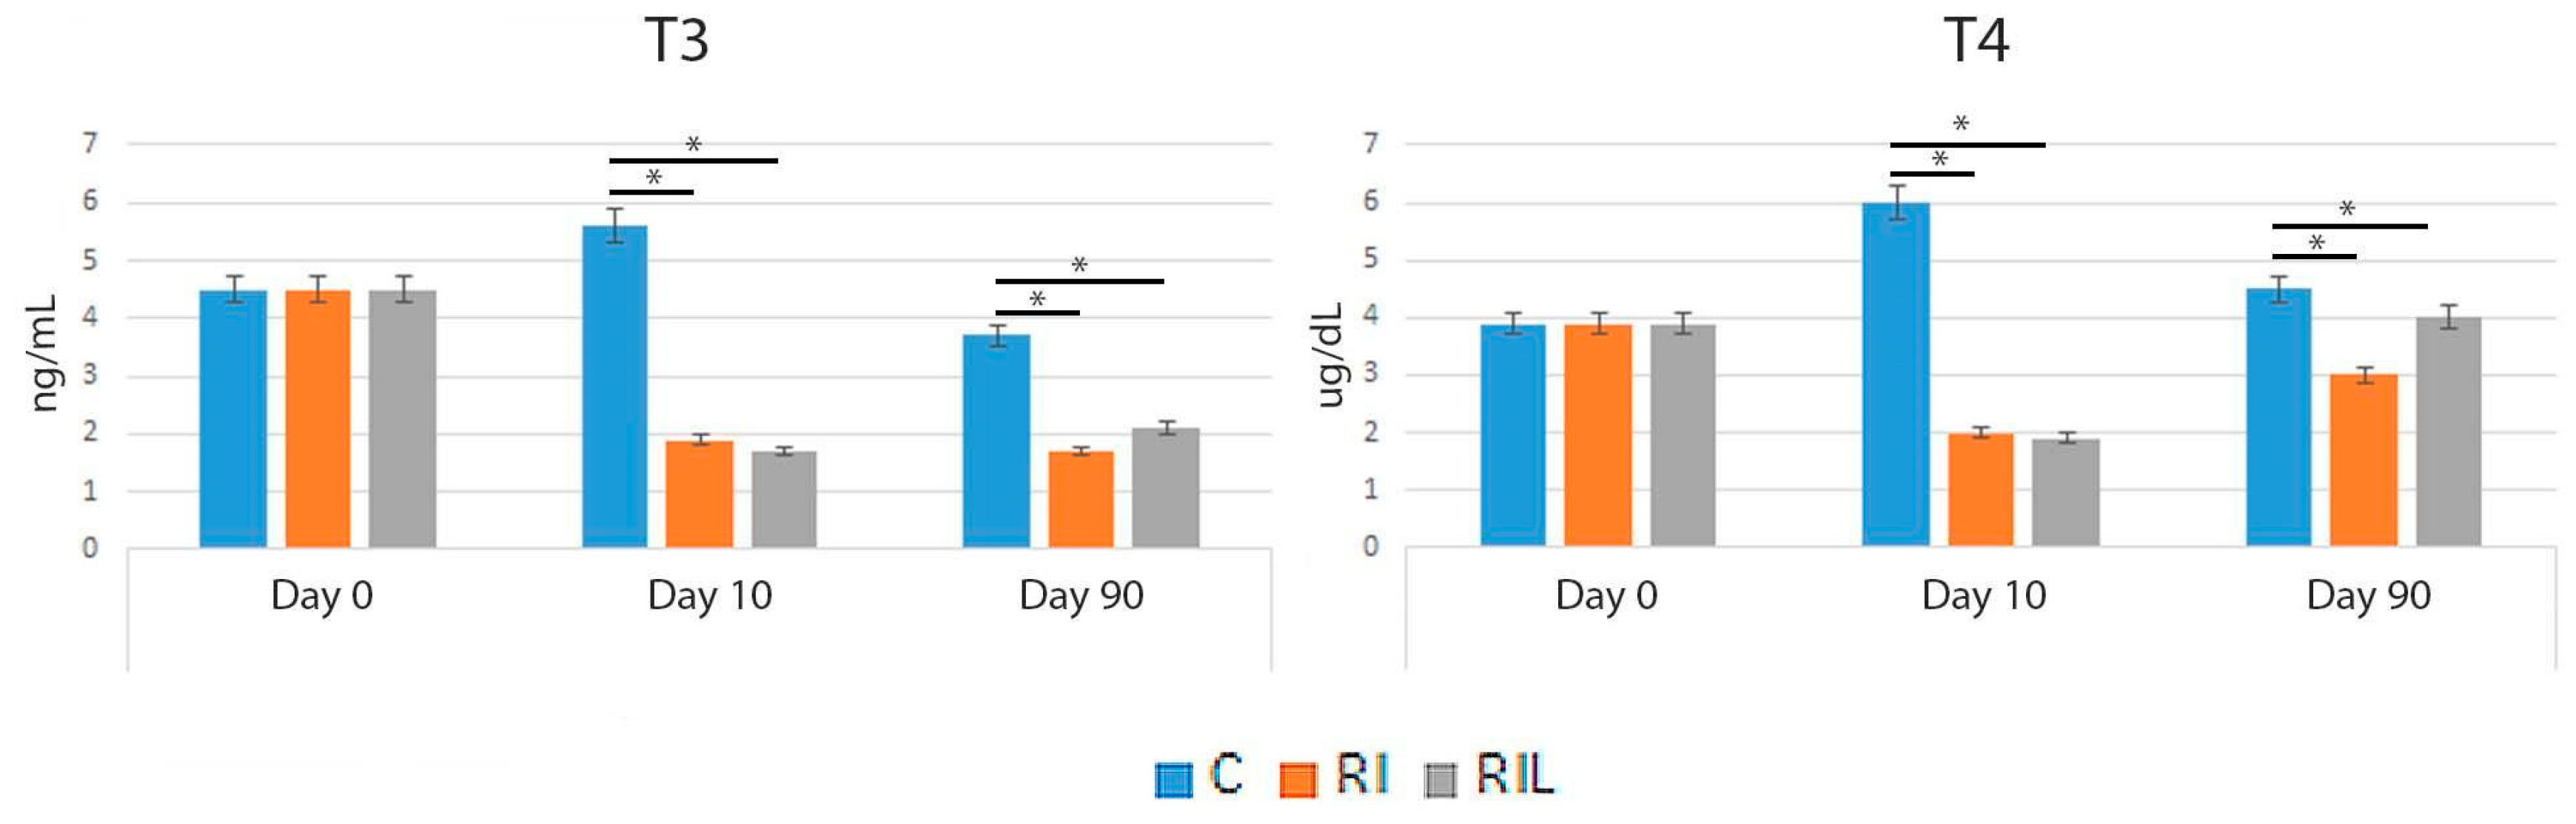
2.4. Tri-iodothyronine (T3) and Thyroxine (T4) Serum Levels
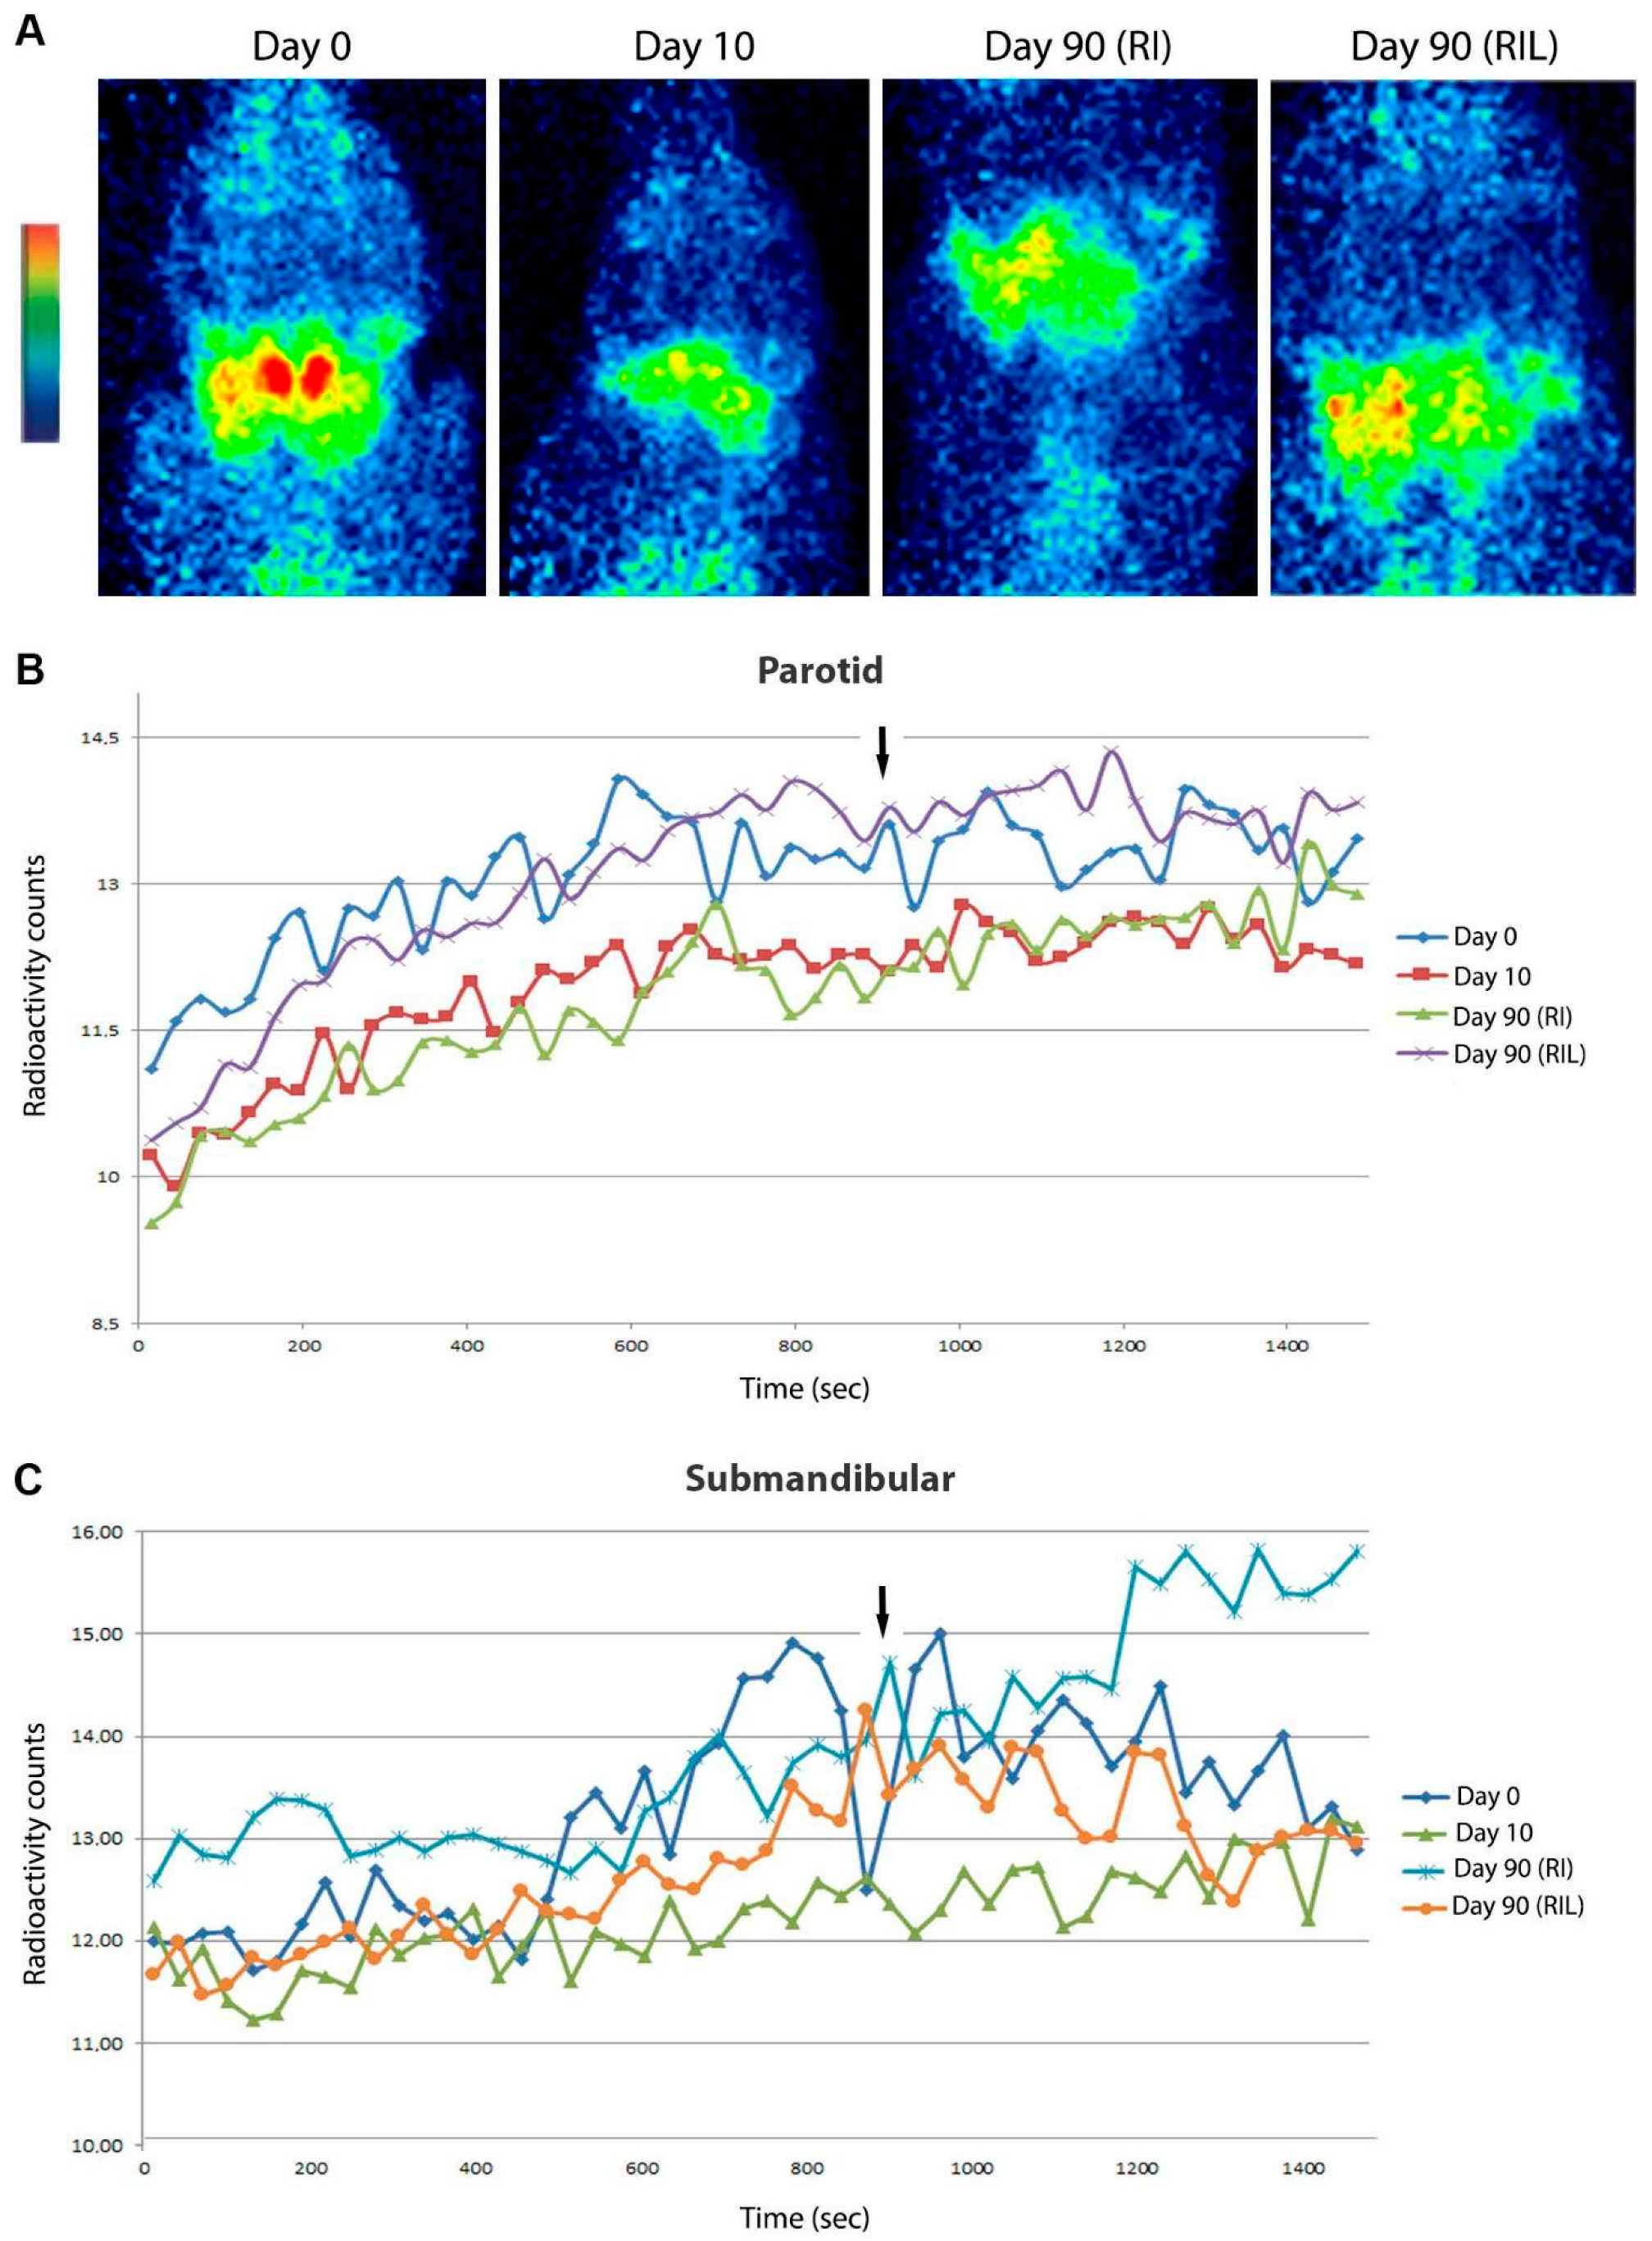
2.5. Planar Scintigraphy Imaging
2.6. Biochemical Analysis
2.7. Histological Analysis
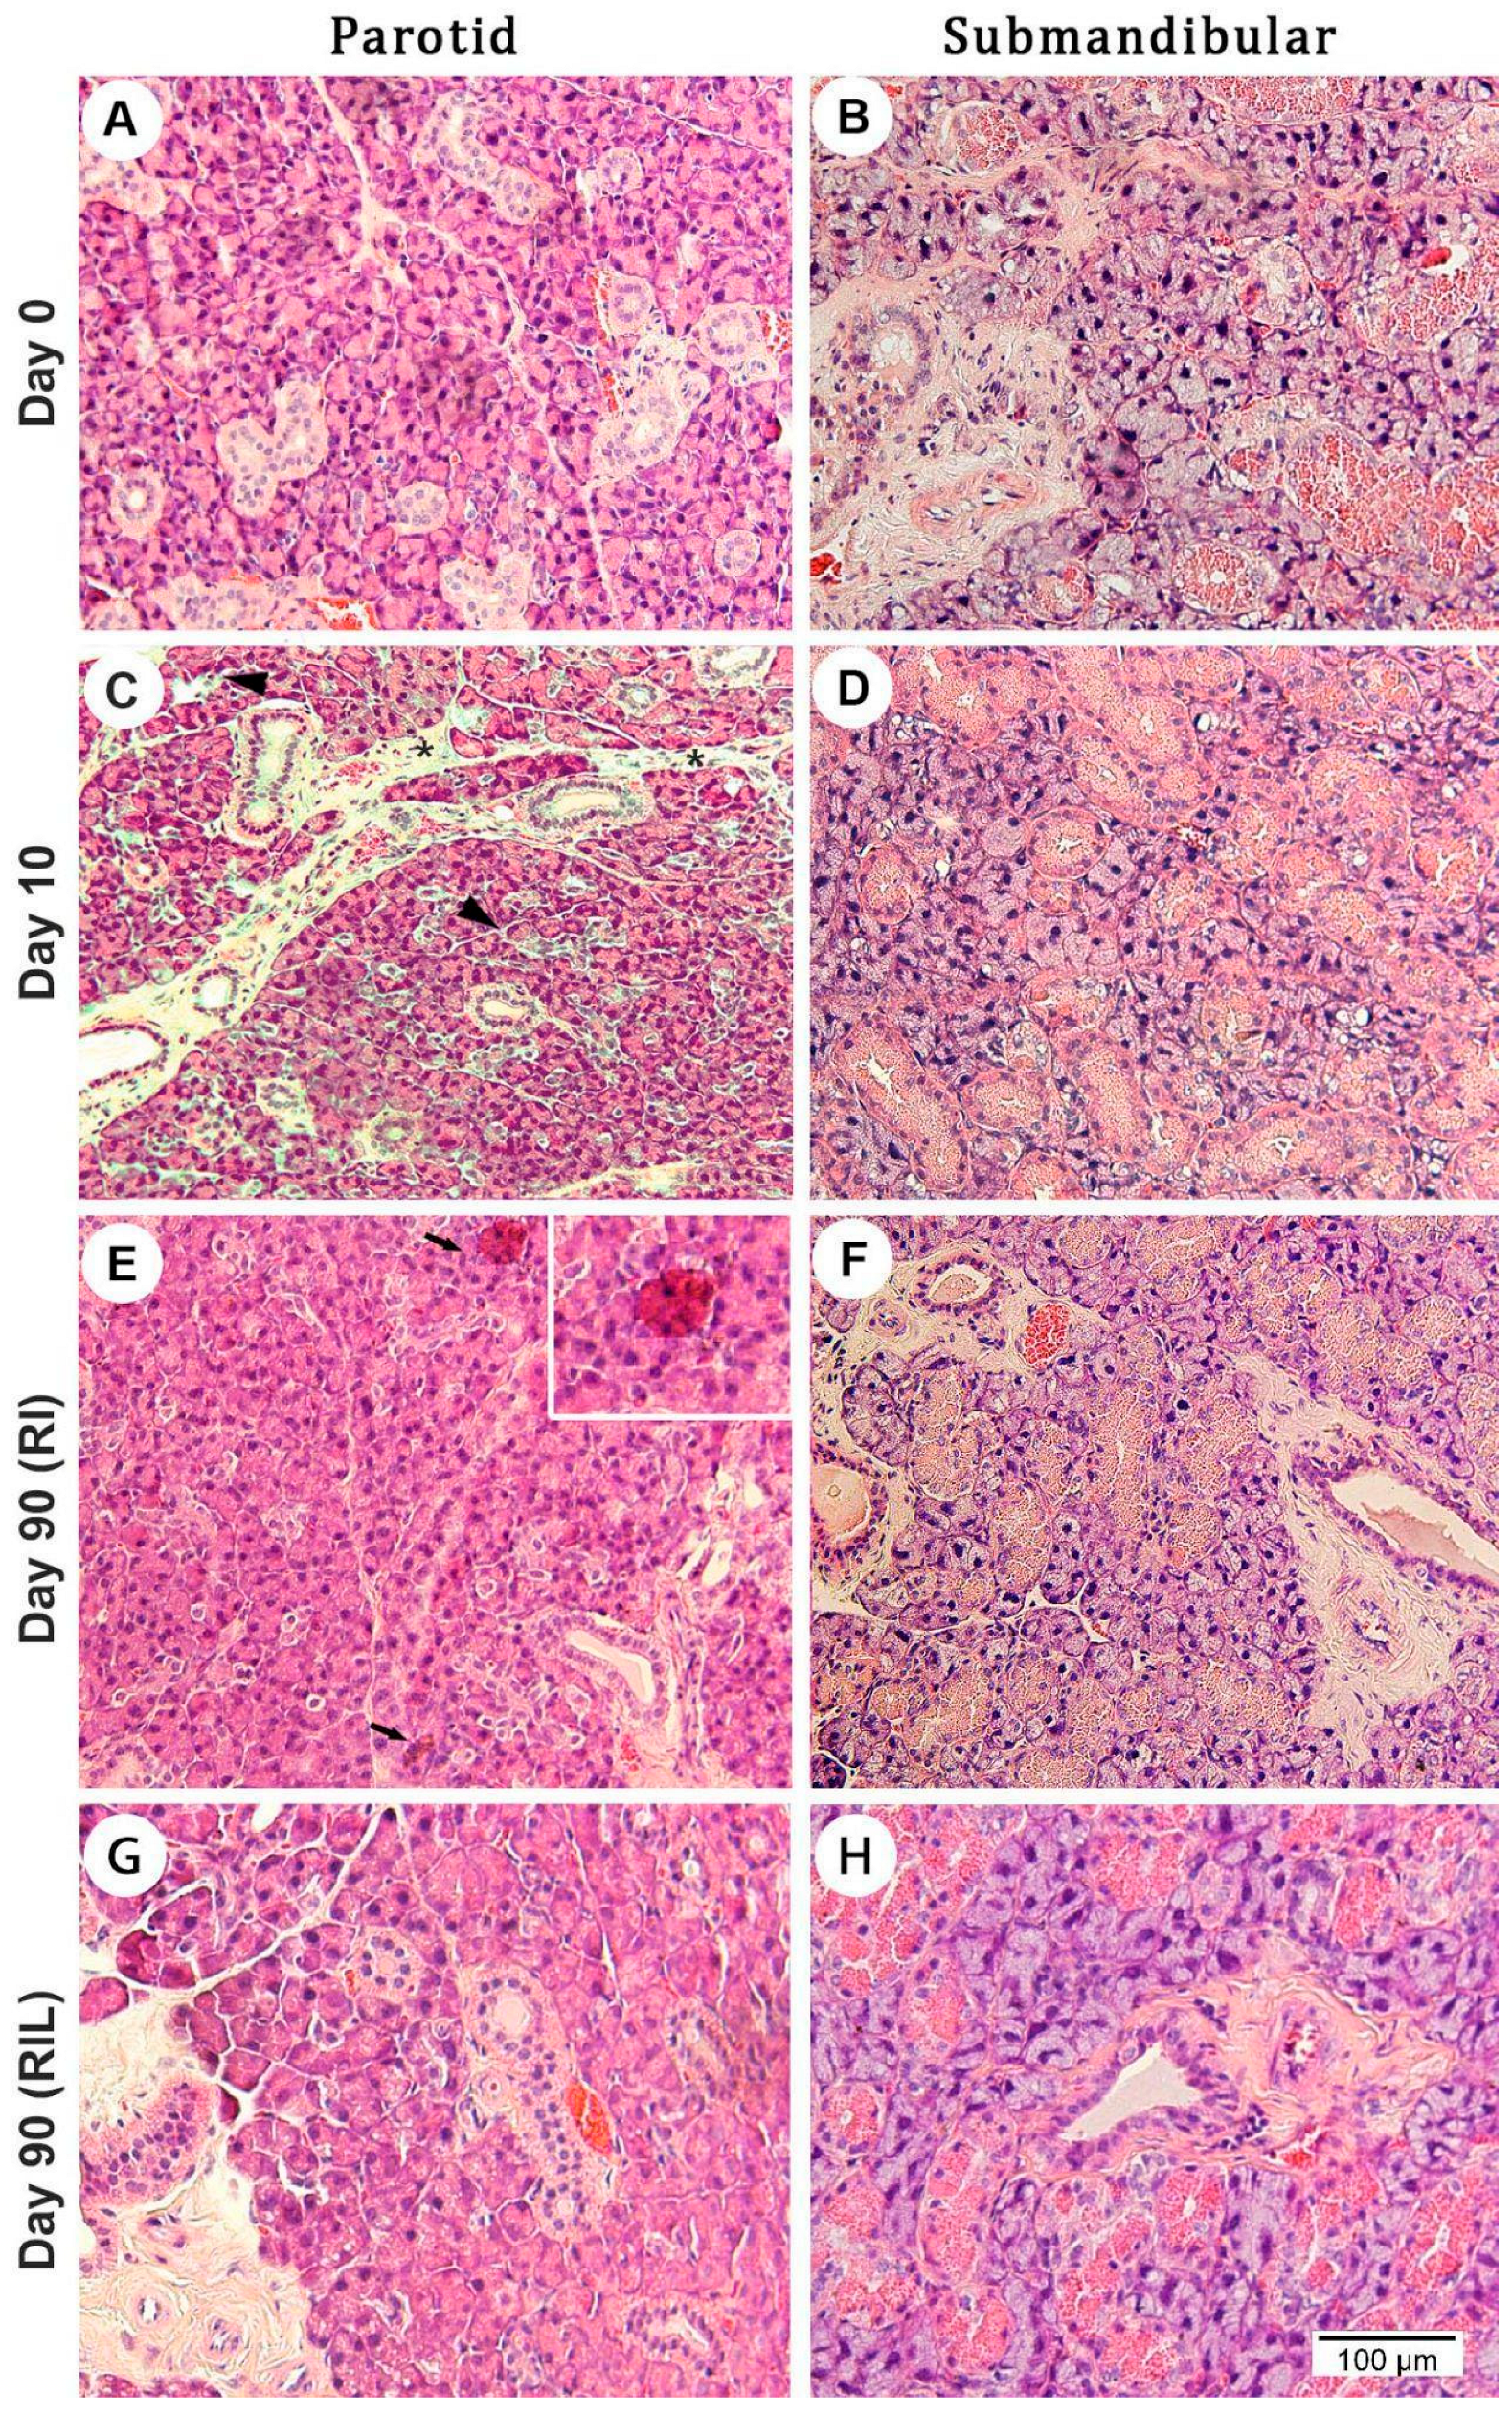
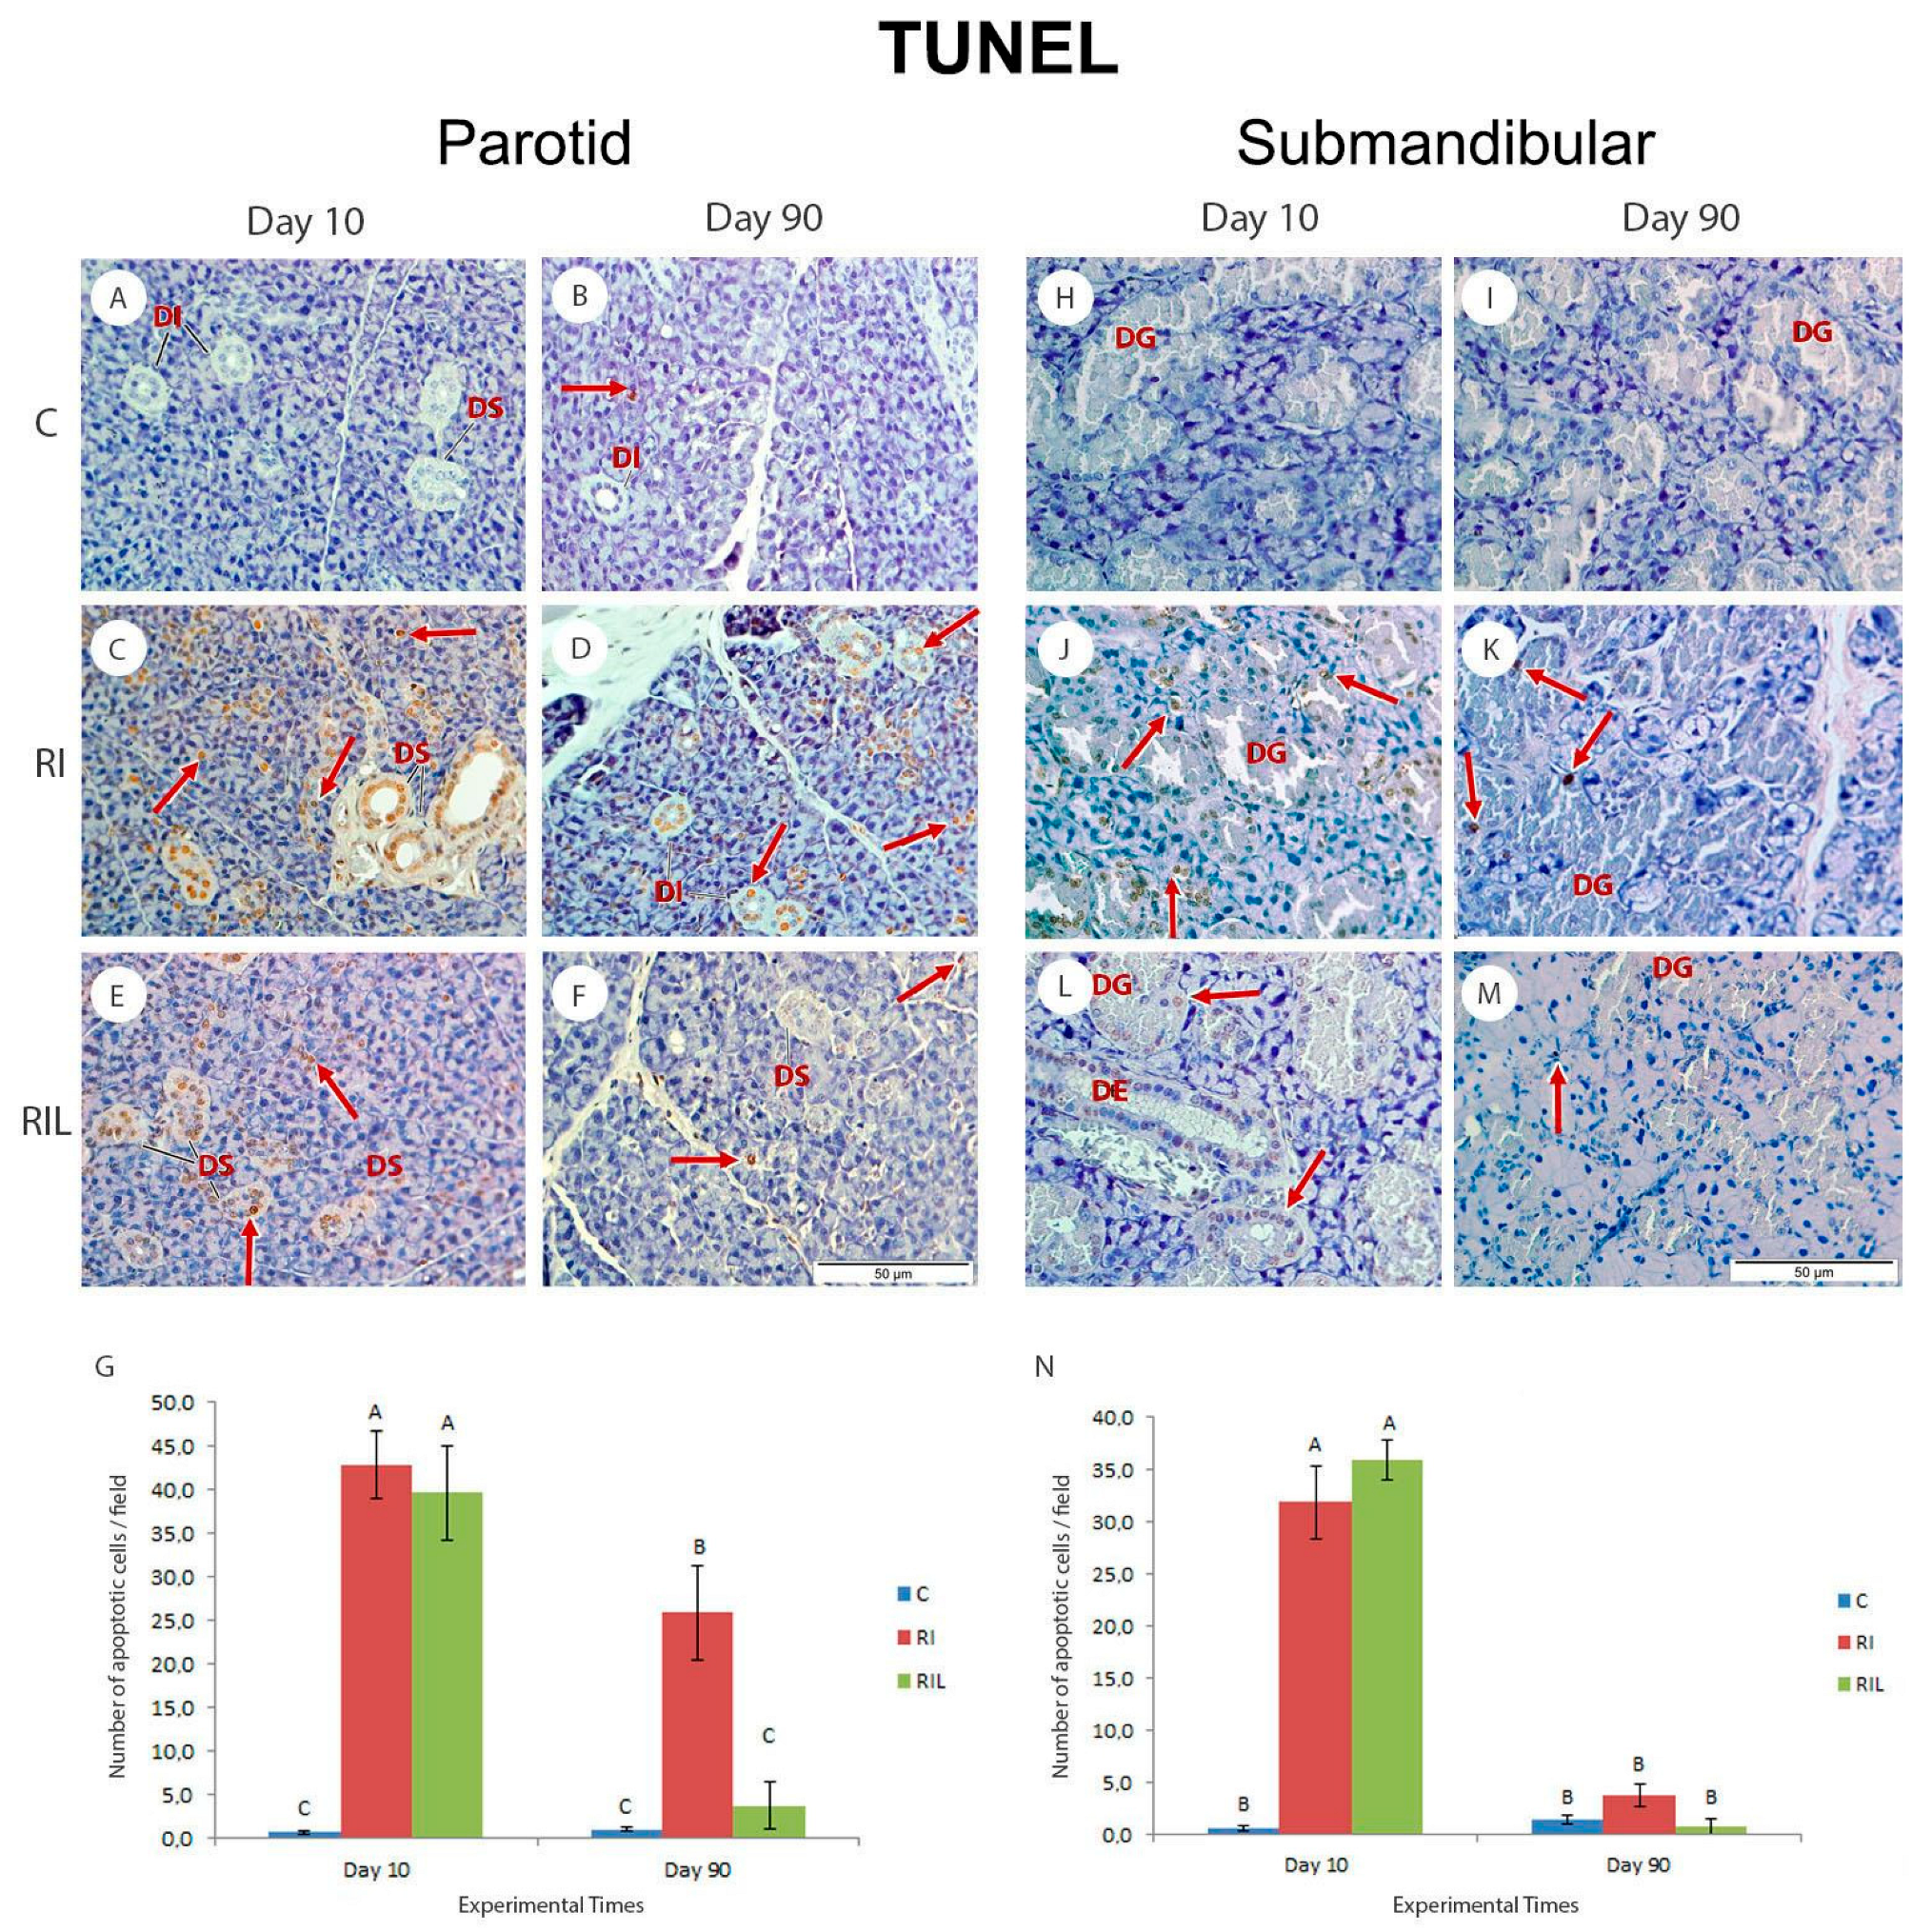
2.7.1. Morphological Analysis and the TUNEL Assay
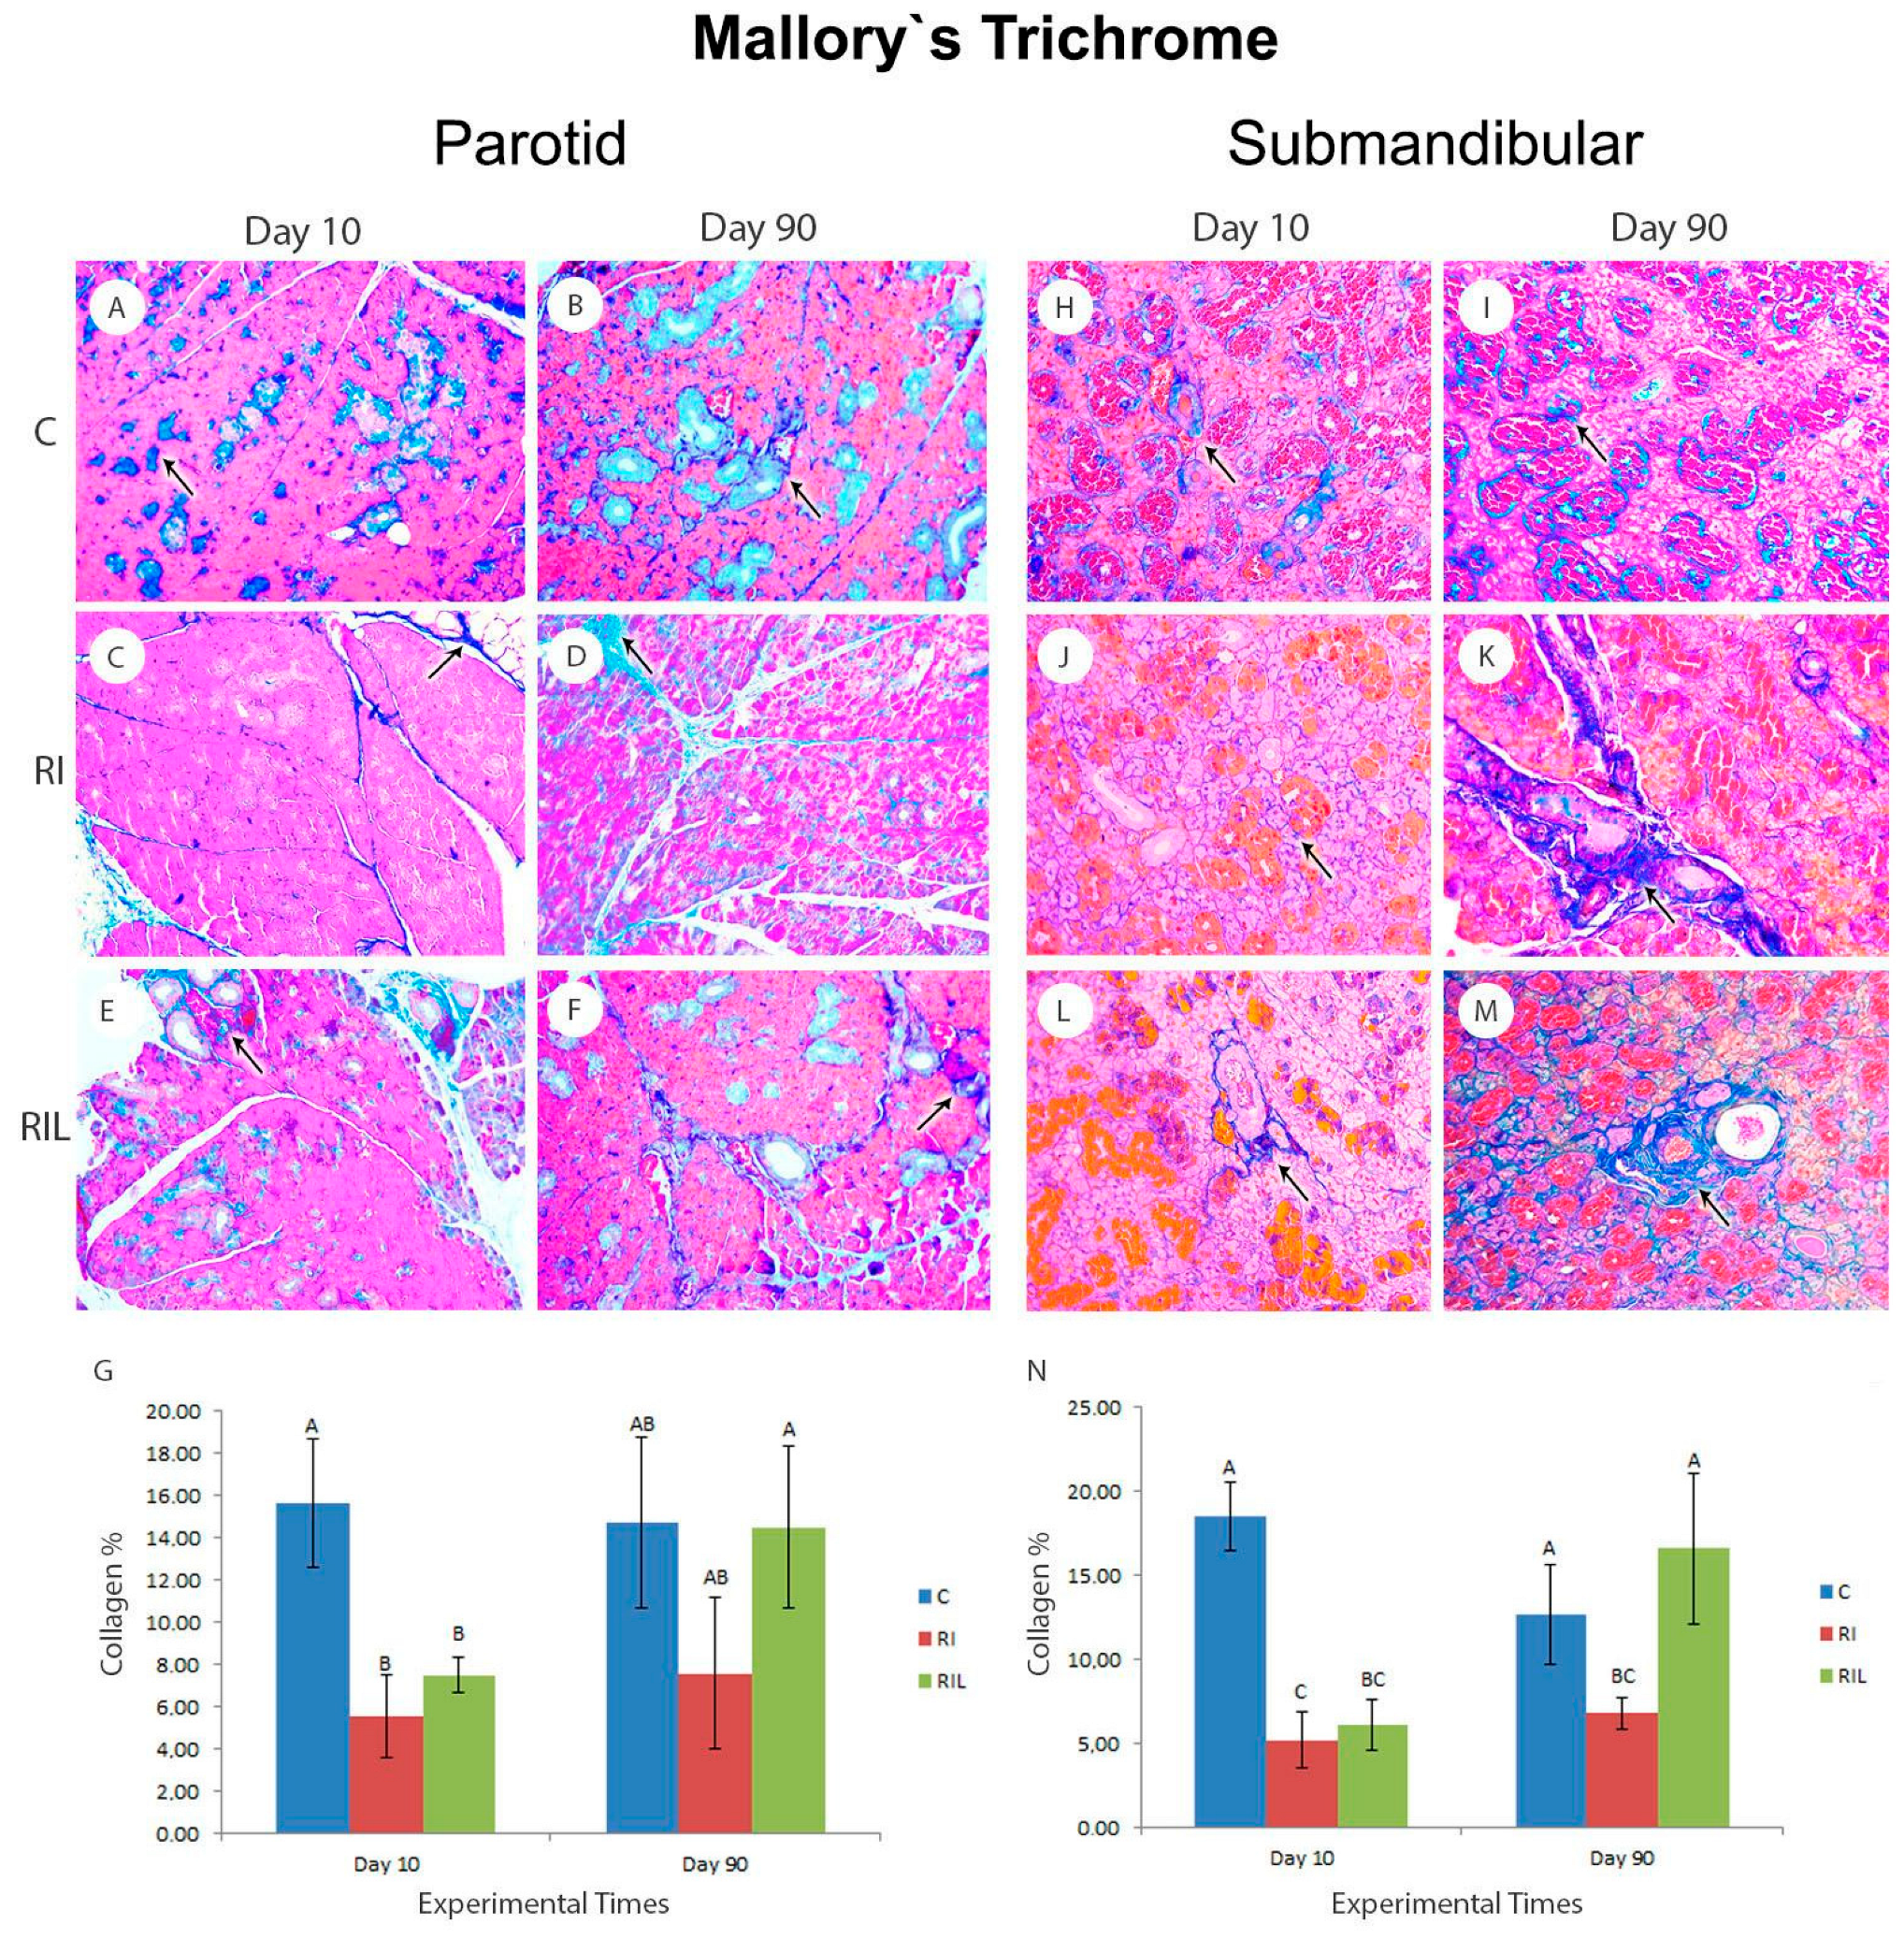
2.7.2. Mallory’s Trichrome Deconvolution
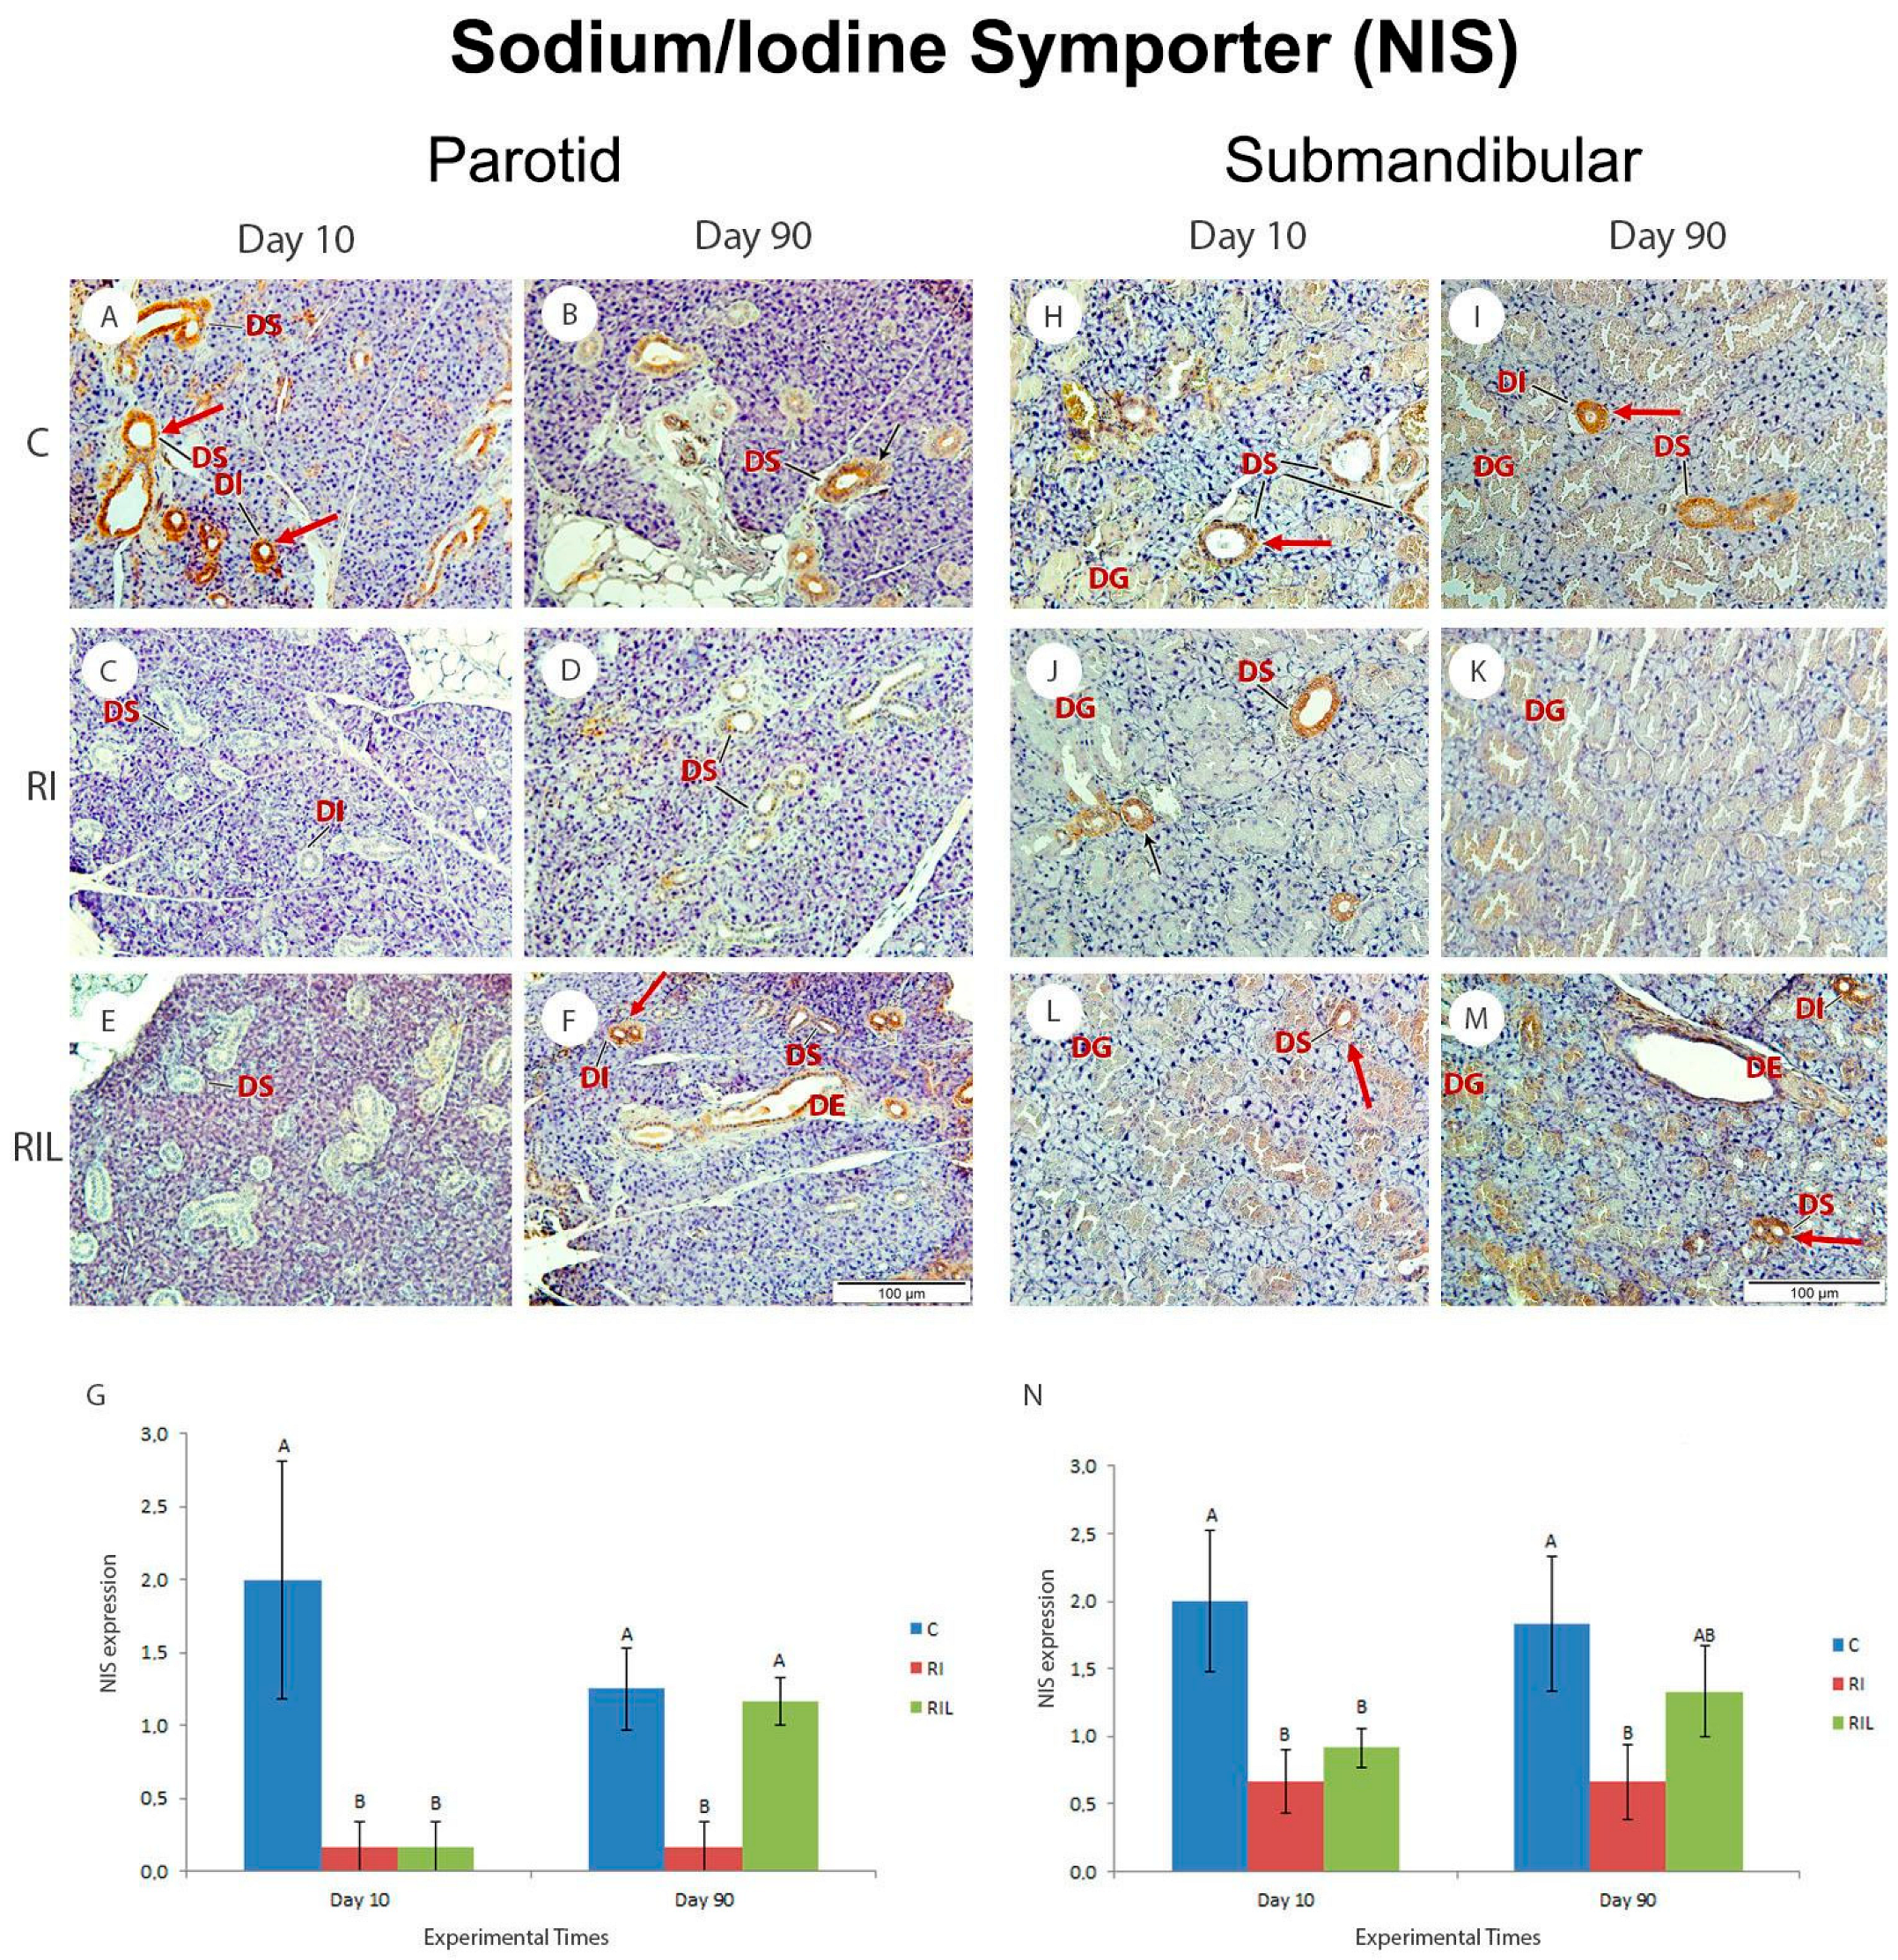
2.8. Immunohistochemical Analysis-NIS
2.9. Statistical Analysis
3. Results
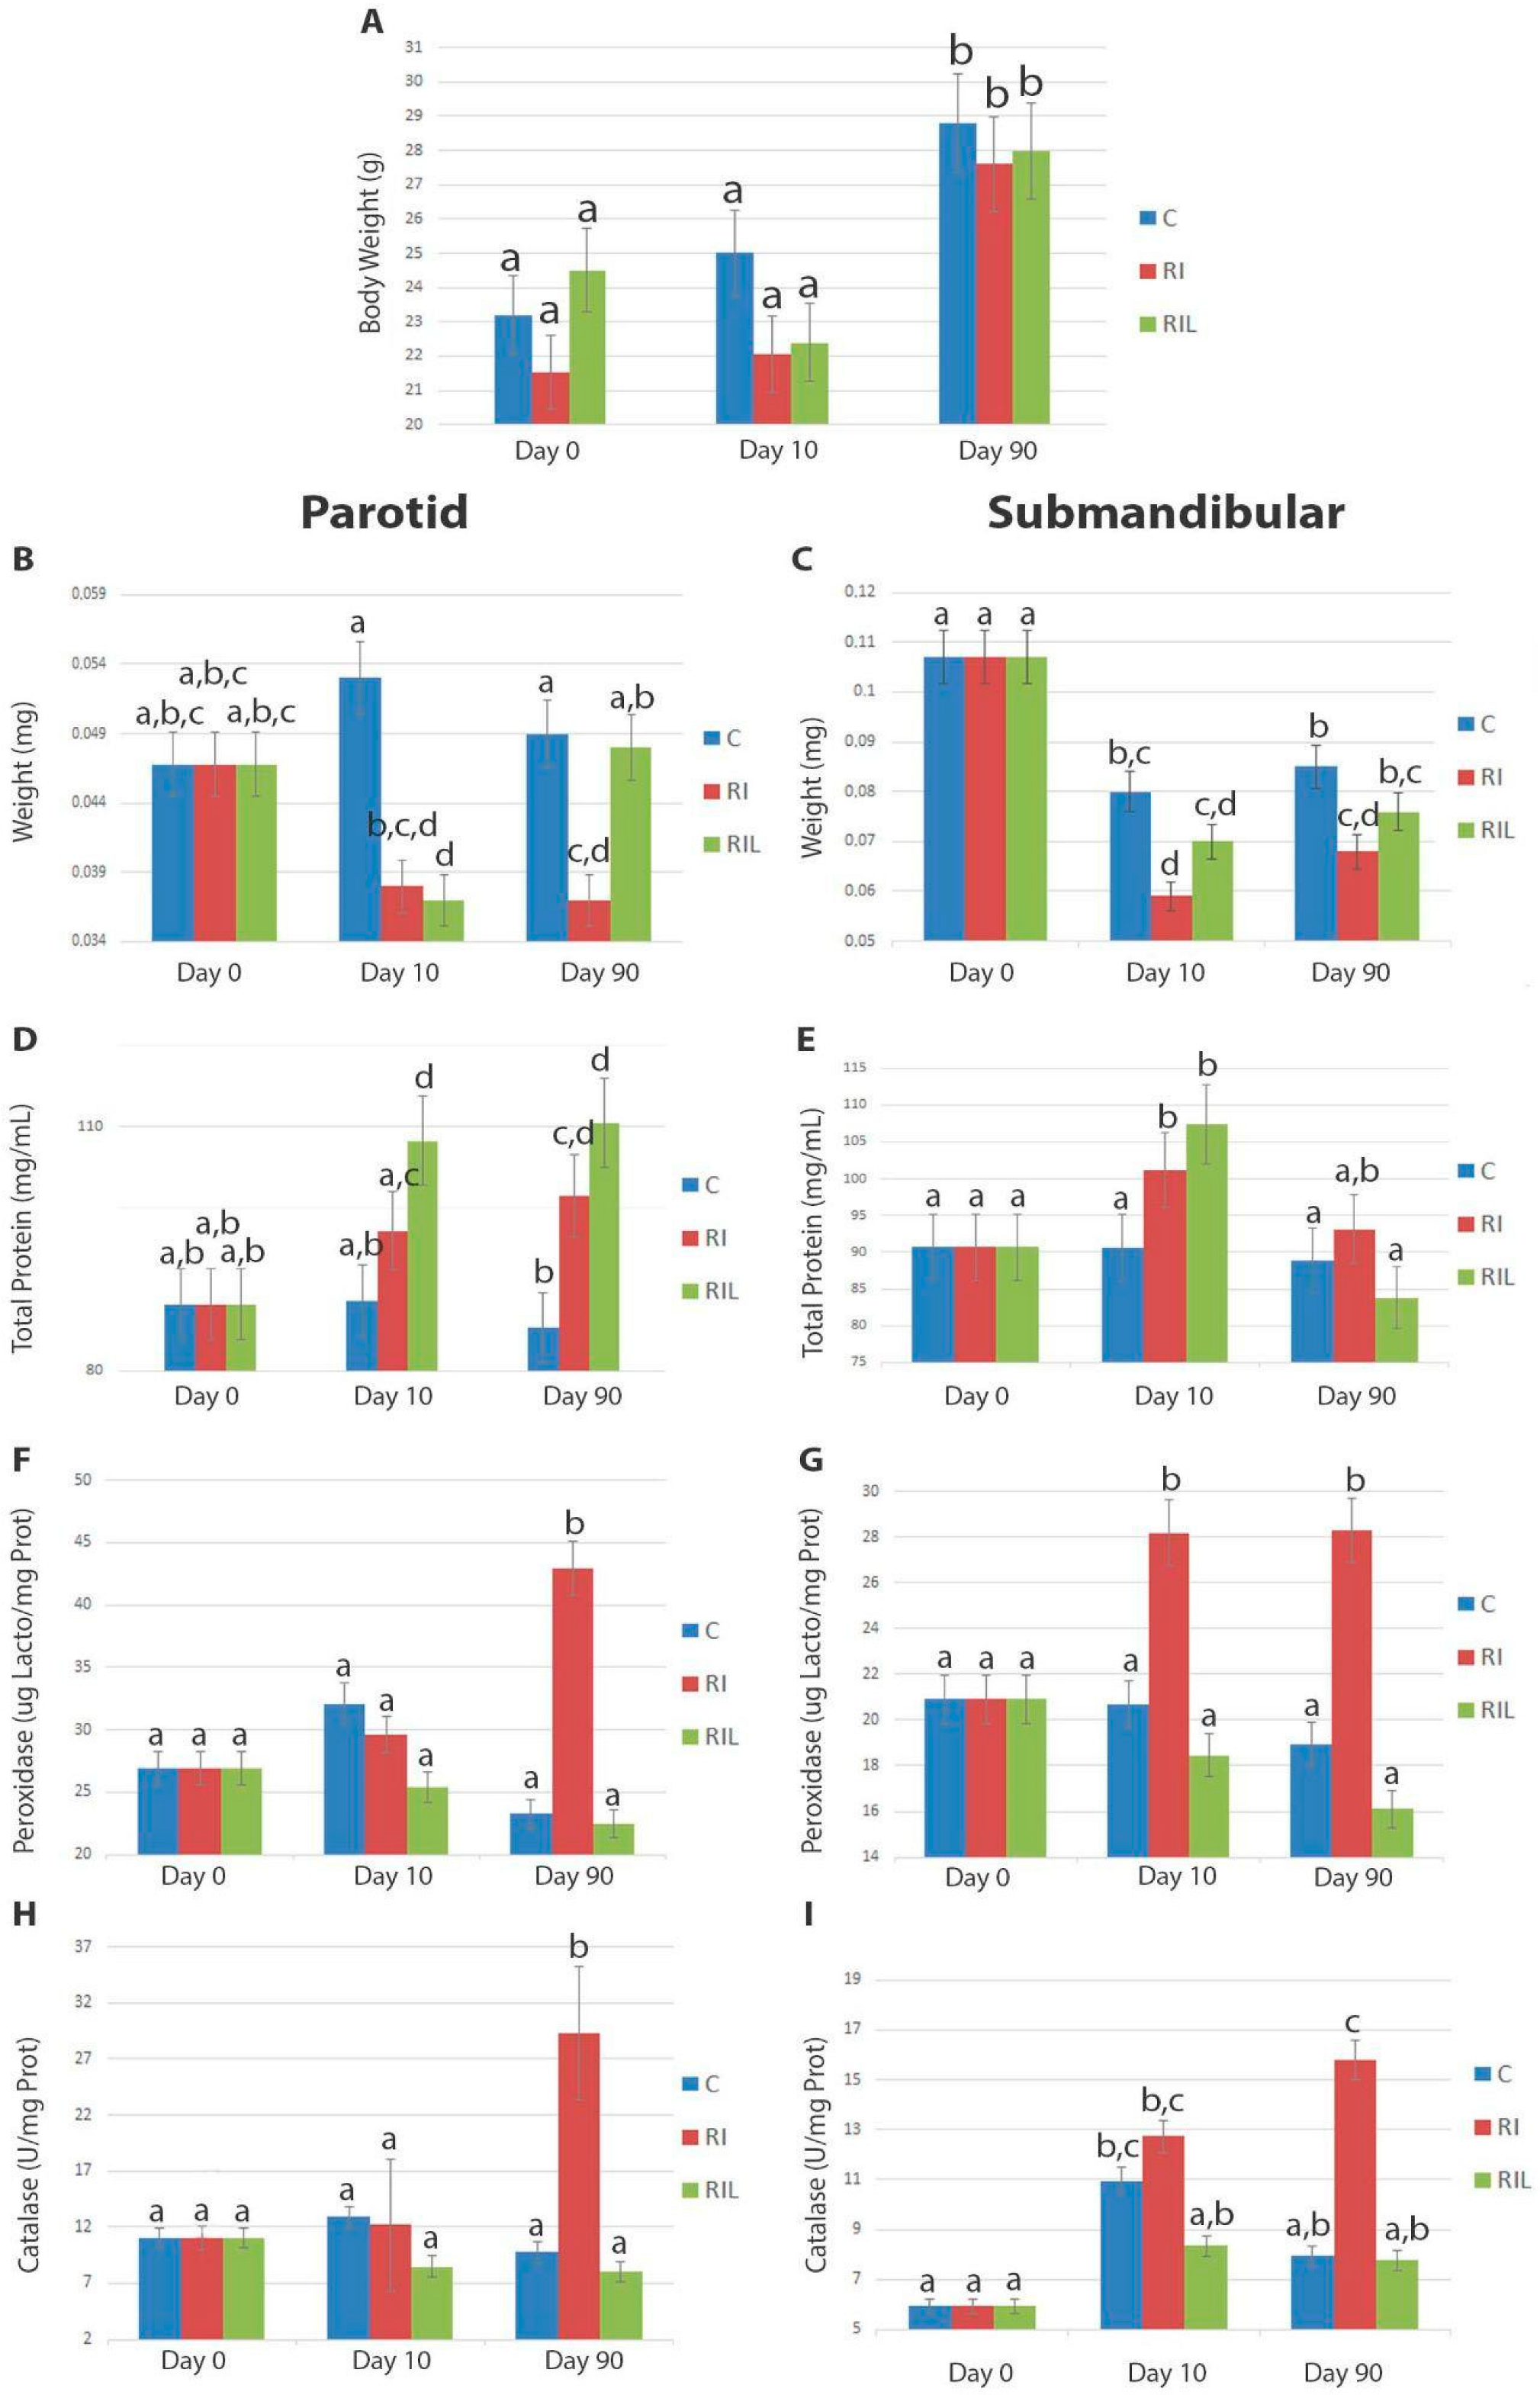
3.1. Full Body and SG Weight
3.2. Biochemical Changes
3.3. Serum Measurements
3.4. Planar Scintigraphy Imaging
3.5. Histological Changes
3.5.1. Cell Morphology and Apoptosis
3.5.2. Mallory’s Trichrome
3.5.3. Immunohistochemical Analysis-NIS
4. Discussion
5. Conclusions
Author Contributions
Funding
Institutional Review Board Statement
Informed Consent Statement
Data Availability Statement
Acknowledgments
Conflicts of Interest
List of Abbreviations
| Abbreviation | Nomenclature |
| RAI | Radioactive iodine |
| SG | Salivary gland |
| T3 | Tri-iodothyronine |
| T4 | Thyroxine |
| PBMT | Photobiomodulation therapy |
| DCT | Differentiated thyroid cancer |
| NIS | Sodium–iodine symporter |
| 131I | Iodine-131 |
| FMUSP | University of São Paulo School of Medicine |
| P | Parotid |
| SM | Submandibular |
References
- Nguyen, Q.T.; Lee, E.J.; Melinda, G.H.; Huang, G.; Young, I.P.; Park, I.; Khullar, A.; Plodkowski, R.A. Diagnosis and Treatment of Patients with Thyroid Cancer. Am. Hea. Drug Benef. 2015, 8, 30–40. [Google Scholar]
- Haddad, R.I.; Bischoff, L.; Ball, D.; Bernet, V.; Blomain, E.; Busaidy, N.L.; Campbell, M.; Dickson, P.; Duh, Q.Y.; Ehya, H.; et al. Thyroid Carcinoma, Version 2.2022, NCCN Clinical Practice Guidelines in Oncology. JNCCN J. Natl. Compr. Cancer Netw. 2022, 20, 925–951. [Google Scholar] [CrossRef] [PubMed]
- Sawka, A.M.; Thephamongkhol, K.; Brouwers, M.; Thabane, L.; Browman, G.; Gerstein, H.C. A Systematic Review and Meta-analysis of the Effectiveness of Radioactive Iodine Remnant Ablation for Well-Differentiated Thyroid Cancer. J. Clin. Endocrinol. Metab. 2004, 89, 3668–3676. [Google Scholar] [CrossRef] [PubMed]
- Van Nostrand, D. Sialoadenitis Secondary to 131I Therapy for Well-Differentiated Thyroid Cancer. Oral. Dis. 2011, 17, 154–161. [Google Scholar] [CrossRef]
- Barrueco, A.S.; Galán, F.G.; Rueda, I.A.; Coello, J.M.S.; Dorado, M.P.B.; Aubá, J.M.V.; Escanciano, M.E.; Jiménez, L.L.; Fernández, I.M.; Español, C.C. Incidence and Risk Factors for Radioactive Iodine-Induced Sialadenitis. Acta Otolaryngol. 2020, 140, 959–962. [Google Scholar] [CrossRef]
- Choi, J.-S.; Hong, S.B.; Hyun, I.Y.; Lim, J.-Y.; Kim, Y.-M. Effects of Salivary Secretion Stimulation on the Treatment of Chronic Radioactive Iodine-Induced Sialadenitis. Thyroid 2015, 25, 839–845. [Google Scholar] [CrossRef]
- Mandel, S.J.; Mandel, L. Review Radioactive Iodine and the Salivary Glands. Thyroid 2003, 13, 265–271. [Google Scholar] [CrossRef]
- Ibuki, F.K.; Simões, A.; Nicolau, J.; Nogueira, F.N. Laser Irradiation Affects Enzymatic Antioxidant System of Streptozotocin-Induced Diabetic Rats. Lasers Med. Sci. 2013, 28, 911–918. [Google Scholar] [CrossRef]
- Campos, L.; Nicolau, J.; Arana-Chavez, V.E.; Sim, A. Effect of Laser Phototherapy on Enzymatic Activity of Salivary Glands of Hamsters Treated with 5-Fluorouracil. Photochem. Photobiol. 2014, 90, 667–672. [Google Scholar] [CrossRef]
- Mandel, L. Hyposalivation: The Roles of Radioactive Iodine and Stapes Surgery. J. Oral. Maxillofac. Surg. 2013, 71, e76–e80. [Google Scholar] [CrossRef]
- Ford, H.; Johnson, L.; Purdie, G.; Feek, C. Effects of Hyperthyroidism and Radioactive Iodine given to Ablate the Thyroid on the Composition of Whole Stimulated Saliva. Clin. Endocrinol. 1997, 46, 189–193. [Google Scholar] [CrossRef]
- Almeida, J.P.; Kowalski, L.P. Pilocarpine Used to Treat Xerostomia in Patients Submitted to Radioactive Iodine Therapy: A Pilot Study Abstract. Braz. J. Otorhinolaryngol. 2010, 76, 659–662. [Google Scholar] [CrossRef]
- Sunavala-Dossabhoy, G. Radioactive Iodine: An Unappreciated Threat to Salivary Gland Function. Oral. Dis. 2018, 24, 198–201. [Google Scholar] [CrossRef] [PubMed]
- Tanasiewicz, M.; Hildebrandt, T.; Obersztyn, I. Xerostomia of Various Etiologies: A Review of the Literature. Adv. Clin. Exp. Med. 2016, 25, 199–206. [Google Scholar] [CrossRef] [PubMed]
- Simões, A.; de Campos, L.; Arana-Chavez, V.E.; Nicolau, J. Low-Level Laser Therapy for Hyposalivation and Xerostomia. In Lasers in Dentistry: Guide for Clinical Practice; Freitas, P.M., Simões, A., Eds.; Wiley Blackwell: New York, NY, USA, 2015; Volume 1, pp. 335–339. [Google Scholar]
- Saleh, J.; Figueiredo, M.A.Z.; Cherubini, K.; Braga-Filho, A.; Salum, F.G. Effect of Low-Level Laser Therapy on Radiotherapy-Induced Hyposalivation and Xerostomia: A Pilot Study. Photomed. Laser Surg. 2014, 32, 546–552. [Google Scholar] [CrossRef] [PubMed]
- Pavlić, V. The Effects of Low-Level Laser Therapy on Xerostomia (Mouth Dryness). Med. Pregl. 2012, 65, 247–250. [Google Scholar] [CrossRef] [PubMed]
- Lončar, B.; Stipetić, M.M.; Baričević, M.; Risović, D. The Effect of Low-Level Laser Therapy on Salivary Glands in Patients with Xerostomia. Photomed. Laser Surg. 2011, 29, 171–175. [Google Scholar] [CrossRef] [PubMed]
- Golež, A.; Frangež, I.; Cankar, K.; Frangež, H.B.; Ovsenik, M.; Nemeth, L. Effects of Low-Level Light Therapy on Xerostomia Related to Hyposalivation: A Systematic Review and Meta-Analysis of Clinical Trials. Lasers Med. Sci. 2022, 37, 745–758. [Google Scholar] [CrossRef]
- Lowry, O.H.; Rosebrough, N.J.; Farr, A.L.; Randall, R.J. Protein Measurement with the Folin Phenol Reagent. J. Biol. Chem. 1951, 1, 265–275. [Google Scholar] [CrossRef]
- Chandra, A.; Dubey, A. Effect of Ploidy Levels on the Activities of Δ1-Pyrroline-5-Carboxylate Synthetase, Superoxide Dismutase and Peroxidase in Cenchrus Species Grown under Water Stress. Plant Physiol. Biochem. 2010, 48, 27–34. [Google Scholar] [CrossRef]
- Anderson, L.C. Peroxidase release from rat submandibular salivary acinar cells in vitro. Arch. Oral. Biol. 1986, 31, 501–503. [Google Scholar] [CrossRef] [PubMed]
- Aebi, H. Catalase in Vitro. Methods Enzym. 1984, 105, 121–126. [Google Scholar] [CrossRef]
- Mor, G.; Alvero, A.B. Apoptosis and Cancer: Methods and Protocols: Second Edition. Methods Mol. Biol. 2014, 1219. [Google Scholar] [CrossRef]
- Choi, J.S.; Park, I.S.; Kim, S.K.; Lim, J.Y.; Kim, Y.M. Morphometric and Functional Changes of Salivary Gland Dysfunction after Radioactive Iodine Ablation in a Murine Model. Thyroid 2013, 23, 1445–1451. [Google Scholar] [CrossRef]
- Spitzweg, C.; Joba, W.; Schriever, K.; Goellner, J.R.; Morris, J.C.; Heufelder, A.E. Analysis of Human Sodium Iodide Symporter Immunoreactivity in Human Exocrine Glands. J. Clin. Endocrinol. Metab. 1999, 84, 4178–4184. [Google Scholar] [CrossRef] [PubMed]
- Nygaard, B.; Søes-Petersen, U.; Høilund-Carlsen, P.F.; Veje, A.; Holst, P.E.; Vestergaard, A.; Sølling, K. Improvement of Upper Airway Obstruction after 131 I-Treatment of Multinodular Nontoxic Goiter Evaluated by Flow Volume Loop Curves. J. Endocrinol. Invest. 1996, 19, 71–75. [Google Scholar] [CrossRef]
- Walter, M.A.; Turtschi, C.P.; Schindler, C.; Minnig, P.; Müller-Brand, J.; Müller, B. The Dental Safety Profile of High-Dose Radioiodine Therapy for Thyroid Cancer: Long-Term Results of a Longitudinal Cohort Study. J. Nucl. Med. 2007, 48, 1620–1625. [Google Scholar] [CrossRef]
- Jensen, S.B.; Pedersen, A.M.L.; Vissink, A.; Andersen, E.; Brown, C.G.; Davies, A.N.; Dutilh, J.; Fulton, J.S.; Jankovic, L.; Lopes, N.N.F.; et al. A Systematic Review of Salivary Gland Hypofunction and Xerostomia Induced by Cancer Therapies: Prevalence, Severity and Impact on Quality of Life. Support Care Cancer 2010, 18, 1039–1060. [Google Scholar] [CrossRef]
- Erem, C.; Kandemir, N.; Hacihasanoglu, A.; Ersöz, H.Ö.; Ukinc, K.; Kocak, M. Radioiodine Treatment of Hyperthyroidism Prognostic Factors Affecting Outcome. Endocrine 2004, 25, 55–60. [Google Scholar] [CrossRef]
- Aktoz, T.; Durmus-Altun, G.; Usta, U.; Torun, N.; Ergulen, A.; Atakan, I.H. Radioiodine-Induced Kidney Damage and Protective Effect of Amifostine: An Experimental Study. Hippokratia 2012, 16, 40–45. [Google Scholar]
- Bjordal, J.M.; Johnson, M.I.; Iversen, V.; Aimbire, F.; Lopes-Martins, R.A.B. Photoradiation in Acute Pain: A Systematic Review of Possible Mechanisms of Action and Clinical Effects in Randomized Placebo-Controlled Trials. Photomed. Laser Surg. 2006, 24, 158–168. [Google Scholar] [CrossRef]
- Astuti, S.D.; Sulistyo, A.; Setiawatie, E.M.; Setiawatie, M.; Khasanah, M.; Purnobasuki, H.; Arifianto, D.; Susilo, Y.; Alamsyah, K.A.; Alamsyah, A. An In-Vivo Study of Photobiomodulation Using 403 Nm and 649 Nm Diode Lasers for Molar Tooth Extraction Wound Healing in Wistar Rats. Odontology 2022, 110, 240–253. [Google Scholar] [CrossRef]
- Santos, N.R.S.; João, J.B.; Almeida, P.F.; Ribeiro, A.A.; Cangussú, M.C.T.; Dos Santos, J.N.; Pinheiro, A.L.B. Influence of the Combination of Infrared and Red Laser Light on the Healing of Cutaneous Wounds Infected by Staphylococcus Aureus. Photomed. Laser Surg. 2011, 29, 177–182. [Google Scholar] [CrossRef]
- Nabaa, B.; Takahashi, K.; Sasaki, T.; Okizaki, A.; Aburano, T. Assessment of Salivary Gland Dysfunction after Radioiodine Therapy for Thyroid Carcinoma Using Non-Contrast-Enhanced CT: The Significance of Changes in Volume and Attenuation of the Glands. Am. J. Neuroradiol. 2012, 33, 1964–1970. [Google Scholar] [CrossRef]
- La Perle, K.M.D.; Kim, D.C.; Hall, N.C.; Bobbey, A.; Shen, D.H.; Nagy, R.S.; Wakely, P.E.; Lehman, A.; Jarjoura, D.; Jhiang, S.M. Modulation of Sodium/Iodide Symporter Expression in the Salivary Gland. Thyroid 2013, 23, 1029–1036. [Google Scholar] [CrossRef]
- Bourgeois, M.; Rajerison, H.; Guerard, F.; Mougin-Degraef, M.; Barbet, J.; Michel, N.; Cherel, M.; Faivre-Chauvet, A.; Gestin, J.F. Iodine-131 for Therapy of Thyroid Diseases. Nucl. Med. Rev. 2011, 14, 90–95. [Google Scholar] [CrossRef]
- Vanderpump, M.P.; Ahlquist, J.A.; Franklyn, J.A.; Clayton, R.N. Consensus Statement for Good Practice and Audit Measures in the Management of Hypothyroidism and Hyperthyroidism. BMJ 1996, 31, 539–544. [Google Scholar] [CrossRef]
- Aydoğan, F.; Atılgan, H.I.; Koca, G.; Yumuşak, N.; Aydın, E.; Sadıç, M.; Korkmaz, M.; Tuncal, S.; Samim, E.E. An Evaluation of the Radioprotective Effect of Vitamin E on the Salivary Glands of Radioactive Iodine in Rats. Kulak Burun Bogaz Ihtis. Derg 2014, 24, 21–29. [Google Scholar] [CrossRef]
- Mercadante, V.; Al Hamad, A.; Lodi, G.; Porter, S.; Fedele, S. Interventions for the Management of Radiotherapy-Induced Xerostomia and Hyposalivation: A Systematic Review and Meta-Analysis. Oral. Oncol. 2017, 66, 64–74. [Google Scholar] [CrossRef]
- Saylam, G.; Baylr, Ö.; Gültekin, S.S.; Plnarll, F.A.; Han, Ü.; Korkmaz, M.H.; Sancaktar, M.E.; Tatar, Ý.; Sargon, M.F.; Tatar, E.C. Protective/Restorative Role of the Adipose Tissue-Derived Mesenchymal Stem Cells on the Radioiodine-Induced Salivary Gland Damage in Rats. Radiol. Oncol. 2017, 51, 307–318. [Google Scholar] [CrossRef]
- Cheng, P.; Hollingsworth, B.; Scarberry, D.; Shen, D.H.; Powell, K.; Smart, S.C.; Beech, J.; Sheng, X.; Kirschner, L.S.; Menq, C.H.; et al. Automated MicroSPECT/MicroCT Image Analysis of the Mouse Thyroid Gland. Thyroid 2017, 27, 1433–1440. [Google Scholar] [CrossRef]
- Elterman, K.G.; Mallampati, S.R.; Kaye, A.D.; Urman, R.D. Postoperative Alterations in Taste and Smell. Anesthesiol. Pain. Med. 2014, 4, e18527. [Google Scholar] [CrossRef]


Disclaimer/Publisher’s Note: The statements, opinions and data contained in all publications are solely those of the individual author(s) and contributor(s) and not of MDPI and/or the editor(s). MDPI and/or the editor(s) disclaim responsibility for any injury to people or property resulting from any ideas, methods, instructions or products referred to in the content. |
© 2023 by the authors. Licensee MDPI, Basel, Switzerland. This article is an open access article distributed under the terms and conditions of the Creative Commons Attribution (CC BY) license (https://creativecommons.org/licenses/by/4.0/).
Share and Cite
Campos, L.; Magliano, G.C.; Hotsumi, A.M.; Faria, D.d.P.; Garcez, A.T.; Godoy, F.; Arana-Chavez, V.E.; Simões, A. Photobiomodulation Therapy Mitigates Salivary Gland Damage Induced by Radioactive Iodine Ablation. Photonics 2023, 10, 611. https://doi.org/10.3390/photonics10060611
Campos L, Magliano GC, Hotsumi AM, Faria DdP, Garcez AT, Godoy F, Arana-Chavez VE, Simões A. Photobiomodulation Therapy Mitigates Salivary Gland Damage Induced by Radioactive Iodine Ablation. Photonics. 2023; 10(6):611. https://doi.org/10.3390/photonics10060611
Chicago/Turabian StyleCampos, Luana, Gabriela Campos Magliano, Andressa Matucci Hotsumi, Daniele de Paula Faria, Alexandre Teles Garcez, Fernando Godoy, Victor Elias Arana-Chavez, and Alyne Simões. 2023. "Photobiomodulation Therapy Mitigates Salivary Gland Damage Induced by Radioactive Iodine Ablation" Photonics 10, no. 6: 611. https://doi.org/10.3390/photonics10060611