Comparison of Raman Spectra of Optically Nonlinear LiTaO3:Cr3+ (0.005 wt%) Crystal Laser Excited in Visible (532 nm) and Near-IR (785 nm) Areas


Abstract
:1. Introduction
2. Materials and Methods
3. Results and Discussion
4. Conclusions
Author Contributions
Funding
Institutional Review Board Statement
Informed Consent Statement
Data Availability Statement
Conflicts of Interest
References
- Blázquez-Castro, A.; García-Cabañes, A.; Carrascosa, M. Biological applications of ferroelectric materials. Appl. Phys. Rev. 2018, 5, 041101. [Google Scholar] [CrossRef] [Green Version]
- Irzaman; Siskandar, R.; Nabilah, N.; Aminullah; Yuliarto, B.; Haman, K.A.; Husin, A. Application of lithium tantalate (LiTaO3) films as light sensor to monitor the light status in the Arduino Uno based energy-saving automatic light prototype and passive infrared sensor. Ferroelectrics 2018, 524, 44–55. [Google Scholar] [CrossRef]
- Yang, X.; Lin, S.; Ma, D.; Long, S.; Zhu, Y.; Li, H.; Wang, B. Up-conversion luminescence of LiTaO3:Er3+ phosphors for optical thermometry. Ceram. Intern. 2020, 46, 1178–1182. [Google Scholar] [CrossRef]
- Yao, S.; Han, H.; Jiang, S.; Xiang, B.; Chai, G.; Ruan, S. Design, simulation, and analysis of optical microring resonators in lithium tantalate on insulator. Crystals 2021, 11, 480. [Google Scholar] [CrossRef]
- He, Y.; Wong, Y.P.; Liang, Q.; Wu, T.; Bao, J.; Hashimoto, K.Y. Transverse energy confinement and resonance suppression in SAW resonators using low-cut lithium tantalate. Jap. J. Appl. Phys. 2022, 61, SG1031. [Google Scholar] [CrossRef]
- Wu, B.; Zhang, B.; Liu, W.; Lu, Q.; Wang, L.; Chen, F. Recoverable and rewritable waveguide beam splitters fabricated by tailored femtosecond laser writing of lithium tantalate crystal. Opt. Laser Technol. 2022, 145, 107500. [Google Scholar] [CrossRef]
- Lyu, T.; Dorenbos, P.; Xiong, P.; Wei, Z. LiTaO3:Bi3+, Tb3+, Ga3+, Ge4+: A smart perovskite with high charge carrier storage capacity for X-ray imaging, stress sensing, and non-real-time recording. Adv. Funct. Mater. 2022, 32, 2206024. [Google Scholar] [CrossRef]
- Sidorov, N.V.; Palatnikov, M.N.; Biryukova, I.V.; Titov, R.A.; Makarova, O.V.; Masloboeva, S.M. Monocrystals of Lithium Niobate and Tantalate of Different Composition and Genesis; RAN: Moscow, Russia, 2022; 288p. (In Russian) [Google Scholar]
- Chuchumishev, D.; Gaydardzhiev, A.; Fiebig, T.; Buchvarov, I. Subnanosecond, mid-IR, 0.5 kHz periodically poled stoichiometric LiTaO3 optical parametric oscillator with over 1 W average power. Opt. Lett. 2013, 38, 3347–3349. [Google Scholar] [CrossRef] [Green Version]
- Yin, M. Broadband quasi-phase-matching second-harmonic generation in 0.5 mol% MgO-doped periodically poled stoichiometric LiTaO3. J. Korean Phys. Soc. 2015, 67, 1750–1754. [Google Scholar] [CrossRef]
- Chuchumishev, D.; Trifonov, A.; Oreshkov, B.; Xu, X.; Buchvarov, I. High-energy picosecond kHz optical parametric oscillator/amplifier tunable between 3 and 3.5 µm. Appl. Phys. B 2018, 124, 1–6. [Google Scholar] [CrossRef]
- Prokhorov, A.M.; Kuz’minov, Y.S. Physics and Chemistry of Crystalline Lithium Niobate; Adam Hilger: New York, NY, USA, 1990; p. 237. [Google Scholar]
- Huband, S.; Keeble, D.S.; Zhang, N.; Glazer, A.M.; Bartasyte, A.; Thomas, P.A. Relationship between the structure and optical properties of lithium tantalate at the zero-birefringence point. J. Appl. Phys. 2017, 121, 024102. [Google Scholar] [CrossRef] [Green Version]
- Sidorov, N.V.; Volk, T.R.; Mavrin, B.N.; Kalinnikov, V.T. Lithium Niobate: Defects, Photorefraction, Vibrational Spectrum, Polaritons; Nauka: Moscow, Russia, 2003; p. 255. (In Russian) [Google Scholar]
- Fontana, M.D.; Bourson, P. Microstructure and defects probed by Raman spectroscopy in lithium niobate crystals and devices. Appl. Phys. Rev. 2015, 2, 040602. [Google Scholar] [CrossRef]
- Wu, X.-L.; Yany, F.; Zhangy, M.-S.; Jiangy, S.-S.; Fengy, D. The microstructural difference between proton-exchanged LiNbO3 and LiTaO3 crystals by Raman spectroscopy. J. Phys. Condens. Matter 1996, 8, 2073–2080. [Google Scholar] [CrossRef]
- Glass, A.M. Optical spectra of Cr3+ impurity ions in ferroelectric LiNbO3 and LiTaO3. J. Chem. Phys. 1969, 50, 1501–1510. [Google Scholar] [CrossRef]
- Tsuya, H. Optical damage in transition-metal-doped LiTaO3. J. Appl. Phys. 1975, 46, 4323–4333. [Google Scholar] [CrossRef]
- von der Linde, D.; Glass, A.M.; Rodgers, K.F. Optical storage using refractive index changes induced by two-step excitation. J. Appl. Phys. 1976, 47, 217–220. [Google Scholar] [CrossRef]
- Ryba-Romanowski, W.; Golab, S.; Pisarski, W.A.; Dominiak-Dzik, G.; Palatnikov, M.N.; Sidorov, N.V.; Kalinnikov, V.T. Influence of temperature on the optical properties of LiTaO3:Cr. Appl. Phys. Lett. 1997, 70, 2505–2507. [Google Scholar] [CrossRef]
- Sokolska, I.; Golab, S.; Ryba-Romanowski, W. Optical spectroscopy of doped LiTaO3 crystals. Spectrochim. Acta Part A Mol. Biomol. Spectrosc. 1998, 54, 1685–1694. [Google Scholar] [CrossRef]
- Sokolska, I.; Kuck, S. Optical characterization of Cr3+ doped LiTaO3 crystals relevant for laser application. Spectrochim. Acta Part A Mol. Biomol. Spectrosc. 1998, 54, 1695–1700. [Google Scholar] [CrossRef]
- Golab, S.; Sokolska, I.; Dominiak-Dzik, G.; Palatnikov, M.N.; Sidorov, N.V.; Biryukova, I.; Kalinnikov, V.T.; Ryba-Romanowski, W. Optical absorption and luminescence of LiTaO3:Cr and LiTaO3:Cr,Nd crystals. Proc. SPIE 1999, 3724, 270–273. [Google Scholar] [CrossRef]
- Alexandrovski, A.L.; Foulon, G.; Myers, L.E.; Route, R.K.; Fejer, M.M. UV and visible absorption in LiTaO3. Proc. SPIE 1999, 3610, 44–51. [Google Scholar] [CrossRef]
- Grinberg, M.; Sokolska, I.; Kuck, S.; Jaskolski, W. Temperature dependence of the luminescence decay of Cr3+ ions in LiTaO3: Confined potential model. Phys. Rev. B 1999, 60, 959–965. [Google Scholar] [CrossRef]
- Shen, Y.; Bray, K.L.; Grinberg, M.; Barzowska, J.; Sokolska, I. Identification of multisite behavior in a broadly emitting transition-metal system using pressure. Phys. Rev. B 2000, 61, 14263–14266. [Google Scholar] [CrossRef]
- Shen, Y.; Bray, K.L.; Grinberg, M.; Barzowska, J.; Sokolska, I. High pressure spectroscopy of chromium doped LiTaO3 crystals. High Press. Res. 2000, 18, 125–130. [Google Scholar] [CrossRef]
- Kaczmarek, S.; Swirkowicz, M.; Jablonski, R.; Lukasiewicz, T.; Kwasny, M. Growth and characterization of lithium tantalate single crystals doped with Ho, Tm, Nd, Yb, Pr and doped by diffusion with Cr and Cu. J. Alloys Compd. 2000, 300–301, 322–328. [Google Scholar] [CrossRef]
- Grinberg, M.; Barzowska, J.; Shen, Y.; Bray, K. Crystal field model of the three principal Cr3+ centers in LiTaO3. Radiat. Eff. Defects Solids 2001, 155, 247–251. [Google Scholar] [CrossRef]
- Grinberg, M.; Barzowska, J.; Bray, K.L.; Shen, Y.R. Inhomogeneous broadening of the dominant Cr3+ sites in LiTaO3 system. J. Luminesc. 2001, 94–95, 85–90. [Google Scholar] [CrossRef]
- Grinberg, M.; Barzowska, J.; Shen, Y.R.; Bray, K.L. Inhomogeneous broadening of Cr3+ luminescence in doped LiTaO3. Phys. Rev. B 2001, 63, 214104. [Google Scholar] [CrossRef]
- Grinberg, M. Spectroscopic characterisation of disordered materials doped with chromium. Opt. Mater. 2002, 19, 37–45. [Google Scholar] [CrossRef]
- Grinberg, M.; Suchocki, A. Pressure-induced changes in the energetic structure of the 3d3 ions in solid matrices. J. Luminesc. 2007, 125, 97–103. [Google Scholar] [CrossRef]
- Bagdasarov, K.S.; Batoev, V.B.; Uyukin, E.M. Transient isotropic photoinduced scattering of light in LiTaO3:Cr. Sov. J. Quant. Electron. 1986, 16, 1295–1296. [Google Scholar] [CrossRef]
- Batoev, V.B.; Uyukin, E.M. Photoinduced and Rayleigh light scattering in LiTaO3:Сr. Fiz. Tverd. Tela 1988, 30, 1913–1915. [Google Scholar]
- Burns, G.; O’kane, D.F. Optical and electron-spin-resonance spectra of Yb3+, Nd3+, and Cr3+ in LiNbO3 and LiTaO3. Phys. Rev. 1968, 167, 314–319. [Google Scholar] [CrossRef]
- Chen, C.Y.; Sweeney, K.L.; Halliburton, L.E. Reduction and radiation effects in lithium tantalate. Phys. Status Solidi 1984, 81, 253–257. [Google Scholar] [CrossRef]
- Ahn, S.W.; Kim, J.S.; Choh, S.H.; Yeom, T.H. An induced Cr3+ center in γ-irradiated LiTaO3. J. Kor. Phys. Soc. 1994, 27, 535–537. [Google Scholar]
- Ahn, S.W.; Rudowicz, C.; Choh, S.H.; Han, S.Y. EPR study of two Cr3+ defect centers in LiTaO3 single crystals. J. Korean Phys. Soc. 1997, 30, 99–102. [Google Scholar]
- Yeom, T.H.; Choh, S.H. Magnetic resonance investigations of LiNbO3 and LiTaO3 single crystals. J. Korean Phys. Soc. 1998, 32, S672–S675. [Google Scholar]
- Loyo-Menoyo, M.; Keeble, D.J.; Furukawa, Y.; Kitamura, K. Electron paramagnetic resonance of Cr3+ in near-stoichiometric LiTaO3. J. Appl. Phys. 2005, 97, 123905. [Google Scholar] [CrossRef]
- Zhang, C.-X.; Kuang, X.-Y.; Mao, A.-J.; Wang, H. Optical spectrum, local lattice structure and EPR g factors for Cr3+ impurity ions in MgTiO3 and LiTaO3. Phys. B Condens. Matter 2008, 403, 3114–3118. [Google Scholar] [CrossRef]
- Palatnikov, M.N.; Sandler, V.A.; Sidorov, N.V.; Efremov, I.N.; Makarova, O.V. Methods for controlling the degree of unipolarity of large LiNbO3 crystals. Instrum. Exp. Tech. 2020, 63, 383–387. [Google Scholar] [CrossRef]
- Sanna, S.; Neufeld, S.; Rusing, M.; Berth, G.; Zrenner, A.; Schmidt, W.G. Raman scattering efficiency in LiTaO3 and LiNbO3 crystals. Phys. Rev. B 2015, 91, 224302. [Google Scholar] [CrossRef]
- Shi, L.; Kong, Y.; Yan, W.; Liu, H.; Li, X.; Xie, X.; Zhao, D.; Sun, L.; Xu, J.; Sun, J.; et al. The composition dependence and new assignment of the Raman spectrum in lithium tantalate. Solid State Commun. 2005, 135, 251–256. [Google Scholar] [CrossRef]
- Sidorov, N.V.; Palatnikov, M.N. Raman spectra of lithium niobate crystals heavily doped with zinc and magnesium. Opt. Spectrosc. 2016, 121, 842–850. [Google Scholar] [CrossRef]
- Solin, S.A.; Ramdas, A.K. Raman spectrum of diamond. Phys. Rev. B 1970, 1, 1687–1698. [Google Scholar] [CrossRef]
- Sushchinsky, M.M.; Gorelik, V.S.; Maximov, O.P. Higher-order Raman spectra of GaP. J. Raman Spectrosc. 1978, 7, 26–30. [Google Scholar] [CrossRef]
- Narayanan, P.S. Raman spectrum of cesium bromide. Proc. Indian Acad. Sci. A 1955, 42, 303–308. [Google Scholar] [CrossRef]
- Sidorov, N.; Palatnikov, M.; Pyatyshev, A.; Sverbil, P. Second-order Raman scattering in ferroelectric ceramic solid solutions LiNbxTa1−xO3. Crystals 2022, 12, 456. [Google Scholar] [CrossRef]
- Sidorov, N.; Palatnikov, M.; Pyatyshev, A.; Skrabatun, A. Investigation of the structural perfection of a LiNbO3:Gd3+(0.003):Mg2+(0.65 wt.%) double-doped single crystal using the Raman spectra excited by laser lines in the visible (532 nm) and near-IR (785 nm) regions. Appl. Sci. 2023, 13, 2348. [Google Scholar] [CrossRef]
- Gorelik, V.S.; Abdurakhmonov, S.D. Overtone Raman scattering in lithium niobate single crystals doped with terbium. Crystallogr. Rep. 2022, 67, 252–255. [Google Scholar] [CrossRef]
- Sidorov, N.; Palatnikov, M.; Pyatyshev, A. Raman scattering in a double-doped single crystal LiTaO3:Cr(0.2):Nd(0.45 wt%). Photonics 2022, 9, 712. [Google Scholar] [CrossRef]
- Ruvalds, J.; Zawadowski, A. Two-phonon resonances and hybridization of the resonance with single-phonon states. Phys. Rev. B 1970, 2, 1172–1175. [Google Scholar] [CrossRef]
- Zawadowski, A.; Ruvalds, J. Indirect coupling and antiresonance of two optic phonons. Phys. Rev. Lett. 1970, 24, 1111–1114. [Google Scholar] [CrossRef]
- Ruvalds, J.; Zawadowski, A. Resonances of two phonons from different dispersion branches. Solid State Commun. 1971, 9, 129–132. [Google Scholar] [CrossRef]


| Impurity | Concentration in the Charge, wt% | Concentration in LiTaO3:Cr (0.005 wt%) Crystal, wt% |
|---|---|---|
| Mn, V, Mg, Sn | <3 × 10⁻⁴ | <1 × 10⁻⁴ |
| Pb, Ni | <4 × 10⁻⁴ | <2 × 10⁻⁴ |
| Co, Mo | <4 × 10⁻⁴ | <3 × 10⁻⁴ |
| Si, Fe | <4 × 10⁻⁴ | <4 × 10⁻⁴ |
| Ti | <5 × 10⁻⁴ | <5 × 10⁻⁴ |
| Al | <6 × 10⁻⁴ | <6 × 10⁻⁴ |
| Zr | <7 × 10⁻⁴ | <5 × 10⁻⁴ |
| Ca | <3 × 10⁻⁴ | <5 × 10⁻⁴ |
| Te, Sb | <5 × 10⁻⁴ | <4 × 10⁻⁴ |
| Bi | <2 × 10⁻⁴ | <2 × 10⁻⁴ |
| Rh | <1 × 10⁻⁴ | <2 × 10⁻² |
| λ0 = 532 nm | λ0 = 785 nm | Attribution | ||||
|---|---|---|---|---|---|---|
| ν, cm−1 | ||||||
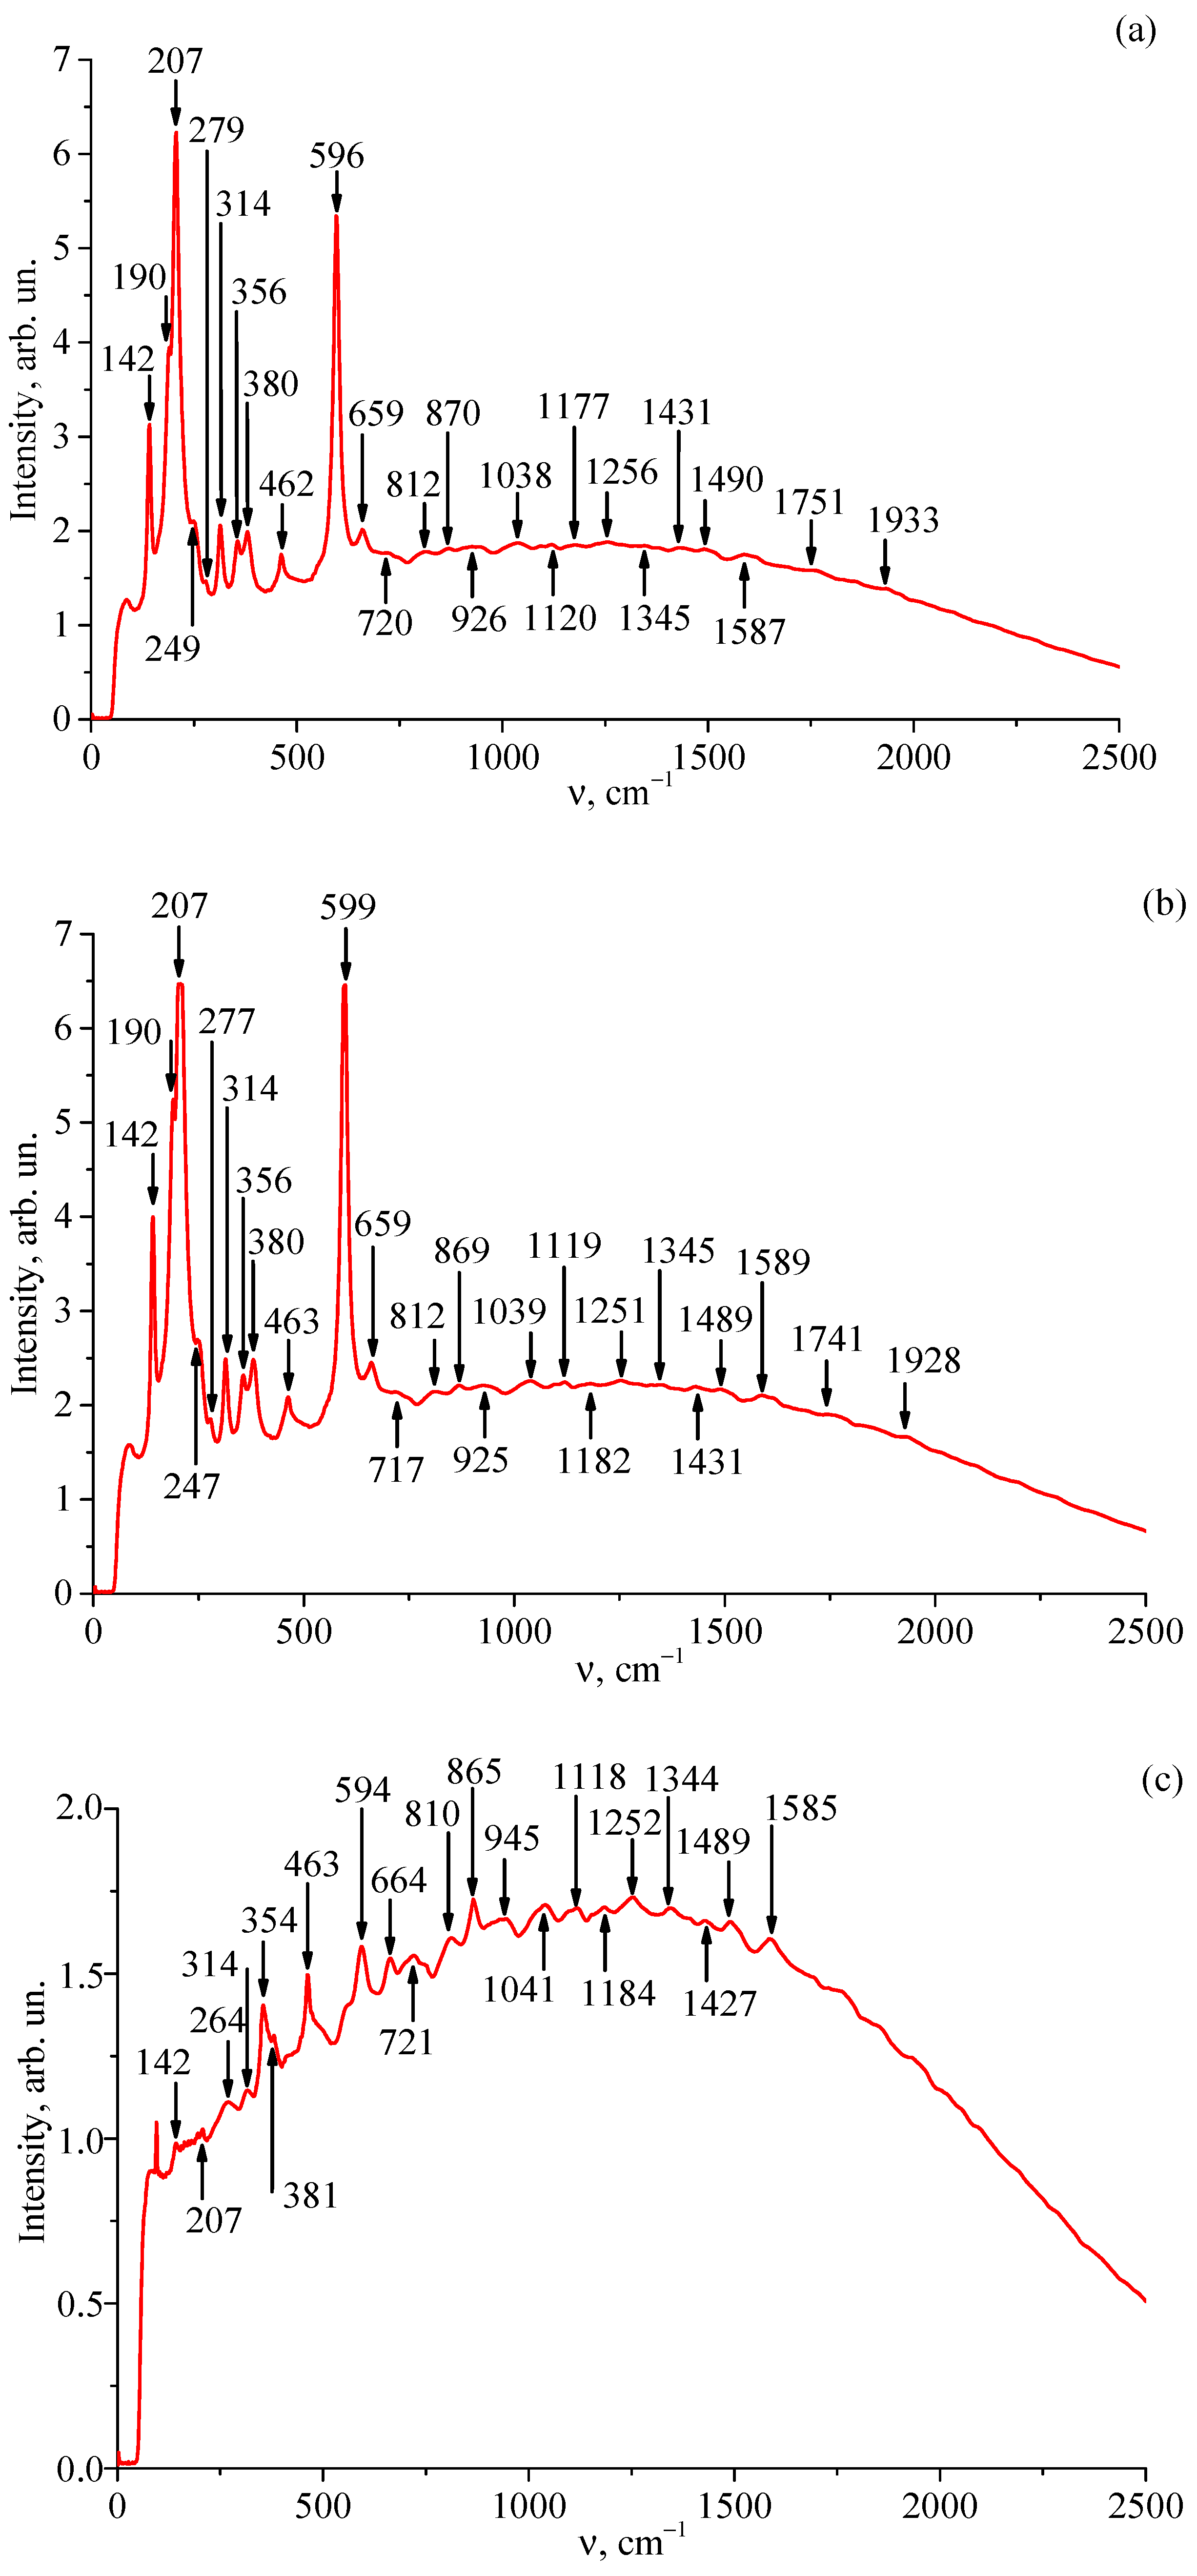
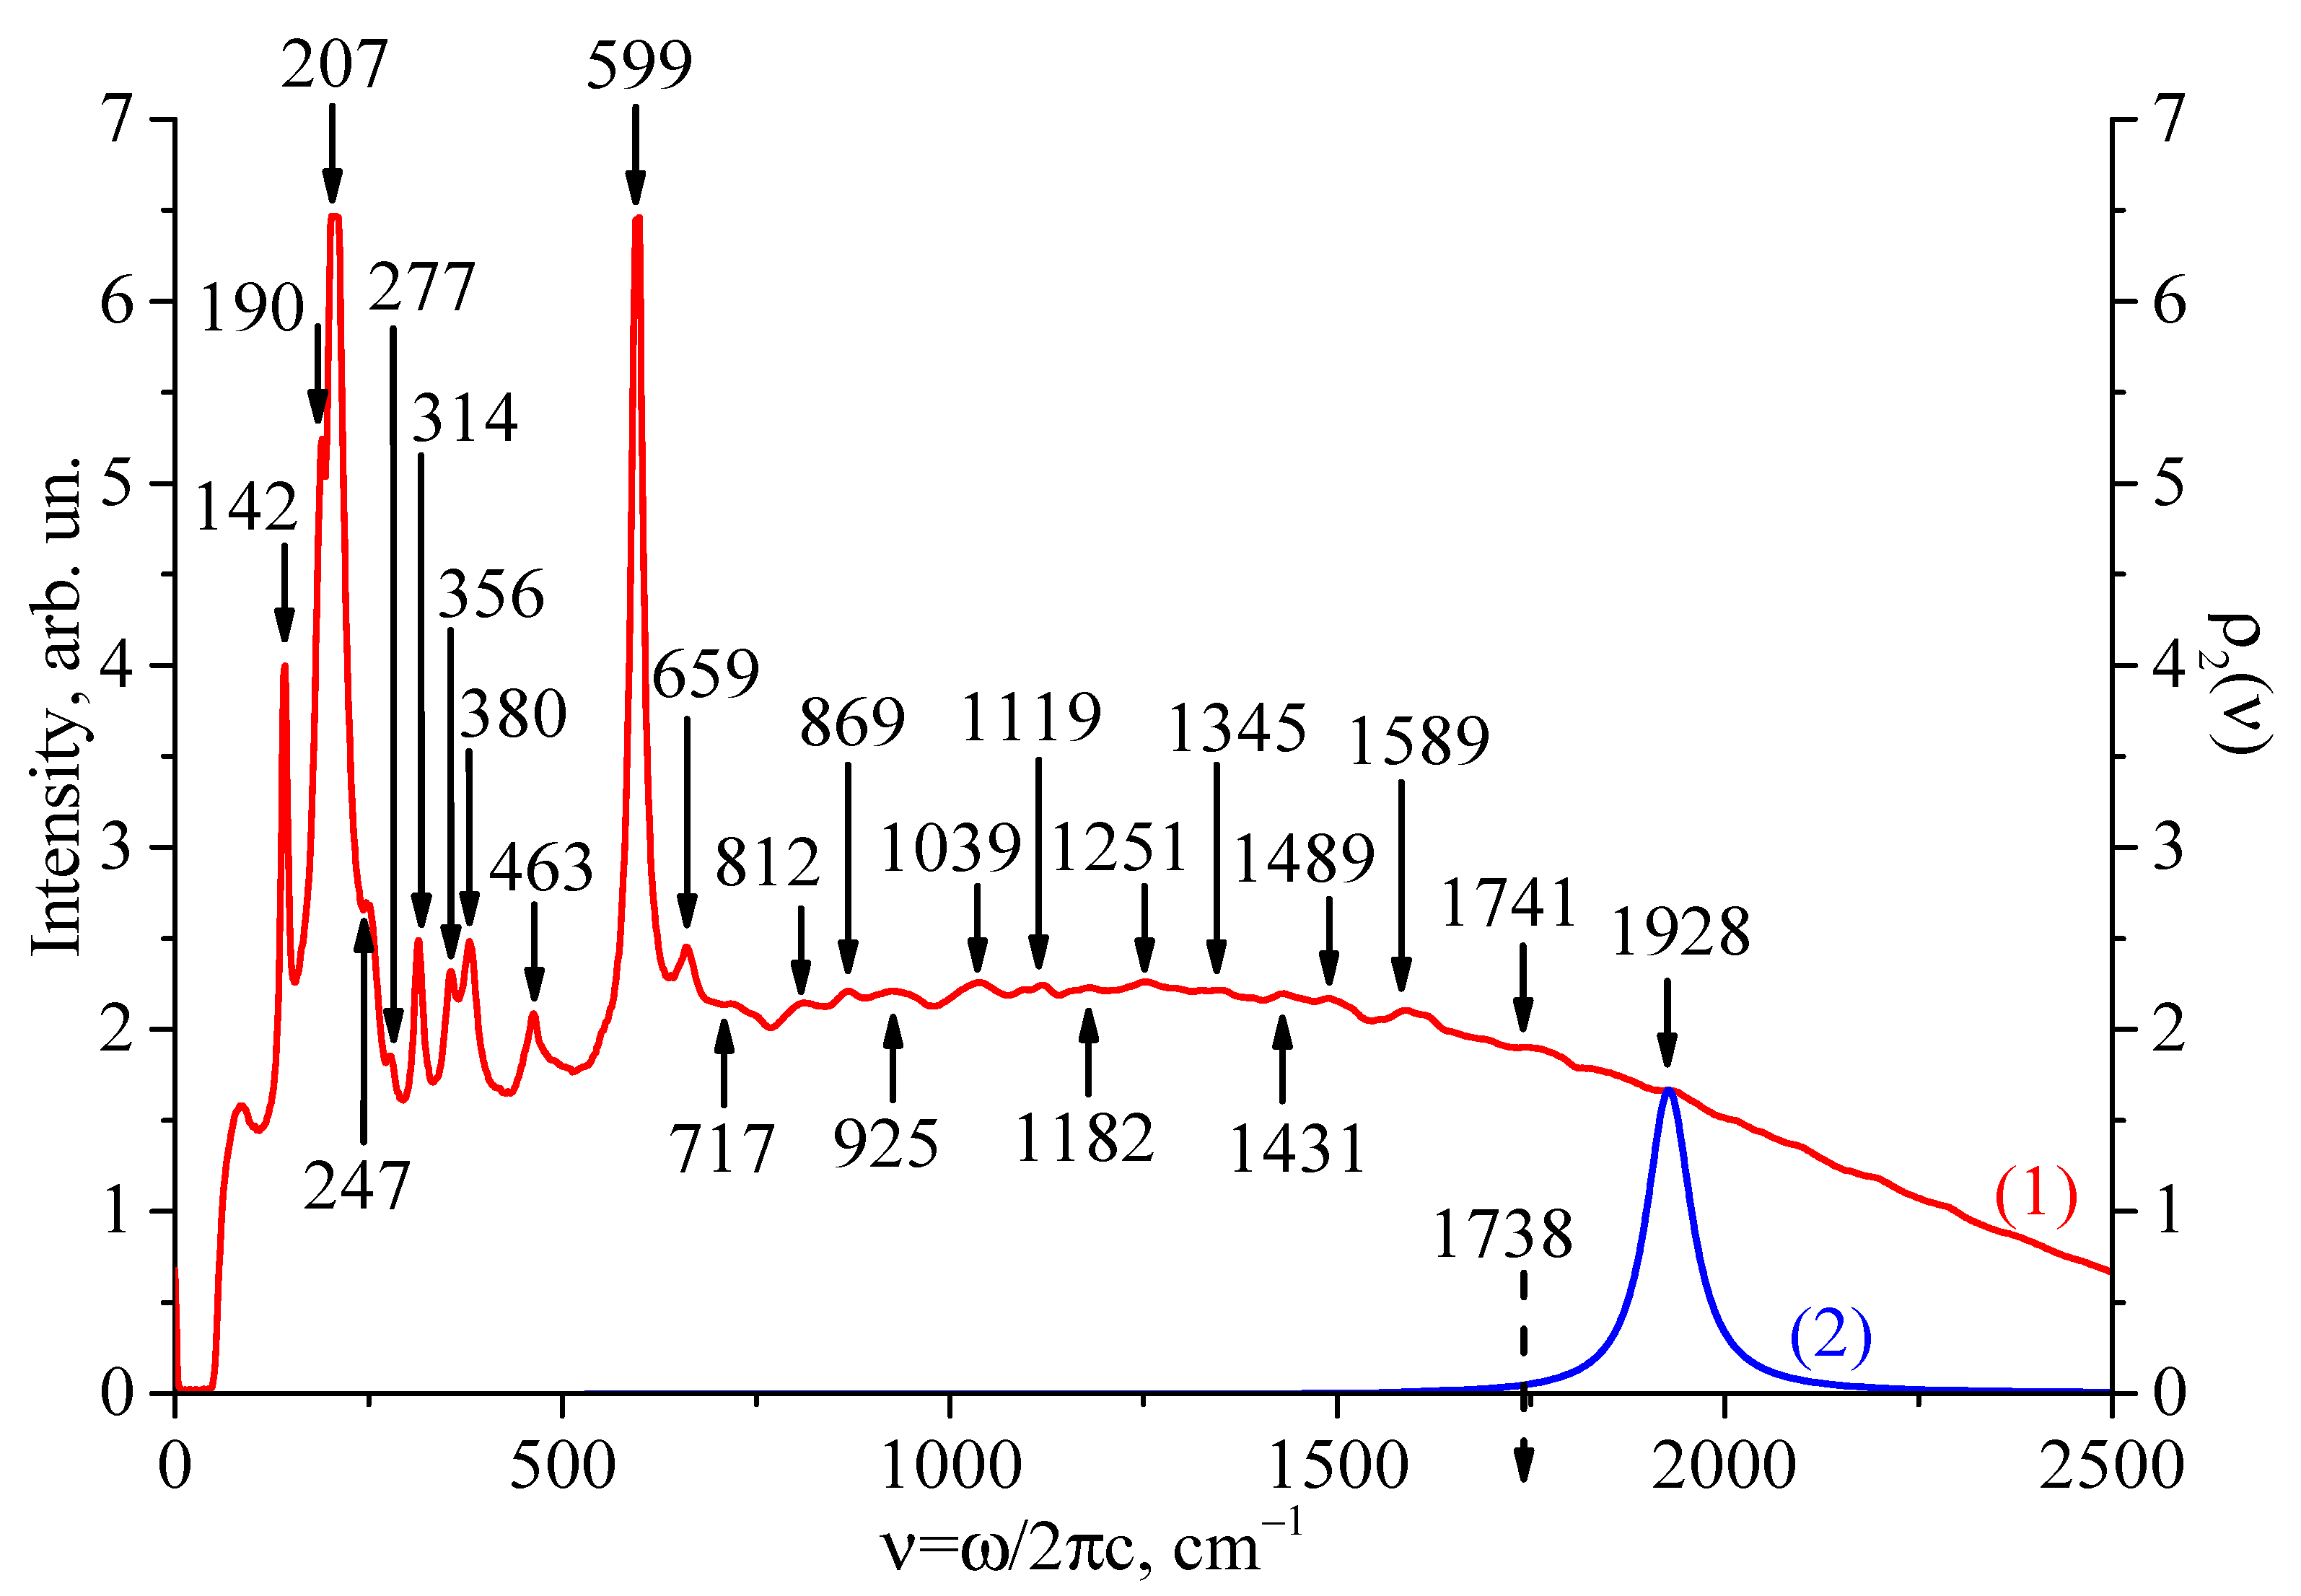
| 140 | 140 | 143 | 142 | 142 | 142 | 1E(x,y)TO |
| 190 | 190 | 1E(x,y)LO | ||||
| 203 | 203 | 206 | 207 | 207 | 207 | 1A1(z)TO |
| 250 | 249 | 247 | 3E(x,y)TO | |||
| 279 | 277 | 3E(x,y)LO | ||||
| 312 | 312 | 309 | 314 | 314 | 314 | 4E(x,y)TO |
| 356 | 353 | 356 | 356 | 356 | 354 | 2A1(z)LO |
| 377 | 380 | 377 | 380 | 380 | 381 | 3A1(z)TO5E(x,y)TO |
| 403 | 3A1(z)LO | |||||
| 458 | 458 | 461 | 462 | 463 | 463 | 7E(x,y)TO |
| 595 | 595 | 592 | 596 | 599 | 594 | 4A1(z)TO(8E(x,y)TO) |
| 657 | 654 | 657 | 659 | 659 | 664 | 8E(x,y)LO(9E(x,y)TO) |
| 864 | 867 | 867 | 870 | 869 | 865 | 4A1(z)LO(9E(x,y)LO) |
Disclaimer/Publisher’s Note: The statements, opinions and data contained in all publications are solely those of the individual author(s) and contributor(s) and not of MDPI and/or the editor(s). MDPI and/or the editor(s) disclaim responsibility for any injury to people or property resulting from any ideas, methods, instructions or products referred to in the content. |
© 2023 by the authors. Licensee MDPI, Basel, Switzerland. This article is an open access article distributed under the terms and conditions of the Creative Commons Attribution (CC BY) license (https://creativecommons.org/licenses/by/4.0/).
Share and Cite
Palatnikov, M.; Sidorov, N.; Pyatyshev, A.; Skrabatun, A. Comparison of Raman Spectra of Optically Nonlinear LiTaO3:Cr3+ (0.005 wt%) Crystal Laser Excited in Visible (532 nm) and Near-IR (785 nm) Areas. Photonics 2023, 10, 439. https://doi.org/10.3390/photonics10040439
Palatnikov M, Sidorov N, Pyatyshev A, Skrabatun A. Comparison of Raman Spectra of Optically Nonlinear LiTaO3:Cr3+ (0.005 wt%) Crystal Laser Excited in Visible (532 nm) and Near-IR (785 nm) Areas. Photonics. 2023; 10(4):439. https://doi.org/10.3390/photonics10040439
Chicago/Turabian StylePalatnikov, Mikhail, Nikolay Sidorov, Alexander Pyatyshev, and Alexander Skrabatun. 2023. "Comparison of Raman Spectra of Optically Nonlinear LiTaO3:Cr3+ (0.005 wt%) Crystal Laser Excited in Visible (532 nm) and Near-IR (785 nm) Areas" Photonics 10, no. 4: 439. https://doi.org/10.3390/photonics10040439