Article

Upconversion Luminescence from Sol-Gel-Derived Erbium- and Ytterbium-Doped BaTiO3 Film Structures and the Target Form

by
Nikolai V. Gaponenko
1,*,
Nikolai I. Staskov
2,
Larisa V. Sudnik
3,
Petr A. Vityaz
3,
Alexei R. Luchanok
3,
Yuliana D. Karnilava
1,
Ekaterina I. Lashkovskaya
1,
Margarita V. Stepikhova
4,
Artem N. Yablonskiy
4,
Vadim D. Zhivulko
5,
Alexander V. Mudryi
5,
Igor L. Martynov
6,
Alexander A. Chistyakov
6,
Nikolai I. Kargin
6,
Vladimir A. Labunov
6,7,
Yuriy V. Radyush
5,
Eugene B. Chubenko
7 and
Victor Yu. Timoshenko
8
1
Laboratory of Nanophotonics, Belarusian State University of Informatics and Radioelectronics, 6 P. Browki Street, 220013 Minsk, Belarus
2
Department of Physics and Computer Technologies, Mogilev State A. Kuleshov University, 1 Kosmonavtov Street, 212022 Mogilev, Belarus
3
State Scientific Institution “Powder Metallurgy Institute Named after Academician O. V. Roman”, National Academy of Sciences of Belarus, 41 Platonova Street, 220005 Minsk, Belarus
4
Institute for Physics of Microstructures, Russian Academy of Sciences, GSP-105, 603950 Nizhny Novgorod, Russia
5
Scientific-Practical Materials Research Centre of National Academy of Sciences of Belarus, 19 P. Browki Street, 220072 Minsk, Belarus
6
Institute for Nanoengineering in Electronics, Spintronics and Photonics, National Research Nuclear University “MEPhI”, 31 Kashirskoe Shosse, 115409 Moscow, Russia
7
Department of Micro-and Nanoelectronics, Belarusian State University of Informatics and Radioelectronics, 6 P. Browki Street, 220013 Minsk, Belarus
8
Faculty of Physics, Lomonosov Moscow State University, Leninskie Gory 1, Bld.2, 119991 Moscow, Russia
*
Author to whom correspondence should be addressed.
Photonics 2023, 10(4), 359; https://doi.org/10.3390/photonics10040359
Submission received: 23 February 2023 / Revised: 16 March 2023 / Accepted: 17 March 2023 / Published: 23 March 2023

Abstract

:
Sol-gel technology has attracted attention in the fabrication of diverse luminescent materials and thin film structures, with forms that range from powders to microcavities. The optical properties of sol-gel-derived structures depend on the sol composition, deposition, and heat treatment conditions, as well as on the film thicknesses and other factors. Investigations on the upconversion luminescence of lanthanides in film structures and materials are also ongoing. In this study, we synthesized three different types of materials and film structures using the same sol, which corresponded to a Ba0.76Er0.04Yb0.20TiO3 xerogel, as follows: (a) the target form, which used the explosive compaction method for sol-gel-derived powder; (b) single-layer spin-on xerogel films annealed at 450 and 800 °C; and (c) microcavities with an undoped SiO2/BaTiO3 Bragg reflector surrounding a Ba0.76Er0.04Yb0.20TiO3 active layer. The BaTiO3:(Er,Yb)/SiO2 microcavity exhibited an enhancement of the upconversion luminescence when compared to the BaTiO3:(Er,Yb) double-layer film fabricated directly on a crystalline silicon substrate. The reflection spectra of the BaTiO3:(Er, Yb)/SiO2 microcavity annealed at 800 °C demonstrated a deviation of the maxima of the reflection within 15% for temperature measurements ranging from 26 to 120 °C. From the analyses of the transmission and reflection spectra, the optical band gap for the indirect optical transition in the single layer of the BaTiO3:(Er,Yb) spin-on film annealed at 450 °C was estimated to be 3.82 eV, while that for the film annealed at 800 °C was approximately 3.87 eV. The optical properties, upconversion luminescence, and potential applications of the BaTiO3:(Er,Yb) sol-gel-derived materials and structures are discussed in this paper.

1. Introduction

Over the past several decades, there has been a growing interest in the development of technologies for the fabrication of barium titanate targets and thin film structures [1]. High dielectric constants, low dissipation factors, large electro-optical coefficients, high breakdown voltages, and other attractive properties stimulate the application of diverse technologies for the fabrication barium titanate powders, ceramic targets, and thin films [2,3,4,5,6,7,8,9,10,11,12,13,14]. The deposition technologies for BaTiO3 in a vacuum, as well those for as sol-gel synthesis, were used to fabricate thin film capacitors [4], electro-optical devices [5,6], optical IR filters [7], photonic crystals [8,9], and microcavities [10,11]. In addition, the strong luminescence of lanthanides in BaTiO3 host materials is currently being widely investigated, particularly, Stokes luminescence under visible and UV light excitation [2,11] and upconversion photoluminescence (PL) excited under IR range illumination [12,13,14].
Recently, we reported on the sol-gel synthesis and optical properties of BaTiO3/SiO2 Bragg reflectors and microcavities [10]. In this work, we have presented data on upconversion luminescence from a sol-gel derived BaTiO3 target doped with Er and Yb, i.e., a rare-earth-doped BaTiO3:(Er,Yb) material, and we continued our investigation of the optical properties of BaTiO3/SiO2 microcavities annealed at temperatures ranging from 450 to 800 °C. We observed an enhancement of the upconversion luminescence in the microcavities with BaTiO3:(Er,Yb) active layers, as well as the stable upconversion luminescence in the target material over the year and the significant changes in the amplitudes of the reflection spectra of the BaTiO3/SiO2 microcavities annealed at 800 °C. From the transmission and reflection spectra of the BaTiO3:(Er,Yb) layer, we determined the refractive index, absorption index, optical band gap, and Urbach energy for the BaTiO3:(Er,Yb) films annealed at 450 and 800 °C.

2. Experimental

2.1. Film Structures on Silicon and Fused Silica

Three types of sol were prepared for the synthesis of sol-gel-derived film structures and the target structure. For the synthesis of the barium titanate sol (sol I), titanium isopropoxide (Ti(OC3H7)4) (97%, Sigma-Aldrich, Steinheim, Germany), barium acetate (Ba(CH3COO)2) (ACS reagent 99%, Sigma-Aldrich, Steinheim, Germany), acetylacetone (CH3COCH2COCH3) (analytical grade, AO Vekton, Saint Petersburg, Russia), and acetic acid (CH3COOH) were used as the starting components. The amounts of titanium isopropoxide and barium acetate were chosen so that the Ti/Ba ratio corresponded to the stoichiometric composition of the barium titanate in the films (i.e., Ti:Ba = 1:1). The mixture was stirred for 1 h with an electromechanical stirrer until all components were completely dissolved, resulting in a stable film-forming sol.
Sol II was prepared using the following procedure [10] for the synthesis of the BaTiO3:(Er,Yb) xerogel, namely, Ba0.76Er0.04Yb0.20TiO3. Two solutions were prepared. The solution using titanium isopropoxide (Ti(OC3H7)4) (97%, Sigma-Aldrich, Steinheim, Germany) in acetylacetone (CH3COCH2COCH3) (analytical grade, AO Vekton, Saint Petersburg, Russia) was stirred until it cooled. Separately, barium acetate (Ba(CH3COO)2) (ACS reagent 99%, Sigma-Aldrich, Steinheim, Germany) was dissolved in distilled water and stirred until completely dissolved. Erbium acetate hydrate (Er(CH3COO)3·xH2O) (99.9% trace metal basis, Sigma-Aldrich, Milwaukee, USA) was added to the barium acetate solution and stirred until complete dissolution. Then, ytterbium acetate hydrate (Yb(CH3COO)3·xH2O) (99.95% trace metal basis, Sigma-Aldrich, Milwaukee, WI, USA) was added to the solution of barium and the erbium acetates and stirred until completely dissolved. Acetic acid (CH3COOH) was added to the solution of Ba, Er, and the Yb acetates and stirred for approximately 5 min. Finally, the solutions of titanium isopropoxide and Ba, Er, and the Yb acetates were mixed and stirred for approximately 5 min. Ethanol (C2H5OH) was then added to this solution, which was then further stirred for 1.5 h.
To obtain silica xerogel (SiO2), silica sol (sol III) was prepared. Concentrated nitric acid (HNO3) (66%, reagent grade, Minimed, Bryansk, Russia) was added to an alcohol–water mixture (the volume ratio of distilled water and ethanol (C2H5OH) was approximately 1:6) until the solution reached a pH of 1. Tetraethyl orthosilicate (Si(OC2H5)4) (≥99.0% (GC), Sigma-Aldrich, Buchs, Switzerland) was added to this mixture and stirred, and the pH was adjusted again to 1 by adding concentrated nitric acid. The final solution was stirred for half an hour. The sol should be aged for at least 24 h in airtight conditions before deposition.
The sample representing a microcavity (BaTiO3:(Er,Yb)/SiO2 microcavity) was prepared by deposition wherein the sols were spun on a monocrystalline silicon substrate. After the deposition of sol I, it was dried at 200 °C for 10 min and annealed at 450 °C for 30 min. Then, sol III was deposited on the BaTiO3 xerogel layer and subjected to the same heat treatment (drying at 200 °C for 10 min and annealing at 450 °C for 30 min) to form the SiO2 xerogel film. Then, a double-xerogel layer, BaTiO3:(Er, Yb), referred to as the “active cavity layer,” was formed from sol II by sequential deposition, followed by annealing at 450 °C for 30 min. Thus, the microcavity structure with an active layer of BaTiO3:(Er,Yb), which was separated with the undoped SiO2/BaTiO3 Bragg reflectors, was fabricated, and it included a lower Bragg reflector consisting of 4 pairs of undoped BaTiO3 and SiO2 layers, a thicker (active) double-layer of BaTiO3:(Er,Yb), and an upper Bragg reflector, which also consisted of 4 SiO2/BaTiO3 pairs of undoped layers (Figure 1a). The fabricated sample with a microcavity was separated into two parts, and finally, one part with a microcavity structure was additionally annealed at 800 °C for 30 min.
Two layers of BaTiO3:(Er, Yb) xerogel were sequentially fabricated on a similar silicon substrate as the reference sample. After spinning, the first layer was annealed at 200 °C for 10 min and then again at 450 °C for 30 min. After that, the second layer was fabricated in the same way. Finally, this double-layer structure was annealed at 450 °C for five hours and then again at 800 °C for 30 min; thus, the heat treatment and thickness of this film corresponded to the heat treatment and thickness of the microcavity BaTiO3:(Er,Yb) active layer.
Additionally, one layer of BaTiO3:(Er, Yb) xerogel was fabricated on fused silica substrates by spinning and drying, followed by annealing at either 450 or 800 °C for 30 min to analyze the influence of the heat treatment on the optical characteristics of a single BaTiO3:(Er, Yb) xerogel layer.

2.2. BaTiO3 Target

Because the expensive components contained Er and Yb, we used two types of powder: a BaTiO3 xerogel powder undoped with lanthanides, prepared from sol I, and a BaTiO3:(Er,Yb) xerogel powder prepared from sol II. The xerogel powders were annealed at 1000 °C for 30 min in air. The target was compacted by pulses from a planar impact wave generator with a detonation rate of ~4000 m/s. The developed explosive compaction method produced a planar detonation front that allowed for mixing the upper layers to be significantly reduced and the faceting of the formed target to be improved. A target form with a diameter of 48 mm and a thickness of 4 mm was formed from the BaTiO3 xerogel powders. Thus, the top part of the target (the front side) was enriched with Er and Yb, whereas the bottom side was depleted with lanthanides.

2.3. Structural and Optical Studies

The morphologies of the obtained samples were studied using a Hitachi S-4800 scanning electron microscope (SEM) (Hitachi, Tokyo, Japan) equipped with a Bruker Quantax 200 spectrometer (Bruker, Berlin, Germany) for the energy dispersive X-ray analyses (EDX).
Studies of the upconversion photoluminescence were carried out under continuous-wave (CW) or pulsed optical excitation. A focused 980 nm laser beam of a 200 mW diode module was used for the excitation of the upconversion PL (power density J ~10 W/cm2) in the CW mode. The emission in the visible range was focused on the entrance slit of a 0.6 m grating spectrometer equipped with 1200 gr/mm gratings, and the PL intensity was measured using a R 9110 Hamamatsu photomultiplier tube that was sensitive in the spectral range of 200–850 nm. The spectral resolution of the PL measurement system was ~0.6 nm. A lock-in-amplifier with mechanical chopping at a frequency of approximately 20 Hz was used for the signal recovery.
The time-resolved upconversion PL spectra were measured using an optical parametric oscillator (OPO) (Newport, CA, USA) pumped with the third harmonic (355 nm) of a pulsed Nd:YAG laser and tuned in the spectral range of 700 to 1600 nm. The OPO pulse duration was 10 ns, the repetition rate was 10 Hz, and the average power was ~5 mW. Registration of the upconversion PL in the visible range was carried out using an Acton 2300i (Princeton instruments, Trenton, NJ, USA) grating spectrometer, an Si-based PMT (350–800 nm), and a LeCroy digital oscilloscope (LeCroy, New York, NY, USA).
The spectra of the optical reflection and transmission of the prepared samples were measured using a Cary-500 ScanUV-VIS-NIR spectrophotometer (Varian, Mulgrave, Australia) and an MS122 spectrophotometer (PROSCAN Special Instruments, Minsk, Belarus).
The spectra of the reflection in the temperature range of 26–120 °C were measured using an Ocean Optics USB2000+ spectrometer (Ocean Optics, Dunedin, FL, USA) equipped with a fiber reflection probe and a halogen lamp. During the measurements, the samples were placed horizontally on the heating table, and the sample surface temperatures were monitored by a thermocouple.
The X-ray diffraction (XRD) studies of the target were carried out with a DRON-3 diffractometer (Burevestnik, Leningrad, USSR) using monochromatic Cu Ka radiation with an exposition of 2 s per 0.04° step at room temperature.
The Raman spectra were recorded using a SOL Instruments Confotec NR500 3D scanning laser Raman spectrometer (SOL Instruments, Minsk, Belarus) with a 473 nm laser diode as the source.

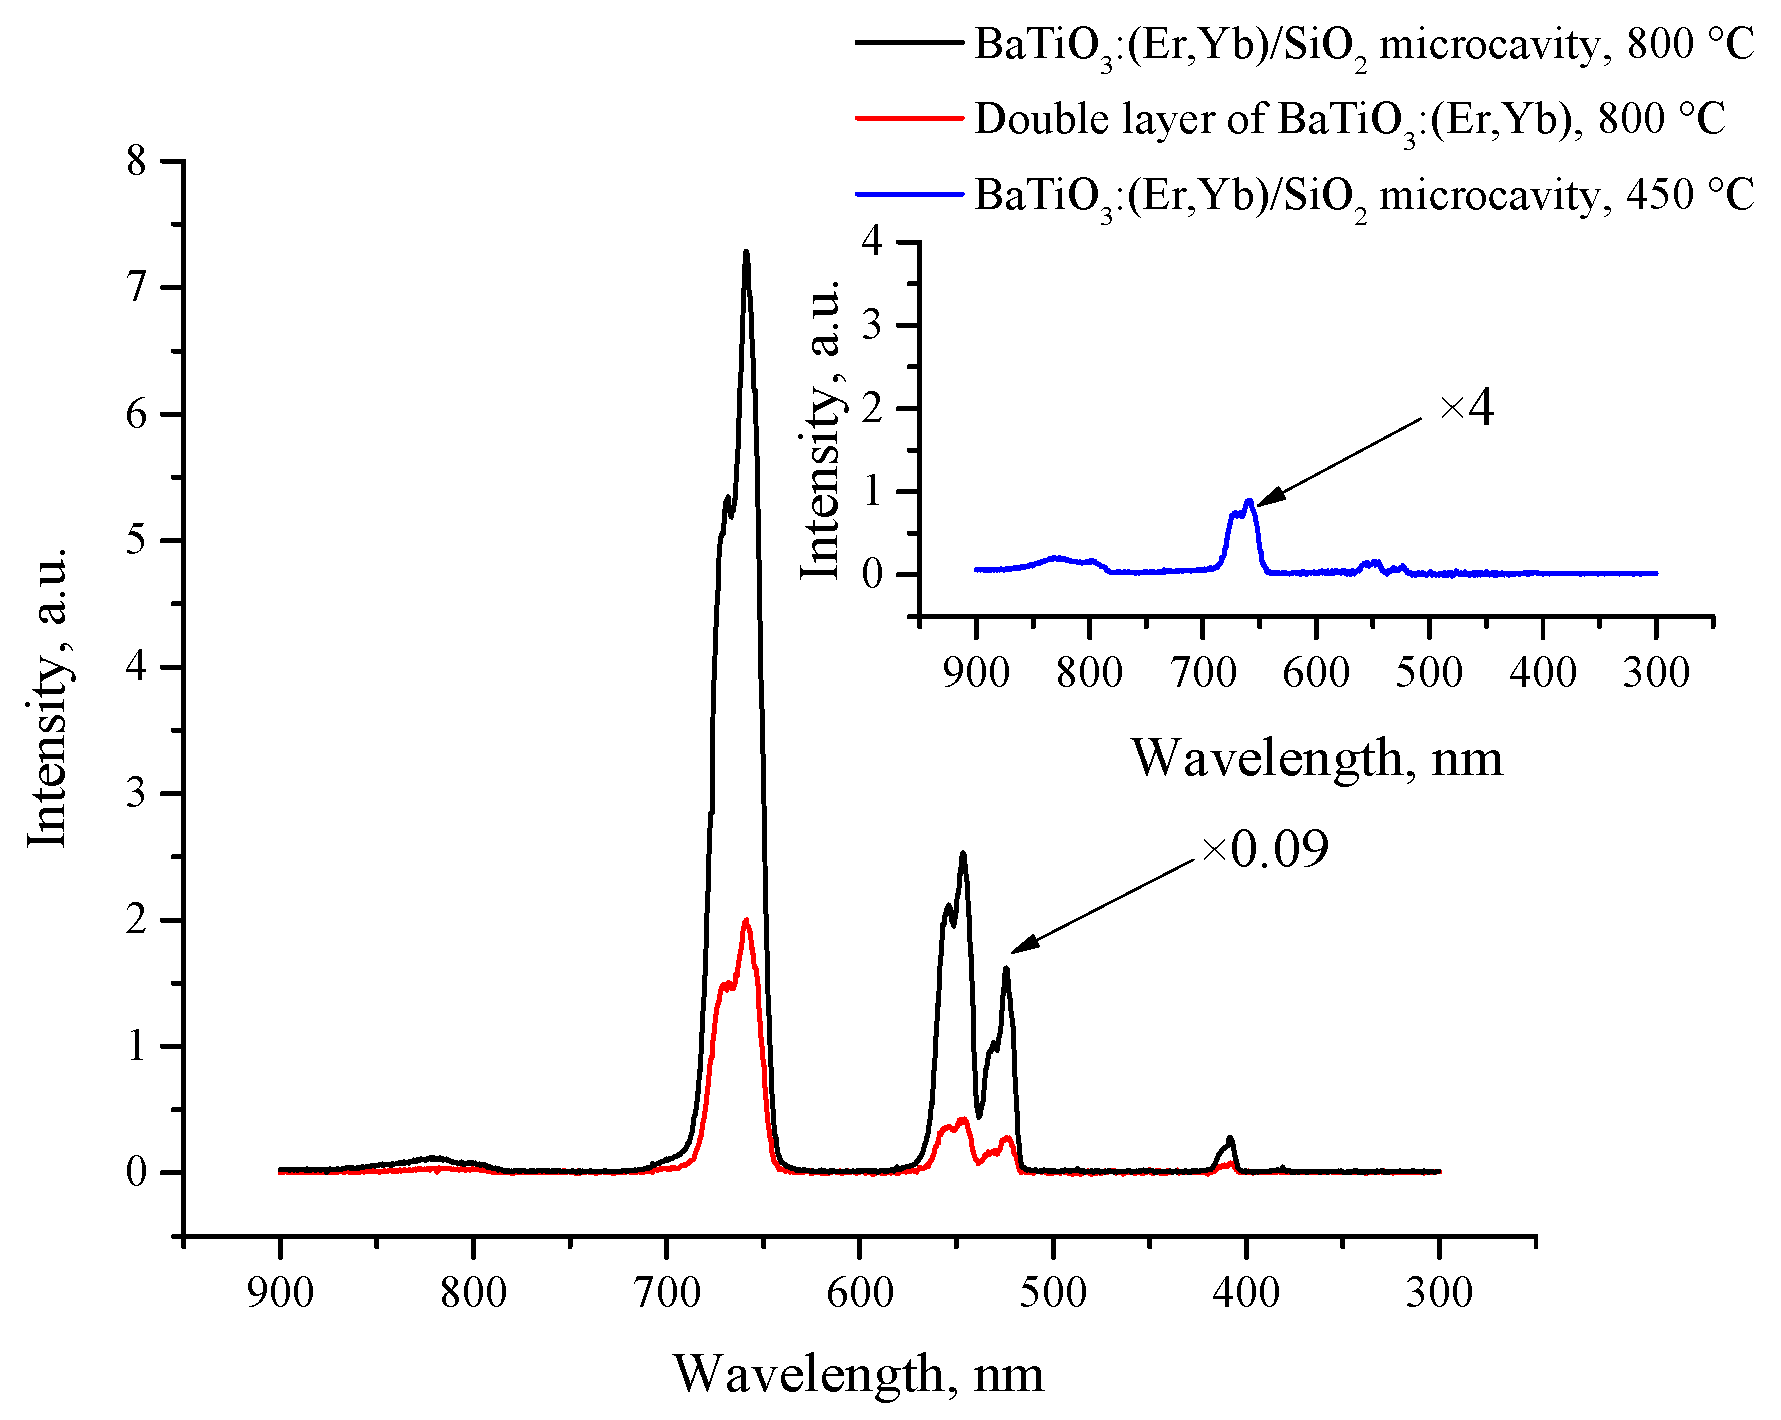
3. Results and Discussion

Figure 1 illustrates the scheme of the fabricated BaTiO3:(Er,Yb)/SiO2 microcavity and its SEM image after annealing at 450 °C. The image shows a microcavity with an overall thickness of approximately 1.4 μm and a BaTiO3:(Er,Yb) active layer thickness of approximately 150 nm.
Table 1 displays the EDX data of the BaTiO3:(Er,Yb) target prepared from the same sol (sol II) as the cavity layer. The data were collected from the lanthanide-enriched front side of the target.
According to the EDX studies of the BaTiO3:(Er,Yb) target, the average total concentration of Er and Yb was 3.4 at. % with the ratio Er:Yb ≈ 1:5 and standard deviations of 0.1 at. % for the Er and 0.2 at. % for the Yb.
The XRD spectrum of the BaTiO3 (Er:Yb)/BaTiO3 target (Figure 2a) consisted of both the lines related to the BaTiO3 and additional lines that could be attributed to the phase “A”. The numbers represent the perovskite BaTiO3 lines’ hkl indices while the letter “A“ stands for the lines’ “A” phases. It could be seen that the crystalline structure of the target was a cubic perovskite lattice with a cell parameter of approximately 4.009 Å. The absence of splitting of the 200 reflections into tetragonal 002/200 reflections supported our assumptions about the cubic structure of the BaTiO3. The phase marked “A” on the X-ray diffraction pattern could be attributed to the Er2O3, along with the cubic structure of the F m 3 ¯ m (225) space group, similar to the results for rare earth oxide thin films [15], though their cell parameters are somewhat smaller than those in this paper.
The Raman spectra recorded from both sides of the target revealed the characteristic lines at 260, 293, 521, and 725 cm−1 (Figure 2b), corresponding to the three major vibration modes of crystalline BaTiO3 (A(TO), E(TO-LO), and (A + E)(LO)) [16]. The spectra recorded from the front side enriched with the lanthanides showed an additional set of lines in the range of 1900–3000 cm−1, which was associated with the photoluminescence of the trivalent Er ions excited by the 473 nm laser line. The obtained spectra confirmed both the BaTiO3 crystalline phase and the presence of trivalent erbium ions in the target.
Being excited at 980 nm the front side of the target exhibited bright orange room-temperature upconversion PL, with the main bands at 410, 523, 546, and 658 nm (Figure 3a,b), which were related to the 2H9/24I15/2, 2H11/24I15/2, 4S3/24I15/2, and 4F9/24I15/2 transitions in the Er3+ ions, respectively. These upconversion luminescence bands were also observed in the diverse matrices doped with erbium and ytterbium, e.g., CaIn2O4, CaGd2 (WO4)4, and LixNa1-xCaLa0.5 (MoO4)3 [17,18,19].
The upconversion PL intensity was stable and efficient during storage of the target in room-temperature conditions for one year. The PL intensity was approximately six times higher compared to the previously fabricated BaTiO3 target doped with ~3.8 at. % of Er without sensitized Yb ions, as described in [20]. Figure 3c shows the PL excitation (PLE) spectrum of the BaTiO3:(Er,Yb) target. We assumed that the relatively broad PLE spectrum within the range of excitation wavelengths 935–980 nm corresponded to a high absorption cross-section of Yb3+ ions [21], and that it was a result of the Stark splitting of the Yb3+ energy levels in the fabricated BaTiO3:(Er,Yb) target.
An enhancement of the upconversion PL was observed in the BaTiO3: (Er,Yb)/SiO2 microcavity structure in comparison with that in the BaTiO3:(Er,Yb) film (Figure 4). The upconversion PL from the BaTiO3:(Er,Yb) layer surrounded with the SiO2/BaTiO3 Bragg reflectors was approximately 40 times higher than that of the BaTiO3:(Er,Yb) layer of approximately the same thickness that was subjected to the same heating method. This result confirmed the earlier reports on the enhanced PL of lanthanides from microcavities prepared using vacuum deposition [22], electrochemistry [23], or the sol-gel method [11,24,25]. The inset of Figure 4 represents the upconversion PL spectrum of the microcavity annealed at 450 °C. The microcavity structure annealed at 450 °C was 360 times weaker compared with the microcavity structure annealed at 800 °C. In contrast to the microcavity structure, no upconversion PL in the BaTiO3:(Er, Yb) double layer on the silicon annealed at 450 °C was observed (not shown).
Figure 5a,b shows the reflection spectra of the microcavities recorded at different temperatures. Unlike the microcavity fabricated at 450 °C on a fused silica substrate (reported earlier) [10], the high temperature annealing of the microcavity at 800 °C revealed two results. First, the shift in the cavity mode was not as pronounced after annealing the microcavity at a lower temperature, namely, 450 °C [10]. Second, there was a significant deviation in the reflection maxima, e.g., at 512 nm, of the microcavity annealed at 800 °C. The corresponding reflection values changed within 15% in the temperature range of measurements from 25 to 120 °C (Figure 5c).
The prepared target appeared to be useful for potential applications as an IR laser radiation visualizer and for the production of BaTiO3 film structures by sputtering in a vacuum. The effect of sample temperature on the amplitude of the reflection spectrum, as well as an intense upconversion luminescence for structures treated at 800 °C, and the previously noted shift of the cavity mode for the less-dense xerogel structures treated at 450 °C [10] encourage further research into the characteristics of barium titanate structures doped with lanthanides for optical adsorption and for use as temperature sensors and remote monitoring systems [26,27,28].
Further, on the basis of the measured reflections and transmission spectra of the single-layer BaTiO3:(Er,Yb) films annealed either at 450 or 800 °C on a plane-parallel dielectric substrate of finite thickness, we calculated the complex refractive index N = n i k of the BaTiO3:(Er,Yb) by optimizing the parameters of the Lagrange–Chebyshev polynomial fit (for the details of solving the inverse spectrometry problem, see [29]). The following physical values for these two single-layer BaTiO3:(Er,Yb) films annealed at 450 or 800 °C were determined from the reflections and transmission spectra: n , k , E g , and E u , where n is the real part of the refractive index of the film, k is the imaginary part of the refractive index or absorption index, E g is the optical band gap, and E u is the Urbach energy.
The obtained solution of the inverse spectrophotometry problem provided the results presented in Figure 6, Figure 7 and Figure 8. Figure 6 depicts the reflection and transmission spectra of the single-layer BaTiO3:(Er,Yb) films deposited on the fused silica substrates and annealed at 450 or 800 °C. The triangles and circles represent the experimental points, and the solid lines are the calculated spectra. Figure 7 shows the calculated spectra of the refractive index n (Figure 7a) and the absorption index k   (Figure 7b) for a single-layer BaTiO3:(Er,Yb) film annealed at 450 and 800 °C. The discrepancy χ between the measured and calculated data satisfied the criterion χ 2 1 . The thickness of the single-layer film annealed at 450 °C was 99 nm and that of the film annealed at 800 °C was 65 nm. The higher annealing temperature led to a decrease in the BaTiO3:(Er,Yb) film thickness that was typical for sol-gel derived films and particularly for BaTiO3:(Er,Yb) films, and that for the undoped BaTiO3 films was confirmed by means of SEM in [9,10]. The decrease in the film thickness meant an increase in the film density ρ , which could lead to a larger refractive index, in accordance with the Lorentz–Lorenz formula ( n 2 1 ) / ( n 2 + 1 ) ~ ρ [30].
The higher reflectivity in the spectral region from 400 to 800 nm (Figure 6a) corresponded to the relatively low absorption (Figure 7b) that resulted in the lower transmittance (Figure 6b) for the film annealed at 800 °C in comparison with that of the film annealed at 450 °C.
In Figure 7b, in the UV range, the maximum of k ( λ ) for the film annealed at 800 °C was two times higher than that for the film annealed at 450 °C, while in the visible range, the maximum of k ( λ ) was two times lower than that for the film annealed at 450 °C. The increase in the refractive index n (Figure 7a) with the increase in the annealing temperature of the film resulted in significant increases in their reflectivity R (Figure 6a). Large losses of light energy due to the reflection and small losses due to the absorption (Figure 7b) led to decreases in the transmittance T in the visible and near-IR regions with the increase in the annealing temperature. In fact, BaTiO3 is known to be an appealing host of lanthanides for the UV excitation of visible luminescence [11], as well as an appealing transparent coating for UV filters and solar cells for the prevention of thermalization.
Then we calculated the absorption coefficient α ( λ ) using the following formula:
α ( λ ) = 4 π k ( λ ) λ 10 7 ,
and the Tauc extrapolation [31] is used as follows:
[ α ( λ ) E ] m = B ( E E g ) ,
to determine the optical band gaps of the BaTiO3: (Er,Yb) films.
In Formula (2), B is a constant, E = 1240   λ 1 is the photon energy in eV, and the wavelength λ is taken in nm. The intersection of the linear range of the dependence [ α ( λ ) E ] m with the E axis yields the estimated value of E g . The estimation of the optical band gap is given in Figure 8 by assuming the indirect optical transition ( m = 0.5 ). We concluded that E g = 3.82   eV for the film annealed at 450 °C, while it was approximately 3.87   eV for the film annealed at 800 °C.
The Urbach energy is determined by analyzing the plot of ln   ( α ( E ) ) , as shown in the inset of Figure 8. In this case, the following function:
f ( E ) = ln ( α ( 1240 E g 1 ) exp ( ( E E g ) E u 1 ) ) ,
is linear and must pass through the corresponding points of the function ln ( α ( E ) ) .
An analysis of the absorption spectra shown in Figure 7b by using Formula (3) allowed us to estimate E u = 0.21   eV and 0.16 eV for the films annealed at 450 °C and 800 °C, respectively. The lower Urbach energy for the higher annealing temperature could be explained by a decrease in the crystal lattice disorder in the nanocrystalline BaTiO3 film. In fact, the Urbach tail states, which provide information about various disorders related to the random distribution of both intrinsic atoms and impurities [32,33,34], should decrease with an increase in the annealing temperature because the contribution of the amorphous phase becomes smaller. This fact was also proved by the increase in absorption in the high energy region, as shown in Figure 7 and Figure 8.
The estimated optical band gaps for our samples were comparable to the data for the undoped 300-nm-thick BaTiO3 films with a grain size of approximately 95 nm that were produced using pulsed laser deposition and had an optical band gap of 3.77 eV [34]. The difference in the optical band gap measured for thin films generated in the present work as well as in Ref. [34] and for the solution-grown crystals of BaTiO3 (3.38 and 3.27 eV, respectively, for two directions of the light polarization [35]) could be explained by considering the quantum confinement for charge carriers in low-dimensional BaTiO3 films and nanocrystalline structures [36,37]. According to Suzuki and Kijima [37], the band gap of BaTiO3 was estimated to be at a constant value of approximately 3.2 eV for the BaTiO3 particles larger than 15 nm, which is in agreement with the data reported by Wemple [33] for a BaTiO3 crystal, and E g gradually increased as the particle sizes smaller than 11.5 nm decreased, and it was approximately 0.25 eV larger than that of the bulk BaTiO3.
The observed enhancement of the upconversion luminescence in the film annealed at 800 °C could be explained by thermal annealing of the nonradiative centers, which control the population of the excited states of trivalent erbium. The most probable candidates are the intrinsic defect states in the band gap of the barium titanate matrix, which are detectable as the Urbach tail states in the absorption spectra (Figure 8), and the hydroxyl groups, which are known to be responsible for the quenching of the erbium luminescence in oxide matrices [38]. The higher annealing temperature resulted in the lower efficiencies of both quenching processes in the investigated samples.

4. Conclusions

Colloidal solutions for the synthesis of BaTiO3 xerogel doped with Er and Yb (Ba0.76Er0.04Yb0.20TiO3) were used for the fabrication of a sol-gel-derived target using the explosive compaction method and a spin-on deposited multilayer microcavity structure (BaTiO3:(Er,Yb)/SiO2 microcavity), demonstrating the strong room-temperature upconversion photoluminescence of trivalent erbium ions. The BaTiO3:(Er,Yb)/SiO2 microcavity exhibited a significant increase in upconversion photoluminescence when compared to the BaTiO3:(Er,Yb) double-layer that was fabricated directly on silicon. The enhanced upconversion photoluminescence was also observed in the microcavity structure annealed at 800 °C. The reflection spectra of the BaTiO3:(Er, Yb)/SiO2 microcavity annealed at 800 °C demonstrated a deviation in the maxima of the reflection spectra within 15% for the temperature range of 26–120 °C. From the analysis of the transmission and reflection spectra, we determined that, for the single layer of BaTiO3:(Er,Yb) spin-on film annealed at 450 °C, the optical band gap for indirect electron transitions was E g = 3.82   eV , while for the film annealed at 800 °C, it was equal to E g = 3.87   eV . The results obtained demonstrate new possibilities for tuning the optical properties and efficiencies of the upconversion luminescence of rare-earth-doped sol-gel materials and structures for photonic applications.

Author Contributions

Conceptualization, N.V.G.; methodology, L.V.S., A.R.L. and A.A.C.; investigation, Y.D.K., E.I.L., A.R.L., E.B.C., M.V.S., A.N.Y., V.D.Z., A.V.M., Y.V.R. and V.Y.T.; data curation, A.V.M., I.L.M. and N.I.S.; writing—original draft preparation, N.V.G. and N.I.S.; writing—review and editing, Y.D.K. and V.Y.T.; visualization, Y.D.K.; supervision, P.A.V., V.A.L. and N.I.K.; project administration, N.V.G. All authors have read and agreed to the published version of the manuscript.

Funding

This research was funded by Belarusian Republic Foundation for Fundamental Research by grant F22KITG-008 and grant F22MLDG-002, grant T23RNF-147; by Ministry of Education of the Republic of Belarus: project 1.4 of the Belarusian State Scientific Research Program “Chemical processes, reagents and technologies, bioregulators and bioorgchemistry”, project 2.1.02 of the Belarusian State Scientific Research Program “Convergence 2025”, and projects 1.15 and 3.5 of the Belarusian State Scientific Research Program “Photonics and Electronics for Innovations”.

Institutional Review Board Statement

Not applicable.

Informed Consent Statement

Not applicable.

Data Availability Statement

Not applicable.

Acknowledgments

The authors acknowledge T.F. Raichenok from B. I. Stepanov Institute of Physics, National Academy of Sciences of Belarus for her assistance with the optical measurements and the center “Physics and technology of micro-and nanostructures”, Institute for Physics of Microstructures, Russian Academy of Sciences for the equipment provided.

Conflicts of Interest

The authors declare no conflict of interest. The funders had no role in the design of the study; in the collection, analyses, or interpretation of data; in the writing of the manuscript; or in the decision to publish the results.

References

  1. Karvounis, A.; Timpu, F.; Vogler-Neuling, V.V.; Savo, R.; Grange, R. Barium titanate nanostructures and thin films for photonics. Adv. Opt. Mater. 2020, 8, 2001249. [Google Scholar] [CrossRef]
  2. Strek, W.; Hreniak, D.; Boulon, G.; Guyot, Y.; Pazik, R. Optical behavior of Eu3+-doped BaTiO3 nano-crystallites prepared by sol–gel method. Opt. Mater. 2003, 24, 15–22. [Google Scholar] [CrossRef]
  3. Kumari, M.; Yadav, A.; Sarun, P.M. Systematic investigation of structural, optical and dielectric properties of 0.5 mol% Eu:BaTiO3 ceramics. Mater. Today Proc. 2020, 46, 6102–6106. [Google Scholar] [CrossRef]
  4. Jia, Q.X.; Shi, Z.Q.; Anderson, W.A. BaTiO3 thin film capacitors deposited by r.f. magnetron sputtering. Thin Solid Films 1992, 209, 230–239. [Google Scholar] [CrossRef]
  5. Petraru, A.; Schubert, J.; Schmid, M.; Buchal, C. Ferroelectric BaTiO3 thin-film optical waveguide modulators. Appl. Phys. Lett. 2002, 81, 1375–1377. [Google Scholar] [CrossRef] [Green Version]
  6. Tang, P.; Towner, D.; Hamano, T.; Meier, A.; Wessels, B. Electrooptic modulation up to 40 GHz in a barium titanate thin film waveguide modulator. Opt. Express 2004, 12, 5962–5967. [Google Scholar] [CrossRef]
  7. Subasri, R.; Reddy, D.S.; Soma Raju, K.R.C.; Rao, K.S.; Kholov, P.; Gaponenko, N. Sol–gel derived Ba/SrTiO3–MgF2 solar control coating stack on glass for architectural and automobile applications. Res. Chem. Intermed. 2019, 45, 4179–4191. [Google Scholar] [CrossRef]
  8. Zhou, J.; Sun, C.Q.; Pita, K.; Lam, Y.L.; Zhou, Y.; Ng, S.L.; Kam, C.H.; Li, L.T.; Gui, Z.L. Thermally tuning of the photonic band gap of SiO2 colloid-crystal infilled with ferroelectric BaTiO3. Appl. Phys. Lett. 2001, 78, 661–663. [Google Scholar] [CrossRef]
  9. Gaponenko, N.V.; Kholov, P.A.; Sukalin, K.S.; Raichenok, T.F.; Tikhomirov, S.A.; Subasri, R.; Soma Raju, K.R.C.; Mudryi, A.V. Optical properties of multilayer BaTiO3/SiO2 film structures formed by the sol–gel method. Phys. Solid State 2019, 61, 397–401. [Google Scholar] [CrossRef]
  10. Lashkovskaya, E.I.; Gaponenko, N.V.; Stepikhova, M.V.; Yablonskiy, A.N.; Andreev, B.A.; Zhivulko, V.D.; Mudryi, A.V.; Martynov, I.L.; Chistyakov, A.A.; Kargin, N.I.; et al. Optical properties and upconversion luminescence of BaTiO3 xerogel structures doped with erbium and ytterbium. Gels 2022, 8, 347. [Google Scholar] [CrossRef]
  11. Gaponenko, N.V.; Kholov, P.A.; Raichenok, T.F.; Prislopski, S.Y. Enhanced luminescence of europium in sol-gel derived BaTiO3/SiO2 multilayer cavity structure. Opt. Mater. 2019, 96C, 109265–109269. [Google Scholar] [CrossRef]
  12. Ghosh, P.; Sadhu, S.; Sen, T.; Patra, A. Upconversion emission of BaTiO3:Er nanocrystals. Bull. Mater. Sci. 2008, 31, 461–465. [Google Scholar] [CrossRef]
  13. Chen, L.; Wei, X.; Fu, X. Effect of Er substituting sites on upconversion luminescence of Er3+-doped BaTiO3 films. Trans. Nonferr. Met. Soc. China 2012, 22, 1156–1160. [Google Scholar] [CrossRef]
  14. Bae, H.; Lee, E.; Lee, K.T. Power-dependent photophysical pathways of upconversion in BaTiO3:Er3+. Phys. Chem. Chem. Phys. 2021, 23, 14587–14591. [Google Scholar] [CrossRef] [PubMed]
  15. Kashaev, A.A.; Ushchapovskii, L.V.; Il’in, A.G. Electron-diffraction and X-ray diffraction study of rare earth metal oxides in thin films. Sov. Phys. Crystallogr. 1975, 20, 114–115. [Google Scholar]
  16. Parsons, J.L.; Rimai, L. Raman spectrum of BaTiO3. Solid State Commun. 1967, 5, 423–427. [Google Scholar] [CrossRef]
  17. Lim, C.S.; Aleksandrovsky, A.; Molokeev, M.; Oreshonkov, A.; Atuchin, V. Microwave sol–gel synthesis and upconversion photoluminescence properties of CaGd2(WO4)4:Er3+/Yb3+ phosphors with incommensurately modulated structure. J. Solid State Chem. 2015, 228, 160–166. [Google Scholar] [CrossRef]
  18. Liu, M.H.; Li, T.T.; Wang, X.; Liu, D.Y.; Yuan, N.; Zhang, D.L.; Tian, Y. Synthesis and Er3+ spectroscopic property of Er3+/Yb3+-codoped CaIn2O4 nano-fibers for thermometry. J. Lumin. 2019, 215, 116703. [Google Scholar] [CrossRef]
  19. Lim, C.S.; Aleksandrovsky, A.; Molokeev, M.; Oreshonkov, A.; Atuchin, V. Structural and spectroscopic effects of Li+ substitution for Na+ in LixNa1−xCaLa0.5Er0.05Yb0.45(MoO4)3 upconversion scheelite-type phosphors. Crystals 2023, 13, 362. [Google Scholar] [CrossRef]
  20. Gaponenko, N.V.; Sudnik, L.V.; Vityaz, P.A.; Luchanok, A.R.; Stepikhova, M.V.; Yablonskiy, A.N.; Lashkovskaya, E.I.; Shustsikava, K.V.; Radyush, Y.V.; Zhivulko, V.D.; et al. Upconversion luminescence of Er3+ ions from barium titanate xerogel powder and target fabricated by explosive compaction method. J. Appl. Spectrosc. 2022, 89, 238–243. [Google Scholar] [CrossRef]
  21. Tolstik, N.A.; Kurilchik, S.V.; Kisel, V.E.; Kuleshov, N.V.; Maltsev, V.V.; Pilipenko, O.V.; Koporulina, E.V.; Leonyuk, N.I. Efficient 1 W continuous-wave diode-pumped Er,Yb:YAl3(BO3)4 laser. Opt. Lett. 2007, 32, 3233–3235. [Google Scholar] [CrossRef] [PubMed] [Green Version]
  22. Schubert, E.F.; Vredenberg, A.M.; Hunt, N.E.J.; Wong, Y.H.; Becker, P.C.; Poate, J.M.; Jacobson, D.C.; Feldman, L.C.; Zydzik, G.J. Giant enhancement of luminescence intensity in Er-doped Si/SiO2 resonant cavities. Appl. Phys. Lett. 1992, 61, 1381–1383. [Google Scholar] [CrossRef]
  23. Lopez, H.A.; Fauchet, P.M. Erbium emission from porous silicon one-dimensional photonic band gap structures. Appl. Phys. Lett. 2000, 77, 3704–3706. [Google Scholar] [CrossRef]
  24. Bellessa, J.; Rabaste, S.; Plenet, J.C.; Dumas, J.; Mugnier, J.; Marty, O. Eu3+-doped microcavities fabricated by sol–gel process. Appl. Phys. Lett. 2001, 79, 2142–2144. [Google Scholar] [CrossRef]
  25. Rojas-Hernandez, R.E.; Santos, L.F.; Almeida, R.M. Photonic crystal assisted up-converter based on Tb3+/Yb3+-doped aluminosilicate glass. Opt. Mater. 2018, 83, 61–67. [Google Scholar] [CrossRef]
  26. Mitschke, F. Fiber-optic sensor for humidity. Opt. Lett. 1989, 14, 967–969. [Google Scholar] [CrossRef]
  27. Tripathy, A.; Pramanik, S.; Cho, J.; Santhosh, J.; Abu Osman, N.A. Role of morphological structure, doping, and coating of different materials in the sensing characteristics of humidity sensors. Sensors 2014, 14, 16343–16422. [Google Scholar] [CrossRef] [PubMed]
  28. Ryszczyńska, S.; Trejgis, K.; Marciniak, Ł.; Grzyb, T. Upconverting SrF2:Er3+ Nanoparticles for Optical Temperature Sensors. ACS Appl. Nano Mater. 2021, 4, 10438–10448. [Google Scholar] [CrossRef]
  29. Sotsky, A.B.; Mikheev, S.S.; Stas’kov, N.I.; Sotskaya, L.I. Spectrophotometry of Layers on Plane Parallel Substrates. Opt. Spectrosc. 2020, 128, 1155–1166. [Google Scholar] [CrossRef]
  30. Born, M.; Wolf, E. Principles of Optics: Electromagnetic Theory of Propagation, Interference and Diffraction of Light, 6th ed.; Elsevier: Amsterdam, The Netherlands, 2013. [Google Scholar]
  31. Tauc, J.; Grigorovici, R.; Vancu, A. Optical properties and electronic structure of amorphous germanium. Phys. Status Solidi 1966, 15, 627–637. [Google Scholar] [CrossRef]
  32. Mishra, V.; Sagdeo, A.; Kumar, V.; Warshi, M.K.; Rai, H.M.; Saxena, S.K.; Roy, D.R.; Mishra, V.; Kumar, R.; Sagdeo, P.R. Electronic and optical properties of BaTiO3 across tetragonal to cubic phase transition: An experimental and theoretical investigation. J. Appl. Phys. 2017, 122, 065105. [Google Scholar] [CrossRef]
  33. Borah, M.; Mohanta, D. Effect of Gd3+ doping on structural, optical and frequency-dependent dielectric response properties of pseudo-cubic BaTiO3 nanostructures. Appl. Phys. A 2014, 115, 1057–1067. [Google Scholar] [CrossRef]
  34. Ahadi, K.; Mahdavi, S.M.; Nemati, A.; Tabesh, M.; Ranjbar, M. Electronic structure and morphological study of BaTiO3 film grown by pulsed-laser deposition. Mater. Lett. 2012, 72, 107–109. [Google Scholar] [CrossRef]
  35. Wemple, S.H. Polarization fluctuations and the optical-absorption edge in BaTiO3. Phys. Rev. B 1970, 2, 2679–2689. [Google Scholar] [CrossRef]
  36. Cullis, A.; Canham, L. Visible light emission due to quantum size effects in highly porous crystalline silicon. Nature 1991, 353, 335–338. [Google Scholar] [CrossRef]
  37. Suzuki, K.; Kijima, K. Optical band gap of barium titanate nanoparticles prepared by RF-plasma chemical vapor deposition. Jpn. J. Appl. Phys. 2005, 44, 2081–2082. [Google Scholar] [CrossRef]
  38. Yan, Y.; Faber, A.J.; de Waal, H. Luminescence quenching by OH groups in highly Er-doped phosphate glasses. J. Non-Cryst. Solids 1995, 181, 283–290. [Google Scholar] [CrossRef] [Green Version]
Figure 1. (a) Scheme of the microcavity BaTiO3: (Er,Yb)/SiO2 structure and (b) its SEM image after the heat treatment at 450 °C.
Photonics 10 00359 g001
Figure 2. XRD and Raman spectroscopic characterizations of the BaTiO3 (Er:Yb)/BaTiO3 target: (a) XRD angular spectrum; and (b) Raman spectra from the front (red line) and bottom (black line) sides of the target.
Photonics 10 00359 g002
Figure 3. Upconversion PL spectra of the BaTiO3 (Er:Yb)/BaTiO3 target: (a) room-temperature upconversion PL spectrum under the excitation wavelength of 980 nm; (b) energy level diagram of the upconversion PL excitation, where GSA refers to the ground state absorption and ET refers to the energy transfer, colored arrows denote radiative transitions between the energy levels of Er3+ ions; and (c) PLE spectra for the PL wavelength of 550 nm for the BaTiO3 (Er:Yb)/BaTiO3 target (red line with circles) and for a sample of BaTiO3 with ~3.8 at. % of Er without sensitized Yb ions (black line with circles), respectively.
Photonics 10 00359 g003
Figure 4. Room-temperature upconversion PL spectra of the BaTiO3:(Er,Yb)/SiO2 microcavity (black curve) and the double-layer BaTiO3:(Er,Yb) structure (red curve) on a silicon substrate after annealing at 800 °C. the inset depicts the spectrum of the upconversion PL of the microcavity (blue curve) after annealing at 450 °C.
Photonics 10 00359 g004
Figure 5. (a) Reflection spectra of the BaTiO3:(Er,Yb)/SiO2 microcavity annealed at 450 °C, measured in the temperature range of 26–130 °C during heating (solid lines), followed by cooling (dashed lines), while the inset shows a selected enlarged region of these spectra. (b) Reflection spectra of the same microcavity after annealing at 800 °C, measured at different temperatures during heating (solid lines), followed by cooling (dashed lines), while the inset shows a selected enlarged region of these spectra. (c) Reflection data for the chosen wavelengths for the sample annealed at 800 °C for one cycle of heating (circles with solid lines), followed by cooling (triangles with dashed lines).
Photonics 10 00359 g005
Figure 6. (a) Reflection and (b) transmission spectra of the single-layer BaTiO3:(Er,Yb) films deposited on fused silica substrates annealed at 450 and 800 °C. The triangles and circles represent the experimental data of the transmission ( T e ) and reflection ( R e ), and the solid lines are the calculated transmission ( T t ) and reflection ( R t ) spectra.
Photonics 10 00359 g006
Figure 7. (a) Spectra of the refractive index n and (b) the absorption index k for the two BaTiO3: (Er,Yb) films annealed at 450 and 800 °C.
Photonics 10 00359 g007
Figure 8. Estimation of the optical band gap and the Urbach energy for the indirect transitions in the BaTiO3:(Er,Yb) films annealed at 450 and 800 °C.
Photonics 10 00359 g008
Table 1. Chemical composition of the lanthanide-enriched front side of the target determined from the EDX-analysis data averaged from five points of the target’s surface.
ElementConcentration, at. %Standard Deviation, at. %
O55.60.6
Ti19.00.8
Ba16.60.8
C5.40.6
Yb2.80.2
Er0.60.1
Disclaimer/Publisher’s Note: The statements, opinions and data contained in all publications are solely those of the individual author(s) and contributor(s) and not of MDPI and/or the editor(s). MDPI and/or the editor(s) disclaim responsibility for any injury to people or property resulting from any ideas, methods, instructions or products referred to in the content.

