Article

Real-Time Chlorophyll-a Pigment Monitoring of Chlamydomonas reinhardtii in a Controlled Environment Using Pulsed LED Fluorescence LiDAR System

by
Jumar G. Cadondon
1,2,*,
Edgar A. Vallar
1,
Tatsuo Shiina
3 and
Maria Cecilia D. Galvez
1
1
Environment and Remote Sensing Research (EARTH) Laboratory, Physics Department, College of Science, De La Salle University Manila, 2401 Taft Avenue, Manila 0922, Philippines
2
Division of Physical Sciences and Mathematics, College of Arts and Sciences, University of the Philippines Visayas-Miagao Campus, Miagao 5023, Philippines
3
Graduate School of Engineering, Chiba University, Yayoi-cho, Chiba-shi 263-8522, Japan
*
Author to whom correspondence should be addressed.
Photonics 2023, 10(2), 144; https://doi.org/10.3390/photonics10020144
Submission received: 15 December 2022 / Revised: 21 January 2023 / Accepted: 26 January 2023 / Published: 30 January 2023
(This article belongs to the Special Issue Micro Fluorescence Detectors/Sensors and Their Applications)

Abstract

:
The real-time chlorophyll-a pigment monitoring of C. reinhardtii is studied using our developed LED fluorescence light detection and ranging (LiDAR) system. It features a portable set-up that uses a pulsed LED module with an excitation wavelength of 385 nm. We were able to monitor the different growth phases of C. reinhardtii with specific cultivation parameters. The developed fluorescence LiDAR system showed the linear correlation of its chlorophyll-a signal with the optical density and EEM fluorescence measurements at 680 nm emission wavelength. Water quality and weather parameters were also measured, which explains the variation in the growth dynamics of C. reinhardtii during the sampling period. The results from the monitoring demonstrated a different technique that can be used in estimating algal biomass in the environment.

1. Introduction

Photosynthetic microbes such as algae are commonly used in different sectors [1]. A promising contribution of algal biomass is currently used in foods, which enhances the nutritional value of the product [2]. These added nutrients have proven beneficial to animal and human health, decreasing the incidence of several diseases and/or illnesses [3,4]. In the environment, algae are highly dependent on several parameters, such as temperature, salinity, pH and nutrient content, which may increase or decrease their growth and production [5,6].
There are thousands of microalgae genera; one of the few microalgae targeted for food and commercial production is Chlamydomonas reinhardtii [7,8]. C. reinhardtii is a freshwater green alga that has been subjected to many genetic studies and can be grown in the laboratory. It is usually used to study phenomena such as photosynthesis, flagella locomotion, and light sensing [6,9]. It has been observed that several environmental parameters affect our natural resources due to changes in land and waters [10,11].
Current methods for measuring algal biomass use dry weight measurements, flow cytometry, spectroscopy, and in situ fluorescence probes [12,13,14,15,16,17]. These conventional measurements require sample collection and preparation in the environment.
Information can be obtained from the area through remote sensing of the Earth’s surface, which is carried out without direct contact [18]. The sensors used in these systems vary, using different sources of energy radiation. The data produced can be collected using seaborne [19,20], airborne [21,22], and spaceborne remote sensing [23,24], which can be used in the assessment of chlorophyll-a and algal biomass. One type of active remote sensing technique uses a fluorescence light detection and ranging (LiDAR) system. It is defined as a non-invasive, non-contact technique that utilizes laser-induced fluorescence technique on the Earth’s surface at varying conditions [25]. Several fluorescence LiDAR systems were used in algal monitoring [26,27,28], water quality assessment, cultural heritage conservation [25], and the evaluation of plant biodiversity [29]. Several LiDAR systems vary in terms of the optical properties of the receiving and transmitting components. Some fluorescence LiDAR systems have higher overlap, providing a gap in the near-range measurements. Our study fills in the missing data by providing an understanding of the behavior of algae at a closer range [30].
We have previously reported the use of a portable LED fluorescence LiDAR system to measure the chlorophyll-a pigment of Spirulina [28]. This has been used to estimate the chlorophyll-a pigment of a commercialized AZTEC spirulina with varying algal biomass. LED mini LiDAR systems were reported for atmospheric application [30,31] and Mars rover exploration [32]. In this study, the researchers aimed to monitor the chlorophyll-a pigment of C. reinhardtii under specific growth conditions. This paper demonstrates the use of the developed fluorescence light detection and sensing system in estimating chlorophyll-a pigment at varying growth phases of an algae. It contributes to the development of a portable environmental monitoring system that can be easily used by the government and private sectors.

2. Experimental Preparation and Detection of C. reinhardtii

The LED fluorescence LiDAR set-up was designed for on-site use. In this section, the growth conditions and parameters of C. reinhardtii are discussed. Standard methods, such as optical density, excitation-emission matrix fluorescence analysis, and estimated chlorophyll-a measurements, were used for correlation purposes. In this study, the growth phases of C. reinhardtii, from the lag phase to the death phase, were recorded using the aforementioned methods.

2.1. C. reinhardtii Sample Preparation and Cultivation Parameters

A 12.5% inoculum of C. reinhardtii was prepared with an optical density of 0.3. Three replicates of the inoculum were made. BG-11 (Blue-green 11) medium was used for the C. reinhardtii inoculum in this study and a pH value of 8. This is widely used for freshwater algae and protozoa [33]. The resulting measurements are shown in Table 1.
The algae were cultured in an 8 L prescribed medium with the 12.5% inoculum. The photoperiod on the growth of algae was set at 12 h/12 h (light/dark cycle).

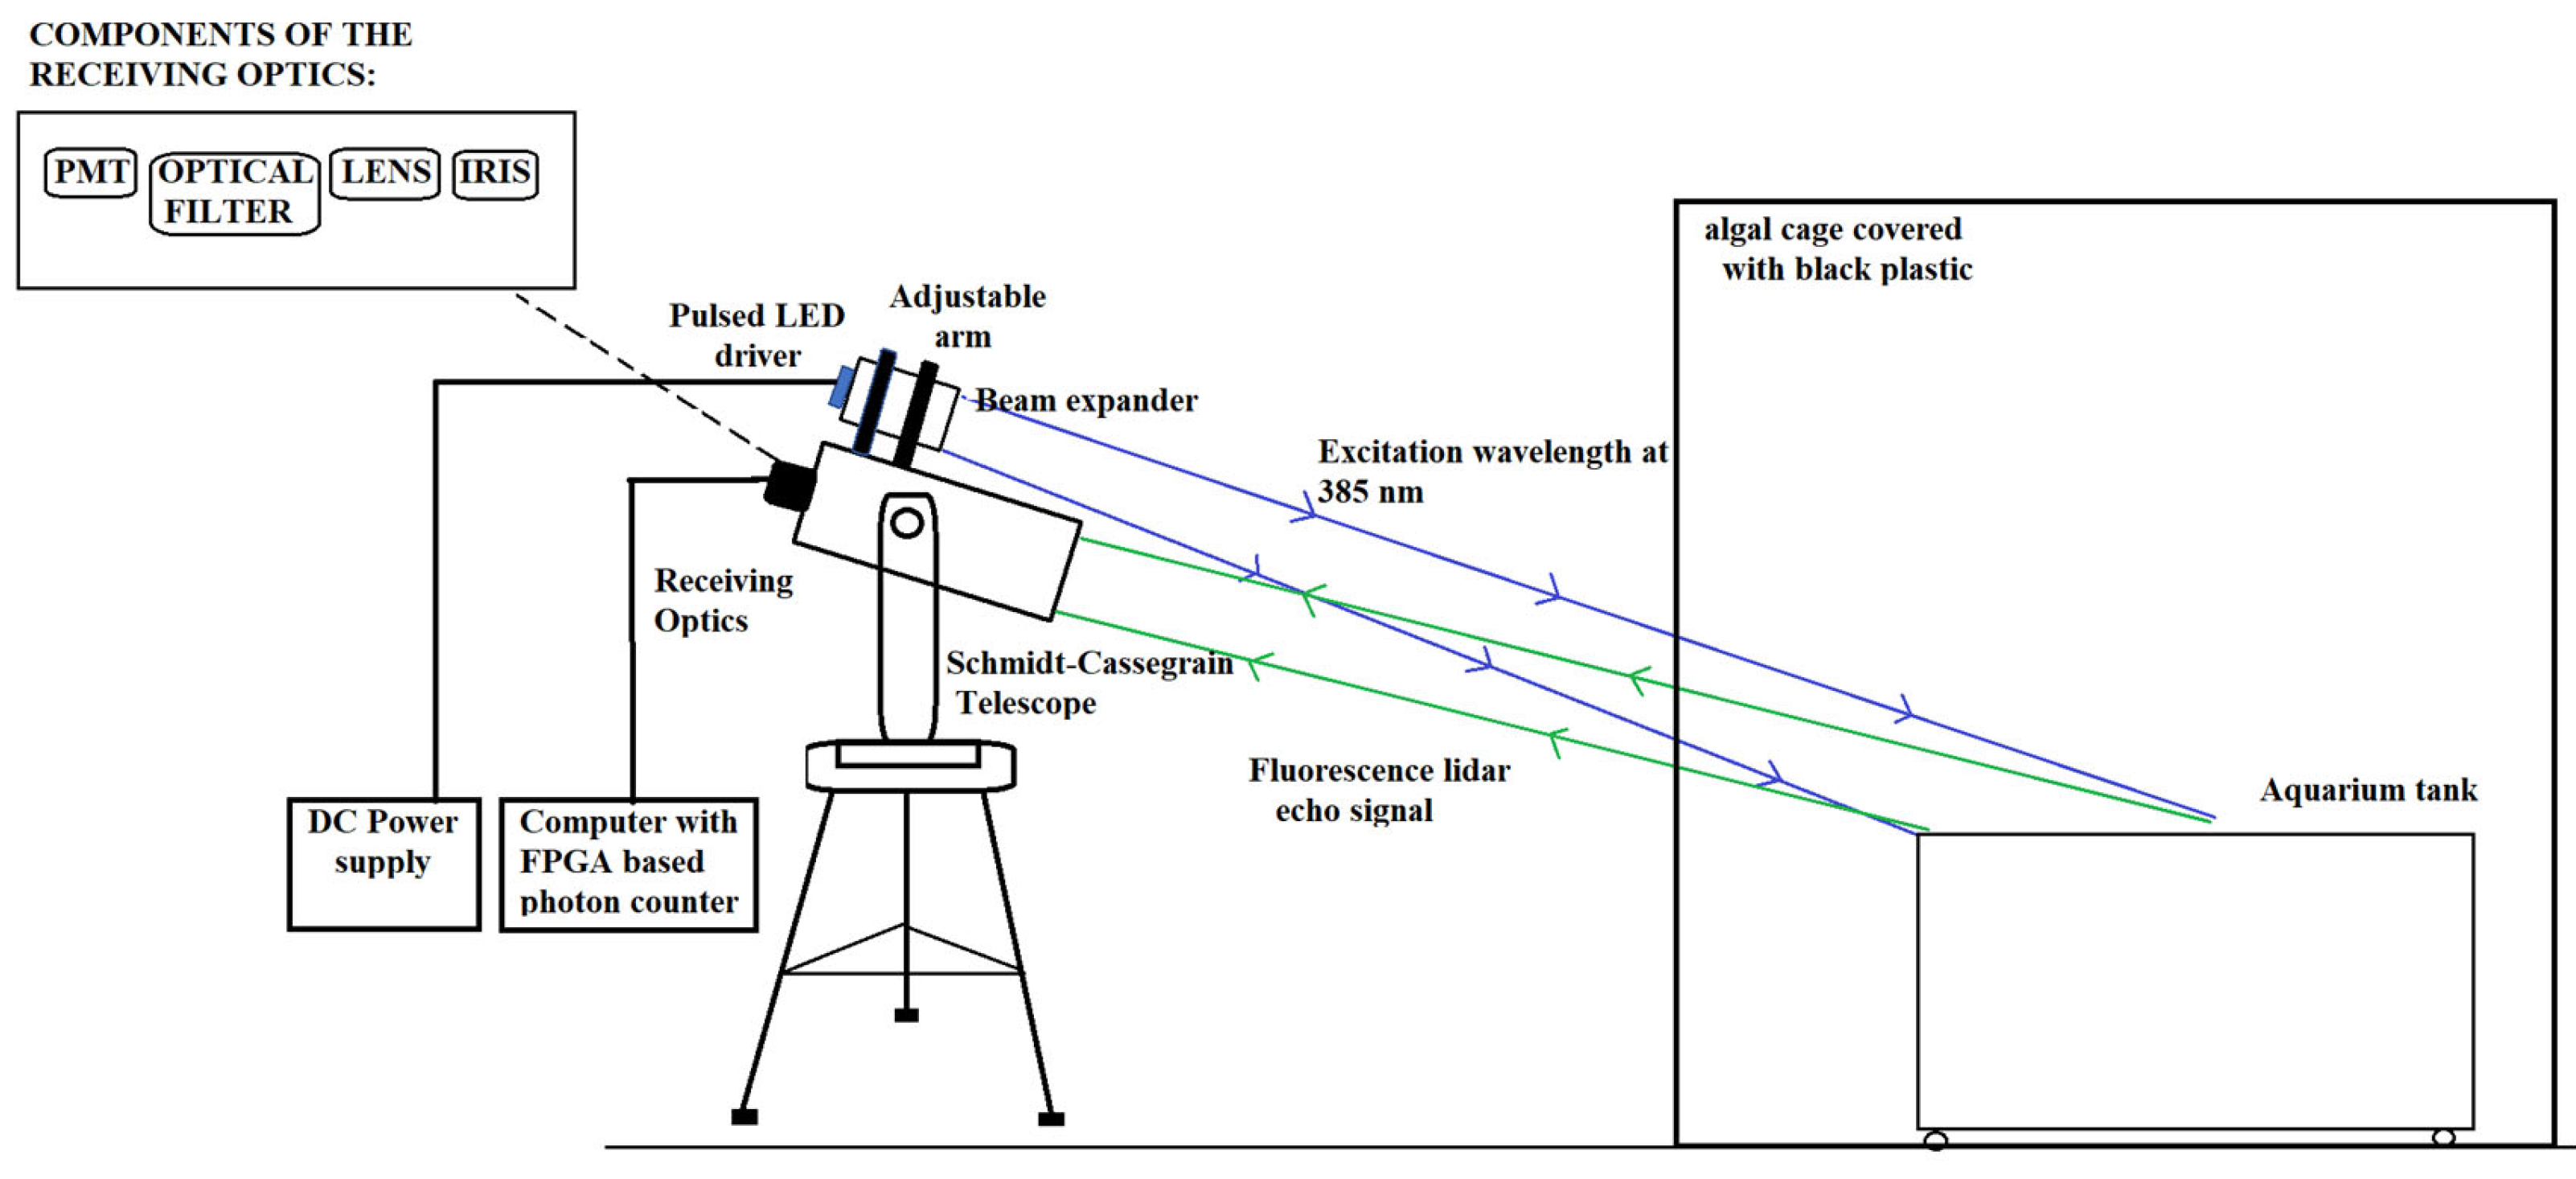
2.2. LED Fluorescence LiDAR System

The construction and experiments using a biaxial optics fluorescence LiDAR system were conducted outside during nighttime as shown in Figure 1.
The transmission of excited light and reception of the backscattered fluorescence signal from the algal sample was conducted using a tabletop Schmidt-Cassegrain Telescope (Kenko Sky Explorer SE-AT90mm, Tokyo, Japan). The eyepiece of the telescope was modified to add the iris, lens, bandpass filter at 680 ± 5 nm (Thorlabs, FB680-10, Newton, NJ, USA), and a photomultiplier tube (Hamamatsu Photonics, R6350P, Hamamatsu, Japan). The tube was designed to detect very weak backscattered signals and was directly connected to a photon-counting board (Trimatiz Co., Ltd., Photon Tracker, Chiba, Japan). It has multiple channel detection features with a system lock of 550 MHz with an approximate power consumption of 2 watts for each channel. A detailed discussion can be read in our previous paper measuring the chlorophyll-a pigment of Spirulina [28]. The receiving and transmitting components of the pulsed LED fluorescence LiDAR system are listed in Table 2.

2.3. Pulsed LED Fluorescence LiDAR Equation

The portable LED fluorescence LiDAR was positioned 5 m away from the algal tank. The design of the algal cage only allows the detection of C. reinhardtii and its growth phases from Day 1. Three out of four tanks were covered in a matte blackboard to remove detection from other tanks. The chlorophyll-a concentration of algae has been reported to have linear proportionality with the fluorescence LiDAR signal, as shown by the equation.
l o g E λ F ,   R R 2 = g λ F ,   λ C a l g a e
where E λ F ,   R R 2 is the fluorescence lidar signal (in counts·m2), g λ F ,   λ is the correlation factor and C a l g a e is the chlorophyll-a concentration (molecule/m3) observed. The correlation factors are components of the transmitting and receiving systems of the pulsed LED fluorescence LiDAR [28,34]. All other measurements were conducted after the LiDAR experiments.

2.4. Absorbance and EEM Fluorescence Measurements

Each sampling day, 1 mL sample was collected through a cuvette from each algal tank to measure the medium’s optical density at 680 nm (OD 680) using a spectrometer setup (Genesis 10uv Thermospectronic, Waltham, MA, USA).
Using EEM images, the growth phases of C. reinhardtii for chlorophyll-a measurements can be observed. A fluorescence spectroscopy set-up (Ocean Optics Spectrometer, New York, NY, USA) was assembled for fluorescence measurements of organic matter and algal samples [13,14,28]. From the collected excitation-emission pairs, the excitation region considered is 250 to 450 nm and emission (fluorescence) ranges from 600 to 800 nm. The decomposition and analysis of overlapping spectra found in EEMs were conducted using parallel factor analysis [15].

2.5. Other Parameters Such as Water Quality and Weather Measurements

The light source set-up was designed so that it can be easily removed when conducting the LiDAR and standard measurements. Four linear fluorescent lamps with a total light concentration of 4800 lux or 648 μmol m−2 s−1 were used for artificial sunlight. They were controlled with a timer set under 12 h/12 h light–dark conditions in the aquarium tank. An aerator pump was installed to provide the necessary amount of carbon dioxide for photosynthesis [35,36].
Water quality parameters were also measured, such as pH, water temperature and electrical conductivity, using a portable field monitoring device (Hach HQ40D/intelliCAL, Loveland, CO, USA). A local weather station (Davis Vantage Pro 2, Davis Instruments, Hayward, CA, USA) was stationed in the building to measure environmental parameters such as relative humidity and temperature.

3. Results

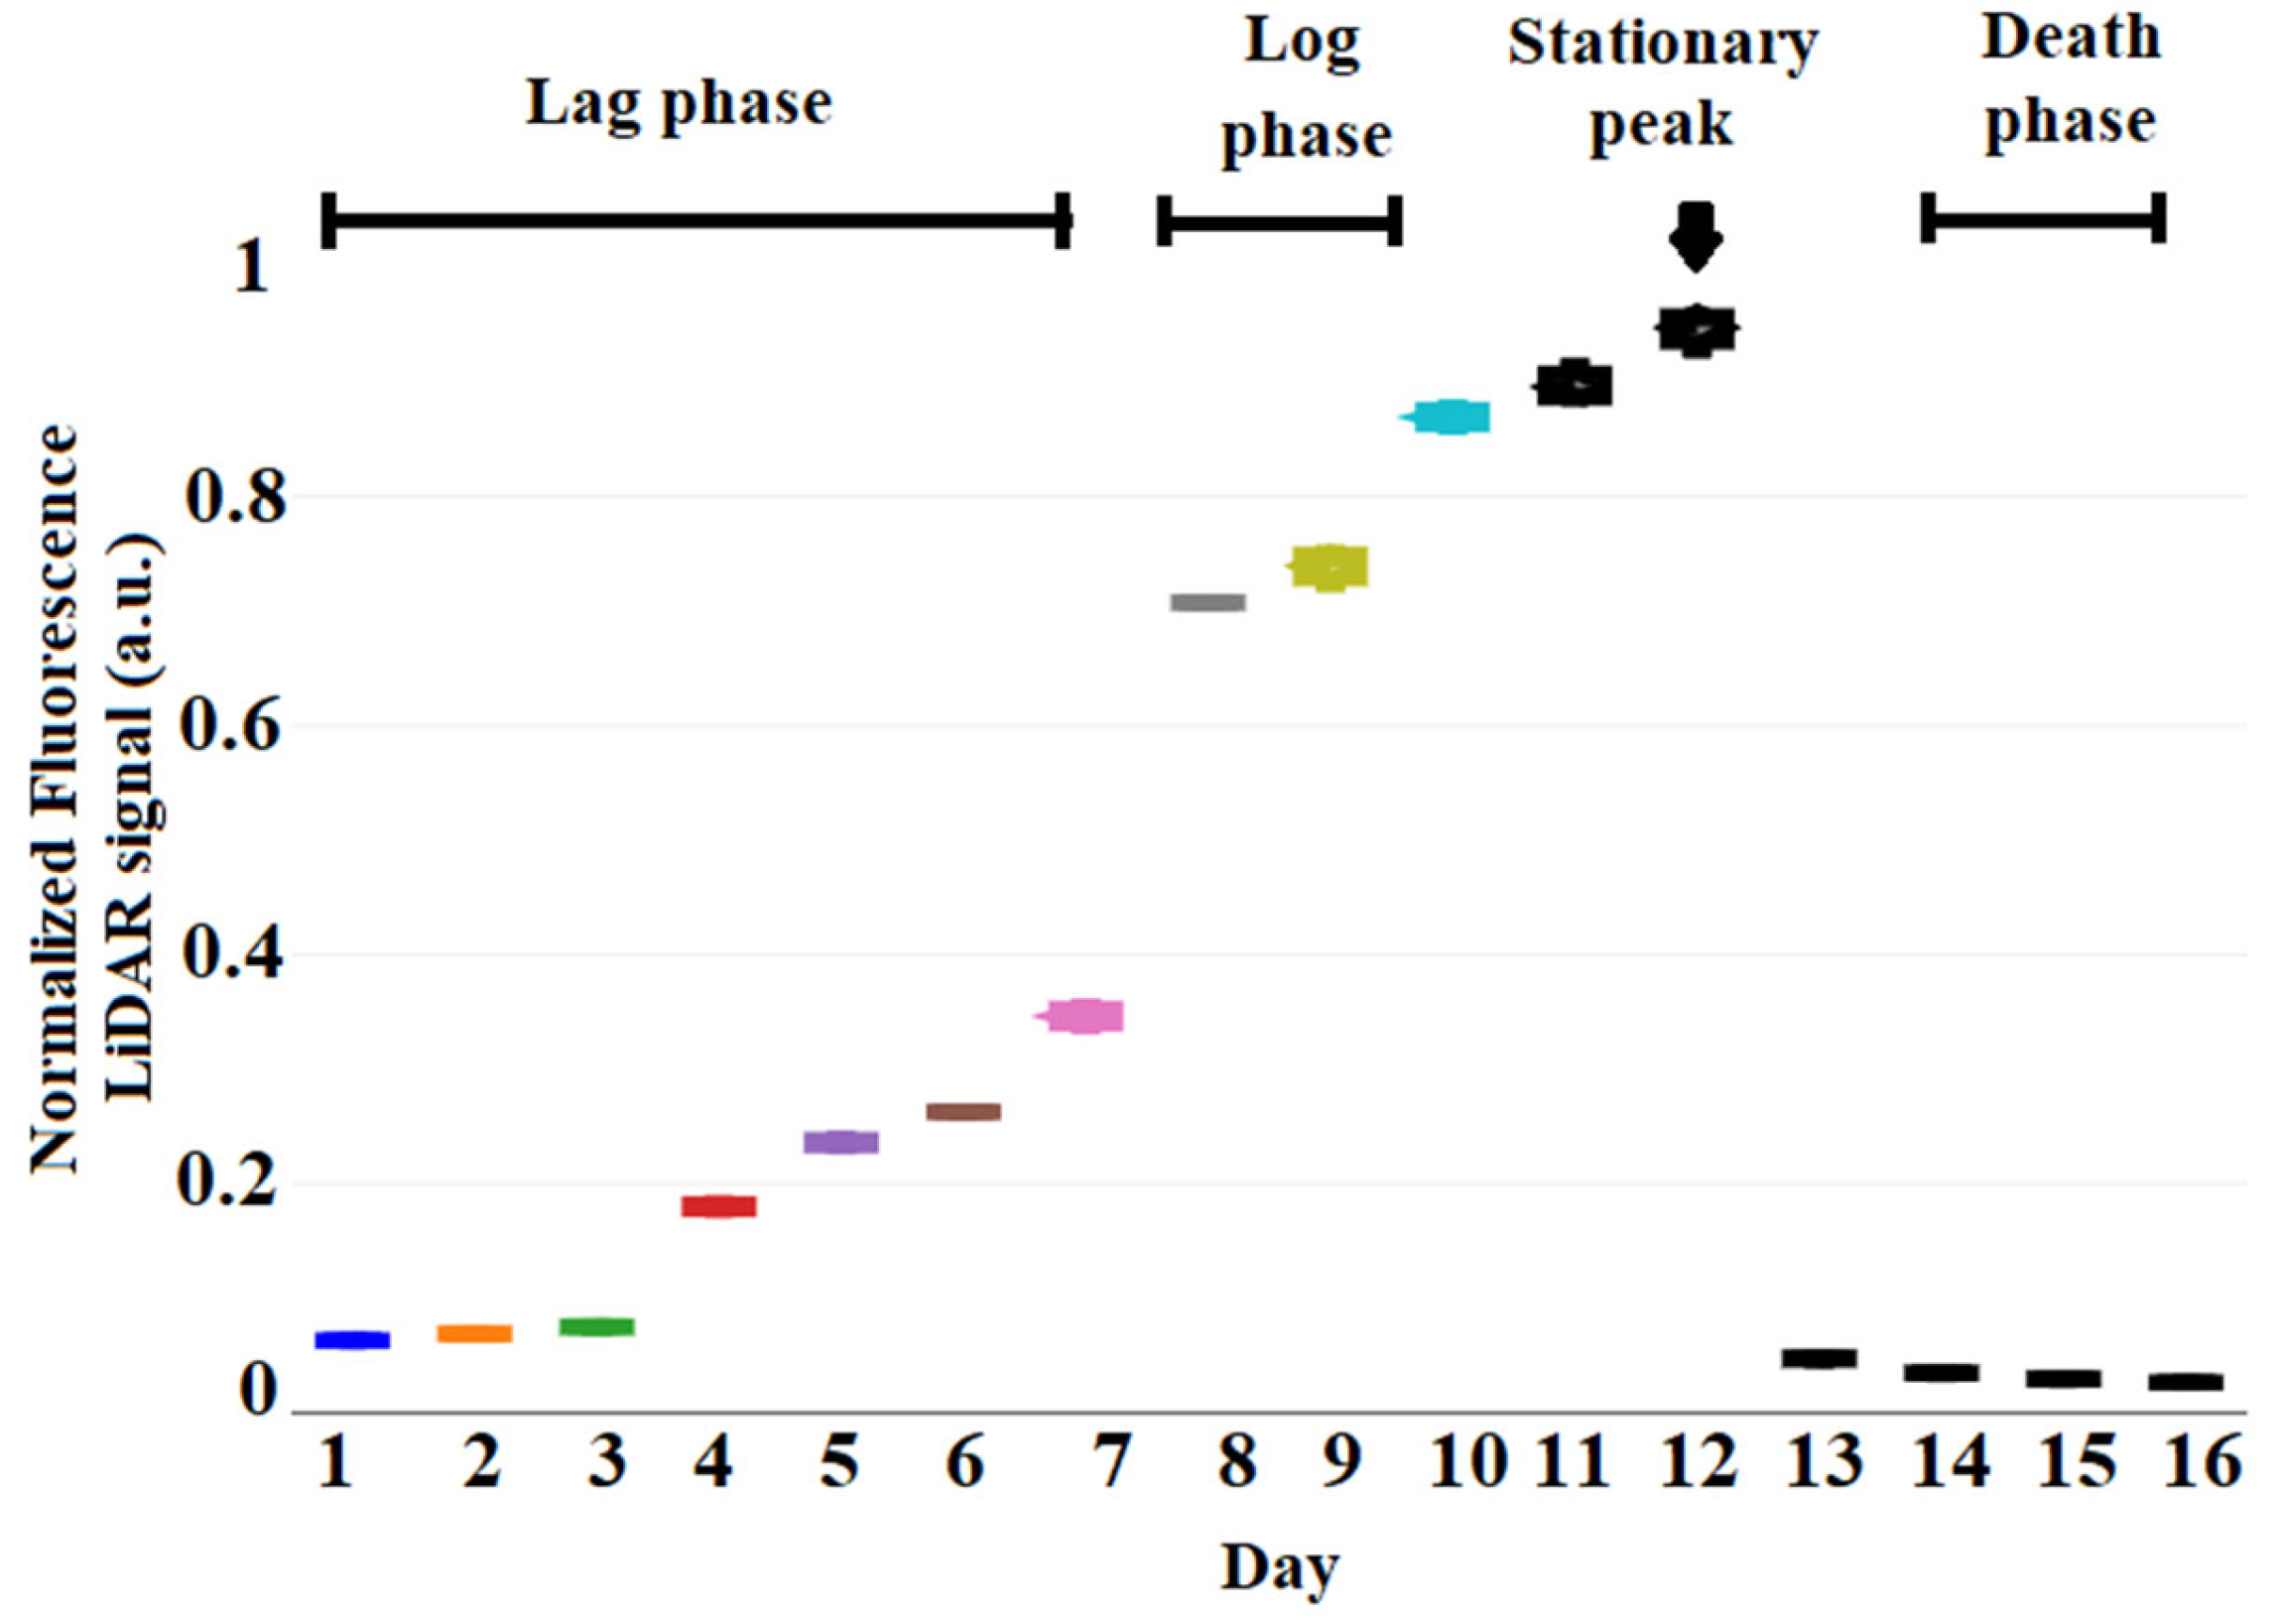
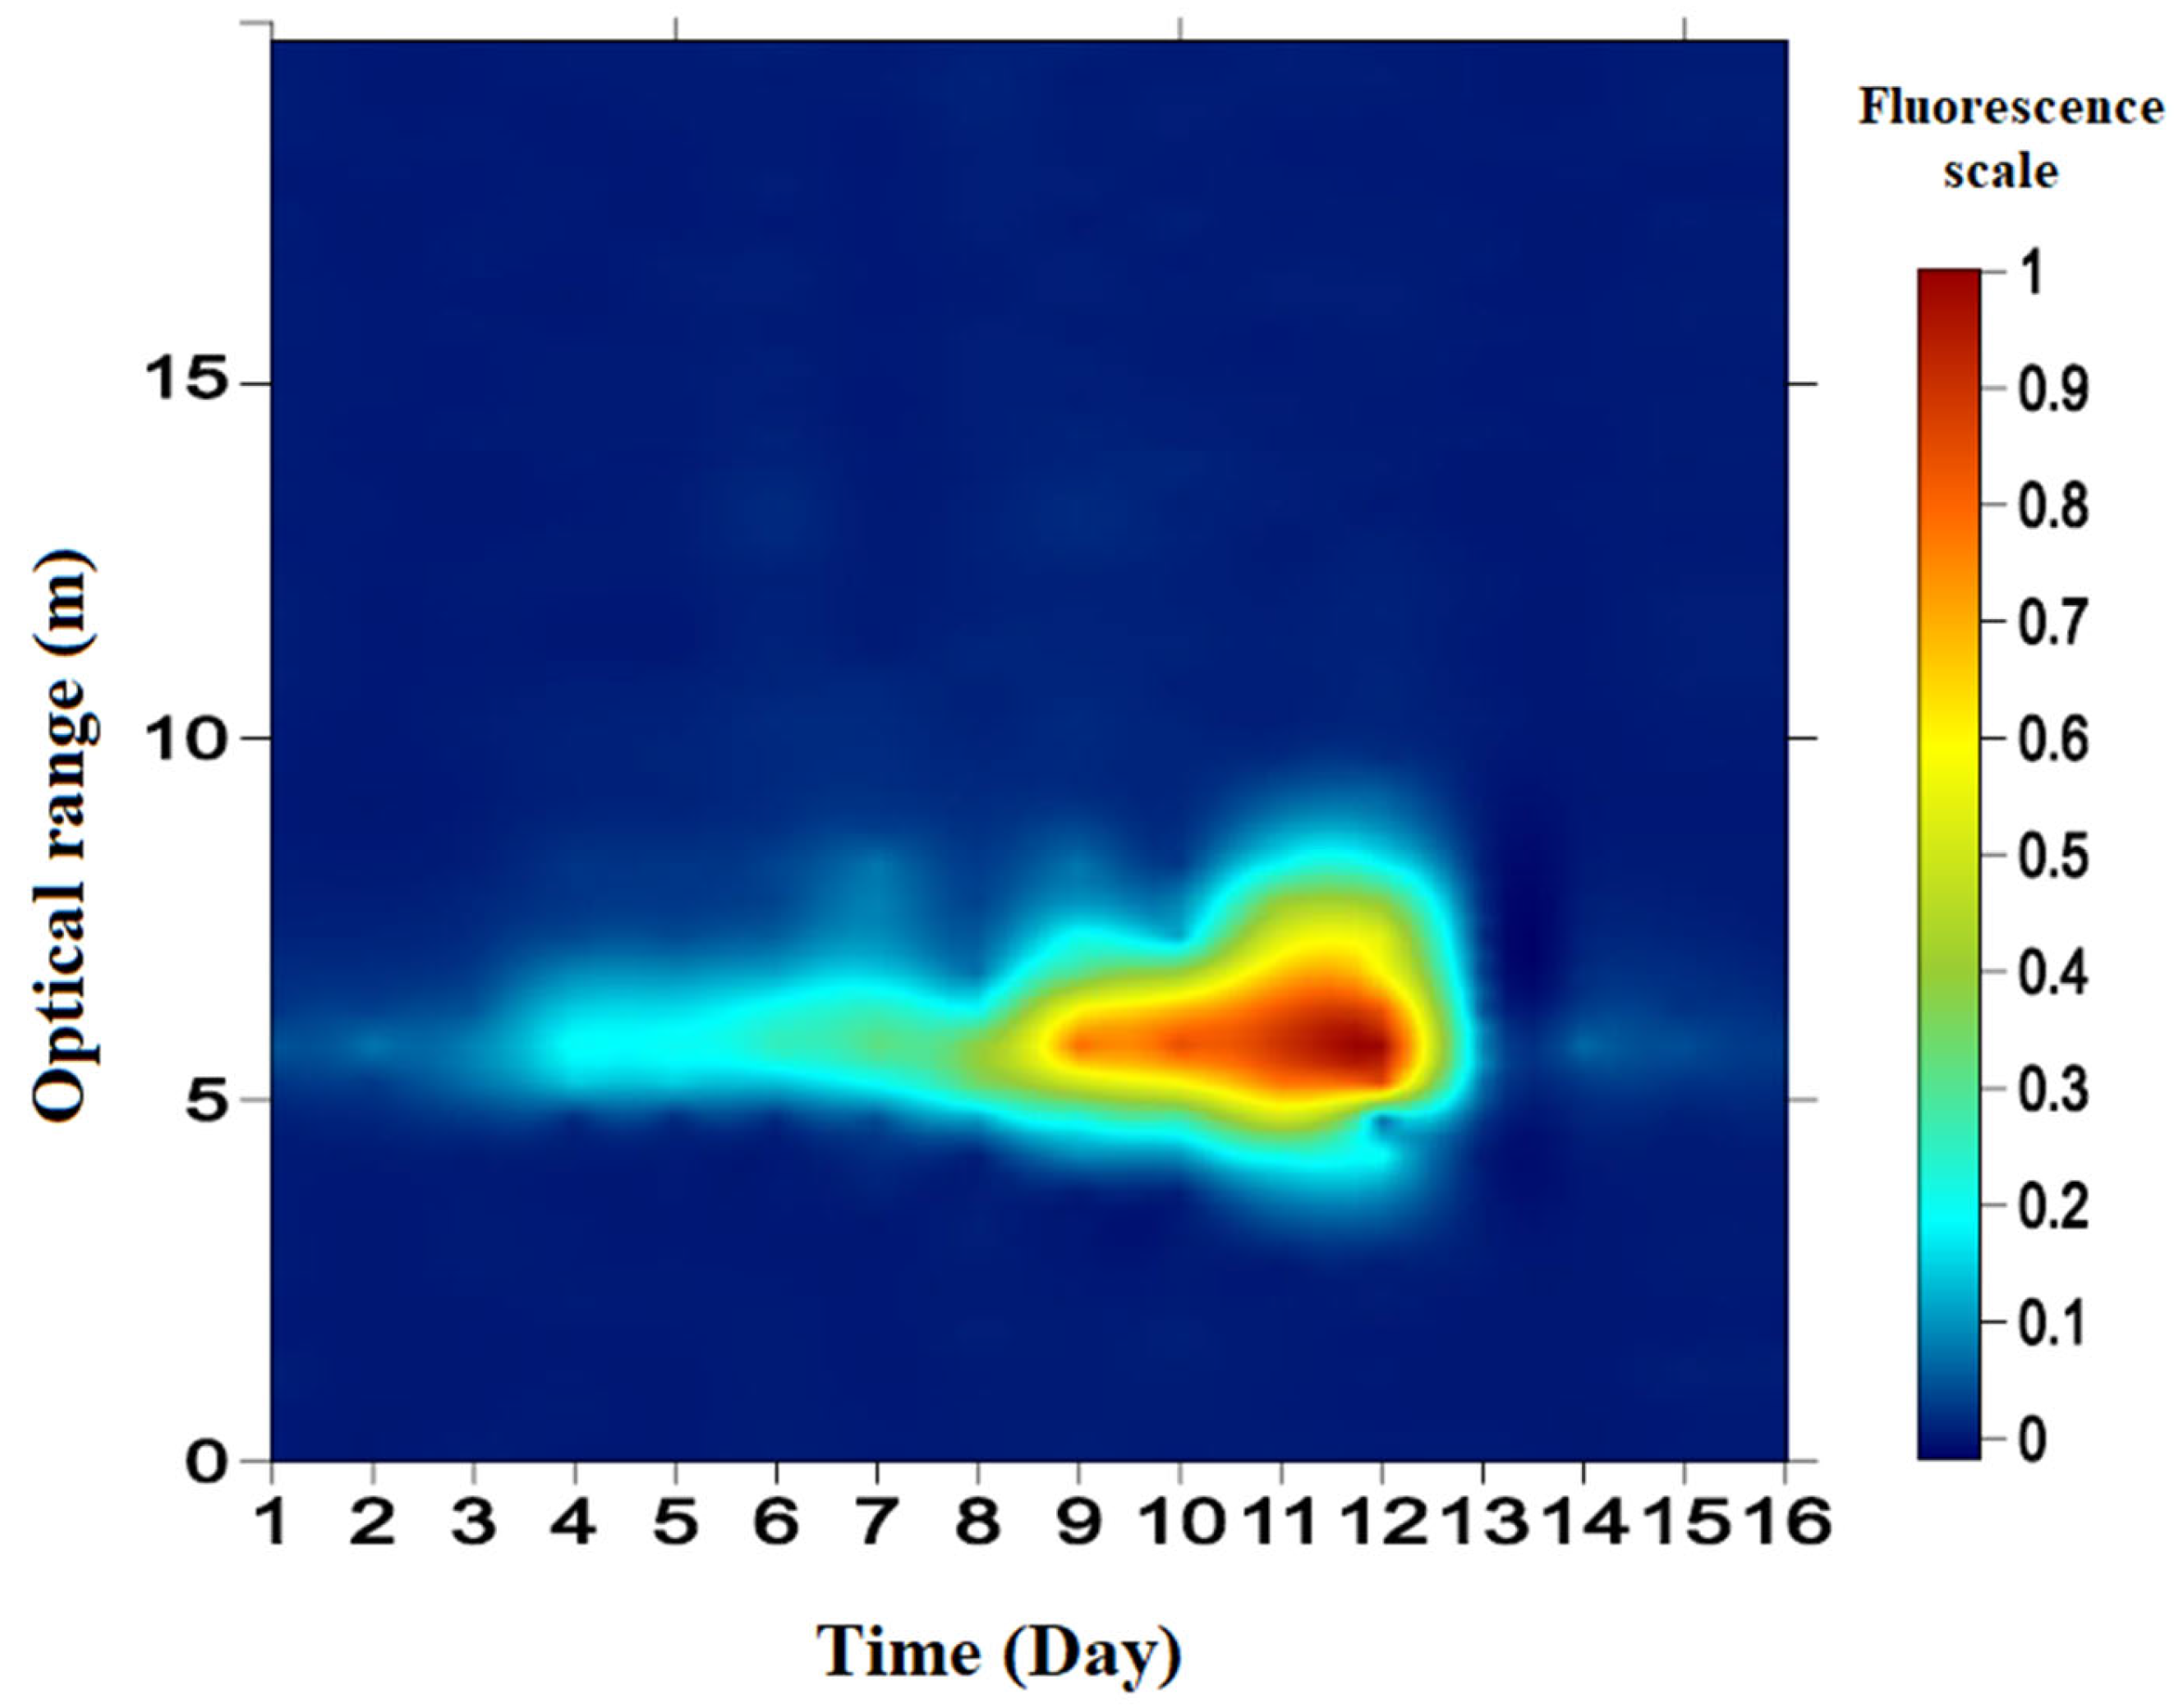
3.1. Pulsed LED Fluorescence LiDAR Signal of C. reinhardtii

Necessary calibrations and adjustments of the fluorescence LiDAR instrument were conducted. The in situ remote sensing of C. reinhardtii at nighttime was performed at cultivation parameters. The fluorescence signal measurements of C. reinhardtii are dependent on the components of the constructed fluorescence LiDAR system. Real-time chlorophyll-a monitoring was measured at 680 nm for the optical fluorescence detection of C. reinhardtii. Figure 2 shows the corrected fluorescence LiDAR peak signals of C. reinhardtii during the 16-day sampling period. The fluorescence LiDAR profile is the same as that of a previous study [28].
The 16-day sampling period showed the growth phases of C. reinhardtii from the lag phase to death phase. It was shown that the corrected fluorescence LiDAR signal profiles of C. reinhardtii exhibited a maximum value at the optical range of 5.7 m. The noise measurements showed minimum values ranging from 0 to 18 photon counts. The normalized fluorescence LiDAR signal was measured in arbitrary units (a.u.). The lag phase started from Day 1 to Day 7 with normalized fluorescence LiDAR signals ranging from 0.03 to 0.36 a.u. An increase from 0.67 to 0.91 a.u. shows the log phase from the 8th to 11th day. No stationary phase but a stationary peak was observed during Day 12 with a signal of 0.97 a.u. The death phase of C. reinhardtii started from Day 13 to Day 16, with the fluorescence LiDAR signal ranging from 0.02 to 0.1.
In this study, a time–range intensity profile of C. reinhardtii was created (Figure 3). The x-axis is the sampling days, y-axis is the optical range (in meters), and z-axis is the measured fluorescence signal (in a.u.).
The time–range intensity profile of C. reinhardtii shows the changes in the growth phases. The normalized fluorescence intensity scale ranges from 0 to 1. The range-resolved fluorescence LiDAR signal showed an increasing intensity from Day 1 to Day 12. As stated in the methodology, the beam pulse width is 1.2 m and the resolution is 0.5 m. This resolution causes an increasing fluorescence LiDAR intensity value before 5.7 m. The chlorophyll-a measurements after 5.7 m were affected by time delay, measured by the pulsed LED fluorescence LiDAR signal. This is due to an increase in concentration causing an increase in multiple scattering of the C. reinhardtii found from Day 9 to Day 12 [37].

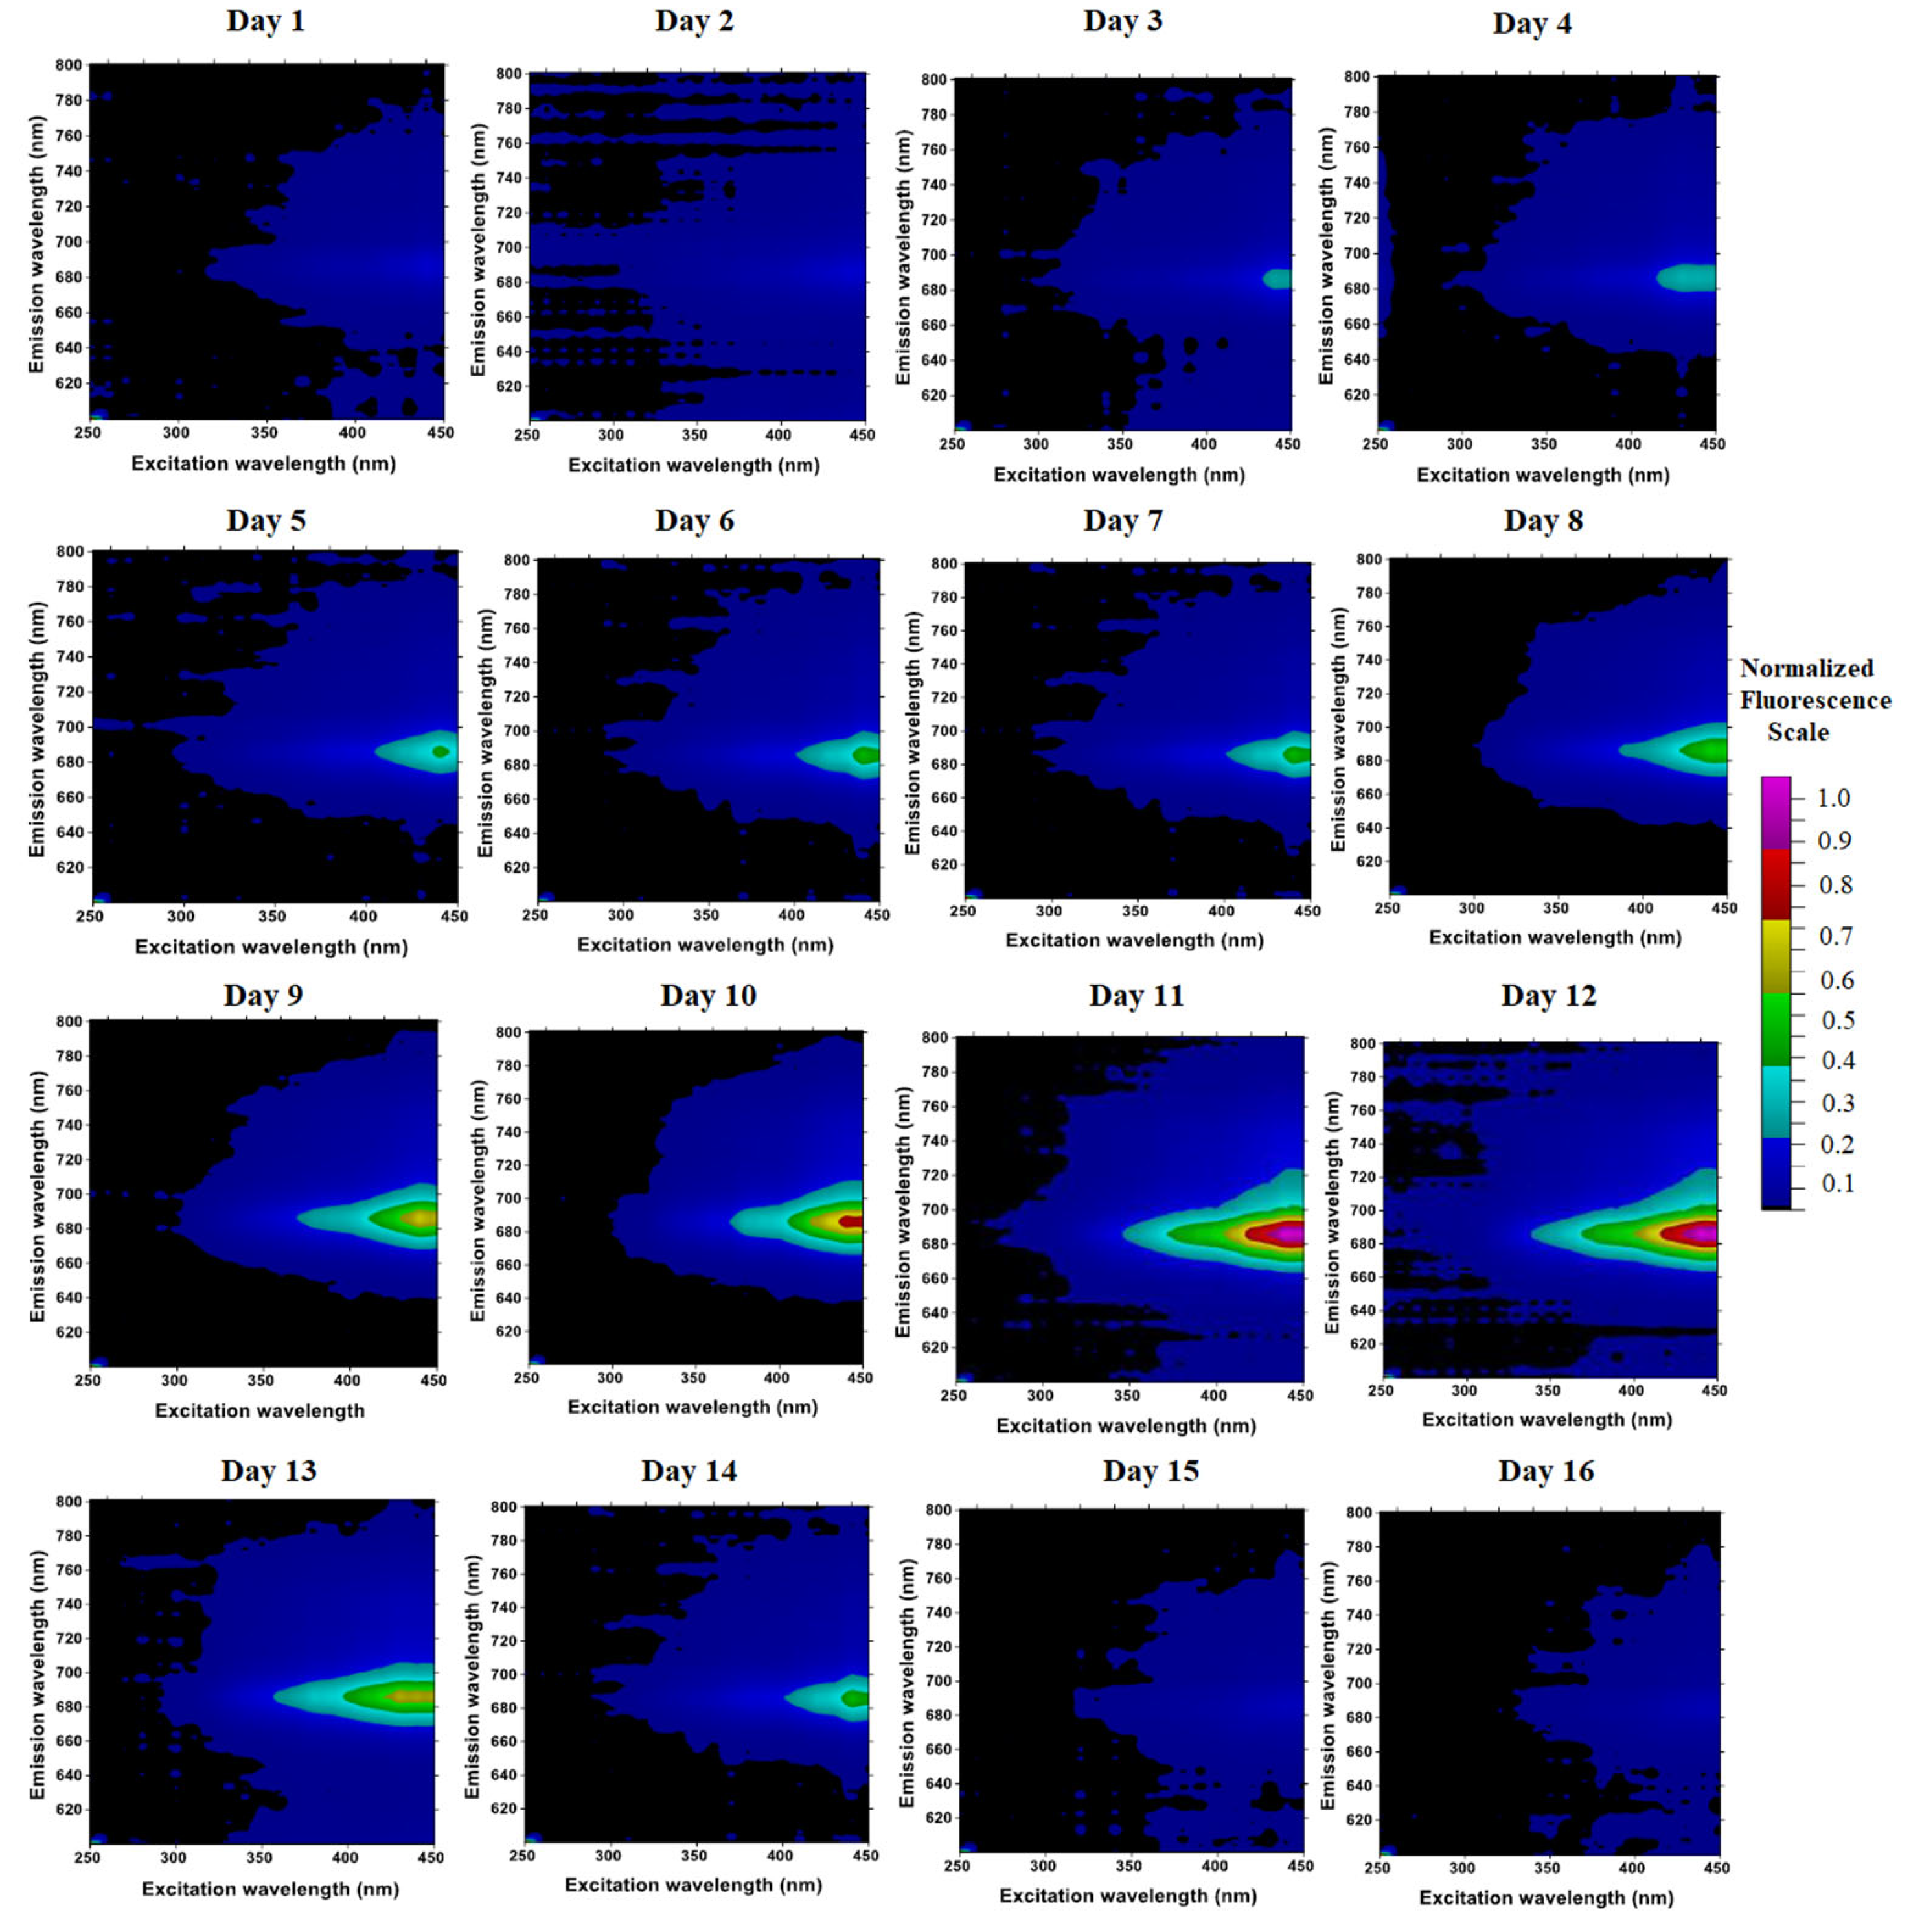
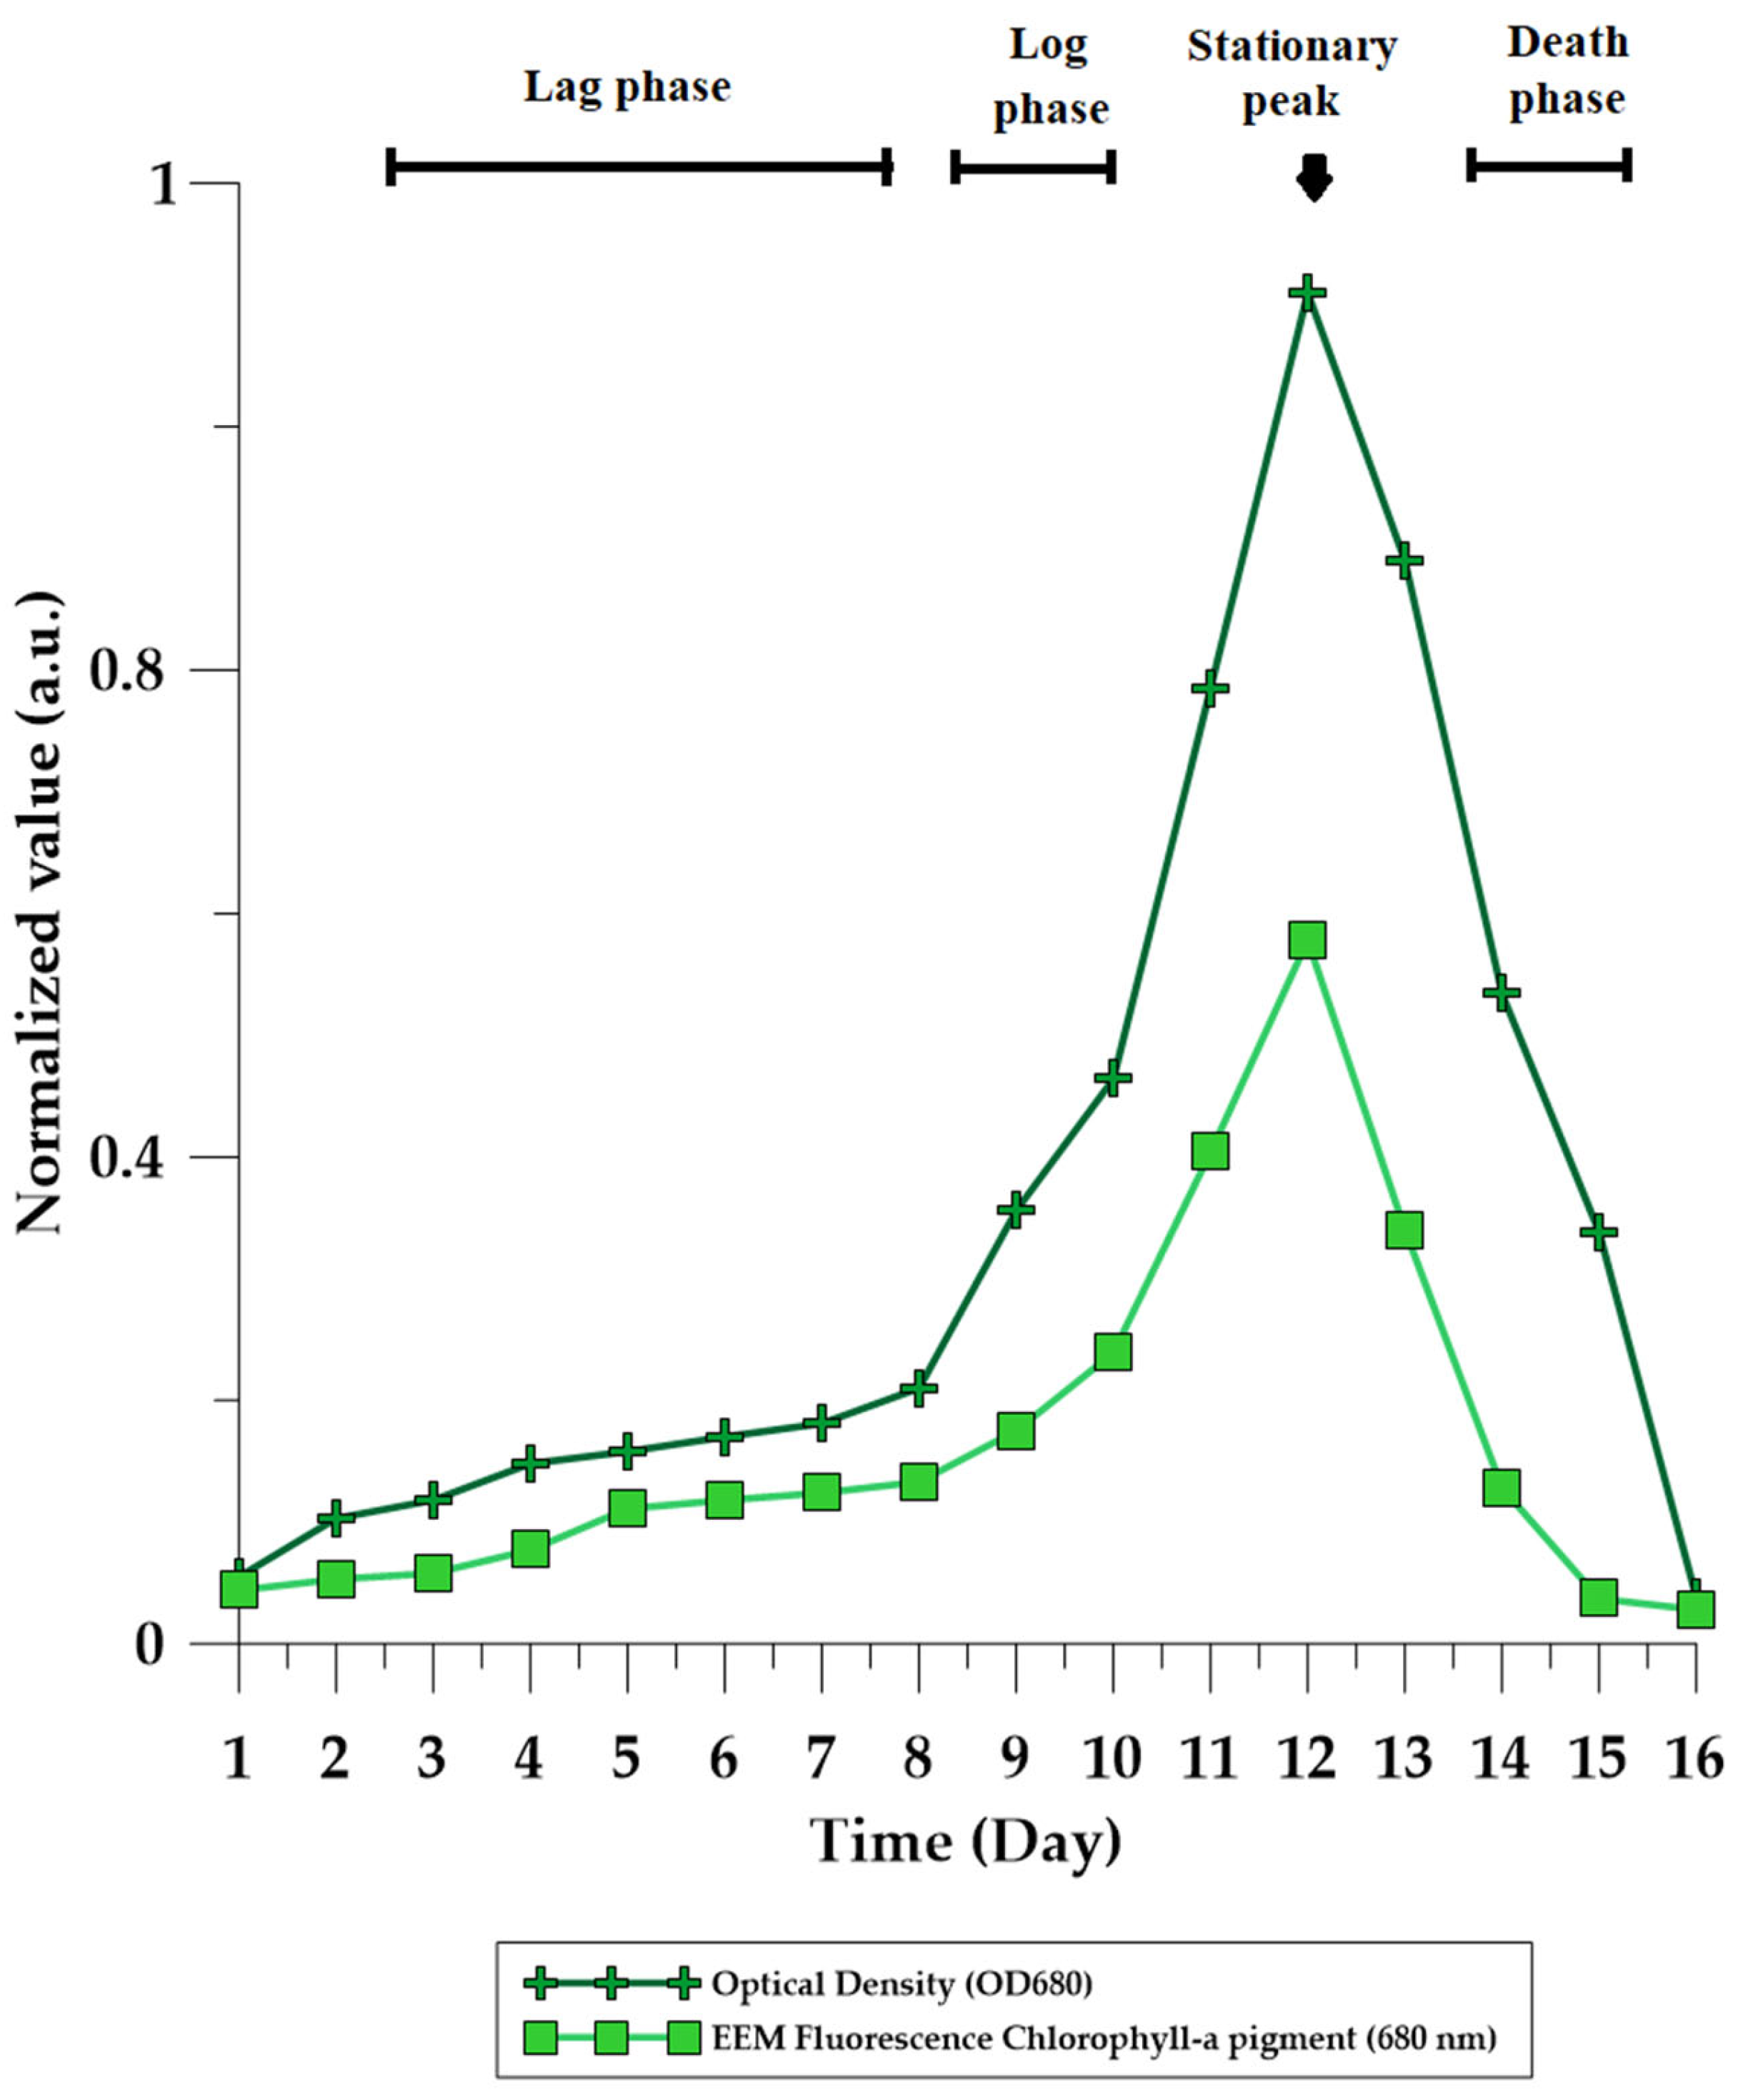
3.2. Optical Density and EEM Fluorescence Measurements

EEM shows the behavior of C. reinhardtii’s chlorophyll-a pigment from Day 1 to Day 16. This explains the excitation-emission pair ranging from 250 to 450 nm in excitation wavelength and 600 to 800 nm in emission (fluorescence) wavelength. It can be seen that the fluorescence spectroscopy measurements can also provide the growth dynamics of C. reinhardtii, as shown in Figure 4.
The low-temperature fluorescence spectra were analyzed, showing different bands. As observed, C. reinhardtii exhibited a major peak range from 680 to 685 nm, which corresponds to protein complexes (LHCII and PSII core) [38]. Using two-way ANOVA, no significant differences were observed at OD650, OD680 and OD700; hence, an optical density at 680 nm was used for correlation between parameters [39]. Figure 5 shows the measured OD680 and peak signal from the EEM fluorescence of C. reinhardtii.
The chlorophyll-a concentration based on the two standard methods, namely optical density and EEM fluorescence chlorophyll-a measurements, shows the growth phases of C. reinhardtii. The same trend can be observed in the fluorescence LiDAR profile during the 16-day sampling period. A linear correlation was observed between the fluorescence LiDAR signal and the EEM fluorescence chlorophyll-a pigment, both measured at 680 nm. This trend was observed due to the similarity in the method performed as compared to the absorbance measurements at 680 nm.

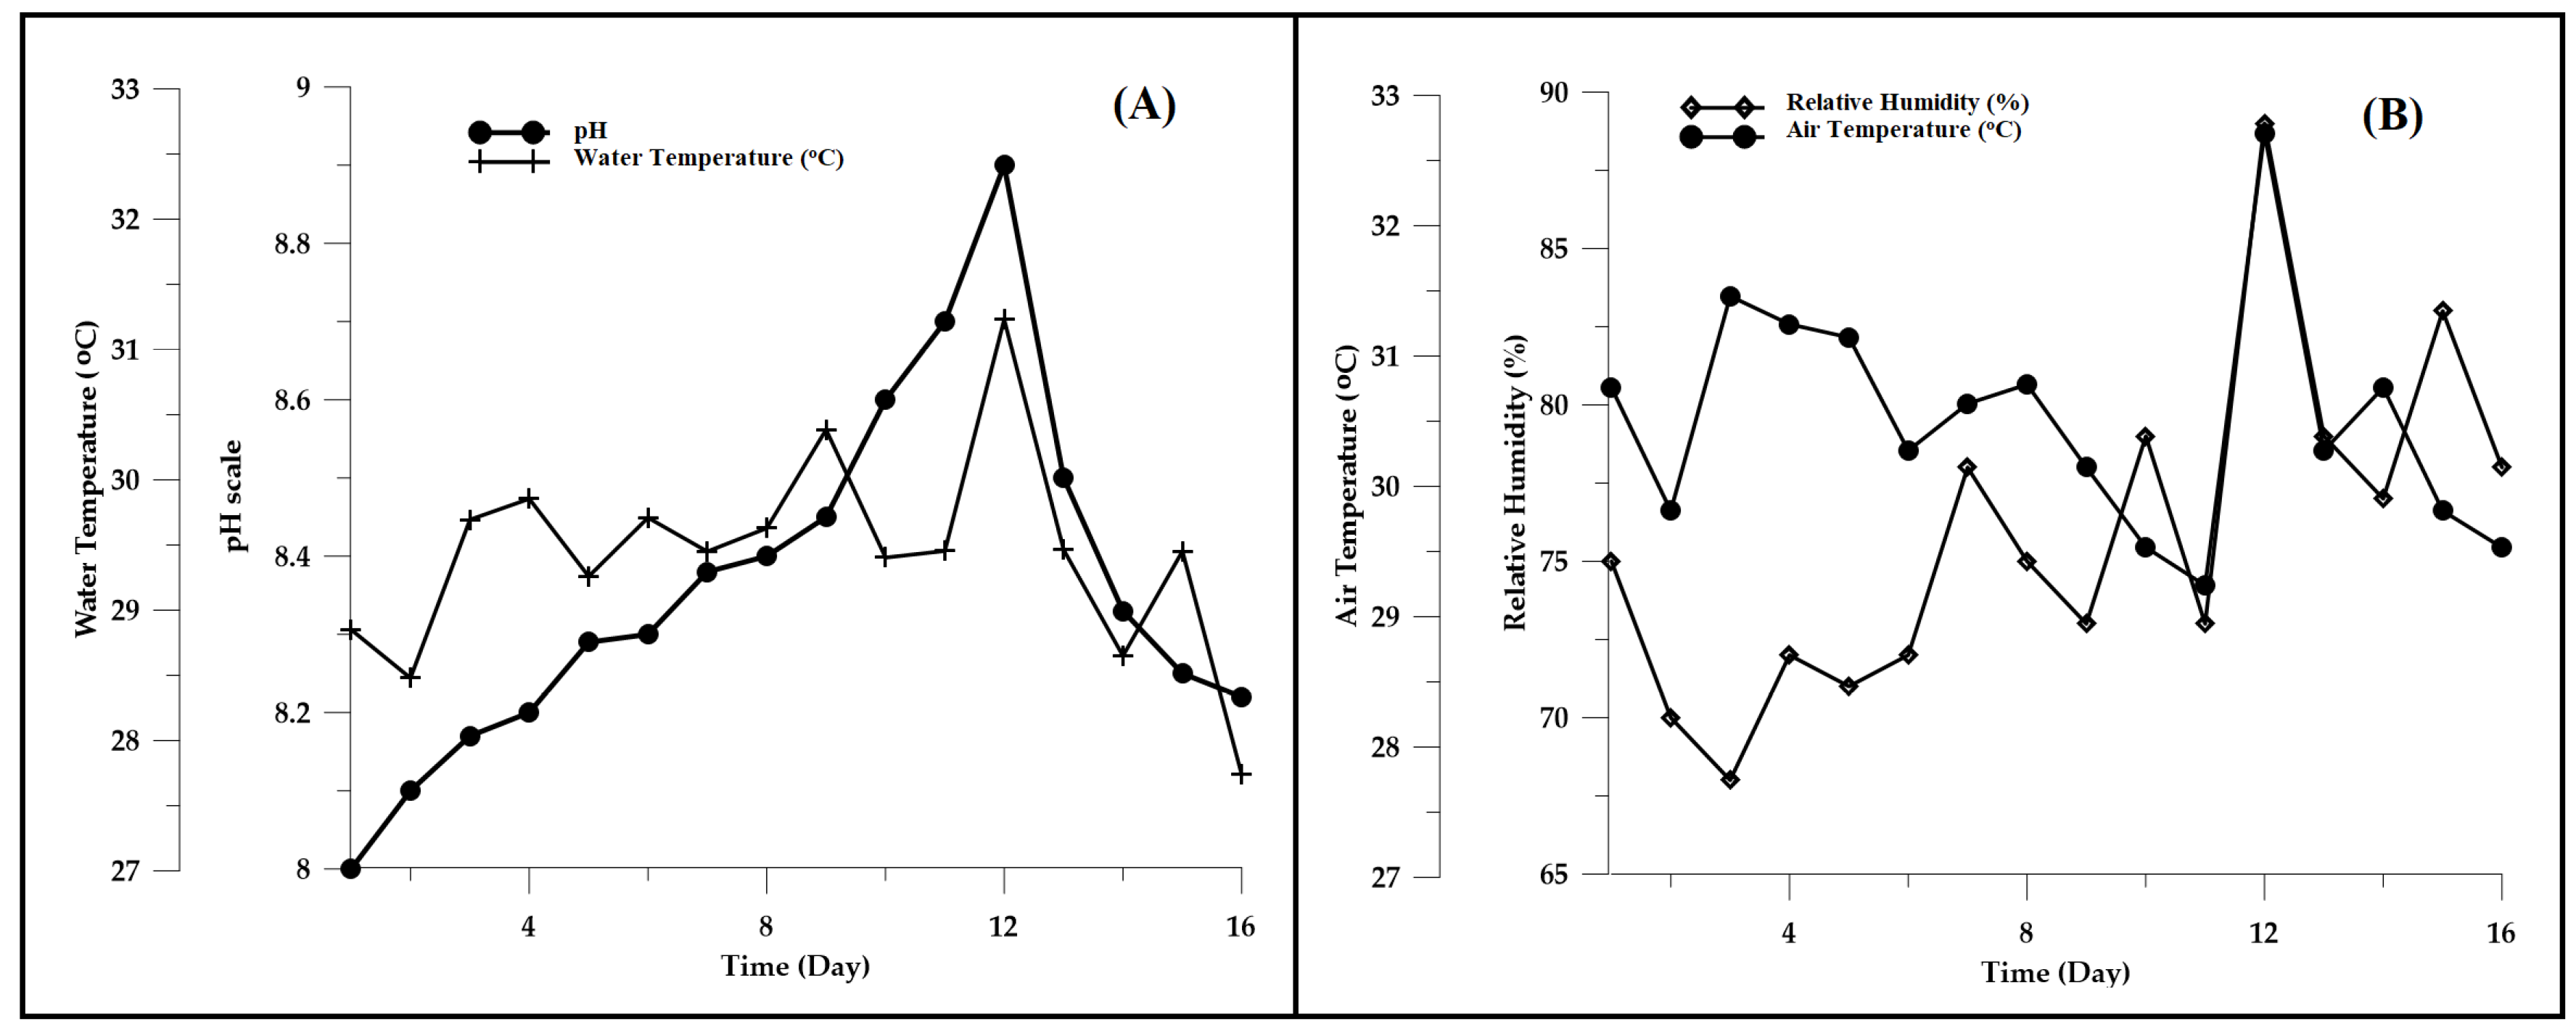
3.3. Water Quality and Weather Observations

Water quality measurements are an important factor in understanding the growth behavior of any algal species [40,41]. We performed the remote sensing fluorescence LiDAR measurements of C. reinhartdii at nighttime (16:00–20:00). pH and water temperature were measured every after the fluorescence LiDAR measurements. Temperature and relative humidity were recorded by a weather station simultaneously. Figure 6 shows the water quality and weather parameters measured during the testing.
In this study, we have presented the impacts of water and weather parameters in the phases of C. reinhardtii [42]. The pH of C. reinhardtii was measured daily. Changes in pH exhibit an increasing trend from the lag phase to stationary peak. The maximum pH observed was found on Day 12 of cultivation, ranging from 8.7 to 8.9. The same trend was also observed for water temperature, which ranged from 28.04 to 31.56 °C. Relative humidity and air temperature were also recorded at the maximum value on Day 12 and suddenly decreased thereafter. This is due to the death of C. reinhardtii, as observed from the measurements conducted.
During the start of death phase, rotifers were observed and considered as predators of C. reinhardtii [43]. Rotifers are wheel animalcules that constitute the phylum Rotifera. Microalgae are considered as the food of rotifers, and this leads to the depletion of nutrients and growth of C. reinhardtii in the tank.

3.4. Correlation between Measurements

To further understand the relationships between parameters, Pearson’s r linear correlation table was computed, as shown in Table 3. The mean and standard deviation were also included to determine the average values and the variation of the set of values provided. The p-value was measured to check the level of significance between two parameters.
Optical density and fluorescence measurements are the most convenient measurements of biomass concentration in microalgae analysis [44]. The estimated chlorophyll-a pigment of C. reinhardtii is as follows: OD680 (0.35 ± 0.32), EEM fluorescence chlorophyll pigment at 680 nm (0.17 ± 0.15), and measured fluorescence LiDAR peak value at 680 nm (0.38 ± 0.31).
The fluorescence LiDAR peak signal measurements indicated highly correlated values with OD680 (r = 0.77; p-value = 0.00049) and measured fluorescence chlorophyll-a pigment (r = 0.75; p-value = 0.0008). It also showed positive linear correlation with pH (r = 0.83; p-value = 0.00006) and water temperature (r = 0.63; p-value = 0.0089). It also showed the effects for water quality and weather parameters in the growth dynamics of microalgae.

4. Discussion

Our paper provides a real-time chlorophyll-a monitoring of C. reinhardtii using the portable LED fluorescence LiDAR system. The development of a non-contact, near-range fluorescence LiDAR system is important in areas wherein satellite systems cannot provide accurate data. This study provides new techniques for fluorescence LiDAR systems for environmental monitoring. Figure 2 and Figure 3 show the fluorescence LiDAR signal of C. reinhardtii observed at specific cultivation parameters. As observed, the growth dynamics of C. reinhardtii are demonstrated from the lag phase to death phase. In estimating chlorophyll-a concentration, methods such as EEM fluorescence spectroscopy (Figure 4) and optical density (Figure 5) are commonly performed. The same trend was observed for the growth dynamics of C. reinhardtii using the standard methods and the fluorescence LiDAR signal.
The pulsed 385 nm LED module showed robustness with its high stability in optical power and wavelength (Table 2). It demonstrated its effectiveness in estimating the chlorophyll-a pigment of C. reinhardtii in near-range applications under controlled conditions. The optical transceiver of the LED LiDAR system is also stable because of the wider beam divergence and receiver’s field of view (Table 2). In a controlled environment, water quality and weather (Figure 6) measurements were also observed to understand the growth behavior of C. reinhardtii. These measured parameters strongly supported our fluorescence LiDAR signal results in estimating chlorophyll-a. The cause of death of the algae is due to the changing water quality and weather parameters, which lead to the increase in rotifers. The gradual increase in pH and air and water temperatures in the algal tank showed a linear correlation with the observed fluorescence LiDAR signal of C. reinhardtii. Our results verified the feasibility of our fluorescence LiDAR system in monitoring the chlorophyll-a of any algal biomass.
Thus, it is a good alternative technique compared to standard methods for estimating chlorophyll-a pigment. The system can be further improved in terms of light intensity since it was only evaluated during nighttime conditions. Improvements in the sensing depth can also be an area of further study. Future studies could use laser diodes as the transmitting systems, which can be used for algal concentration monitoring using unmanned vehicles.

5. Conclusions

This is the first time, based on our research findings, that a portable light-emitting diode fluorescence LiDAR system using a pulsed LED module was used for real-time water quality assessment. It was verified experimentally that the observed fluorescence LiDAR signal can be used for approximating the chlorophyll-a concentration of C. reinhardtii in a controlled environment. This was supported by the positive correlation between the range-resolved fluorescence LiDAR signal and OD680 (r = 0.77; p = 0.00049) and EEM fluorescence chlorophyll-a pigment at 680 nm (r = 0.75; p = 0.0008). It also showed a positive linear correlation with pH measurements (r = 0.83; p = 0.0006) and water temperature (r = 0.63; p = 0.0089). The system can clearly estimate the chlorophyll-a pigment of an algae from the lag phase to the death phase considering a specific cultivation parameter. There are several factors that can affect the estimated chlorophyll-a concentration, such as pH, temperature, and predators, which are proven in this study.

Author Contributions

Conceptualization, J.G.C., T.S., E.A.V. and M.C.D.G.; Methodology, J.G.C., Formal analysis, J.G.C., M.C.D.G.; Investigation, J.G.C. Writing—original draft preparation, J.G.C., T.S., E.A.V. and M.C.D.G. All authors have read and agreed to the published version of the manuscript.

Funding

This research received no external funding.

Institutional Review Board Statement

Not applicable.

Informed Consent Statement

Not applicable.

Data Availability Statement

Not applicable.

Acknowledgments

J.G. Cadondon acknowledges financial support from DOST ASTHRDP-NSC scholarship and UP Visayas. We would like to thank DLSU-URCO project No. 16 IR2TAY19-2TAY21 entitled “Water Quality and Fluorescence Measurements of Water Bodies”. The researchers also acknowledge CENSER through EARTH lab of the De La Salle University for supporting this project.

Conflicts of Interest

The authors declare no conflict of interest.

References

  1. Fields, F.J.; Lejzerowicz, F.; Schroeder, D.; Ngoi, S.M.; Tran, M.; McDonald, D.; Jiang, L.; Chang, J.T.; Knight, R.; Mayfield, S. Effects of the microalgae Chlamydomonas on gastrointestinal health. J. Funct. Foods 2020, 65, 103738. [Google Scholar] [CrossRef]
  2. Matos, J.; Cardoso, C.; Bandarra, N.M.; Afonso, C. Microalgae as health ingredients for functional food: A review. Food Funct. 2017, 8, 2672–2685. [Google Scholar] [CrossRef] [PubMed]
  3. Caporgno, M.P.; Mathys, A. Trends in microalgae incorporation into innovative food products with potential health benefits. Front. Nutr. 2018, 5, 58. [Google Scholar] [CrossRef] [PubMed]
  4. Fallah, A.A.; Sarmast, E.; Habibian Dehkordi, S.; Engardeh, J.; Mahmoodnia, L.; Khaledifar, A.; Jafari, T. Effect of Chlorella supplementation on cardiovascular risk factors: A meta-analysis of randomized controlled trials. Clin. Nutr. 2018, 37, 1892–1901. [Google Scholar] [CrossRef]
  5. Batista, A.P.; Gouveia, L.; Bandarra, N.M.; Franco, J.M.; Raymudo, A. Comparison of microalgal biomass profiles as novel functional ingredient for food products. Algal Res. 2013, 2, 164–173. [Google Scholar] [CrossRef] [Green Version]
  6. Springer Nature. Chlamydomonas reinhardtii. 2019. Available online: https://www.nature.com/subjects/chlamydomonas-reinhardtii (accessed on 26 July 2022).
  7. Scaife, M.A.; Nguyen, G.T.; Rico, J.; Lambert, D.; Helliwell, K.E.; Smith, A.G. Establishing Chlamydomnas reinhardtii as an industrial biotechnology host. Plant J. 2015, 82, 532–546. [Google Scholar] [CrossRef]
  8. Harris, E.H. Chlamydomonas as a model organism. Annu. Rev. Plant Physiol. Plant Mol. Biol. 2001, 52, 97–112. [Google Scholar] [CrossRef] [Green Version]
  9. Sommer, U.; Adrian, R.; De Senerpont Domis, L.; Elser, J.J.; Gaedke, U.; Ibeling, B.; Jeppesen, E.; Lurling, M.; Molinero, J.C.; Mooij, W.M.; et al. Beyond the plankton ecology group (PEG) model: Mechanism driving plankton succession. Annu. Rev. Ecol. Evol. Syst. 2012, 43, 429–448. [Google Scholar] [CrossRef]
  10. Coleman, D.C.; Callaham, M.A., Jr.; Crossley, D.A., Jr. Fundamental of Soil Ecology, 3rd ed.; Academic Press: Cambridge, MA, USA, 2017. [Google Scholar]
  11. Buysschaert, B.; Vermijs, L.; Naka, A.; Boon, N.; De Gusseme, B. Online flow cytometric monitoring of microbial water quality in full-scale water treatment plant. Clean Water 2018, 1, 16. [Google Scholar] [CrossRef] [Green Version]
  12. Helmi, K.; David, F.; Di Matrino, P.; Jaffrezic, M.-P.; Ingrand, V. Assessment of flow cytometry for microbial water quality monitoring in cooling tower water and oxidizing treatment facility. J. Microbiol. Methods 2018, 152, 201–209. [Google Scholar] [CrossRef]
  13. Cadondon, J.G.; Napal, J.P.D.; Abe, K.; De Lara, R.; Vallar, E.A.; Orbecido, A.H.; Belo, L.P.; Galvez, M.C.D. Characterization of water quality and fluorescence measurements of dissolved organic matter in Cabuyao river and its tributaries using excitation-emission matrix spectroscopy. J. Phys. Conf. Ser. 2020, 1593, 012033. [Google Scholar] [CrossRef]
  14. Cadondon, J.G.; Vallar, E.A.; Belo, L.P.; Orbecido, A.H.; Galvez, M.C.D. UV-vis absorbance and fluorescence characterization of Pasig River surface water samples towards the development of an LED fluorescence lidar system. Int. J. Adv. Sci. Eng. Inf. Technol. 2021, 11, 968–980. [Google Scholar] [CrossRef]
  15. Stedmon, C.A.; Bro, R. Characterizing dissolved organic matter fluorescence with parallel factor analysis: A tutorial. Limnol. Oceanogr. Methods 2008, 6, 572–579. [Google Scholar] [CrossRef]
  16. Coble, P.; Lead, J.; Baker, A.; Reynolds, D.; Spencer, R. Aquatic Organic Matter Fluorescence; Cambridge Environmental Chemistry Series; Cambridge University Press: Cambridge, UK, 2014. [Google Scholar]
  17. Fellman, J.B.; Hood, E.; Spencer, R.G.M. Fluorescence spectroscopy opens new windows into dissolved organic matter dynamics in freshwater ecosystems: A review. Limnol. Oceanogr. 2010, 55, 2452–2462. [Google Scholar] [CrossRef]
  18. Campbell, J.B.; Wynne, R.H. Introduction to Remote Sensing, 5th ed.; Guilford Press: New York, NY, USA, 2011. [Google Scholar]
  19. Rantajarvi, E.; Olsonen, R.; Hallfors Leppanen, J.-M.; Raateja, M. Effect of sampling frequency on detection of natural variability in phytoplankton: Unattended high-frequency measurements on board ferries in the Baltic Sea. ICES J. Mar. Sci. 1998, 55, 697–704. [Google Scholar] [CrossRef] [Green Version]
  20. Boss, E.; Haentjens, N.; Ackleson, S.G.; Balch, B.; Chase, A.; Dall’Olmo, G.; Freeman, S.; Liu, Y.; Loftin, J.; Neary, W.; et al. Inherent optical property measurements and protocols: Best practices for the collection and processing of ship-based underway flow-through optical data. In Ocean Optics & Biogeochemistry Protocols for Satellite Ocean Colour Sensor Validation; IOCCG Protocol Series; Neeley, A.R., Mannino, A., Eds.; IOCCG: Darmouth, NS, Canada, 2019; Volume 4.0. [Google Scholar]
  21. Li, Y.; Yu, K.; Zhang, W.; Li, D.; Zhao, Z.; Jiang, X.; Jin, D.; Shang, B.; Wang, H. Progress of airborne lidar of ocean chlorophyll observations including algorithms and instruments. IOP Conf. Ser. Mater. Sci. Eng. 2020, 730, 012046. [Google Scholar] [CrossRef]
  22. Yoder, J.A.; Aiken, J.; Swift, R.N.; Hoge, F.E.; Stegmann, P.M. Spatial variability in near surface chlorophyll-a fluorescence measured by the Airborne Oceanographic Lidar (AOL). Deep. Se Res. Part II Tp. Stud. Oceanogr. 1993, 40, 37–53. [Google Scholar] [CrossRef]
  23. Papenfus, M.; Schaeffer, B.; Pollard, A.I.; Loftin, K. Exploring the potential value of satellite remote sensing to monitor chlorophyll-a for US lakes and reservoirs. Environ. Monit. Assess. 2020, 192, 808. [Google Scholar] [CrossRef]
  24. Topp, S.N.; Pavelsky, T.M.; Jensen, D.; Simard, M.; Ros, M.R.V. Research trends in the use of remote sensing for inland water quality science: Moving towards multidisciplinary. Water 2019, 12, 169. [Google Scholar] [CrossRef] [Green Version]
  25. Raimondi, V.; Cecchi, G.; Lognoli, D.; Palombi, L.; Gronlund, R.; Johansson, A.; Svanberg, S.; Barup, K.; Hallstrom, J. The fluorescence lidar technique for the remote sensing of photoautotrophic biodeteriogens in the outdoor cultural heritage: A decade of in situ experiments. Inter. Biodeterior. Biodegrad. 2009, 63, 823–835. [Google Scholar] [CrossRef]
  26. Saito, Y.; Takano, K.; Kobayashi, F.; Kobayashi, K.; Prk, H.-D. Development of a UV laser-induced fluorescence for monitoring blue-green algae in Lake Suwa. Appl. Opt. 2014, 53, 7030–7036. [Google Scholar] [CrossRef] [PubMed]
  27. Palmer, S.C.; Pelevin, V.V.; Goncharenko, I.; Kovacs, A.W.; Zlinsky, A.; Presing, M.; Horvath, H.; Nicolas-Pera, V.; Balzier, H.; Toth, V.R. Ultraviolet fluorescence LiDAR (UFL) as a measurement tool for water quality parameters in Turbid Lake conditions. Remote Sens. 2013, 5, 4405–4422. [Google Scholar] [CrossRef]
  28. Cadondon, J.G.; Ong, P.M.B.; Vallar, E.A.; Shiina, T.; Galvez, M.C.D. Chlorophyll-a pigment measurement of spirulina in algal growth monitoring using portable pulsed LED fluorescence lidar system. Sensors 2022, 22, 2940. [Google Scholar] [CrossRef] [PubMed]
  29. Saito, Y.; Ichihara, K.; Morishita, K.; Uchiyama, K.; Kobayashi, F.; Tomida, T. Remote detection of the fluorescence spectrum of natural pollens floating in the atmosphere using a laser-induced-fluorescence spectrum (LIPS) Lidar. Remote Sens. 2018, 10, 1533. [Google Scholar] [CrossRef] [Green Version]
  30. Shiina, T. LED mini lidar for atmospheric application. Sensors 2019, 19, 569. [Google Scholar] [CrossRef] [Green Version]
  31. Koyama, M.; Shiina, T. Light source module for LED mini-lidar. Rev. Laser Eng. 2011, 39, 617–621. [Google Scholar] [CrossRef] [Green Version]
  32. Ong, P.M.B.; Shiina, T.; Manago, N.; Kuze, H.; Senshu, H.; Otobe, N.; Hashimoto, G.; Kawabata, Y. A compact LED Lidar system fitted for a mars rover—Design and ground experiment. EPJ Web Conf. 2018, 176, 02013. [Google Scholar] [CrossRef] [Green Version]
  33. Stanier, R.Y.; Kunisawa, R.; Mandel, M.; Cohen-Bazire, G. Purification and properties of unicellular blue-green algae (Order Chroococcales). Bacteriol. Rev. 1971, 35, 171–205. [Google Scholar] [CrossRef]
  34. Measures, R. Laser Remote Sensing; Wiley Publishing: Hoboken, NJ, USA, 1984. [Google Scholar]
  35. Janssen, P.J.D.; Laambreva, M.D.; Plumere, N.; Bartolucci, C.; Antonacci, A.; Buonasera, K.; Frese, R.N.; Scognamiglio, V.; Rea, G. Photosynthesis at the forefront of a sustainable life. Front. Chem. 2014, 2, 36. [Google Scholar] [CrossRef] [Green Version]
  36. Donohue, J.M. Water conditioning, industrial. In Encyclopedia of Physical Science and Technology, 3rd ed.; Elsevier: Amsterdam, The Netherlands, 2003; pp. 671–697. [Google Scholar] [CrossRef]
  37. Miller, S.D.; Stephens, G.L. Multiple scattering effects in the lidar pulse stretching problem. J. Geophys. Res. 1999, 104, 22205–22219. [Google Scholar] [CrossRef] [Green Version]
  38. Kalra, I.; Wang, X.; Cvetkovska, M.; Jeong, J.; McHargue, W.; Zhang, R.; Huner, N.; Yuan, J.S.; Morgan-Kiss, R. Chlamydomonas sp. UWO 241 exhibits high cyclic electron flow and rewired metabolism under high salinity. Plant Physiol. 2020, 183, 588–601. [Google Scholar] [CrossRef]
  39. Young, E.B.; Reed, L.B.J.A. Growth Parameters and responses of green algae across a gradient of phototrophic, mixotrophic and heterotrophic conditions. Peer J 2022, 10, e13776. [Google Scholar] [CrossRef]
  40. Omar, W.M. Perspectives on the use of algae as biological indicators for monitoring and protecting aquatic environments, with special reference to Malaysian freshwater ecosystems. Trop. Life Sci. Res. 2010, 21, 51–67. [Google Scholar]
  41. Stevenson, J. Ecological assessments with algae: A review and synthesis. J. Phycol. 2014, 50, 437–461. [Google Scholar] [CrossRef]
  42. Krishnan, V.; Uemura, Y.; Thanh, N.T.; Khalid, N.A.; Osman, N.; Mansor, N. Three types of marine microalgae and Nannocholoropsis oculate cultivation for potential source of biomass production. J. Phys. Conf. Ser. 2015, 622, 012034. [Google Scholar] [CrossRef]
  43. Lurling, M.; Beekman, W. Palmelloids formation in Chlamydomonas reinhardtii: Defense against rotifer predators? Ann. Limnol. Int. J. Limnol. 2006, 42, 65–72. [Google Scholar] [CrossRef]
  44. Schagerl, M.; Siedler, R.; Konopacova, E.; Ali, S.S. Estimating biomass and vitality of microalgae for monitoring cultures: A roadmap for reliable measurements. Cells 2022, 11, 2455. [Google Scholar] [CrossRef]
Figure 1. The design of the pulsed LED fluorescence lidar system. The arrow diagram represents the excitation beam from the transmitting component and fluorescence backscatter signal from the algal tank [28].
Photonics 10 00144 g001
Figure 2. Normalized fluorescence LiDAR signal of C. reinhardtii during the 16-day sampling period. It shows a whisker and box plot showing the different growth phases of C. reinhardtii.
Photonics 10 00144 g002
Figure 3. Time–range intensity profile of C. reinhardtii during the 16-day sampling period.
Photonics 10 00144 g003
Figure 4. EEM measurements of C. reinhardtii during the 16-day sampling period. Single fluorescence peak was observed in each EEM.
Photonics 10 00144 g004
Figure 5. Optical density and EEM fluorescence measurements of C. reinhardtii at 680 nm. The growth phase of the algae is observable at specific cultivation parameters.
Photonics 10 00144 g005
Figure 6. Line plots of (A) water quality parameters (water temperature and pH), and (B) weather measurements (air temperature and relative humidity) over the 16-day sampling period.
Photonics 10 00144 g006
Table 1. BG 11 culture media used in cultivating C. reinhardtii..
CompoundFinal Concentration (g/L Distilled H2O)
NaNO31.5
K2HPO40.04
MgSO4.7H2O0.075
CaCl2.2H2O0.036
Citric acid0.006
FeSO4.7H2O0.006
EDTA0.001
Na2CO3A5 micronutrient solution0.021 mL
Table 2. Specifications of the pulsed LED fluorescence LiDAR system.
Transmitter
LED Name/BrandNichia, NCSU034C
Wavelength385 nm
Peak power830 mW
Resolution1.2 m
Bandwidth10.92 ns
Repetition500 kHz
Beam diameter50 mm𝛷
Beam divergence5 mrad
Receiver
TelescopeSchmidt-Cassegrain
Beam diameter100 mm𝛷
Beam divergence3 mrad
Bandpass filters:
At 680 nm:
-Thorlabs (FB680-10)
680 ± 5 nm
Detection devicePhotomultiplier tube, Hamamatsu (R6350P)
Photon Counting Board
Photon Counting Device/BrandSpartan 6 (FPGA device)
Trimatiz Co. Ltd. (Chiba, Japan), Photon tracker
System lock550 MHz
BIN Width5 ns (0.75 m)
BIN length50
Acquisition count167777214 (max)
Trigger Input
Threshold level
300 mV
Table 3. Statistical summary of all data collected from the C. reinhardtii cultivation.
N = 16Mean/SDRange-Resolved Fluorescence
LiDAR Peak Value
OD680EEM Chlorophyll-a
Pigment
(680 nm)
pHWater Temp (°C)Rel. Humidity (%)Air Temp (°C)
Range-resolved fluorescence LiDAR peak value0.38/0.3110.00049 a,b,c0.0008 a,b,c0.00006 a,b,c0.0089 a,b,c0.29300.0211
OD6800.35/0.320.77 *10.00001 a,b,c0.000019 a,b,c0.035 b,c0.01 b,c0.48
EEM Chlorophyll-a pigment
(680 nm)
0.17/0.150.75 *0.93 *10.00001 a,b,c0.01 a,b,c0.03 b,c0.27
pH8.36/0.230.83 *0.86 *0.93 *10.012 b,c0.021 b,c0.61
Water temp (°C)29.42/0.790.63 *0.53 *0.62 *0.61 *10.2590.019 b,c
Rel Humidity (%)75.75/5.300.28 *0.62 *0.54 *0.57 *0.30 *10.435
Air temp (°C)30.51/0.880.07 *0.19 *0.27 *0.14 *0.58 *0.21 *1
Statistically significant at (a) p <0.01, (b) p < 0.05, and (c) p < 0.10; * r-value.
Disclaimer/Publisher’s Note: The statements, opinions and data contained in all publications are solely those of the individual author(s) and contributor(s) and not of MDPI and/or the editor(s). MDPI and/or the editor(s) disclaim responsibility for any injury to people or property resulting from any ideas, methods, instructions or products referred to in the content.

