Design of a Measuring Device and Experimental Study into the Relationship between Temperature and the Density of Alkali Metal-Vapor

 and
and
Abstract
:1. Introduction
2. Basic Principles
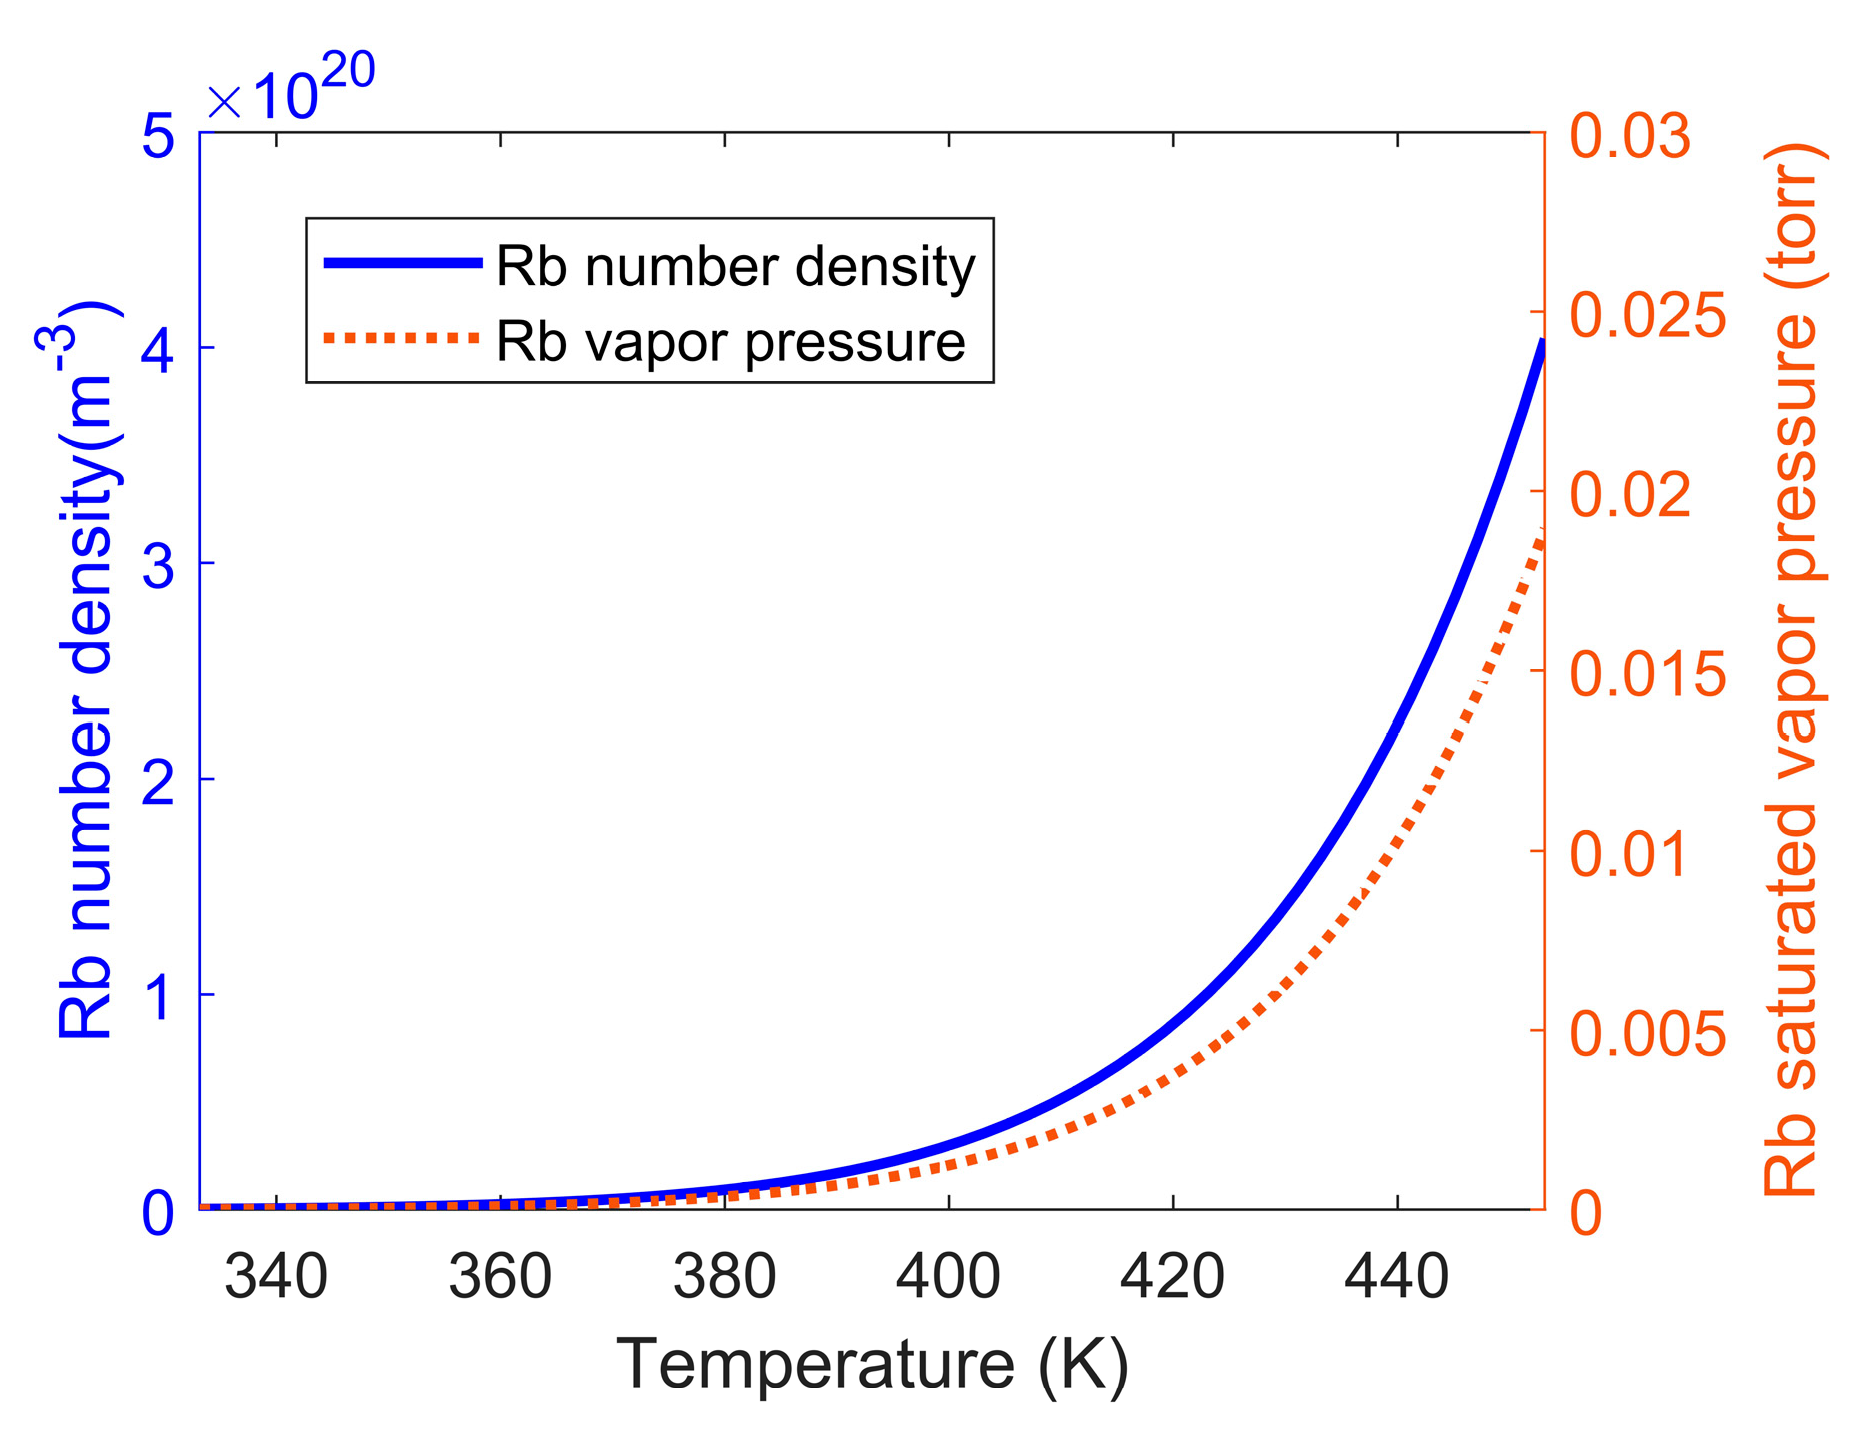
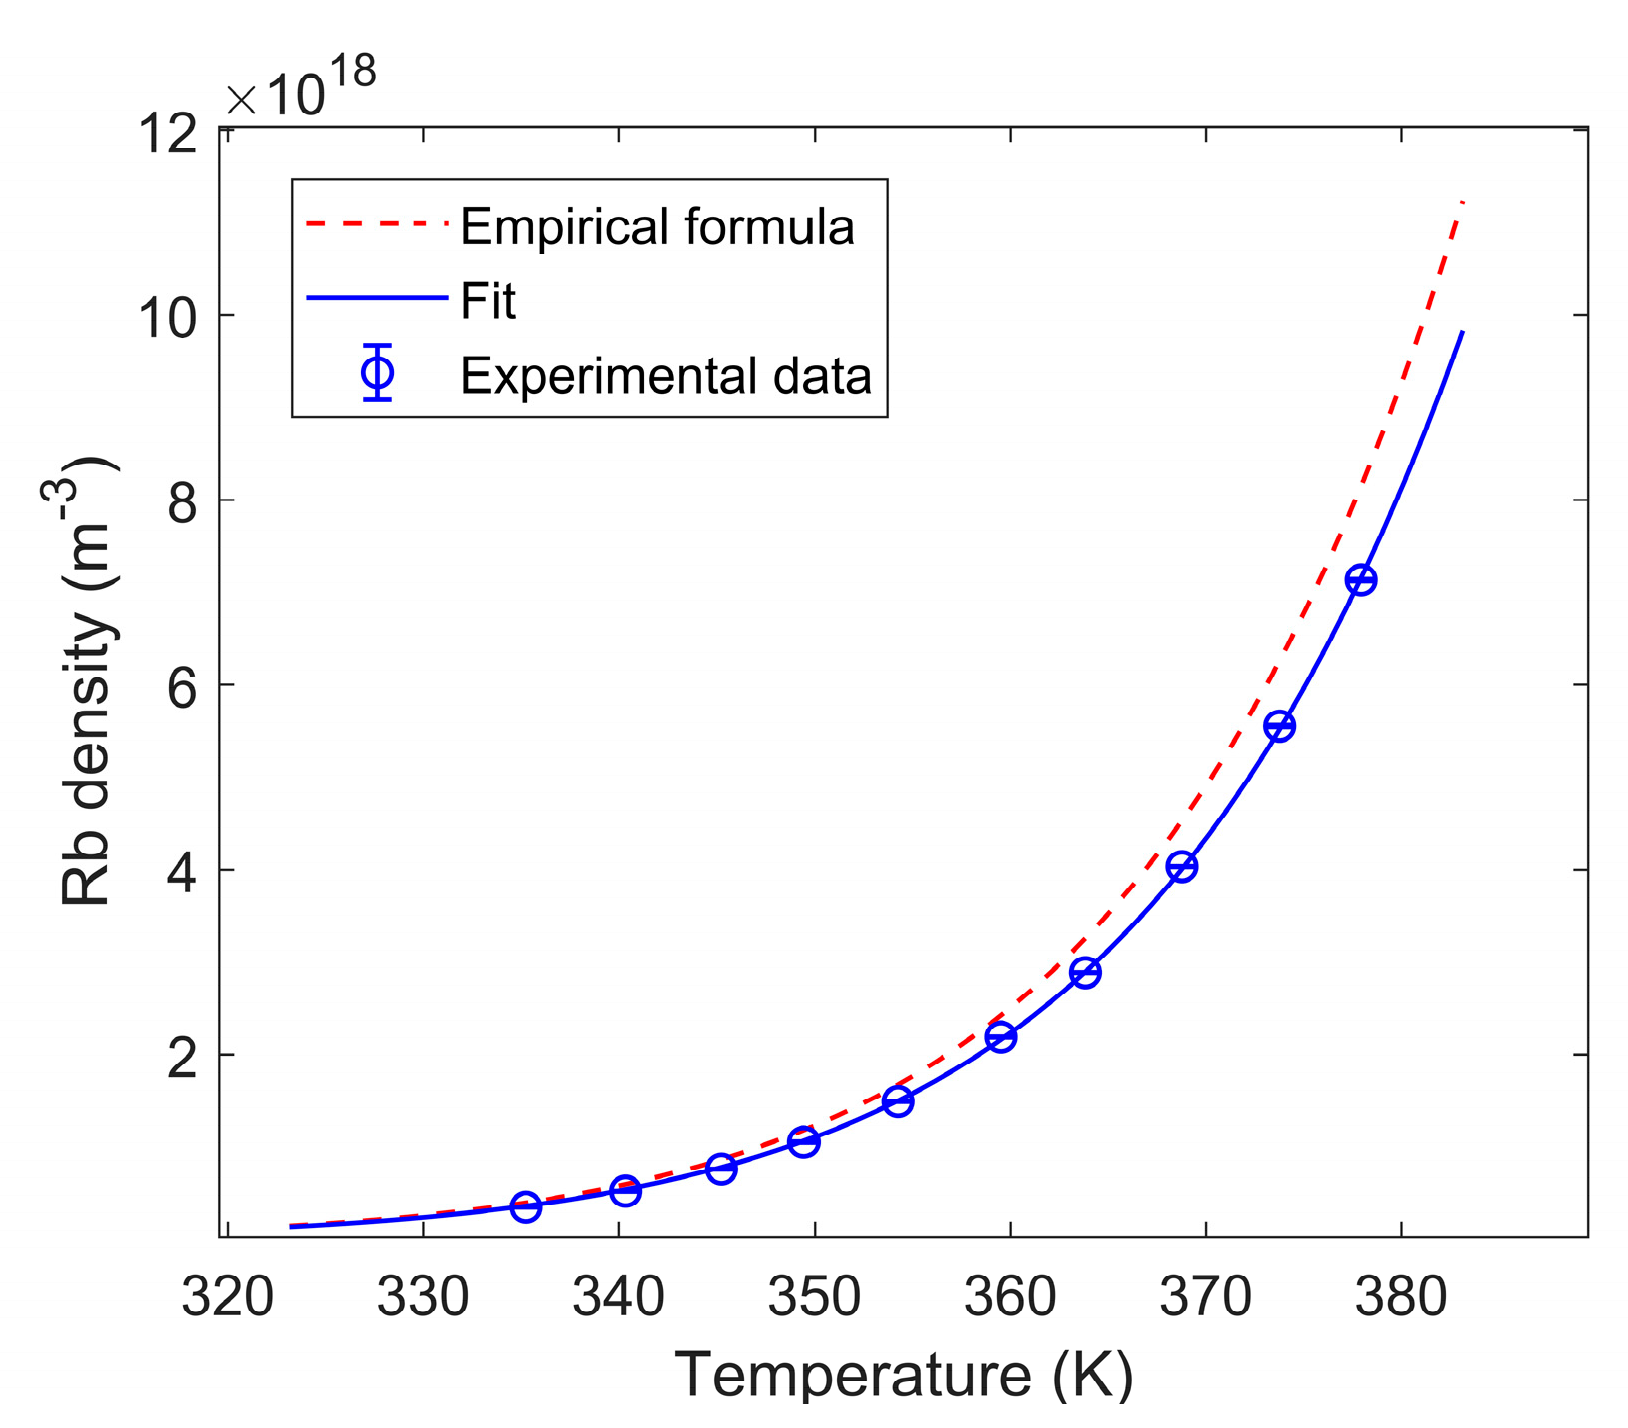
2.1. Relationship between Alkali-Metal Vapor Density and Temperature
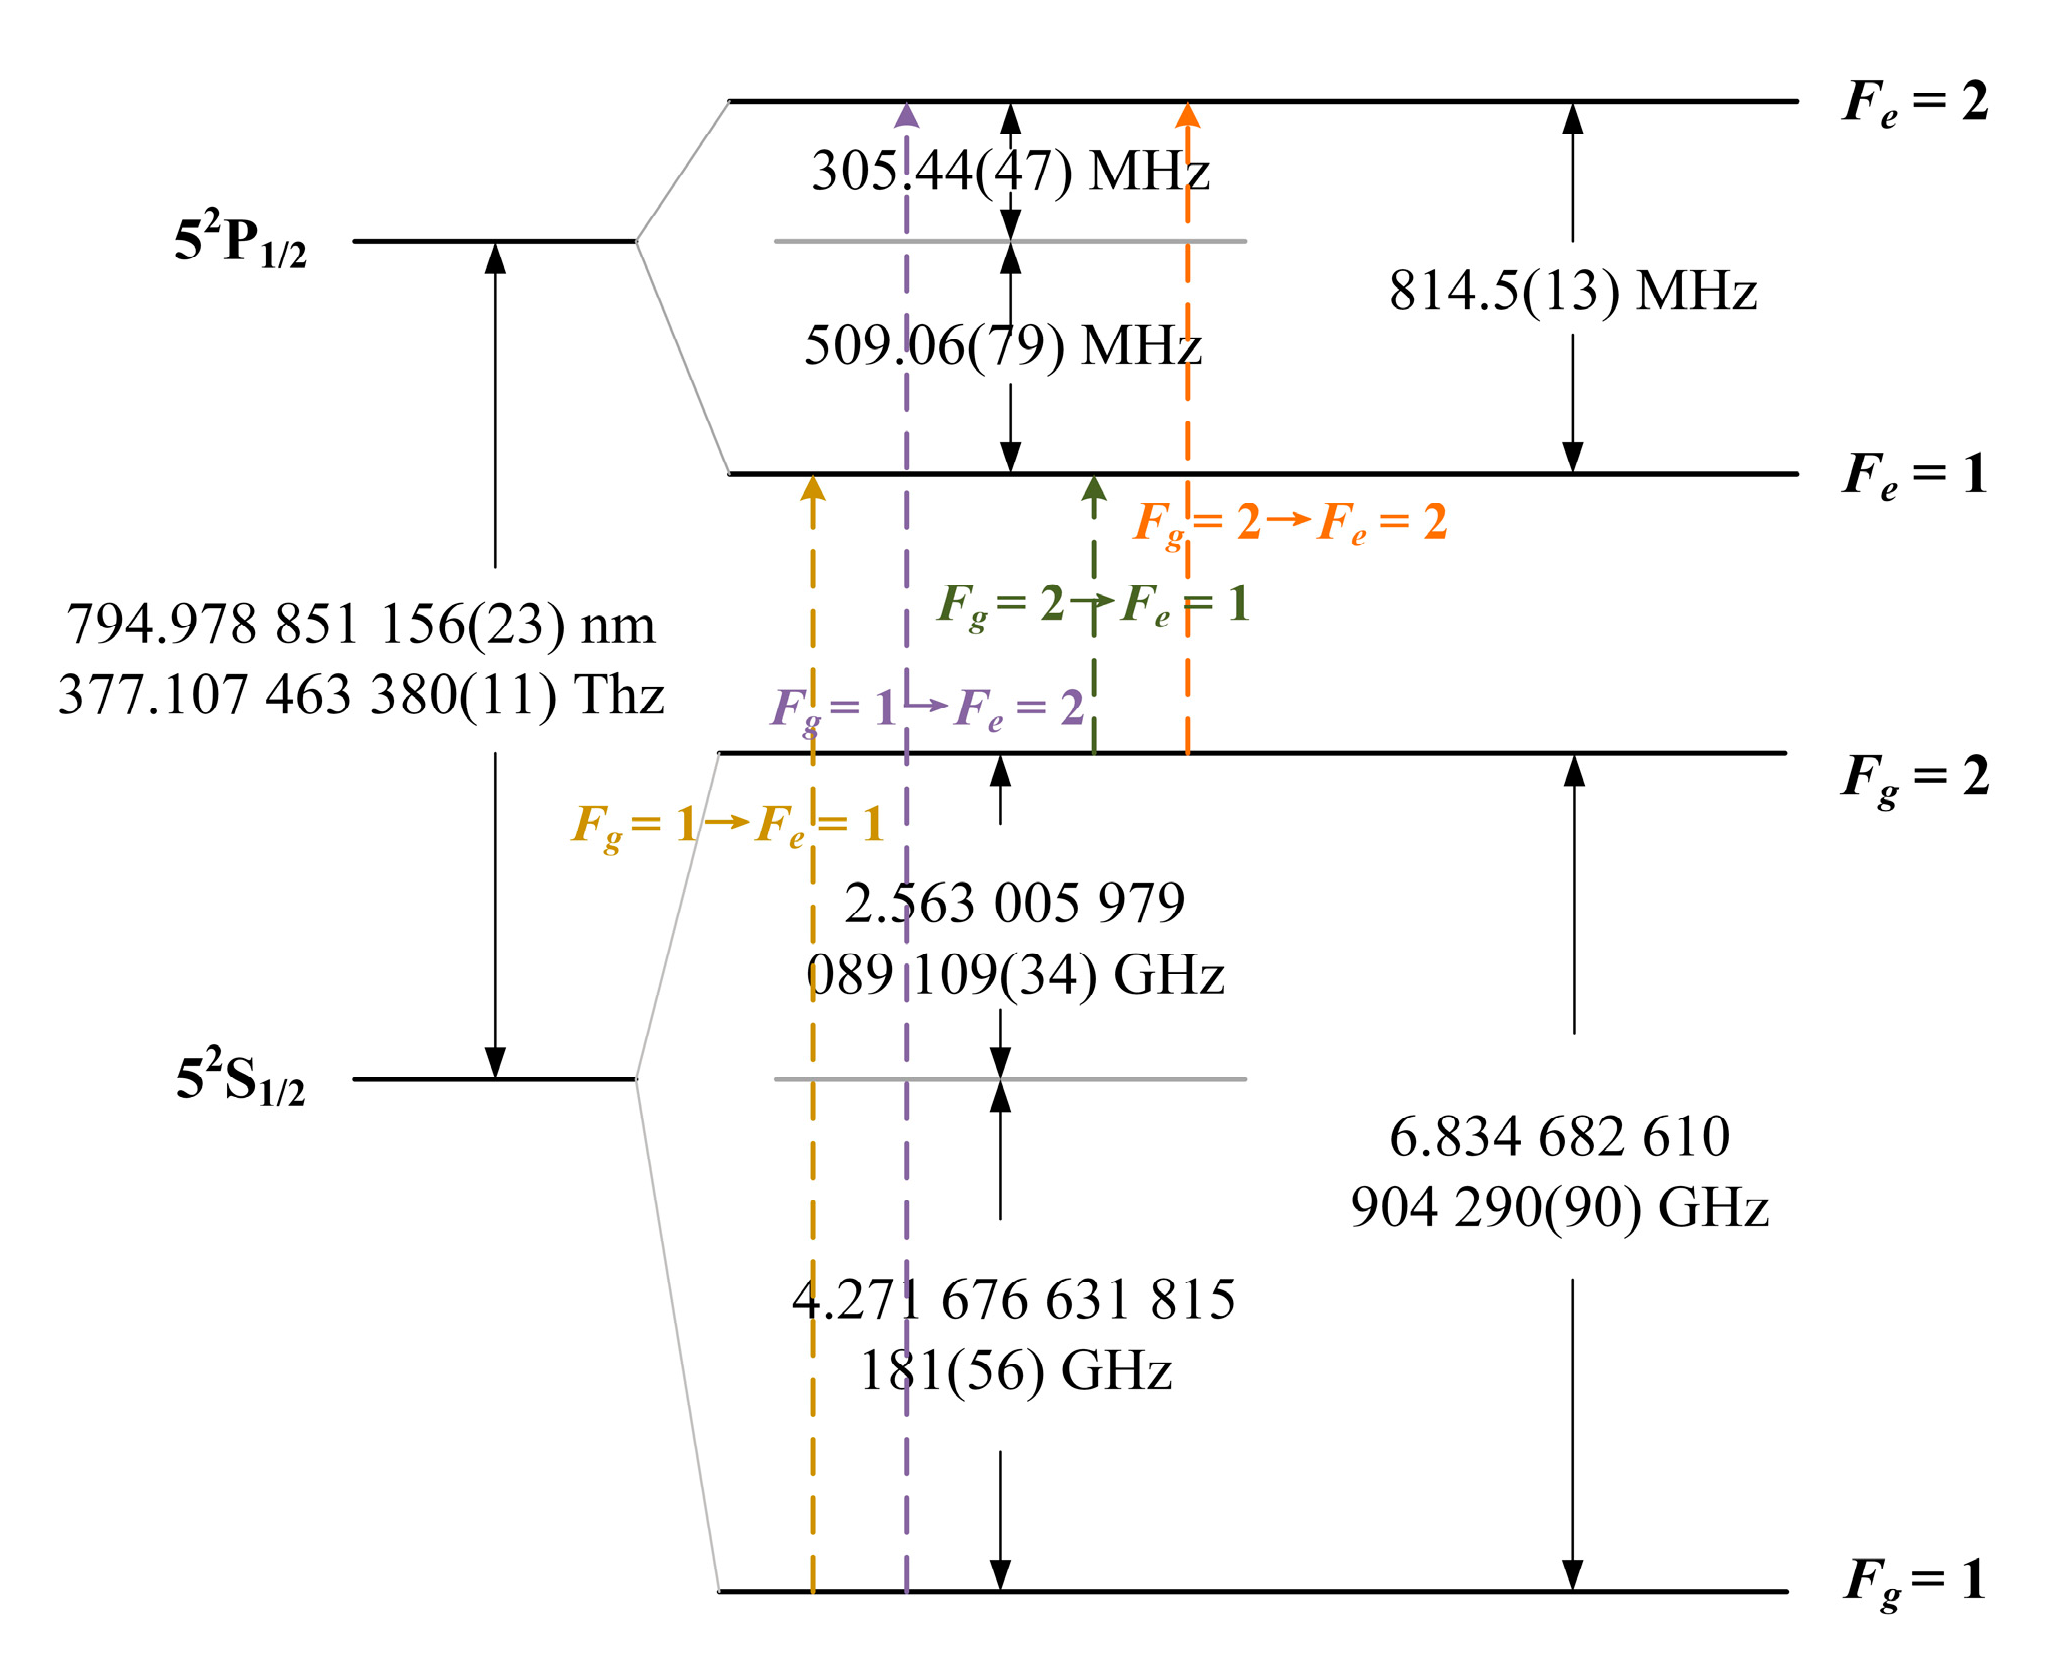
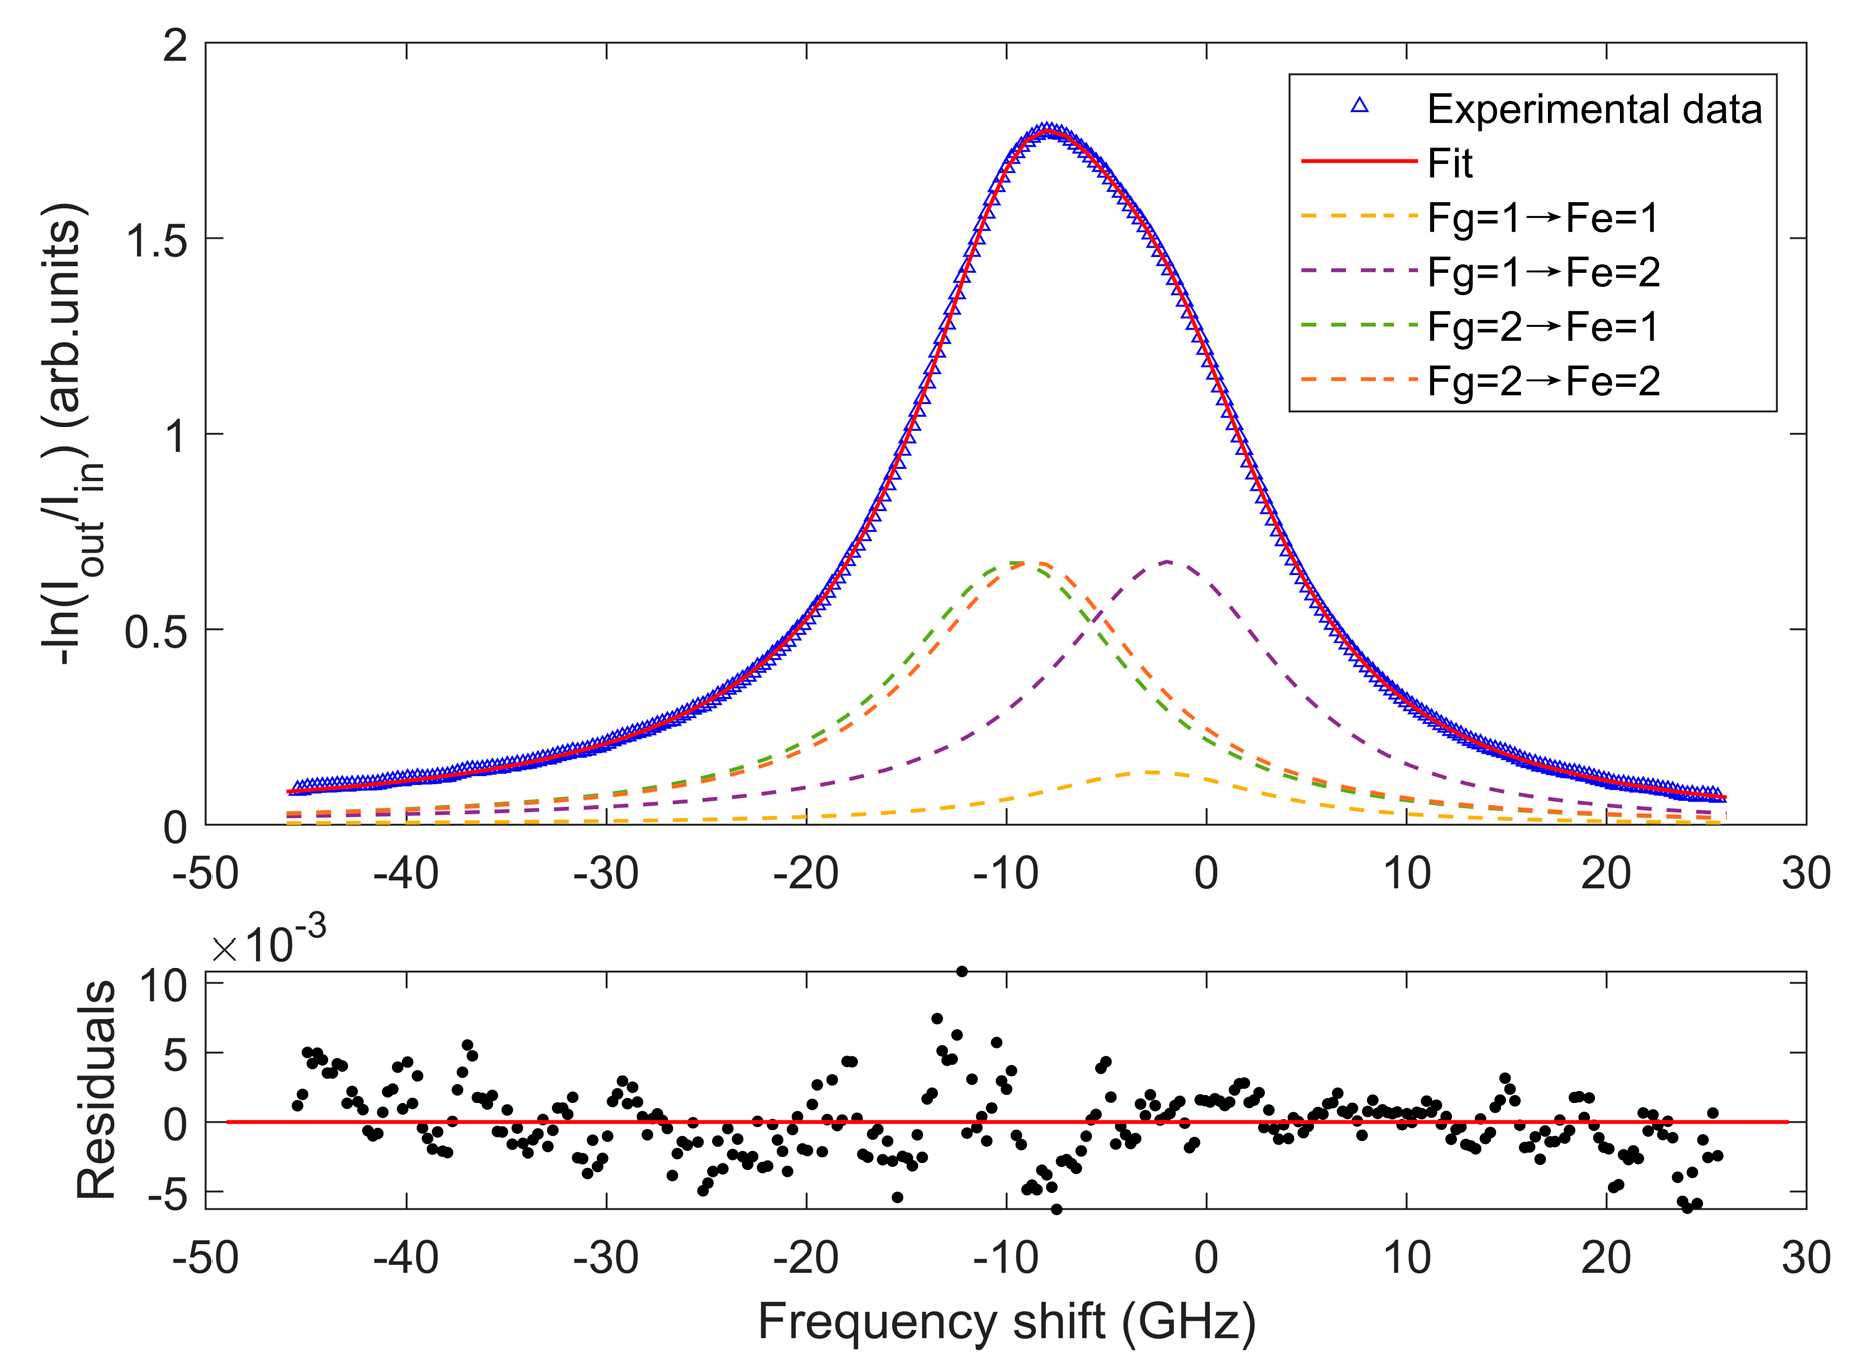
2.2. Spectral Absorption Theory
3. Device Design and Experimental Setup
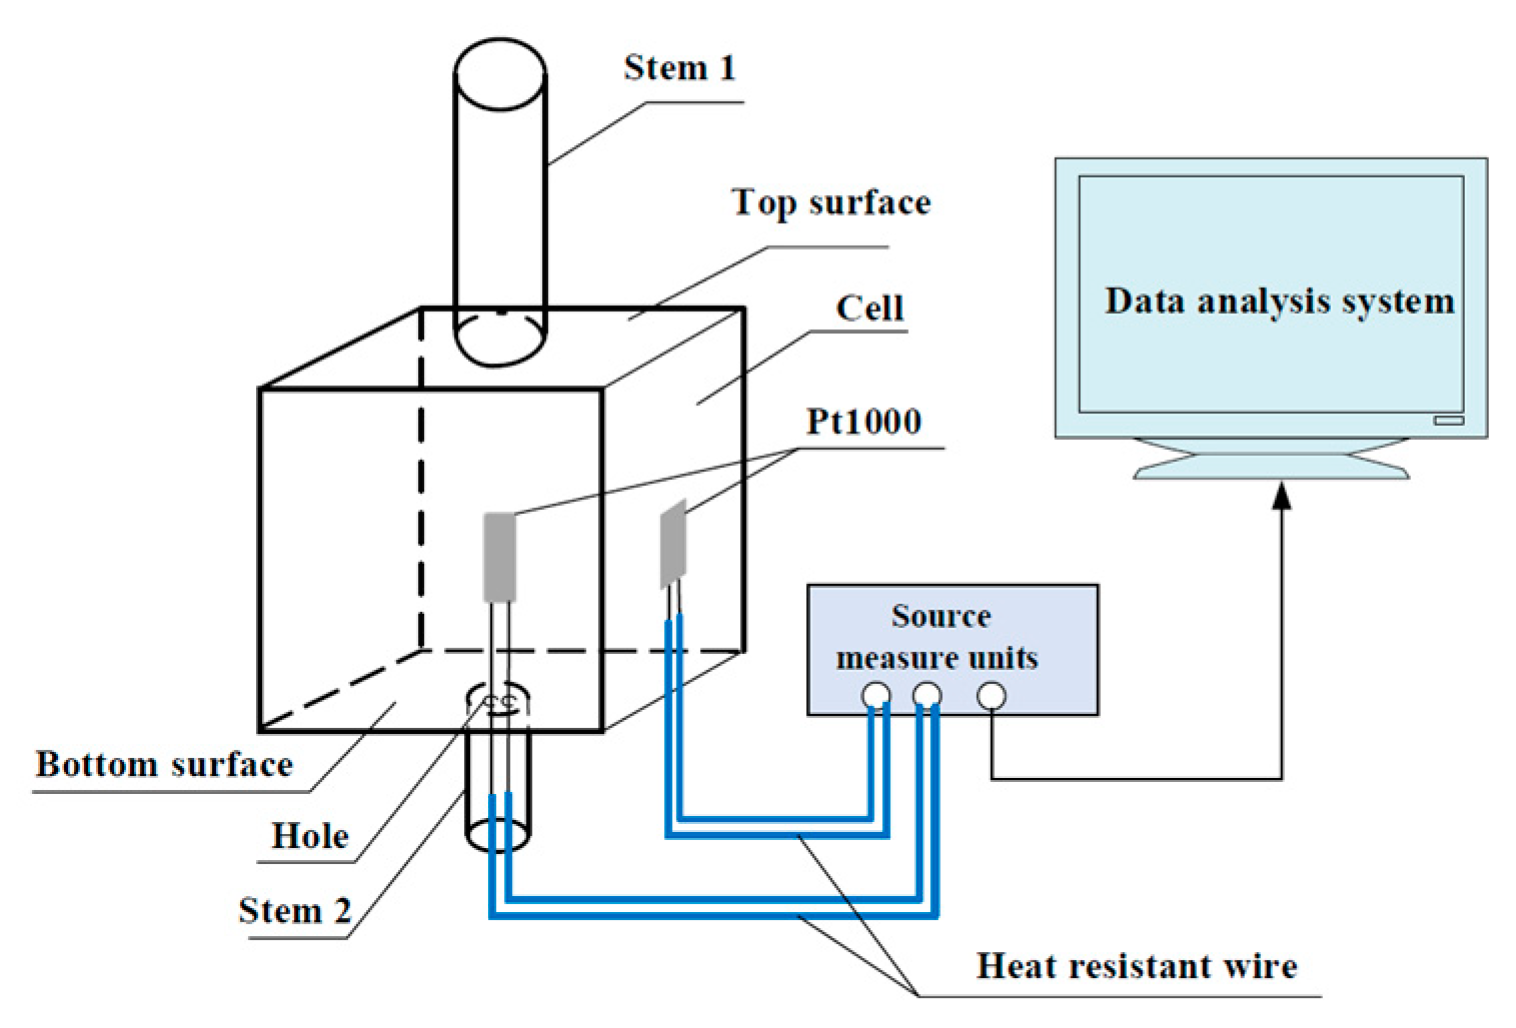
3.1. Device Design
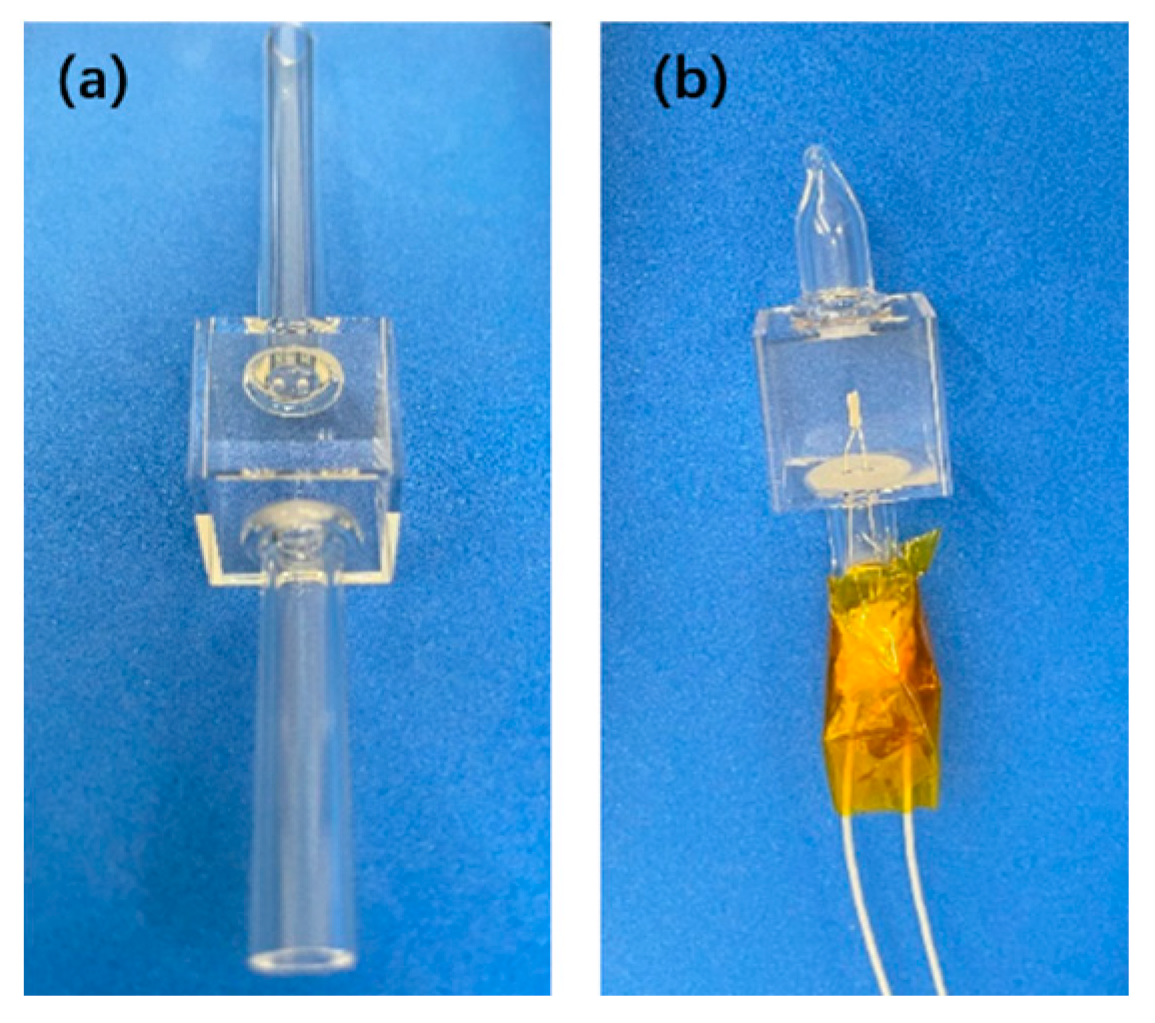
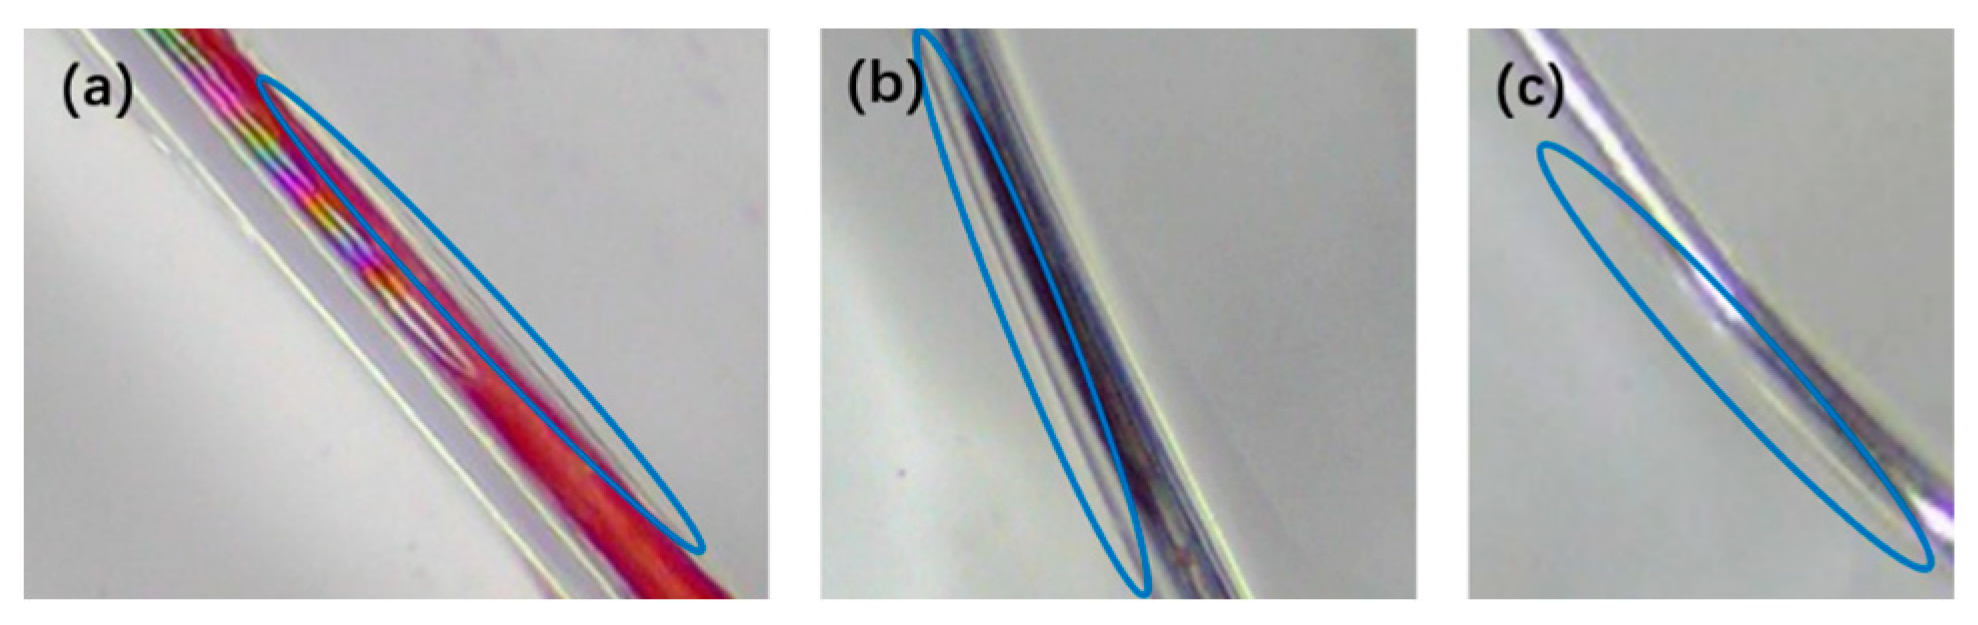
3.2. Device Fabrication
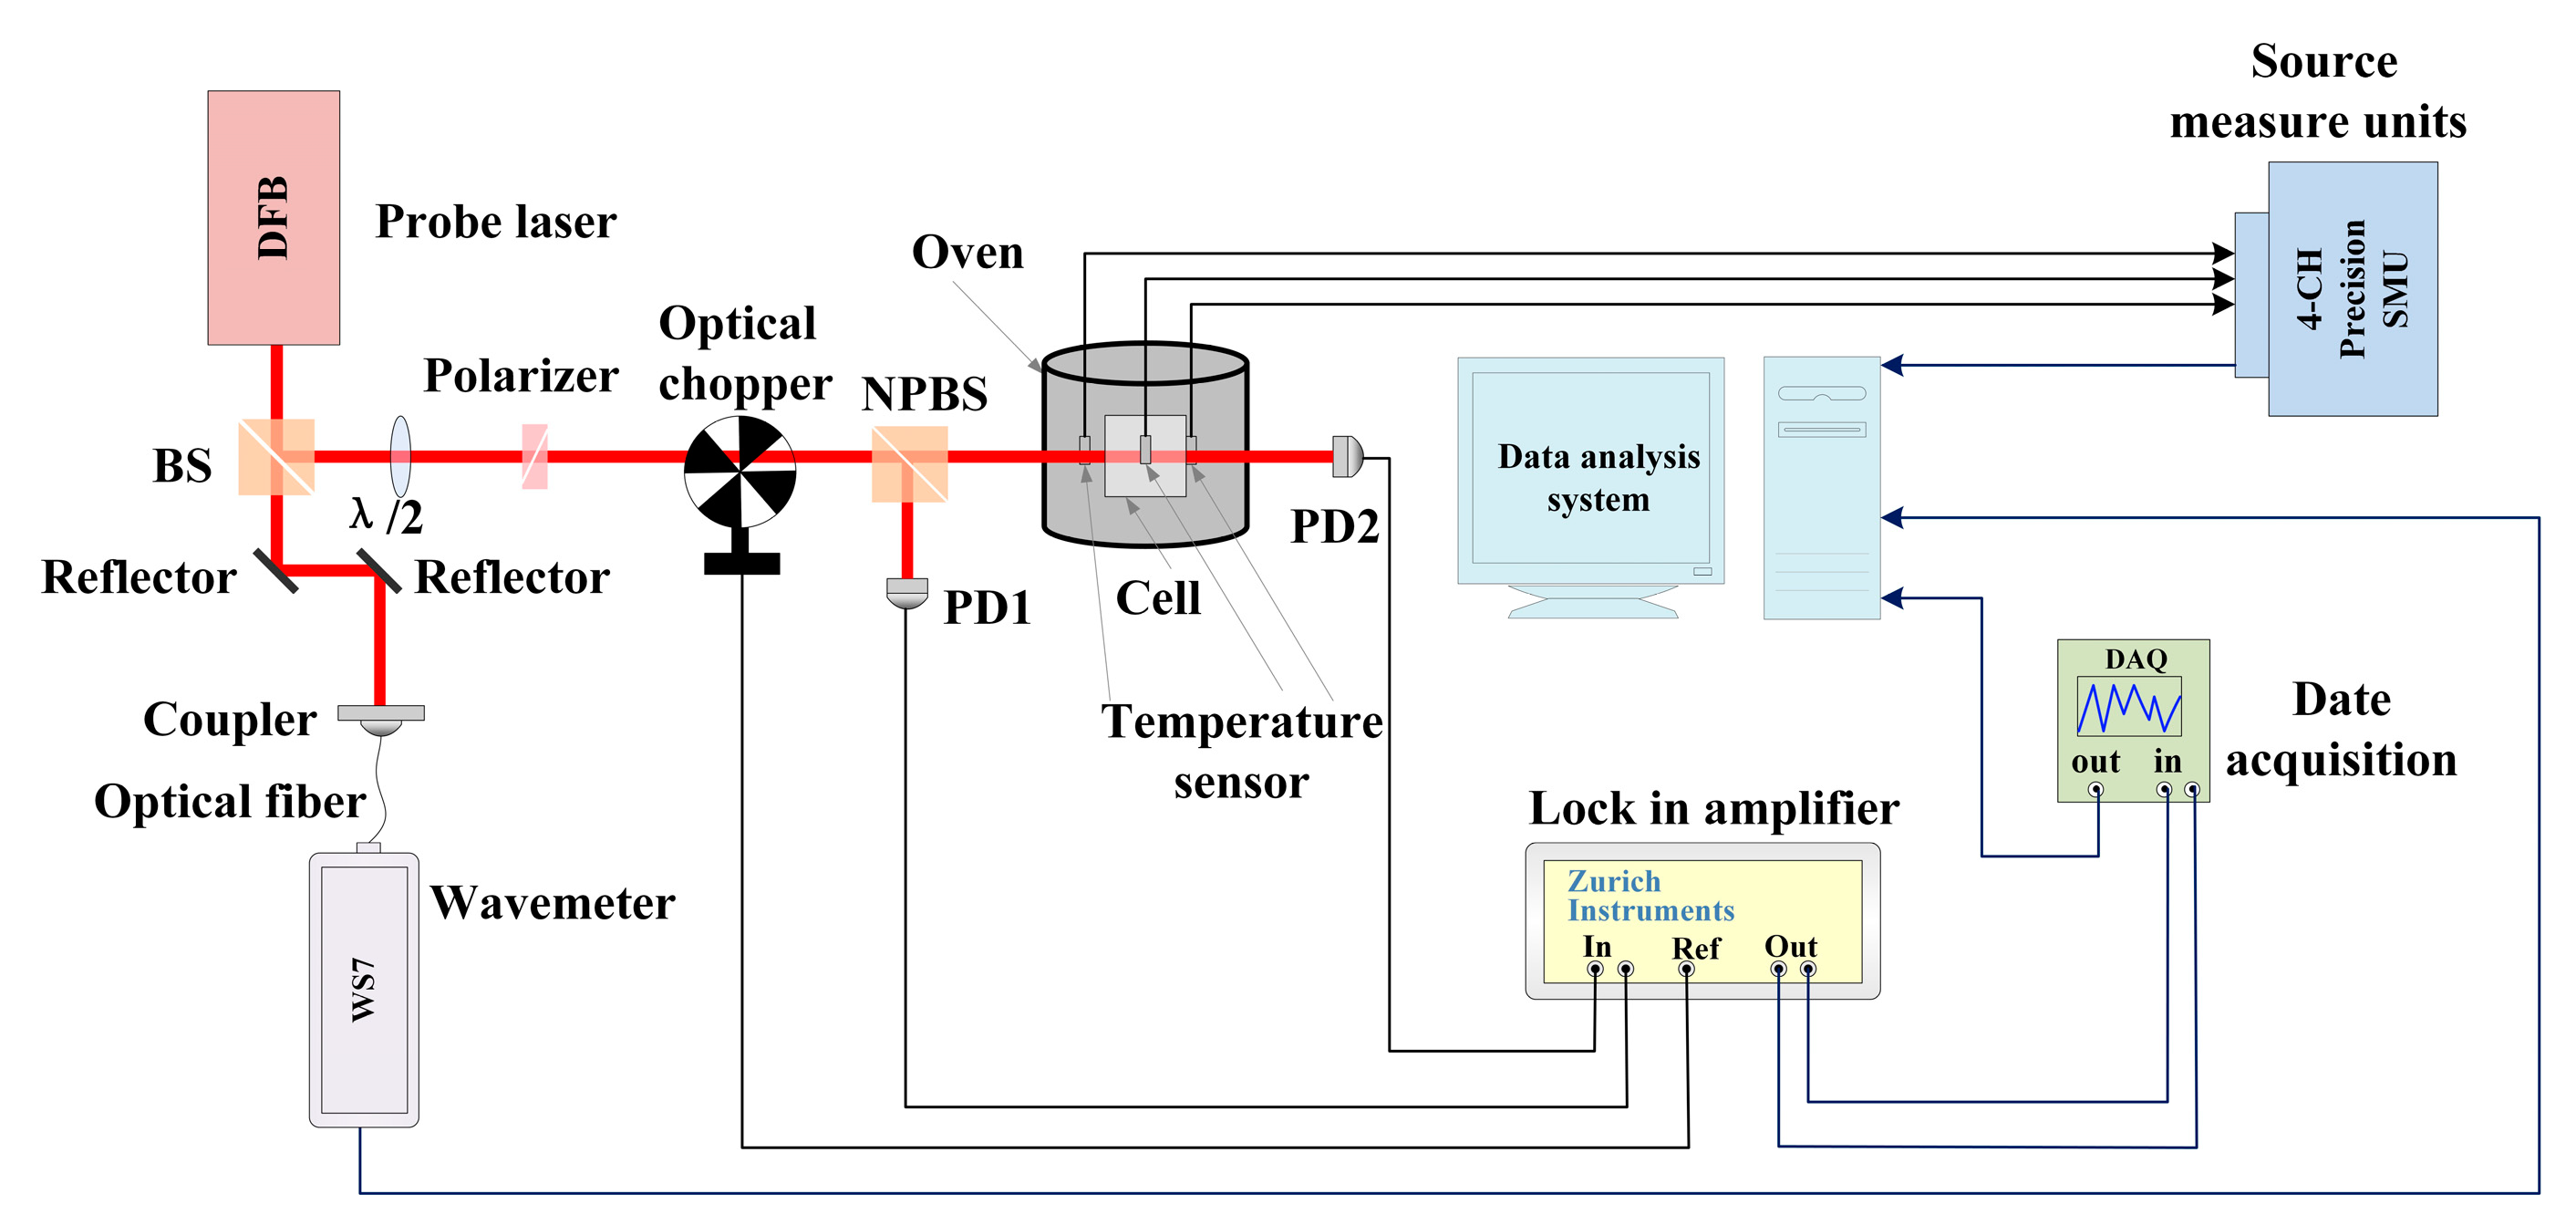
3.3. Experimental Setup
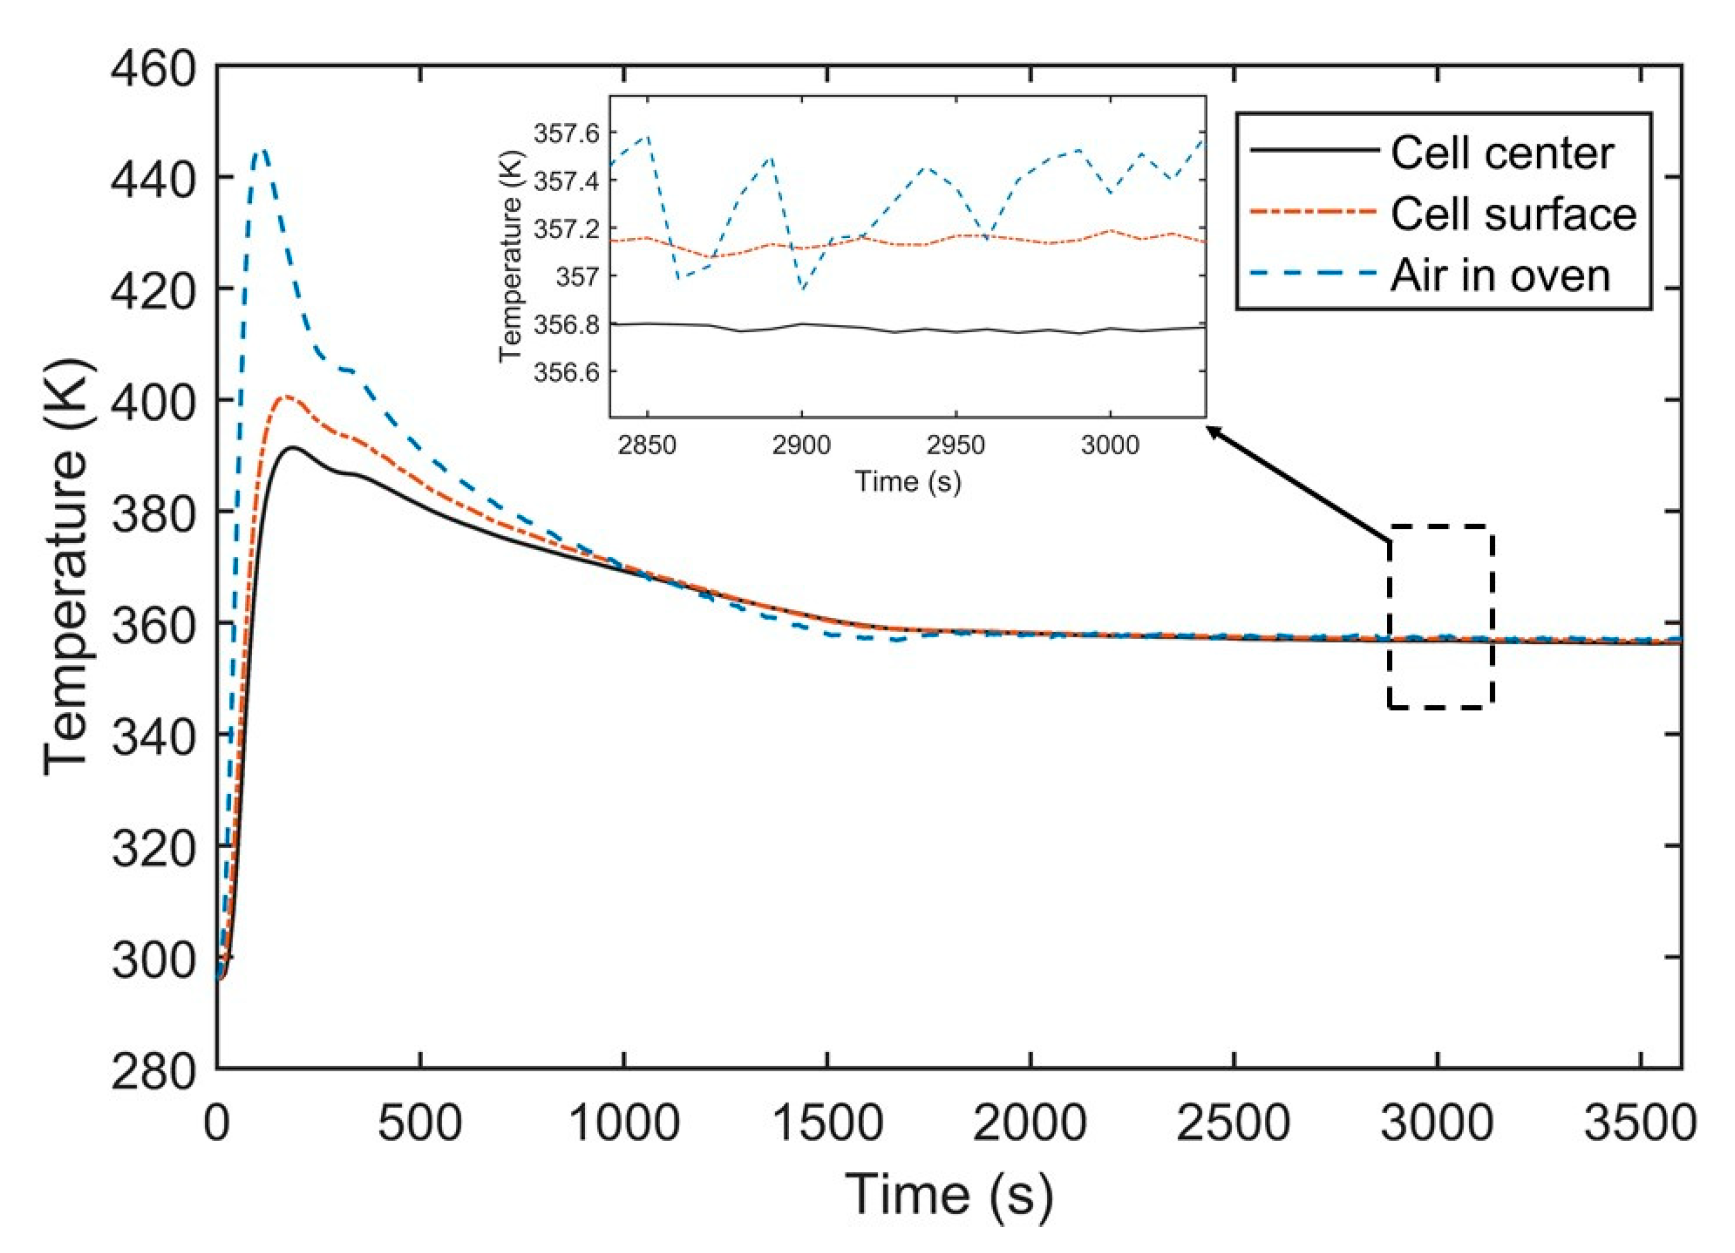
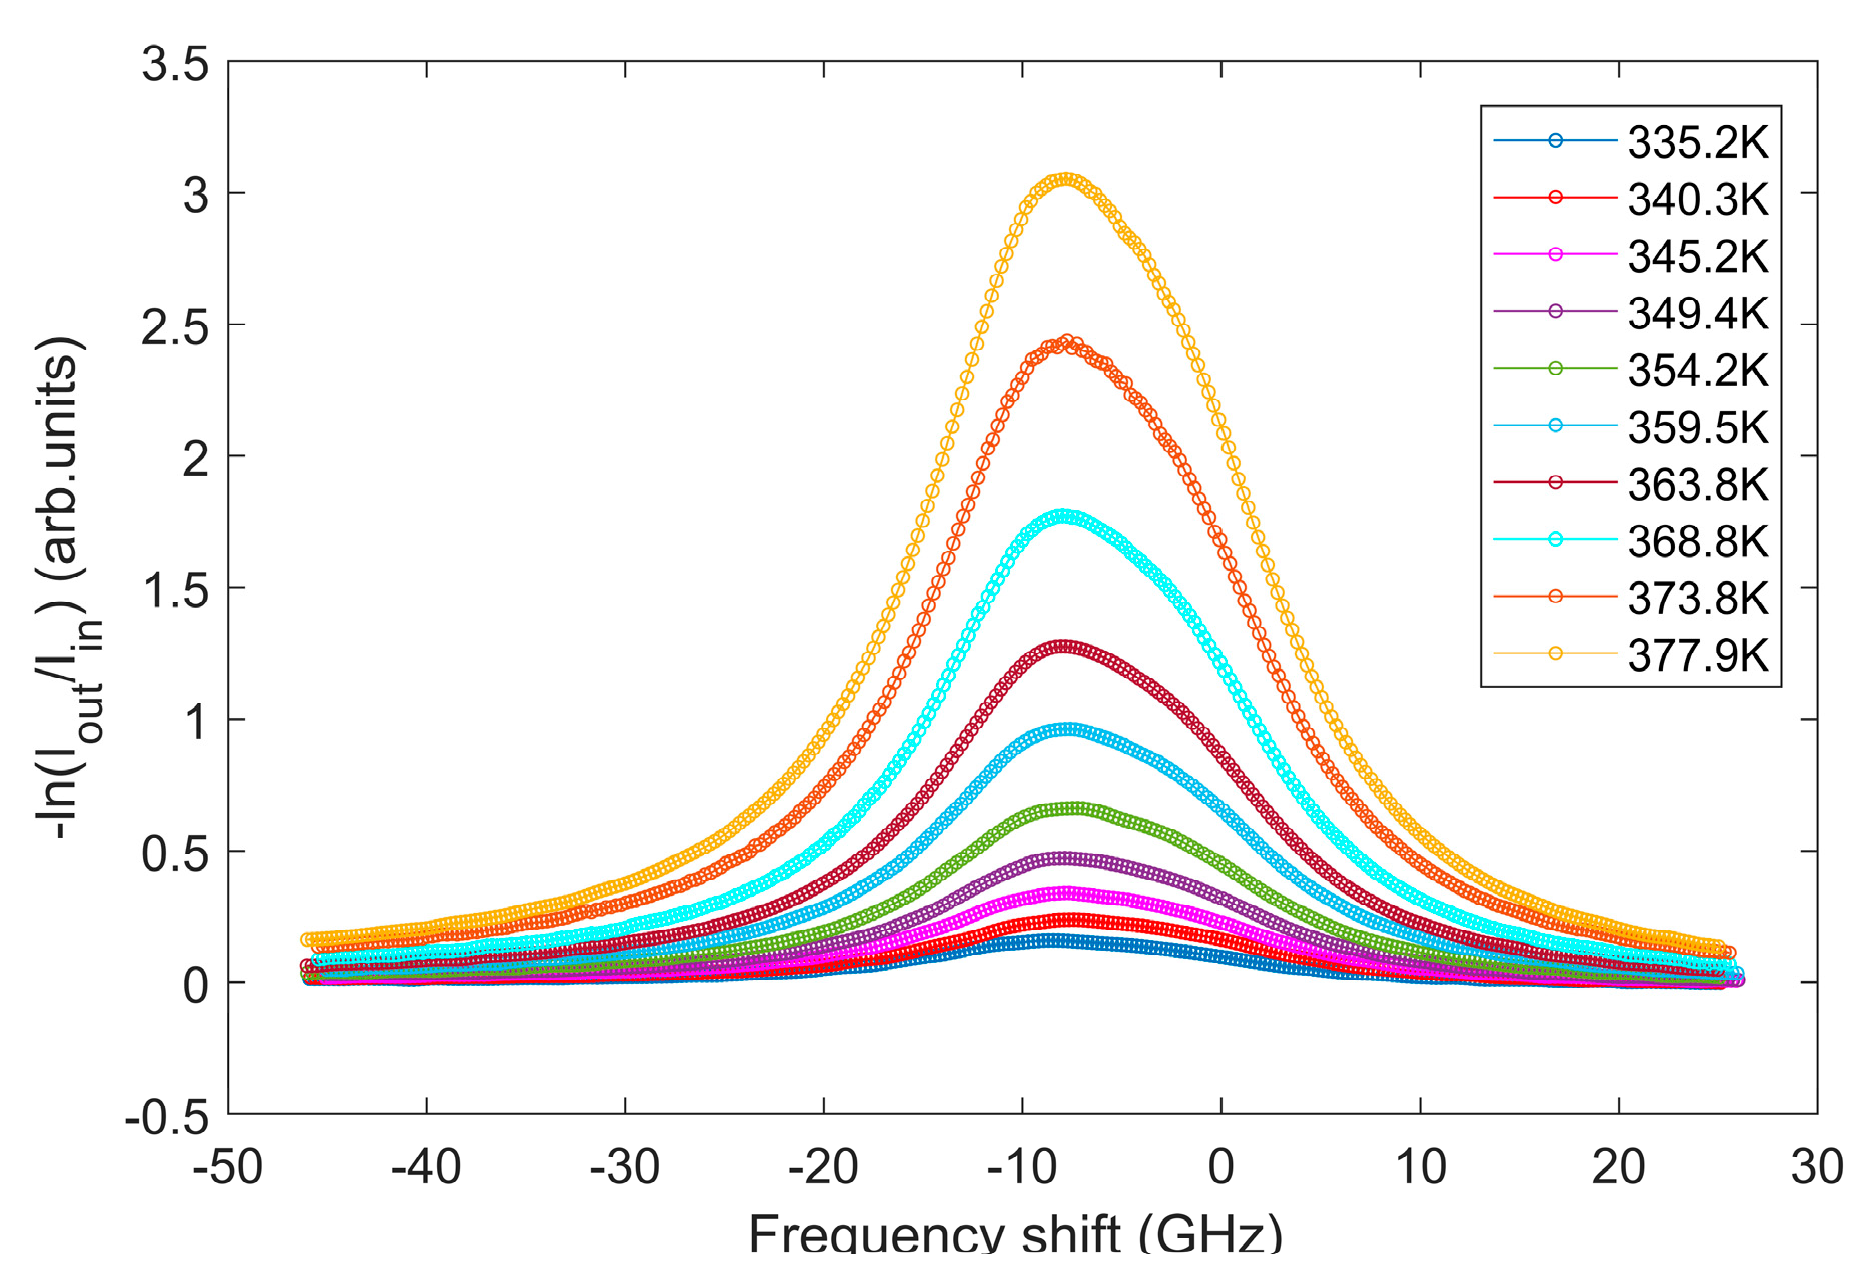
4. Results and Discussion
5. Conclusions
Author Contributions
Funding
Institutional Review Board Statement
Informed Consent Statement
Data Availability Statement
Conflicts of Interest
References
- Tang, J.; Liu, Y.; Wang, Y.; Zhou, B.; Han, B.; Zhai, Y.; Liu, G. Enhancement of bandwidth in spin-exchange relaxation-free (SERF) magnetometers with amplitude-modulated light. Appl. Phys. Lett. 2022, 120, 084001. [Google Scholar] [CrossRef]
- Yan, Y.; Lu, J.; Zhou, B.; Wang, K.; Liu, Z.; Li, X.; Wang, W.; Liu, G. Analysis and correction of the crosstalk effect in a three-axis SERF atomic magnetometer. Photonics 2022, 9, 654. [Google Scholar] [CrossRef]
- Lu, F.; Wang, S.; Xu, N.; Li, B.; Lu, J.; Han, B. Analysis and suppression of the cross-axis coupling effect for dual-beam serf atomic magnetometer. Photonics 2022, 9, 792. [Google Scholar] [CrossRef]
- Zou, S.; Morin, D.J.; Weaver, C.; Armanfard, Z.; Muschell, J.; Nahlawi, A.I.; Saam, B. Collisional electron paramagnetic resonance frequency shifts in Cs-Rb-Xe mixtures. Phys. Rev. A 2022, 106, 012801. [Google Scholar] [CrossRef]
- Gentile, T.R.; Nacher, P.J.; Saam, B.; Walker, T.G. Optically polarized 3He. Rev. Mod. Mod. Phys. 2017, 89, 045004. [Google Scholar] [CrossRef] [PubMed] [Green Version]
- Driehuys, B.; Cates, G.D.; Miron, E.; Sauer, K.; Walter, D.K.; Happer, W. High-volume production of laser-polarized 129Xe. Appl. Phys. Lett. 1996, 69, 1668. [Google Scholar] [CrossRef]
- Ruset, I.C.; Ketel, S.; Hersman, F.W. Optical Pumping System Design for Large Production of Hyperpolarized 129Xe. Phys. Rev. Lett. 2006, 96, 053002. [Google Scholar] [CrossRef]
- Norquay, G.; Collier, G.J.; Rao, M.; Stewart, N.J.; Wild, J.M. 129Xe-Rb Spin-Exchange Optical Pumping with High Photon Efficiency. Phys. Rev. Lett. 2018, 121, 153201. [Google Scholar] [CrossRef]
- Killian, T.J. Thermionic phenomena caused by vapors of rubidium and potassium. Phys. Rev. 1926, 27, 578–587. [Google Scholar] [CrossRef]
- Alcock, C.B.; Itkin, V.P.; Horrigan, M.K. Vapour pressure equations for the metallic elements: 298–2500 K. Can. Metall. Q. 1984, 23, 309–313. [Google Scholar] [CrossRef]
- Cohen, R.D.; Mullarkey, C.A.; Howell, J.C.; Katz, N. Polarization-independent atomic prism filter for removing amplified spontaneous emission. Appl. Opt. 2018, 57, 4472–4476. [Google Scholar] [CrossRef] [PubMed] [Green Version]
- Tang, Y.; Wen, Y.; Cai, L.; Zhao, K.F. Spin-noise spectrum of hot vapor atoms in an anti-relaxation-coated cell. Phys. Rev. A 2020, 101, 013821. [Google Scholar] [CrossRef]
- Kawano, H. Effective Work Functions of the Elements: Database, Most probable value, Previously recommended value, Polycrystalline thermionic contrast, Change at critical temperature, Anisotropic dependence sequence, Particle size dependence. Prog. Surf. Sci. 2021, 97, 100583. [Google Scholar]
- Kelley, M.; Burant, A.; Branca, R.T. Resolving the discrepancy between theoretical and experimental polarization of hyperpolarized 129Xe using numerical simulations and in situ optical spectroscopy. J. Appl. Phys. 2020, 128, 144901. [Google Scholar] [CrossRef]
- Seltzer, S.J. Developments in Alkali-Metal Atomic Magnetometry. Ph.D. Thesis, Dept. Physics, Princeton University, Princeton, NJ, USA, 2008. [Google Scholar]
- Smullin, S.J.; Savukov, I.M.; Vasilakis, G.; Ghosh, R.K.; Romalis, M.V. Low-Noise High-Density Alkali Metal Scalar Magnetometer. Phys. Rev. A 2009, 80, 033420. [Google Scholar] [CrossRef] [Green Version]
- Schrank, G. Characterization of a low-pressure high-capacity 129Xe flow-through polarizer. Phys. Rev. A 2002, 80, 063424. [Google Scholar] [CrossRef] [Green Version]
- Jau, Y.Y.; Kuzma, N.N.; Happer, W. High-field measurement of the 129Xe-Rb spin-exchange rate due to binary collisions. Phys. Rev. A 2002, 66, 052710. [Google Scholar] [CrossRef]
- Chann, B.; Babcock, E.; Anderson, L.W.; Walker, T.G. Measurements of 3He spin-exchange rates. Phys. Rev. A 2002, 66, 032703. [Google Scholar] [CrossRef]
- Savukov, I.M.; Romalis, M.V. Effects of spin-exchange collisions in a high-density alkali-metal vapor in low magnetic fields. Phys. Rev. A 2005, 71, 023405. [Google Scholar] [CrossRef] [Green Version]
- Lu, J.X.; Wang, J.; Yang, K.; Zhao, J.P.; Quan, W.; Han, B.C.; Ding, M. In-Situ Measurement of Electrical-Heating-Induced Magnetic Field for an Atomic Magnetometer. Sensors 2020, 20, 1826. [Google Scholar] [CrossRef] [Green Version]
- Nikolaou, P.; Coffey, A.M.; Ranta, K.; Walkup, L.L.; Gust, B.M.; Barlow, M.J.; Rosen, M.S.; Goodson, B.M.; Chekmenev, E.Y. Multidimensional Mapping of Spin-Exchange Optical Pumping in Clinical-Scale Batch-Mode 129Xe Hyperpolarizers. J. Phys. Chem. B 2014, 118, 4809–4816. [Google Scholar] [CrossRef] [PubMed]
- Kornack, T.W. A Test of CPT and Lorentz Symmetry Using a K-3He Co-Magnetometer. Ph.D. Thesis, Dept. Physics, Princeton University, Princeton, NJ, USA, 2005. [Google Scholar]
- Walkup, R.; Stewart, B.; Pritchard, D.E. Collisional line broadening due to van der Waals potentials. Phys. Rev. A 1984, 29, 169. [Google Scholar] [CrossRef]
- Helmi, M.S.; Roston, G.D. Power-law dependence of pressure broadening of spectral lines on temperature. AIP Conf. Proc. 2001, 559, 347–350. [Google Scholar]


| Transition | |
|---|---|
| Fg = 1→Fe = 1 | 1/16 |
| Fg = 1→Fe = 2 | 5/16 |
| Fg = 2→Fe = 1 | 5/16 |
| Fg = 2→Fe = 2 | 5/16 |
| 87Rb D1 Width | 0.43 (±0.17) | 0.11 (±0.11) |
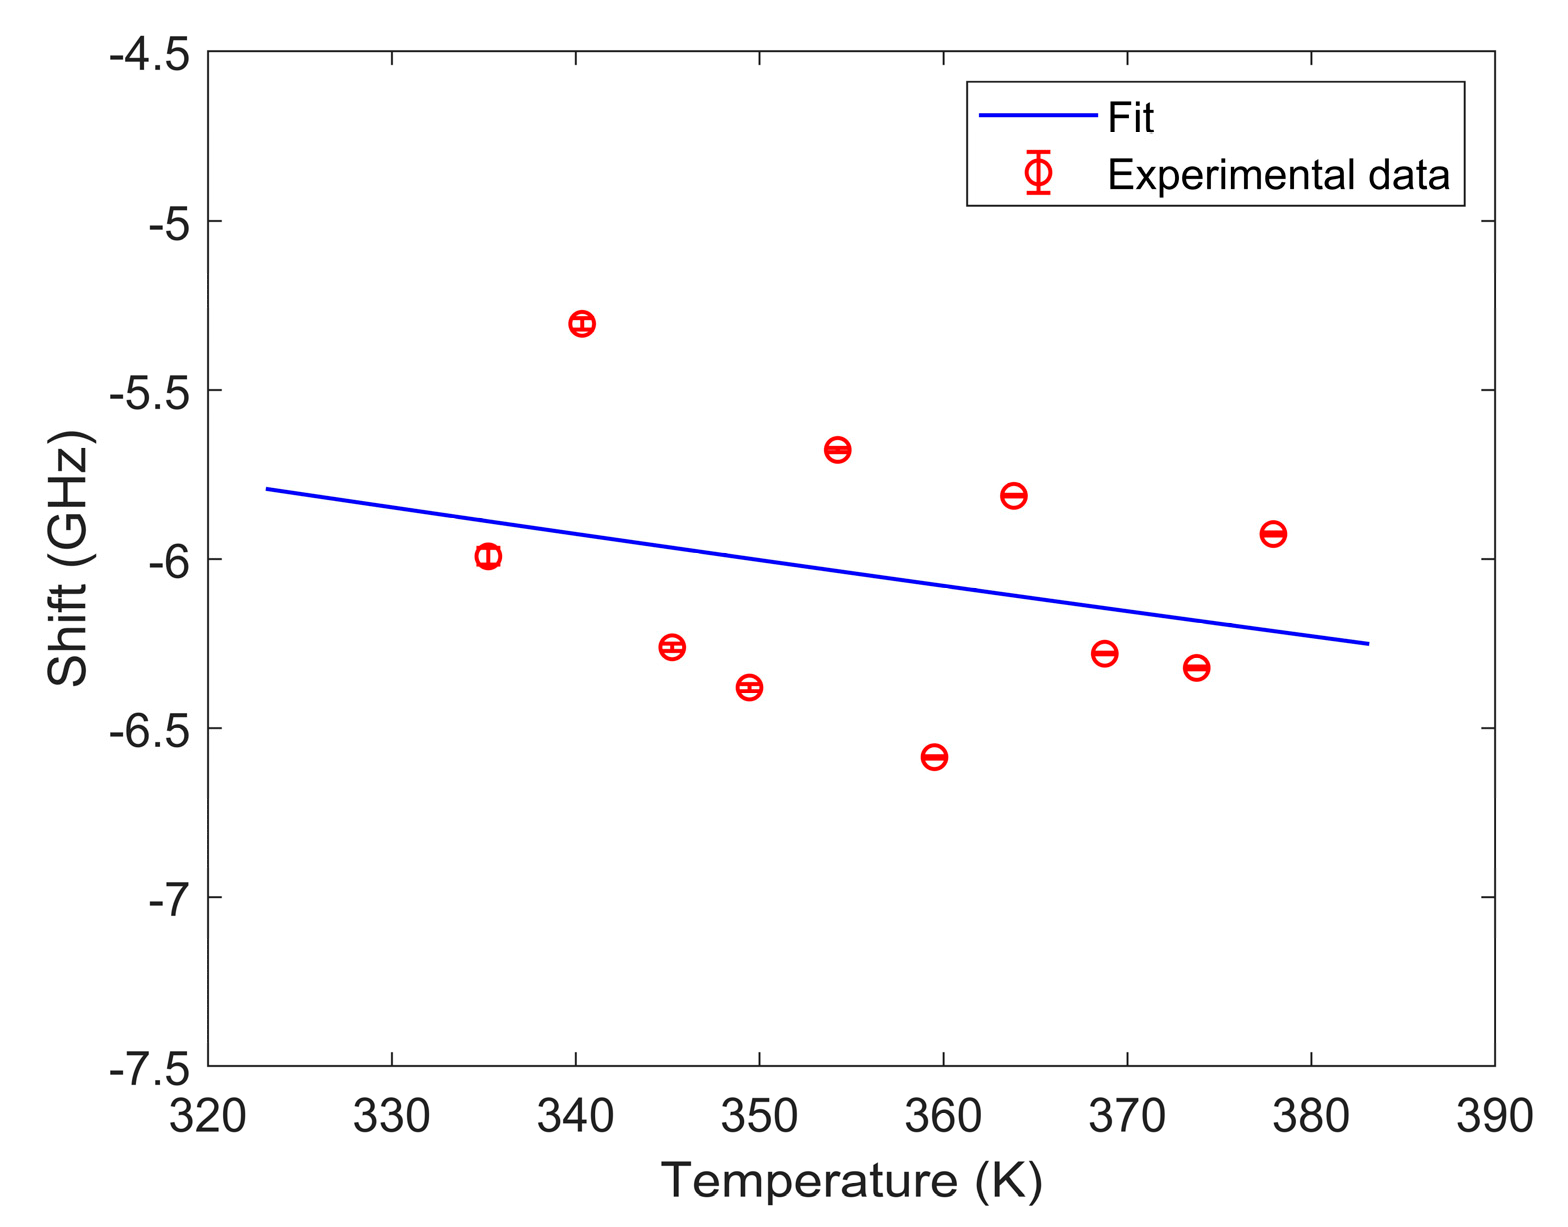
| 87Rb D1 Shift | 0.44 (±1.22) | 0.13 (±0.38) |
Disclaimer/Publisher’s Note: The statements, opinions and data contained in all publications are solely those of the individual author(s) and contributor(s) and not of MDPI and/or the editor(s). MDPI and/or the editor(s) disclaim responsibility for any injury to people or property resulting from any ideas, methods, instructions or products referred to in the content. |
© 2023 by the authors. Licensee MDPI, Basel, Switzerland. This article is an open access article distributed under the terms and conditions of the Creative Commons Attribution (CC BY) license (https://creativecommons.org/licenses/by/4.0/).
Share and Cite
Shang, H.; Zou, S.; Quan, W.; Zhou, B.; Li, S.; Zhou, W.; Zhao, F. Design of a Measuring Device and Experimental Study into the Relationship between Temperature and the Density of Alkali Metal-Vapor. Photonics 2023, 10, 112. https://doi.org/10.3390/photonics10020112
Shang H, Zou S, Quan W, Zhou B, Li S, Zhou W, Zhao F. Design of a Measuring Device and Experimental Study into the Relationship between Temperature and the Density of Alkali Metal-Vapor. Photonics. 2023; 10(2):112. https://doi.org/10.3390/photonics10020112
Chicago/Turabian StyleShang, Huining, Sheng Zou, Wei Quan, Binquan Zhou, Shun Li, Weiyong Zhou, and Fengwen Zhao. 2023. "Design of a Measuring Device and Experimental Study into the Relationship between Temperature and the Density of Alkali Metal-Vapor" Photonics 10, no. 2: 112. https://doi.org/10.3390/photonics10020112