1. Introduction
Most aquatic life depends on dissolved oxygen (DO) availability in the water that diffuses across the air–water interface. Even in the current context of global warming, which imposes the study of the gases that cause it, special attention should be paid to oxygen transfer. The amount of DO in water bodies is a primary indicator of water quality [
1]. Oxygen loss is one of the most important changes occurring in an ocean, increasingly modified by human activities that have raised temperatures, CO
2 levels, and nutrient inputs and have altered the abundances and distributions of marine species [
2]. It is important to know the DO variation in the water column to identify the factors that influence it. In estuaries and other coastal systems strongly influenced by their watershed, oxygen declines have been caused by increased loadings of nutrients (nitrogen and phosphorus) and organic matter. Those inputs are primarily from agriculture, sewage, and the combustion of fossil fuels [
2]. Globally, the number and size of anoxic and hypoxic areas, regions with low or null concentrations of DO, have grown dramatically in recent years [
3]. Although very high nutrient inputs and intense eutrophication are required to drive a weakly stratified ecosystem to hypoxia or anoxia, even moderate increases in nutrient inputs and eutrophication can lead to these conditions in a strongly stratified water body [
4].
The presence of DO in water can be measured in two different ways. It can be expressed as the amount of oxygen in a given volume of water or as the solubility of oxygen. The solubility of oxygen ranges from 14.6 mg/L at 0 °C to approximately 7 mg/L at 35 °C under a pressure of 760 mmHg in fresh water [
5]. In other words, oxygen is susceptible to variations in temperature, atmospheric pressure, and the content of salts or other substances in the water. Some authors [
6] have proposed an indicator to assess the state of a river in terms of its deviations in the DO. Concentrations below 1.0–1.5 mg/L for a few hours can kill warm-water animals. Cold-water species require 2–3 mg/L more DO than warm-water species [
7]. Loss of oxygen from the ocean (deoxygenation) can thus trigger major unforeseen changes in the structure and function of the midwater ecosystem [
8].
The lack of marine environmental data compared with onshore environments is mainly caused by the high cost of probes, instruments, and installation. Without the data, there is no control over the impact of measures on the conservation and regeneration of native fishery resources or the delimitation of comprehensive protection areas. Therefore, defining the authorized activities in these reserve networks is impossible. The proposal of low-cost optical sensors for analyzing indicators such as DO in water can contribute to the environmental monitoring and evaluation of coastal and marine areas. The use of physical sensors is not only a low-cost option but also a non-destructive methodology that can operate if the environment does not damage the system. This is a risk shared by all detection methods in the aquatic environment. In addition, a low-maintenance system can be used in remote areas that are difficult to access.
The spectral signature is a concept mainly used in remote sensing but with a high application in spectroscopy. The spectral signature is the unique pattern or combination of peaks and troughs in a spectrum produced by a substance when it interacts with different radiation. On the one hand, spectral signatures are used in remote sensing to differentiate surfaces with different characteristics, such as urban areas, industrial areas, crops, and natural areas. Nevertheless, some studies are focused on identifying more specific compounds. Thus, it has been possible to identify different chemical substances from satellite images, such as chlorophylls [
9] and hazardous chemicals [
10]. Based on the current development of hyperspectral cameras, this topic will become more important in the following years. On the other hand, data obtained from Raman spectroscopy and spectroradiometer are being collected in databases to characterize different compounds, such as Paracetamol [
11], or different polymers [
12]. Nonetheless, as far as we are concerned, no study has focused on the application of spectra analyses to quantify the presence of DO in water samples. Thus, we propose to analyze the potential of spectral signatures for the quantification of DO in different types of water samples.
In this paper, we will perform DO detection using the spectrophotometric technique for different DO saturation levels and for different water matrixes. As a dissolved gas present in the water, DO is colorless to the naked eye, except using a chemical agent. We decided not to use visible wavelengths (between 380 and 750 nm) for the study because the dissolved oxygen molecule is a gas and is not visible within the visible light spectrum. Furthermore, according to previous studies and bibliographies already cited here, we excluded the infrared wavelengths (750 to 1100 nm) and chose to study in the ultraviolet range (190 to 380 nm). The main novelty of this paper is the measurement of the DO absorption spectrum in the UV range. The use of the UV spectrum to determine DO concentrations eliminates the main limiting factors that other methodologies have: interference in the visible spectrum due to visible compounds present in water, as it depends on the properties of light; and the need for physical contact of the sensor with the samples in cases of methodologies with chemical principles. Most of the absorption spectrum presented in the biography is for atoms instead of molecules. The existing commercial sensors for DO monitoring are based on membranes and phosphorescence quenching, using visible light [
13]. In addition, studies like this are fundamental for the development of new technologies for mobile networks for monitoring coastal and oceanic waters.
2. Related Work
In this section, we detail the state-of-the-art in the different areas covered in the introduction. First, we summarize the current proposals for DO monitoring systems. Finally, the ongoing uses of spectrophotometry are outlined.
Previous studies have proposed different methodologies to analyze oxygen levels in the water. In [
14], they proposed a system consisting of a submersible ceramic vessel containing a soil-based anodic chamber. Based on the study, the calibration model obtained with a two-factorial design of temperature experiments and DO can be used to successfully predict the DO value of an unknown water sample. The authors in [
15] developed a microbial biosensor for the in situ, continuous, and online monitoring of DO. They monitored concentrations along several depths of lake water. Meanwhile, in [
16], a submersible microbial fuel cell proved to be effective with an external resistance of 1000 Ω to determine DO-level monitoring in various environmental waters. Another option is the use of remote sensing, as proposed in [
17], to monitor DO levels, using numerical simulation algorithms of DO concentrations, using the TELEMAC-WAQTEL-O2 model. In addition to these works mentioned, in [
18], they proposed a cost-effective, accessible, and sustainable system for measuring the DO levels present in bodies of water based on a sensor for oxygen saturation in human blood.
The literature shows the determination of DO levels using combined methods. For example, the authors in [
19] concluded that DO sensor technology will become the focus of future research and mainstream development. The smart DO sensor can intelligently process signals by using analogue and digital signal processing technologies and performing real-time dynamic compensation and correction for the temperature, pressure, salinity, and other interference factors, thereby greatly reducing the manual operation and management cost and directly or indirectly reducing human errors [
19]. Nevertheless, there are currently not many studies on the spectral signature of DO in water due to several factors that influence oxygen availability, such as temperature, salinity, pH, and organic matter. DO concentrations were summarized and analyzed as the crucial drivers of hypoxia in Northwestern and Southern Hong Kong and Mirs Bay over the past three decades [
20].
Previous studies have already developed methodologies with spectrophotometry to determine the DO in water. For example, in [
21], the authors used ultraviolet spectrophotometry to determine the DO in marine and estuarine water by the Winkler method. They reached a
p-value < 0.05 as a result, as well as a true correlation between the A and B variables, with r > 0.98. Furthermore, the authors of [
22] used this same spectrophotometric variant of the Winkler method in fresh water, using the ultraviolet range. The results presented demonstrated the ease of applying ultraviolet spectrophotometry to analyze DO via the Winkler method in natural waters within a wide salt range [
21]. A previous work [
23] presented the groundwork for the implementation of a monitoring system of DO levels that uses a Light-Emitting Diode (LED) and Light-Dependent Resistance (LDR). To analyze different levels of DO, they used sodium sulfite as a cheap option with fast oxidation [
23]. Furthermore, in [
24], a low-cost system was studied for data gathering in coastal waters, using Wireless System Networks to monitor water exchange, which is very useful for quality monitoring.
Using spectrophotometry, the authors of [
25] concluded that their method is simple, rapid, sensitive, precise, and useful for the determination of DO in RW samples. The water sample was fixed for DO via Winkler’s procedure and was directly used for the spectrophotometric measurements by the proposed method. The wavelength used in this case was 644 nm because the liberated iodine bleaches the violet color of azure B (which is measured at 644 nm). Thus, it was concluded that the amount of I2 released is equivalent to the oxygen dissolved in the water. In other studies, different optical techniques are used to determine DO, such as a polydimethylsiloxane membrane coated with a platinum octaethylporphyrin and a multilayer optical–fluidic sensor for in situ measurement [
26,
27]. In addition, several authors have developed mechanisms to monitor DO in water as an indicator of the quality and health of aquatic ecosystems [
28,
29,
30].
As mentioned above, no papers are focused on the analysis of the spectral signatures for the determination of the DO concentration in water samples. The existing sensors are mainly based on technologies with high requirements for maintenance of the use of reagents.
3. Materials and Methods
This section describes the samples, the equipment used to reach the results, and how the samples were prepared to find saturation levels of DO.
3.1. Samples Collection
For the tests, nitrogen gas was used, and three types of water were prepared for analysis in the spectrophotometer: UW, DW, and RW. We use different samples to go from an ultrapure sample to real samples in which other compounds can act as interferents and affect the measurements. The use of different water matrices in the study is important to ensure that the DO measurement is reliable; in this case, the absorbance signals derive mainly from the DO concentrations and not from possible compounds present in the samples. We selected a wide variety of samples. The included samples include pure water samples and water samples with a modified matrix, such as tap water with a content of residual-free chlorine: 1 mg/L and no presence of pollutants and a natural water sample.
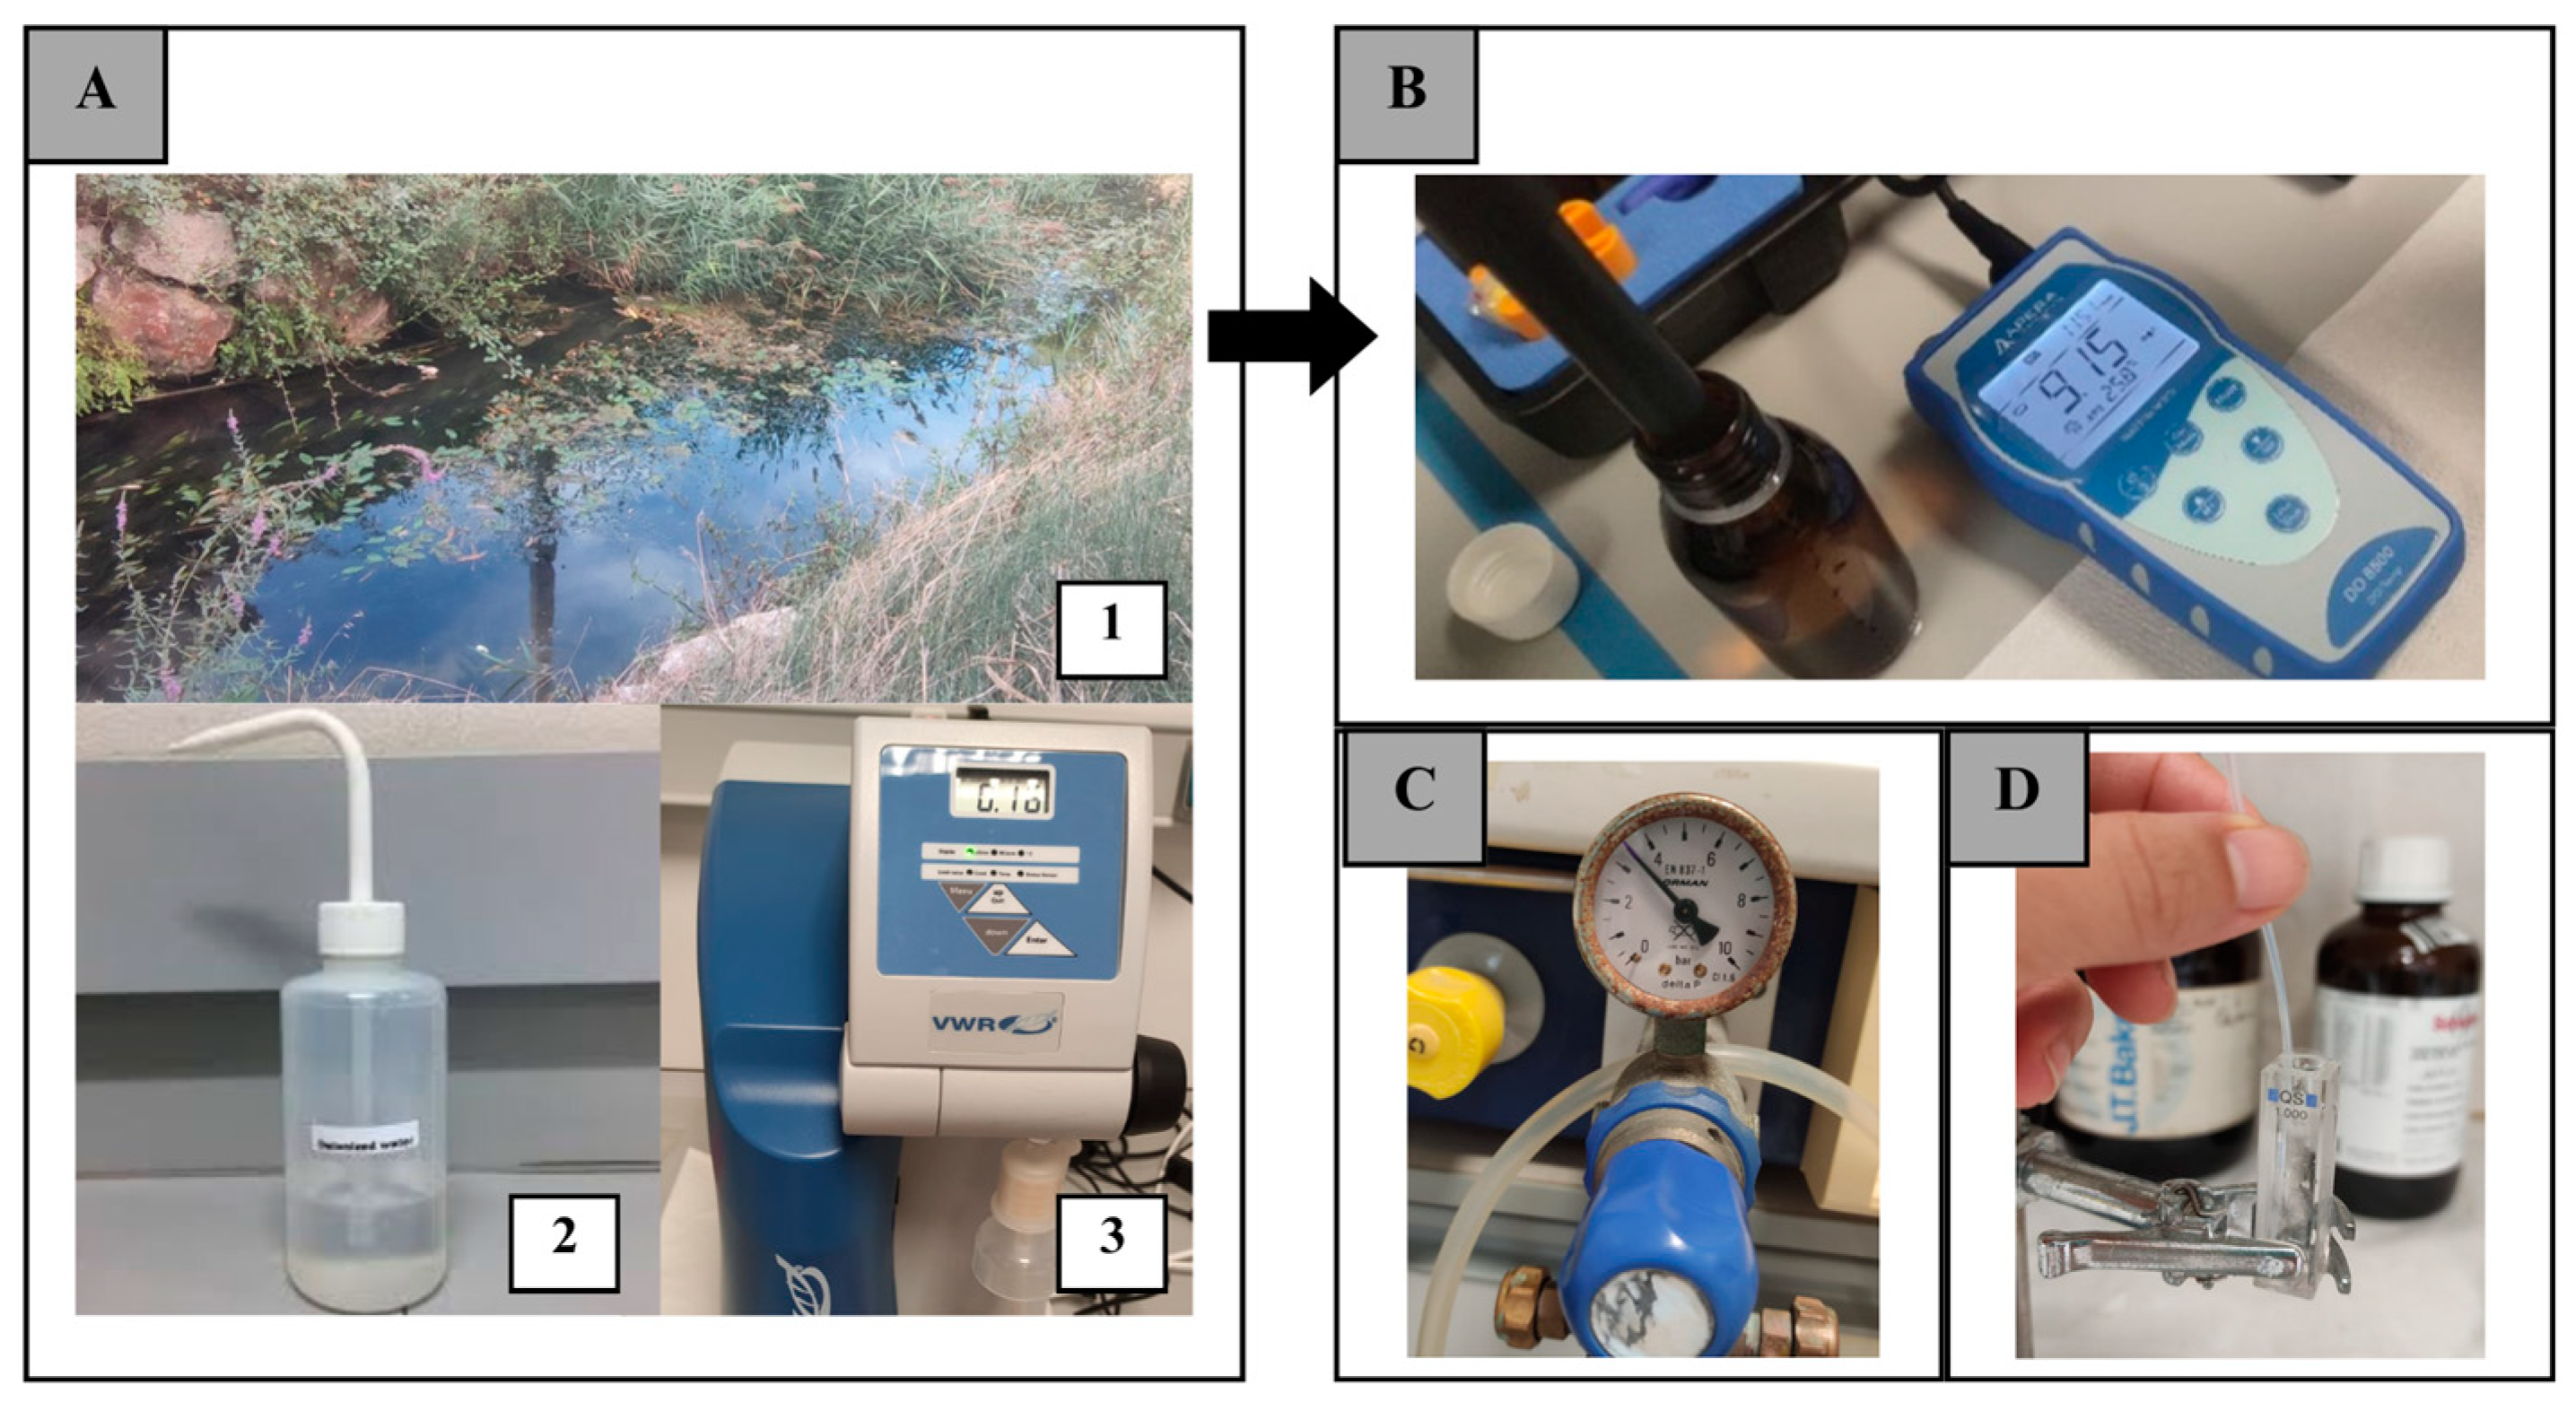
The UW samples have the highest degree of purity due to the Barnstead Smart2Pure [
31] purification system for laboratory applications (see
Figure 1A3). They have the highest degree of reliability regarding interference by other organic or inorganic substances and undergo the deionization process. The necessary volume of UW water is generated every time that a sample is needed. The volume of each sample is 3 mL. In addition to it, with a slightly lower degree of purity but with a filtration and distillation process, we used distilled water for DW samples (
Figure 1A2). The total volume of DW necessary to conduct the experiments was collected at the beginning of the experiment and stored in a 500 mL plastic squeeze bottle dispenser.
Finally, as an approach to real samples of natural water, such as river, coastal, and oceanic waters, we used a sample of water from a river close to the worksite (see
Figure 1A1). The sample was collected at the moment of being used in an opaque laboratory glass bottle of 200 mL.
3.2. Samples Preparation
Before the preparation of the samples, around 150 pretests were carried out to find the ideal saturation levels to build a DO gradient. The tests analyzed time and gas flow to estimate different DO concentrations. In the end, the five ideal concentration levels were established based on the time and flow of nitrogen gas inserted into the sample.
The accuracy test of the methodology was carried out using the DO8500 Portable Optical DO instrument [
32] on the 5 replicates of each pre-sample. In each replica, we applied the same time and the same amount of gas to verify whether the DO concentration values were equal.
Table 1 establishes the samples, along with the concentrations.
In the preparation of the samples, we chose to create a gradient of oxygen levels to analyze the behavior between the wavelengths. All samples were aerated, mixing for 1 min to raise the saturation to 100%. The samples were brought to saturation at five levels of DO. For the DO saturations, the DO8500 Portable Optical DO [
32] was used to verify that the samples achieved all five levels (3% (blank), 25%, 50%, 75%, and 100%; see
Figure 1B).
Nitrogen gas in samples to remove oxygen is possible because nitrogen physically displaces oxygen from the sample by bubbling. In other words, it is the reverse methodology to bubble oxygen, using the aerator to obtain 100% oxygen saturation in the samples. Before measurements, DW was used to verify the efficacy of bubbling nitrogen to eliminate the DO present in water. A total of 49 measurements were taken, and the DO and temperature levels were quantified at the beginning and the end of each nitrogen gas introduction. The time and amount of nitrogen chosen were variable until stable and reproducible levels were established for posterior testing.
The amounts of nitrogen introduced into the samples were controlled by the inlet flow (bars) of the gas (
Figure 1C) and by its residence time (seconds) inside the sample (
Figure 1D). The cuvette, which was used in the spectrophotometers containing 3 mL of water, was used as a container for the sample. A capillary tube with constant outlet pressure was used. The time was measured with a timer.
3.3. Measuring Equipment
The spectrophotometer (LLG-uniSPEC 2 [
33]) was used for measurements. The spectrophotometer used can perform readings in ultraviolet, visible light, and infrared wavelengths (from 190 to 1100 nm). Among some features, it has a single beam system grid with 1200 lines/mm, silicon photodiode detector, 4 position cell holder (10 mm), deuterium and tungsten lamps, and automatic wavelength adjustment. Each measurement was taken in real time and saved in an Excel sheet. Three values were taken from each sample to avoid variation from reading errors. The measuring range chosen goes from 190 nm to 380 nm, using the basic operation mode of the spectrophotometer.
3.4. Performed Analysis
To perform all the measures, we chose a range that goes from 190 nm to 380 nm, taking measurements 5 nm by 5 nm for the UW, DW, and RW samples.
Figure 2 shows the data collection scheme of samples analyzed with the spectrophotometer. From each type of water (UW, DW, and RW) we took 5 samples and analyzed them three times for each DO saturation level. That means that we analyzed 15 samples, considering 3 blanks for each water matrix. In total, we studied the samples 471 times, covering all wavelengths. All samples were prepared according to the properties and wavelengths shown in
Table 1. Changes in temperature and atmospheric pressure influence the DO concentration. In fresh water, DO reaches 14.6 mg/L at 0 °C and approximately 9.1, 8.3, and 7.0 mg/L at 20, 25, and 35 °C, respectively, and 1 atm pressure. At temperatures of 20 and 30 °C, the level of saturated DO is 9.0–7.0 mg/L [
34]. The samples in this work were collected and handled with the aim of avoiding variation in DO due to external factors. The analyses were carried out in a closed environment, without temperature variation (at 22 °C), and in the pretests, the temperature of the sample was measured before and after aeration and remained constant (approximately 25 °C). After that, the reading was then read on the spectrophotometer, without shaking and with the cuvette sealed. Special attention was paid during the measuring procedure to avoid the introduction of oxygen in the samples, using parafilm to seal the cuvettes.
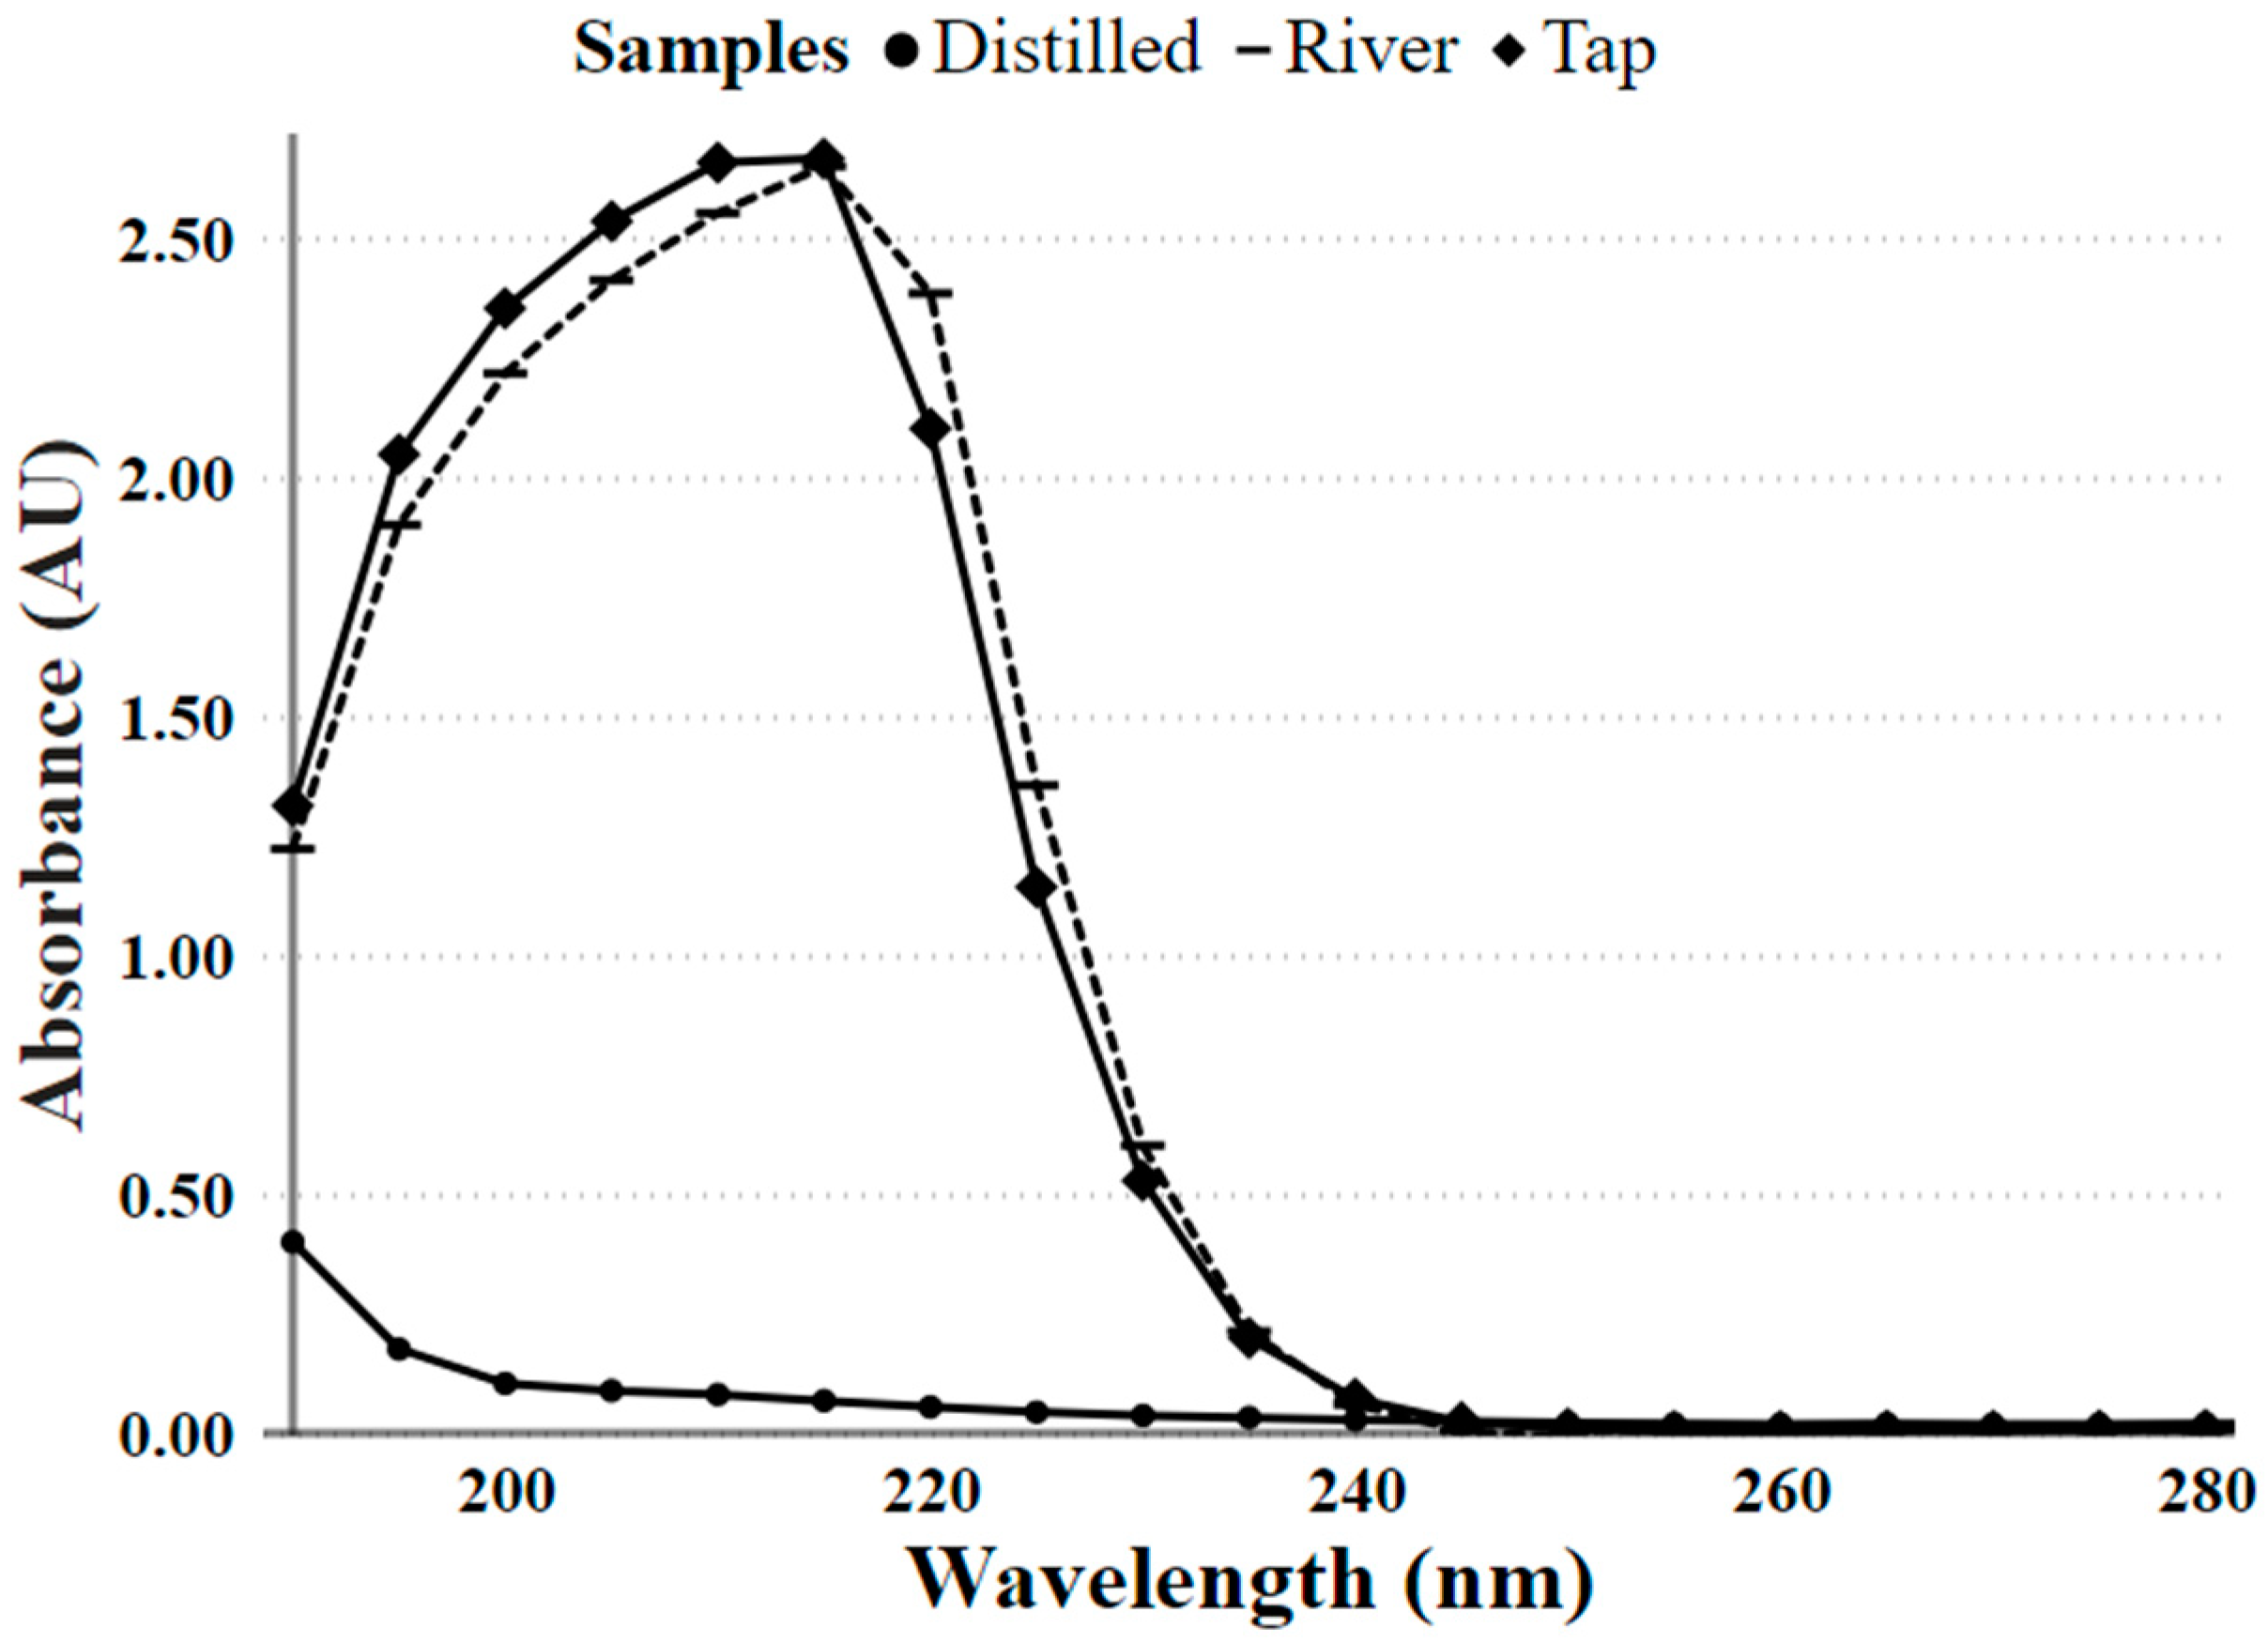
In addition, we used a sample of tap water (TW) to perform comparisons between the matrices used to identify differences in absorption without DO. For this, a sample of UW was used for the blank (with 3% of DO), and two other samples of DW and RW (with 3% of DO) were used. Thus, it is possible to see the absorption contrasts between the samples since, in this part of the spectrum, there are many compounds present in the water that absorb light. This informs us if it is possible to have a single calibrator (valid for any type of water matrix) or if we need a calibrator for each type of sample.
In the sampling structure, comparisons between matrices are made first. Then, each of them is measured in five different concentrations. With the results, we make a calibration for each sample, from the simplest UW to the most complex RW, so that we find out if it is possible to measure the DO concentration at a single wavelength.
4. Results
In this section, we present the obtained results from the laboratory analyses. First, we show the results for sample matrices, and then we show the results for UW, DW, and RW in the second, third, and fourth subsections, respectively.
4.1. Results of Water Matrix Samples
We can identify in
Figure 3 that the TW and RW samples present an expected behavior of near saturation of optical absorbance between the wavelengths 195 and 220 nm. Thus, to keep the experimental test bench simple, only RW is further used. This fact is due to the presence of volatile compounds and other substances present, such as organic matter, heavy metals, gases, etc. The sample used for the blank was the UW sample that does not contain substances causing optical interference. The absorbance levels of the DW sample are very low compared to those of RW and TW, with a maximum at the wavelength of 190 nm, with 0.40 AU. This result may have occurred because the distilled water came from a laboratory container with stagnant water without circulation, unlike the river and tap samples. The AU decay for the DW samples may just be a clipping of the DO concentration decay as the wavelength increases, as happens for the TW and RW samples after 220 nm. Therefore, with low DO concentrations in the sample, it is more difficult to detect the DO concentration through the absorbance signal.
The highest absorbance values are at the wavelength of 215 nm (2.67 AU for the TW sample and 2.65 AU for the RW). Note that saturations with high absorbance values show a peak up to 215 nm. From there, there is a notable decay reaching almost 0 AU at the wavelength of 245 nm (0.02 AU for TW and RW samples and 0.01 AU for DW). In addition, the differences between the matrices used are significantly large, so blanks of each analyzed matrix were used. In other words, for blanks (considering 3% of DO), we must use ultrapure for UW, distilled for DW, and river for RW. Considering that water turbidity has greater absorption at wavelengths of the visible spectrum, for our study (at wavelengths below 280 nm), we did not observe that turbidity did not cause interference in the samples, so much so that, as you can see in
Figure 3, the river water samples show a similar signature to tap samples below 280 nm. Nevertheless, the correction of the turbidity effect using NIR light will be implemented in the future.
4.2. Results of UW
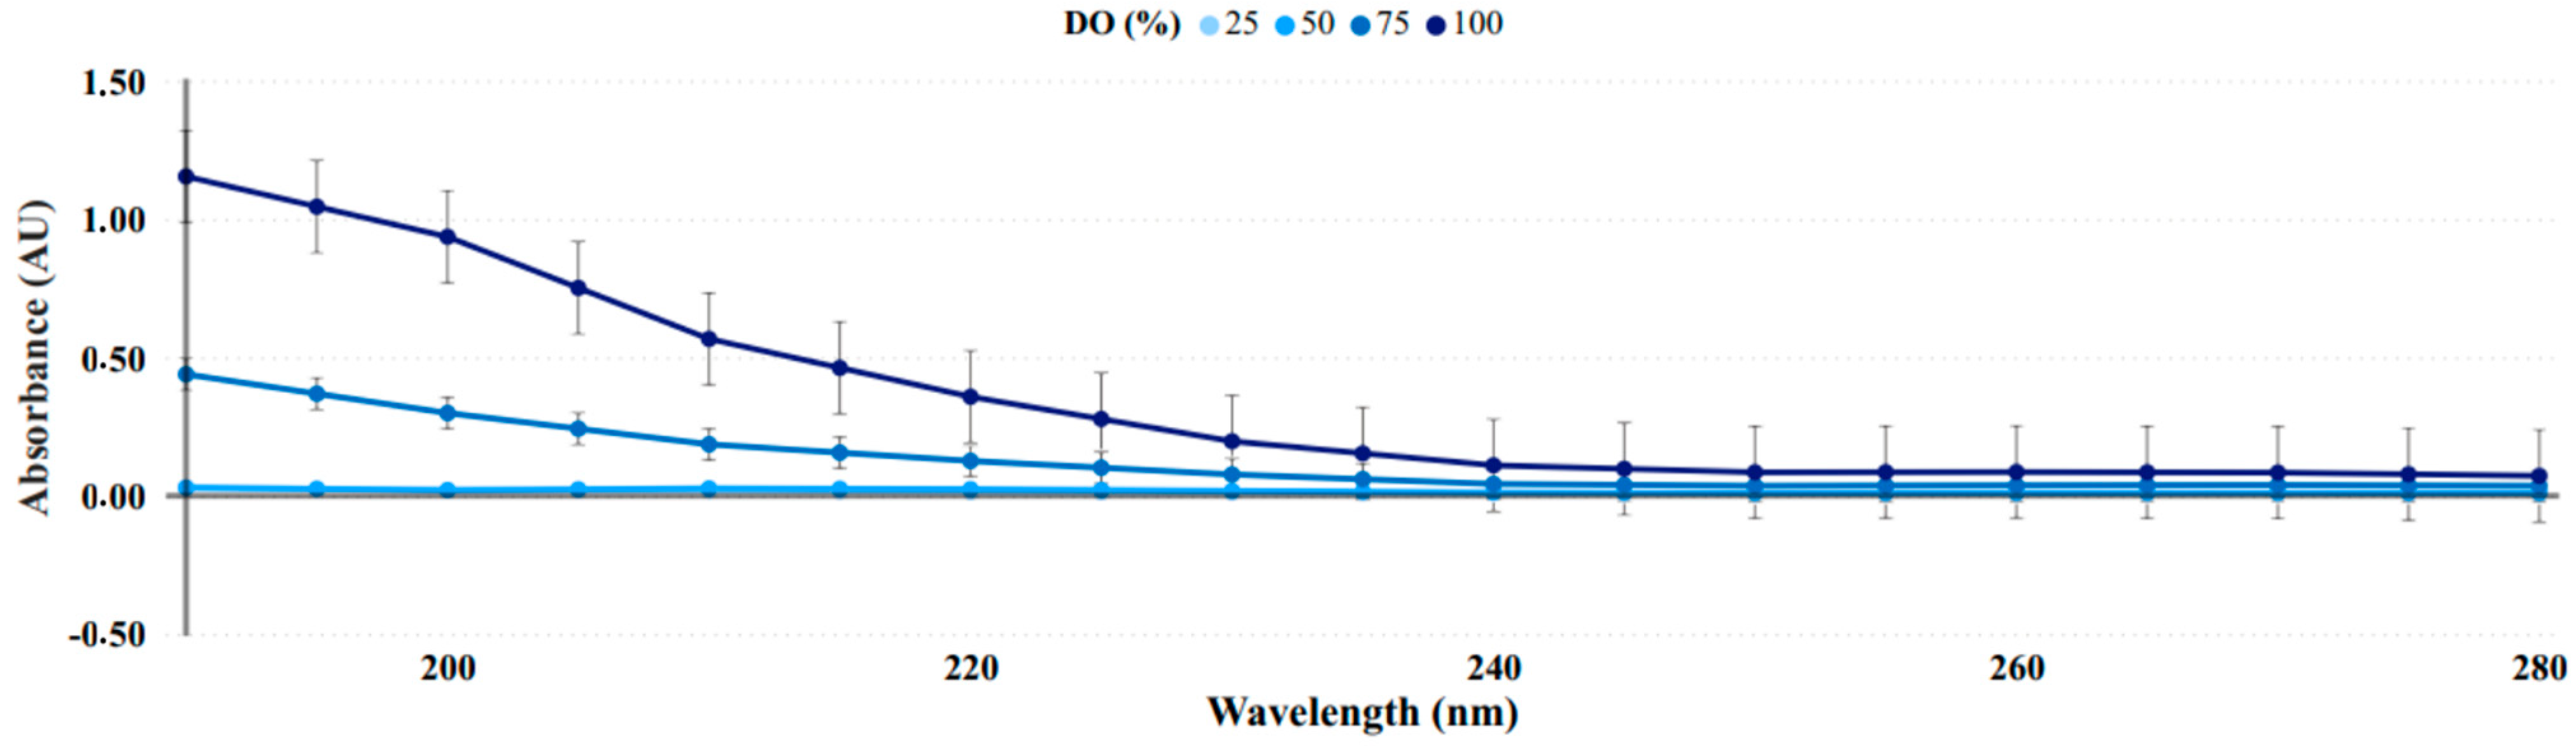
We show, in
Figure 4, the absorbance for the UW for the wavelengths from 190 to 280 nm. In addition, after verifying that there are no considerable variations after the 280 by 380 nm wavelength, we chose to present the graphic analysis up to 280 nm for better visualization. We can mainly differentiate two regions with different trends. Error bars were added based on the UW sample standard deviation. Considering 100% DO saturation, the standard deviation is 0.3637; for 75% saturation, the value is 0.1250; for 50% saturation, it is 0.0070; and for 25% DO saturation, the result is 0.0059.
There are notable differences in absorbance values between the analyzed samples in the first region, from 190 to 220 nm. As the percentage of DO saturation increases, the absorbance signal value increases. It is important to note that the values of 25 and 50% are overlapped (lighter color of blue). Moreover, in the second region, from 230 to 280 nm, the absorbance of the samples does not increase further as the wavelength increases, with the absorbance values tending toward 0 AU. Thus, just the first region can be used to estimate the samples’ DO saturation. From 200 to 220 nm, it can be used for this purpose and is safely detectable at wavelengths up to approximately 230 nm.
4.3. Results of DW
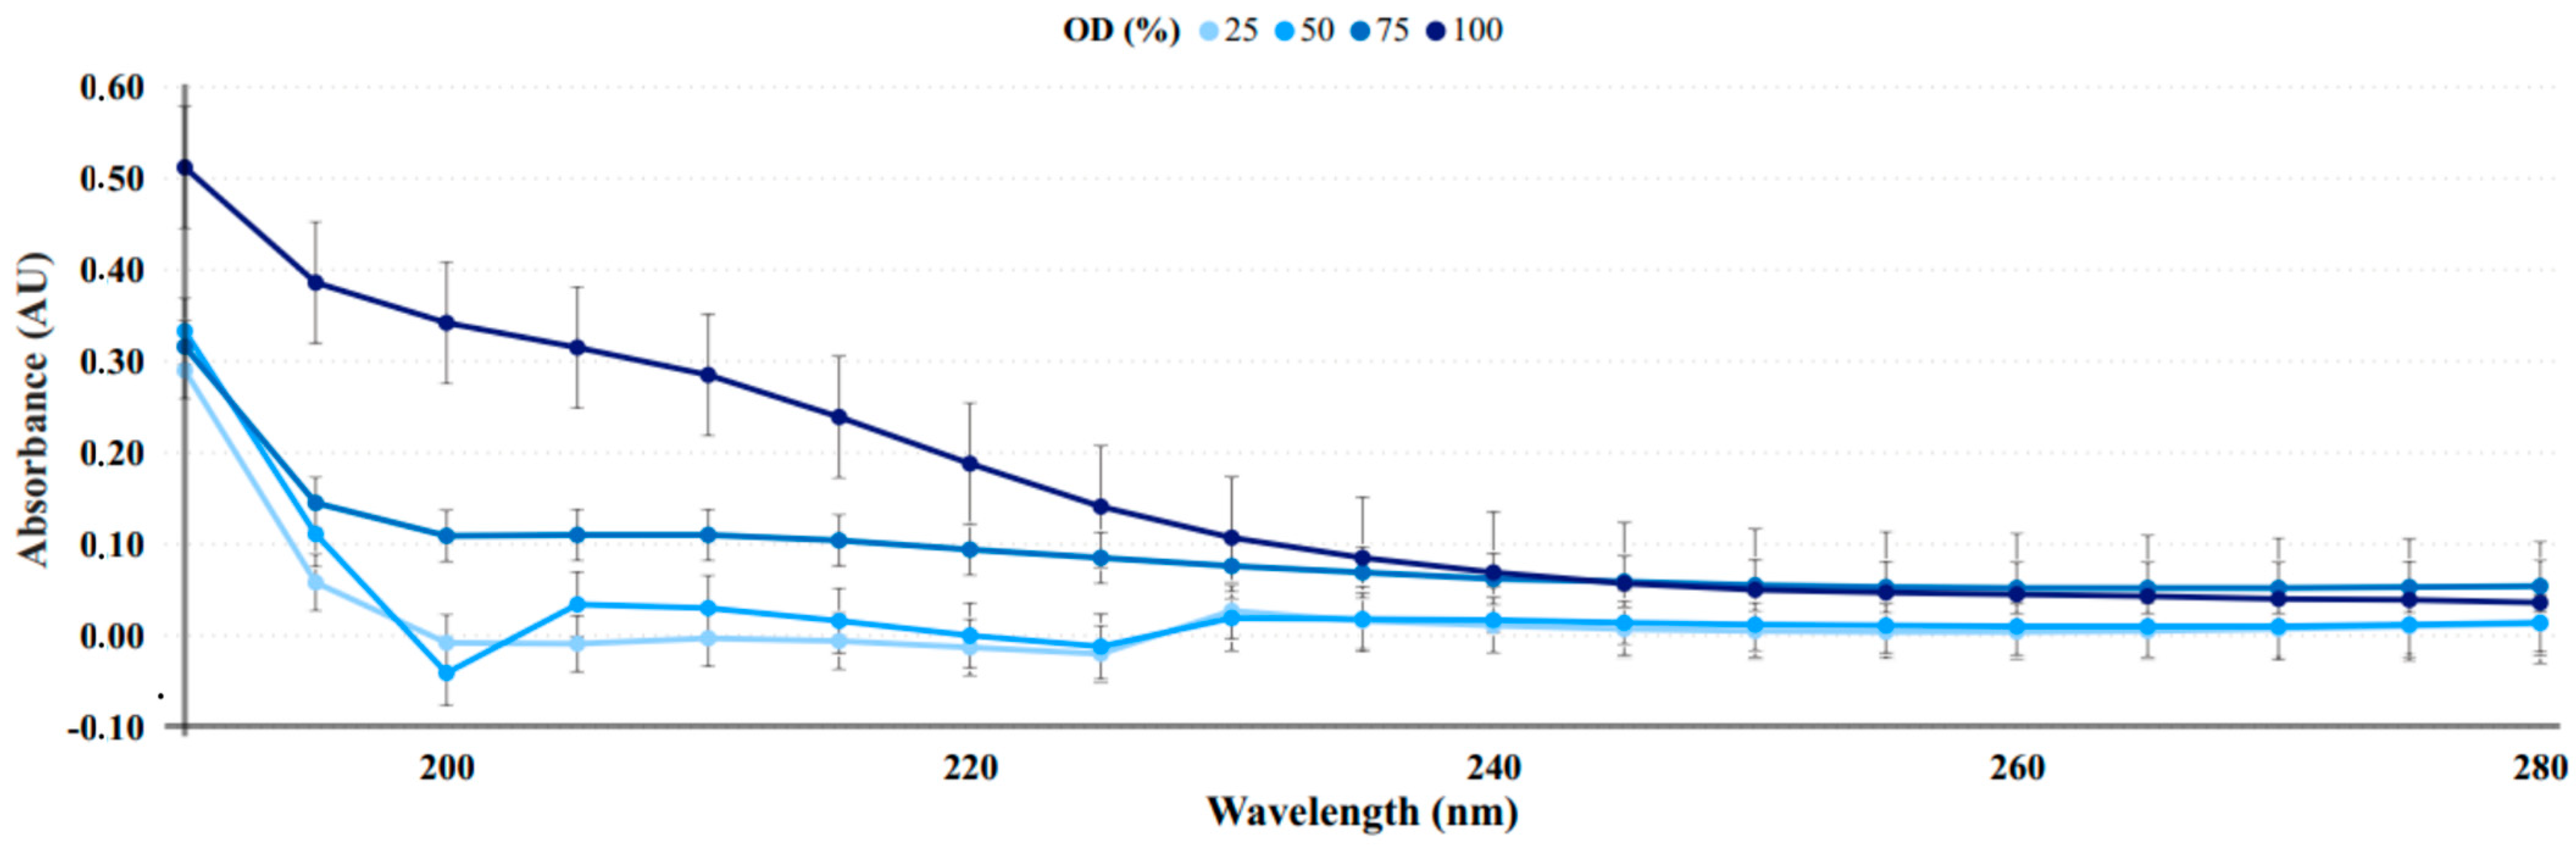
Figure 5 displays the absorbance for the wavelengths from 190 to 280 nm (UVC range) because, after that, until 380, all values become stable, without differences between all four saturations. As explained in
Section 3.4, a 3% DW sample was used for the blank for spectrophotometer calibration to maintain the most realistic comparisons.
Furthermore, between 190 to 220 nm, we can see that the samples follow a clear trend and absorbance increases as the saturation increases. Nonetheless, some values had negative values, a minimum of −0.04 AU (50% of DO). In general terms, the absorbances decrease with the wavelength increase for all ranges and samples. There are some small regions where the differences between the saturations are more significant, which is between 195 and 215 nm (25% sample with −0.04 AU and 100% sample with 0.34 AU). In these regions, the possibility to estimate the DO saturation in the samples with light absorption is promising, and some wavelengths can be used for that purpose. About the standard deviation, for 100% DO samples, the value is 0.1450; for 75% saturation, the value is 0.0612; for 50% saturation, it is 0.0779; and for 25% DO saturation, the result is 0.0672. In a further subsection, we analyze which wavelength has better accuracy in regard to predicting the DO saturation.
4.4. Results of RW
Subsequently,
Figure 6 represents the absorbance of the samples for the river in the UVC region of the spectrum. Despite the noise due to the presence of biomaterials present in the river water, it is possible to perceive higher values of the absorbance signal depending on the increase in DO saturation in the water. Just like the other matrices, the standard deviation was calculated. For 100% samples, the value is 0.0091; for 75%, the value is 0.0055; for 50% saturation, it is 0.0031; and for 25% samples, the result is 0.0058.
In general terms, the sample with the highest saturation (100% of DO) has higher absorbance, and samples with 25% and 50% have lower absorbances. Nonetheless, possibly due to compounds present in the sample, we cannot see that the samples follow a clear trend. We can see a detection peak for all samples, between 215 nm and 230 nm, before a noticeable decrease in the absorbance levels. The maximum value for 100% of the DO sample is 0,036 AU, and the minimum for 50% of the DO sample is 0.007 AU. Nonetheless, the absorbance of the sample with 25% of DO saturation appears above the sample with 50% of DO saturation. Even so, estimating the DO differences present in the water is considered a good range.
5. Discussion
In this section, we discuss the observed differences in the absorption of tested samples. First, we analyze the impact of these differences and the potential to be used as an optical method for sensing the DO in water. Then, the comparison between the proposed approach and existing methods for DO monitoring is presented. Finally, the main limitations of the proposed method are summarized.
5.1. Potential Use of DO Absorption in UV Spectrum as an Optical Approach for DO Monitoring
After analyzing the results for the absorbance values of the chosen saturations, it was necessary to determine in which wavelength the DO in water is more likely to be identified. Moreover, it is necessary to evaluate the level of correlation between the wavelength and the DO concentrations for all of the samples.
At this point, the objective of obtaining and analyzing the absorbances for all wavelength ranges was to find the most appropriate wavelength to perform a calibration. This calibration can be used in the future to determine the saturation of DO in natural samples. The DO results obtained for the three water matrixes show a maximum range of detection between 190 and 250 nm. For each studied wavelength, the
p-value (
ρ) and the correlation coefficient (CC) were evaluated for the three water matrixes.
Table 2 lists the values of CC and ρ for selected wavelengths and indicates the type of generated model. These wavelengths were selected to maximize the differences between samples. Models were obtained with Statgraphics Centurion XVII [
35], using the Simple Regression Tool. The type of model was selected according to the comparison of alternative models.
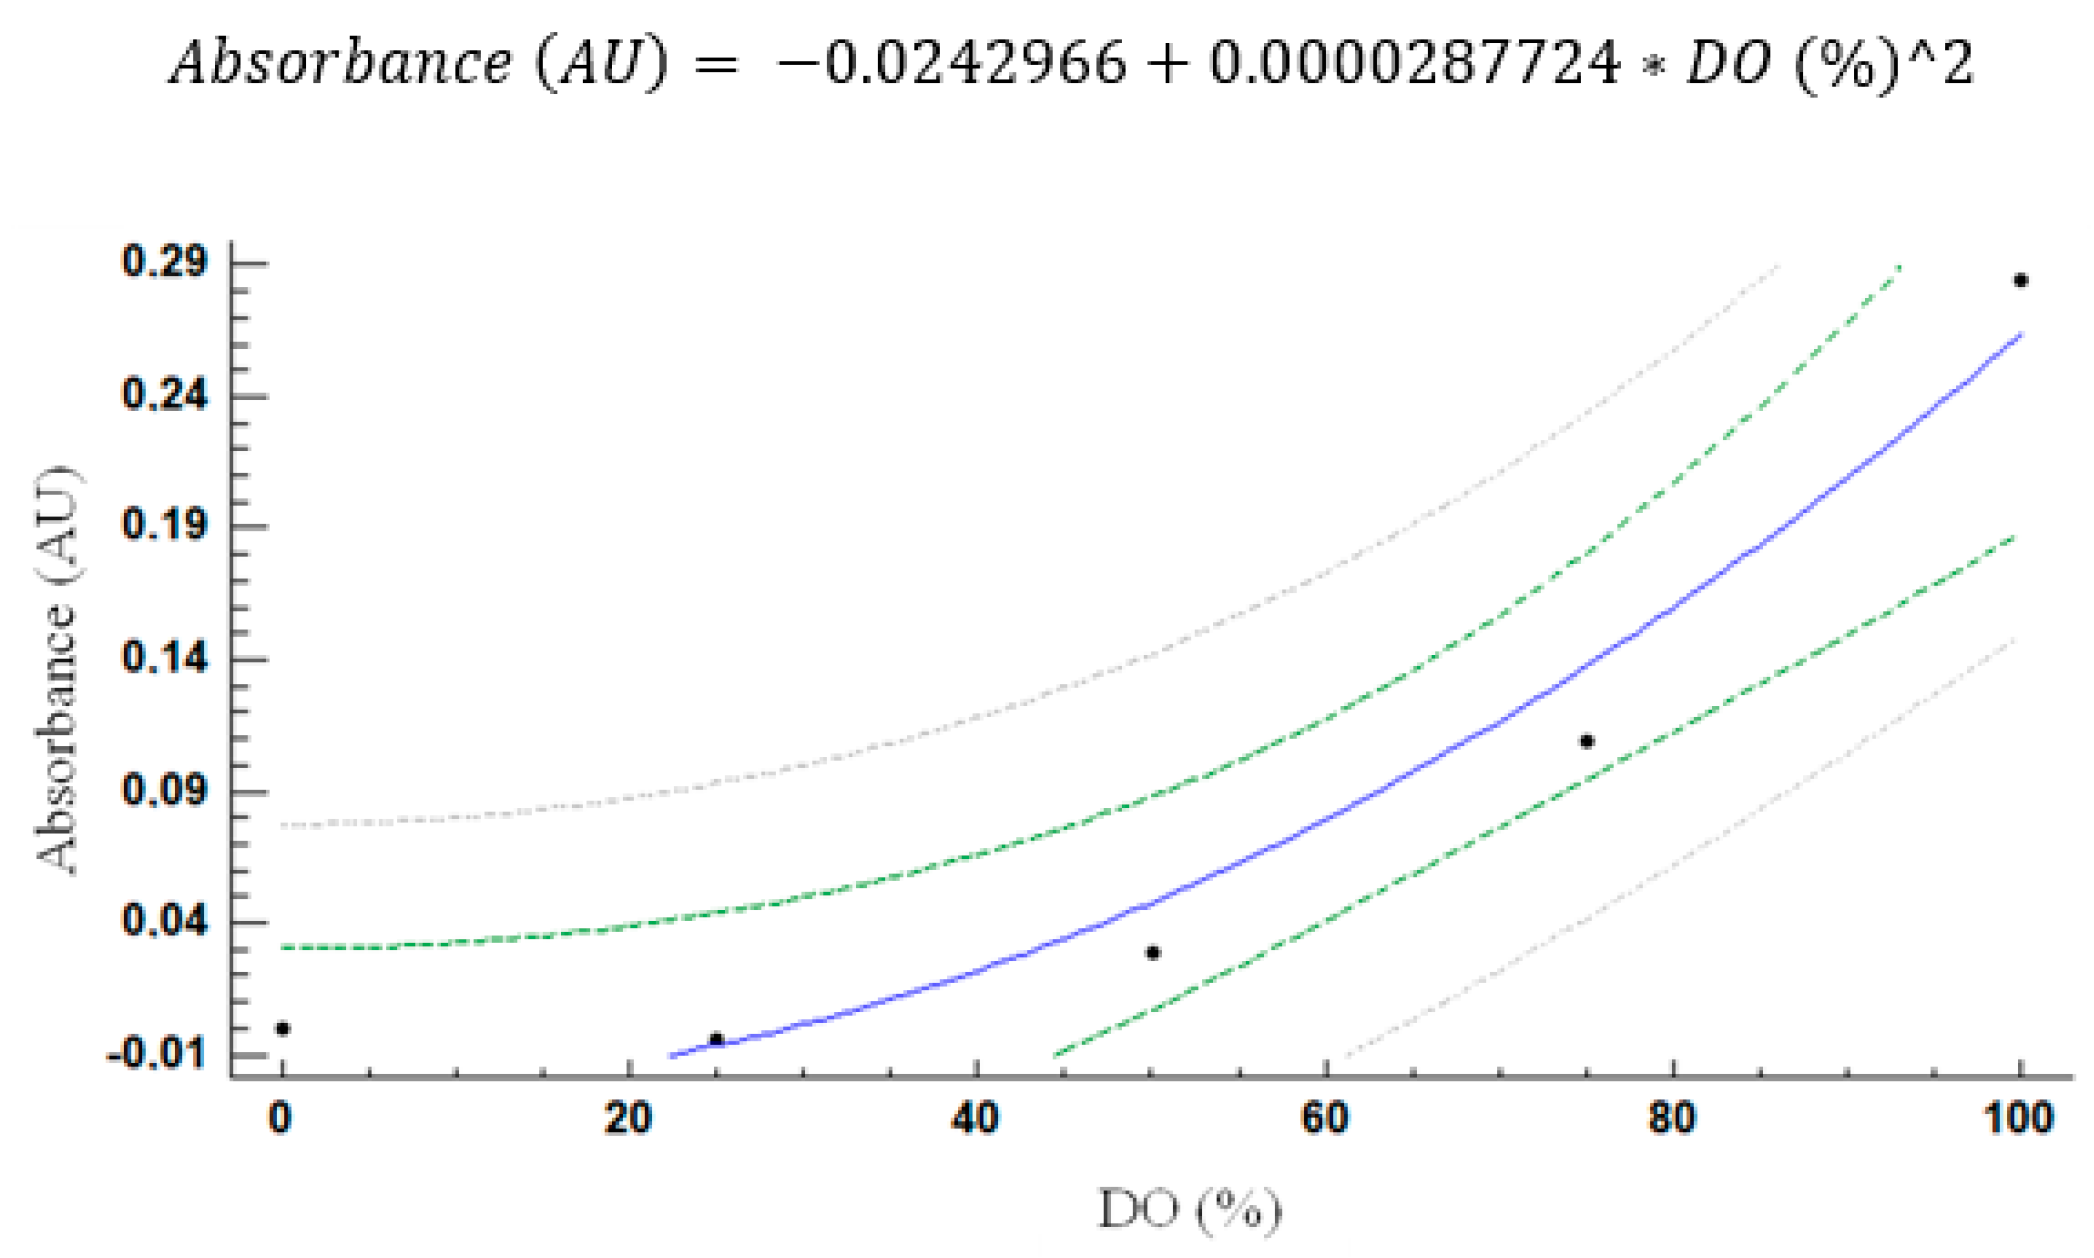
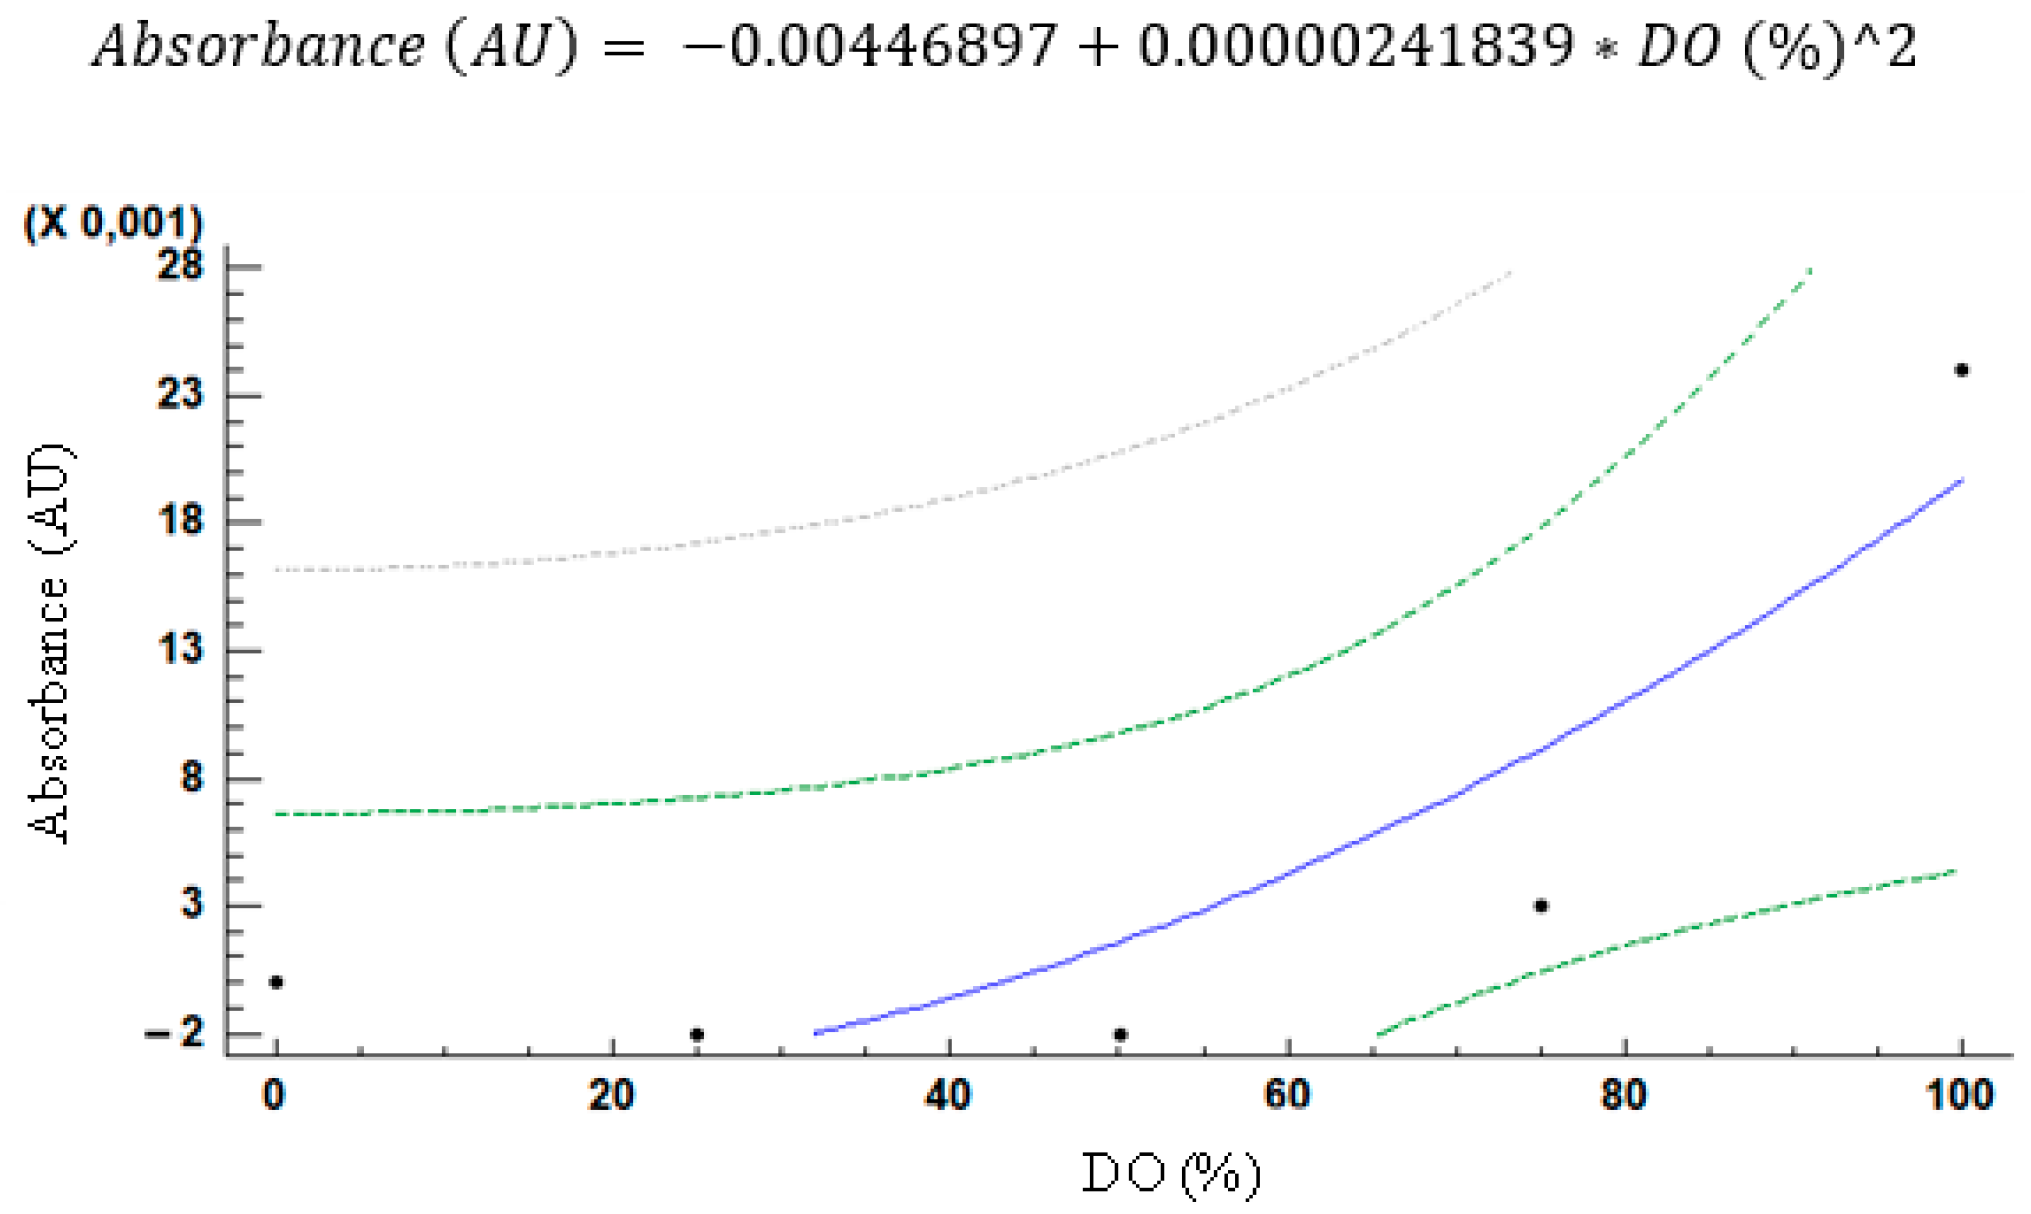
At 210 nm, we see the highest values for CC for all three samples (between 0.9032 and 0.9902) and two different models that adapt better, the Squared Root-Y Squared-X (UW sample) and Squared-X (DW and RW samples). To reduce the complexity of the system, we also represented the model Squared-X for UW. Thus, selecting the same model for all samples is more reliable.
Figure 7 and
Figure 8 depict the models and their equations for UW. In all figures, the blue line indicates the calculated model, and the dotted lines represent the confidence (green) and prediction intervals (grey). We can see that the loss of accuracy, according to the regression and confidence intervals, from changing the models is too high to be accepted. Thus, the system uses the Squared Root-Y Squared-X. Then,
Figure 9 and
Figure 10 portray the calibration graphics at 210 nm for DW and RW. We can see that, as the complexity of the matrix increases, the regression and confidence intervals increase as a response to the decrease in CC. This is mainly caused by the presence of interferents in real samples, which almost saturate the absorption of UV-C even in the blank.
Additional analysis includes the Analysis of Variance (ANOVA) with the different saturation levels for each sample, including the entire measured range with the mean values for each wavelength. These results can be seen in
Table 3. The results of the UW showed the largest differences among DO values. Nevertheless, the results of the multiple ranges test, using the least significant difference for the DW, are characterized by the clearest differences among the levels of DO. In the RW, the differences are only significant between the saturation of 100% and the rest of the saturations.
5.2. Comparison with Existing Proposals
Existing proposals which measured DO in water, explored in the Introduction, offered limited information about the accuracy of the proposed approaches. Given the wide variety of metrics, such as the determination coefficient, CC, square root of mean error (RMSE), ρ, and standard deviation (σ), fairly comparing the results has become complex. Moreover, the DO can be measured in different ways, such as saturation and mg/L; without knowing the temperature at which other authors have performed their experiments, converting the units is impossible.
The authors of [
13,
14,
15] determined the correlation coefficient values of the sensors and models to be between 0.99 and 0.88. In our case, the models have correlation coefficients from 0.99 to 0.97 for UW, 0.98 to 0.95 for DW, and 0.90 to 0.83 for RW. The authors of [
20] indicated the accuracy of their sensor based on the ρ (
ρ < 0.05). In our case, for UW and DW, all
ρ values were accomplished with
ρ < 0.05. Nonetheless, for the RW results, only data at 210 nm accomplish the
ρ < 0.05. The rest of the
ρ is between 0.06 and 0.08. The standard deviation and RMSE metrics cannot be compared since the units are different.
5.3. Limitations of Presented Tests
The main limitation of the proposed approach is that, in complex environments, many compounds might absorb the UV spectrum, which can be considered interferences. Nonetheless, the absorption peak of different compounds changes. Our aim is to include at least two-to-four LED emitters at different regions of the UV spectrum, as shown in
Table 2, to reduce the impact of those interferences. Most of those interferences absorb light at other wavelengths beyond the UV wavelength. However, since it is necessary to use another methodology for this improvement, researchers should consider carrying out these new tests with a new data framework and on more sample matrices. This new methodology includes creating and calibrating a new sensor and integrating it with the ones developed in [
23,
24], not simply using the current data. Thus, the combination of this UV-absorption sensor with a sensor with multiple LEDs emitting at different regions of the visible and IR spectrum is proposed. By combining the absorption at the UV spectrum with the existing visible and IR spectrum with the use of Artificial Neural Networks (ANNs), as proposed in [
36], it could be possible to detect a considerable range of interferences and estimate the DO concentration.
Another problem encountered with the obtained data is the loss of accuracy when the DO saturation is below 50%. Since the objective for these sensors is to be used in natural environments, such as rivers or oceans, the most common concentrations are around 100%. When the DO saturation drops below 60%, most fish experience breathing problems. Therefore, the interesting range for our sensor is from 60 to 100% of DO saturation, and the data accomplish this requirement. Although each sample needs a white itself, the calibration of the future sensor can prevail by detecting unique-to-unknown real samples based on further studies of UV spectrum detection.
6. Conclusions
In this paper, the absorbance spectrum of DO in the UV range was studied in water samples of different matrixes, UW, DW, and RW. The aim was to establish if it is possible to use the absorbance spectrum to determine the DO saturation.
The data collected in the laboratory indicate that the different water matrixes with a DO % near 0% have different absorption spectra. This is caused by the presence of different compounds in each water matrix which are absorbed in this region, such as pesticides or organic compounds. We determined that the region from 190 to 250 nm is the spectrum in which DO has the highest absorption. A total of four wavelengths were used to generate a series of models that estimate the saturation of DO in different water samples. Even though the models have problems detecting the DO saturation at low values, the critical DO values are between 100 and 60% for the environmental application. Through standard deviation analyses, we can see that, despite some overlapping points between saturations (as in the UW graph, between 25% and 50% of OD), the error bars show us that, for measurements carried out at higher saturations, the answer is consistent within the trend of the line.
In future work, we will combine the absorption spectrum of UV with visible and IR ranges. Instead of regression models to estimate the DO saturation, ANN and other AI-based mechanisms will be used to detect the presence of interferences in seawater samples, in which interferents will generally be at low concentrations. Furthermore, real samples with a bigger sample size should be conducted on actual water samples, including TW, seawater, fresh water, and reclaimed water, among others, to enhance the applicability of the study. Then, the sensor will be applied in real scenarios to be part of a marine observatory as a low-cost option to monitor water quality.
Author Contributions
Conceptualization, J.L. and M.C.-I.; methodology, J.L. and M.C.-I.; software, A.M. and L.P.; validation, A.M. and L.P.; formal analysis, A.M. and L.P.; investigation, A.M. and L.P.; resources, J.L. and M.C.-I.; data curation, A.M. and L.P.; writing—original draft preparation, A.M. and L.P.; writing—review and editing, L.P. and J.L.; visualization, J.L.; supervision, J.L. and M.C.-I.; project administration, J.L.; funding acquisition, J.L. All authors have read and agreed to the published version of the manuscript.
Funding
This study forms part of the ThinkInAzul program and was supported by MCIN with funding from the European Union’s NextGenerationEU (PRTR-C17.I1) and by Generalitat Valenciana (THINKINAZUL/2021/002).
Institutional Review Board Statement
Not applicable.
Informed Consent Statement
Not applicable.
Data Availability Statement
The data used to support the findings of this study are available from the corresponding author upon request.
Conflicts of Interest
Authors declare that there is no conflict of interest regarding the publication of this paper or between the authors.
References
- Janzen, J.G.; Schulz, H.E.; Lamon, A.W. Measurements of dissolved oxygen concentration at water surface. Eng. San. E Amb. 2008, 13, 278–283. [Google Scholar]
- Breitburg, D.; Levin, L.A.; Oschlies, A.; Grégoire, M.; Chavez, F.P.; Conley, D.J.; Garçon, V.; Gilbert, D.; Gutiérrez, D.; Isensee, K.; et al. Declining oxygen in the global ocean and coastal waters. Science 2018, 359, eaam7240. [Google Scholar] [CrossRef] [PubMed]
- Köster, M.; Wardenga, R.; Blume, M. Microscale investigations of microbial communities in coastal surficial sediments. Mar. Ecol. 2008, 29, 89–105. [Google Scholar] [CrossRef]
- Kemp, W.M.; Sampou, P.A.; Garber, J.; Tuttle, J.; Boynton, W.R. Seasonal depletion of oxygen from bottom waters of Chesapeake Bay: Relative roles of benthic and planktonic respiration and physical exchange processes. Mar. Ecol. Prog. Ser. 1992, 85, 137–152. [Google Scholar] [CrossRef]
- Kamykowski, D.Z.; Zentara, S.J. Hypoxia in the world ocean as recorded in the historical data set. Deep Sea Res. Part A Ocean. Res. Papers 1990, 37, 1861–1874. [Google Scholar] [CrossRef]
- Posada, E.; Mojica, D.; Pino, N.; Bustamante, C.; Monzon Pineda, A. Establishment of Environmental Quality Indices of Rivers According to the Behavior of Dissolved Oxygen and Temperature. Applied to the Medellín River, in the Valley of Aburra in Colombia. Dyna 2013, 80, 192–200. [Google Scholar]
- Global Seafood Alliance. Available online: https://www.aquaculturealliance.org/advocate/dinamica-del-oxigeno-disuelto/ (accessed on 13 August 2022).
- Wishner, K.F.; Seibel, B.A.; Roman, C.; Deutsch, C.; Outram, D.; Shaw, C.T.; Birk, M.A.; Mislan, K.A.S.; Adams, T.J.; Moore, D.; et al. Ocean deoxygenation and zooplankton: Very small oxygen differences matter. Sci. Adv. 2018, 4, eaau5180. [Google Scholar] [CrossRef]
- Sawicki, A.; Willows, R.D.; Chen, M. Spectral signatures of five hydroxymethyl chlorophyll derivatives chemically derived from chlorophyll b or chlorophyll f. Photosynth. Res. 2019, 140, 115–127. [Google Scholar] [CrossRef]
- Gwon, Y.; Kim, D.; You, H.; Nam, S.H.; Kim, Y.D. A Standardised Procedure to Build a Spectral Library for Hazardous Chemicals Mixed in River Flow Using Hyperspectral Image. Remote Sens. 2023, 15, 477. [Google Scholar] [CrossRef]
- Gupta, R.S.; Deshmukh, R.R.; Kshirsagar, A.V. Spectral Database of Pharmaceutical Common Excipients and Paracetamol API Using ASD Field Spec 4 Spectroradiometer. Med.-Leg. Update 2021, 21, 1012–1018. [Google Scholar]
- Ramanna, S.; Morozovskii, D.; Swanson, S.; Bruneau, J. Machine Learning of polymer types from the spectral signature of Raman spectroscopy microplastics data. arXiv 2022, arXiv:2201.05445. [Google Scholar] [CrossRef]
- Lakowicz, J.R.; Weber, G. Quenching of fluorescence by oxygen. Probe for structural fluctuations in macromolecules. Biochemistry 1973, 12, 4161–4170. [Google Scholar] [CrossRef] [PubMed]
- Olias, L.G.; Otero, A.R.; Cameron, P.J.; Di Lorenzo, M. A soil microbial fuel cell-based biosensor for dissolved oxygen monitoring in water. Electroch. Acta 2020, 362, 137108. [Google Scholar] [CrossRef]
- Song, N.; Yan, Z.; Xu, H.; Yao, Z.; Wang, C.; Chen, M.; Zhao, Z.; Peng, Z.; Wang, C.; Jiang, H. Development of a sediment microbial fuel cell-based biosensor for simultaneous online monitoring of dissolved oxygen concentrations along various depths in lake water. Sci. Tot. Environ. 2019, 673, 272–280. [Google Scholar] [CrossRef] [PubMed]
- Zhang, Y.; Angelidaki, I. A simple and rapid method for monitoring dissolved oxygen in water with a submersible microbial fuel cell (SBMFC). Biosens. Bioelectron. 2012, 38, 189–194. [Google Scholar] [CrossRef] [PubMed]
- Abouelsaad, O.; Matta, E.; Omar, M.; Hinkelmann, R. Numerical simulation of Dissolved Oxygen as a water quality indicator in artificial lagoons–Case study El Gouna, Egypt. Region. Stud. Marin. Sci. 2022, 56, 102697. [Google Scholar] [CrossRef]
- Shaghaghi, N.; Nguyen, T.; Patel, J.; Soriano, A.; Mayer, J. Monitoring, DOxy: Dissolved Oxygen Monitoring. In Proceedings of the 2020 IEEE Global Humanitarian Technology Conference (GHTC), Seattle, WA, USA, 29 October–1 November 2020; pp. 1–4. [Google Scholar] [CrossRef]
- Wei, Y.; Jiao, Y.; An, D.; Li, D.; Li, W.; Wei, Q. Review of Dissolved Oxygen Detection Technology: From Laboratory Analysis to Online Intelligent Detection. Sensors 2019, 19, 3995. [Google Scholar] [CrossRef] [PubMed]
- Qian, W.; Zhang, S.; Tong, C.; Sardans, J.; Peñuelas, J.; Li, X. Long-term patterns of dissolved oxygen dynamics in the Pearl River Estuary. J. Geo. Res. Biog. 2022, 127, 1–14. [Google Scholar] [CrossRef]
- Ramírez, T.G. Aplicación De La Espectrofotometria Ultravioleta Para Determinar El Oxigeno Disuelto En Agua Por El étodo Winkler. Bol. Investig. Mar. Cost. 1992, 21, 95–100. [Google Scholar]
- Duval, W.S.; Brockington, P.J.; von Melville, M.S.; Geen, G.H. Spectrophotometric determination of dissolved oxygen concentration in water. J. Fish. Res. Board Canada 1974, 31, 1529–1530. [Google Scholar] [CrossRef]
- Miura, A.S.; Parra, M.; Lloret, J.; Rodilla, M. LED optical sensor prototype to determine dissolved oxygen saturation in water. In Proceedings of the 2021 Global Congress on Electrical Engineering, Valencia, Spain, 10–12 December 2021; pp. 115–120. [Google Scholar] [CrossRef]
- Parra, L.; Viciano-Tudela, S.; Carrasco, D.; Sendra, S.; Lloret, J. Low-cost microcontroller-based multiparametric probe for coastal area monitoring. Sensors 2023, 23, 1871. [Google Scholar] [CrossRef] [PubMed]
- Narayana, B.; Mathew, M.; Cherian, T.; Pasha, C. Spectrophotometric determination of dissolved oxygen in water. Indian J. Chem. Technol. 2005, 12, 593–595. [Google Scholar]
- Penso, C.M.; Rocha, J.L.; Martins, M.S.; Sousa, P.J.; Pinto, V.C.; Minas, G.; Silva, M.M.; Goncalves, L.M. PtOEP–PDMS-based optical oxygen sensor. Sensors 2021, 21, 5645. [Google Scholar] [CrossRef] [PubMed]
- Mahoney, E.J.; Hsu, H.H.L.; Du, F.; Xiong, B.; Selvaganapathy, P.R.; Fang, Q. Optofluidic Dissolved Oxygen Sensing with Sensitivity Enhancement Through Multiple Reflections. IEEE Sens. J. 2019, 19, 10452–10460. [Google Scholar] [CrossRef]
- Pittaluga, F.; Aleffi, I.F.; Bettoso, N.; Blasutto, O.; Celio, M.; Codarin, A.; Cumani, F.; Faresi, L.; Guiatti, D.; Orlandi, C.; et al. The SHAPE Project: An Innovative Approach to Understanding Seasonal and Diel Dissolved Oxygen Dynamics in the Marano and Grado Lagoon (Adriatic Sea) under the WFD/2000/60/CE. J. Mar. Sci. Eng. 2022, 10, 208. [Google Scholar] [CrossRef]
- Tholen, C.; Parnum, I.; Rofallski, R.; Nolle, L.; Zielinski, O. Investigation of the Spatio-Temporal Behaviour of Submarine Groundwater Discharge Using a Low-Cost Multi-Sensor-Platform. J. Mar. Sci. Eng. 2021, 9, 802. [Google Scholar] [CrossRef]
- Oliveira, V.H.; Sousa, M.C.; Morgado, F.; Dias, J.M. Modeling the Impact of Extreme River Discharge on the Nutrient Dynamics and Dissolved Oxygen in Two Adjacent Estuaries (Portugal). J. Mar. Sci. Eng. 2019, 7, 412. [Google Scholar] [CrossRef]
- Barnstead Smart2Pure. Available online: https://es.vwr.com/store/product/13527973/ultrapure-water-systems-barnsteadtm-smart2puretm (accessed on 22 June 2022).
- Apera Instruments. Available online: https://aperainst.com/do8500-portable-optical-dissolved-oxygen-meter-kit (accessed on 22 June 2022).
- LLG Labware. Available online: https://shop.llg-labware.com/info1297-spektralphotometer-llg-unispec-2-und_lang_DE.htm?UID=5500633accf1000000000000 (accessed on 3 October 2022).
- Patel, H.; Vashi, R.T. Chapter 2—Characterization of Textile Wastewater. In Characterization and Treatment of Textile Wastewater; Elsevier: Amsterdam, The Netherlands, 2015; pp. 21–71. [Google Scholar] [CrossRef]
- Statgraphics Centurion XVIII. Available online: https://www.statgraphics.com/download (accessed on 15 November 2022).
- Rocher, J.; Parra, L.; Jimenez, J.M.; Lloret, J.; Basterrechea, D.A. Development of a Low-Cost Optical Sensor to Detect Eutrophication in Irrigation Reservoirs. Sensors 2021, 21, 7637. [Google Scholar] [CrossRef]
| Disclaimer/Publisher’s Note: The statements, opinions and data contained in all publications are solely those of the individual author(s) and contributor(s) and not of MDPI and/or the editor(s). MDPI and/or the editor(s) disclaim responsibility for any injury to people or property resulting from any ideas, methods, instructions or products referred to in the content. |
© 2023 by the authors. Licensee MDPI, Basel, Switzerland. This article is an open access article distributed under the terms and conditions of the Creative Commons Attribution (CC BY) license (https://creativecommons.org/licenses/by/4.0/).


