Article

Quantitative Evaluation of Biomechanical Properties of the Tongue Using a Shaker-Based Optical Coherence Elastography System

1
Key Laboratory of Opto-Electronic Information Science and Technology of Jiangxi Province and Jiangxi Engineering Laboratory for Optoelectronics Testing Technology, Nanchang Hangkong University, Nanchang 330063, China
2
School of Instrument Science and Opto-Electronics Engineering, Beijing University of Aeronautics and Astronautics, Beijing 100191, China
3
School of Mathematics and Physics, University of Science and Technology Beijing, Beijing 100083, China
*
Authors to whom correspondence should be addressed.
Photonics 2023, 10(10), 1143; https://doi.org/10.3390/photonics10101143
Submission received: 11 August 2023 / Revised: 8 September 2023 / Accepted: 13 September 2023 / Published: 12 October 2023

Abstract

:
Biomechanical properties of the tongue play a significant role in maintaining its normal physiological state. Although some techniques have been used to evaluate the tongue’s elasticity, they are limited in clinical detection because of low-resolution and invasive injuries. Here, a shaker-based optical coherence elastography technique that possesses features of high resolution, high sensitivity, and non-destructive imaging was designed and applied to the elastic detection of the tongue for the first time. Repeated experiments were conducted on the in vivo beagle tongue whose shear modulus and Young’s modulus were quantified by visualization of the shear wave propagation, which indicates that our technique is reliable and operable, and may be potentially utilized in clinical fields with further refinement.

1. Introduction

The tongue, which is located at the bottom of mouth, is a significant organ that performs functions such as language, taste, and chewing. Once the tongue produces a lesion, it is likely to be an early symptom of tongue cancer. In addition, it can also be a precursor to some systemic diseases, such as blood and immune disorders [1]. Tongue cancer is a common type of oral cancer occurring in the sides and bottom of the tongue, most of which belong to squamous cell carcinoma [2]. However, the early symptoms of tongue cancer are not obvious, and thus patients do not have significant pain or discomfort, which may cause further deterioration of the condition and delay the optimal treatment time. Hence, efficient ways have been explored to recognize and judge the early symptoms of tongue cancer. Many studies have declared that the carcinoma tissue may be harder than the surrounding normal tissue in early stage cancer, which reflects that the changes in biomechanical properties of tissues can appear with the presence of cancer [3,4,5]. Thereby, the study of the biomechanical properties of the tongue may be of great significance for the early diagnosis of tongue cancer.
Several groups have studied the biomechanical properties of the tongue [6,7,8], where the elastography technique is widely used. Elastic imaging is a technique including hosts of elastography methods that estimates tissue elasticity by applying external forces to tissues and detecting the strain and stiffness of tissues [9,10,11]. Shingaki et al. applied the intraoral strain elastography technique on patients with tumorous lesions of the tongue to study the mechanical mechanism of early stage tongue carcinoma [6]. As a result, the corresponding strain distribution graph and thickness of the lesion were obtained and calculated. Chu et al. conducted a study evaluating the thickness and elasticity of the upper airway in patients with obstructive sleep apnea (OSA) by shear-wave ultrasound elastography [7]. The obtained Young’s modulus values suggested that the tongues of OSA patients are softer than those of healthy people. Cheng et al. used magnetic resonance elastography (MRE) technology to assess the viscoelastic properties of the tongue in volunteers during quiet breathing and measure the storage shear modulus [8]. Although these studies have evaluated the tongue’s elasticity, their comparatively low resolution and sensitivity may limit the track of subtle changes in the elastic structure of tongue tissues.
Elastography facilitates real-time monitoring of histopathological status, as the changes in elasticity may reflect the subtle variation of tissue structure. Elastic imaging techniques mainly include ultrasonic elastography (UE) and MRE technology. The UE technology was first introduced in the 1990s to measure local tissue strain and elastic modulus distribution in real time [12]. Based on MRI technology, MRE technology uses vibration sources to generate low-frequency mechanical waves and reconstructs quantitative tissue elasticity maps. Furthermore, the imaging results of MRE technology are more stable than UE technology owing to less dependence on the operators [13]. Nevertheless, they still do not have enough ability to accurately quantify the subtle deformation of tissues due to the relatively low resolution, although they can both achieve relatively large penetration depth [14,15].
Optical coherence elastography (OCE) technology is an emerging technology with high resolution and sensitivity, which develops from optical coherence tomography (OCT) [16,17,18,19]. An OCT system and an excitation unit are included in the OCE system. The excitation unit is used to cause subtle tissue deformation that is simultaneously detected by the OCT system to obtain the elastic information [20]. Furthermore, OCE is mainly divided into static and dynamic OCE according to different excitation forms [21,22]. Static OCE mainly includes compression OCE that uses static load to compress the tissue to produce deformation [23]. The corresponding Young’s modulus is calculated by the ratio of stress and strain. Meanwhile, the strain map and elastic distribution map can be obtained. In dynamic OCE, the wave-based method is the most commonly used technique, where periodic or pulsed loads are used to apply transient and local forces to the tissue to induce mechanical waves propagating inside the tissue [24,25]. The Young’s modulus of the tissue can be quantified by measuring the propagation velocity of the mechanical waves (group and phase velocity) and employing appropriate mechanical models. Based on this, OCE has become an efficient imaging tool in many fields, such as ophthalmology, dermatology, and atherosclerosis, where reliable elasticity results have been achieved [26,27,28,29,30,31]. Therefore, this technique has been fully validated in assessing biomechanical properties.
In this paper, we developed a shaker-based OCE system to measure the elasticity of the tongue. A shaker was employed to induce tissue deformation and elastic wave propagation. The force that was applied to induce deformation is easily controlled by the shaker, and thus deformation can be limited within the linear elastic region of tissues [32]. Moreover, a swept-source (SS) OCT system was used to track elastic wave propagation. It is based on a SS laser that has long wavelengths to reduce the signal attenuation and provide better tissue penetration [33,34,35].
A homogeneous phantom was first applied to check on the solidity and credibility of the system. Through several repeated experiments, the structural image and elastic wave velocity were obtained and then the Young’s modulus was accordingly calculated, whose values are consistent with the standard tensile test. The system was subsequently utilized to evaluate in vivo beagle tongue elasticity. Similarly, its structural image and corresponding Young’s modulus were acquired and quantified.

2. Materials and Methods

2.1. System Configuration

To accurately evaluate the elasticity of the tongue, a shaker-based OCE system was developed, as shown in Figure 1, where the mechanical shaker excitation unit was employed to generate the elastic wave, and the SS-OCT unit was used to track elastic wave propagation in tissue. In the SS-OCT section, a swept laser source with a central wavelength of 1310 nm and 110 nm bandwidth was used, which provides an average output power of 20 mw and an A-line acquisition frequency of 50 kHz. Through a wideband coupler, the light emitted from the laser source was split into two beams according to a particular spectral ratio (99:1). On account of the need to detect sufficient information from the sample, 99% of the light was conveyed to the sample arm, and 1% of the light was transmitted into the reference arm. In the reference arm, the light passed through a circulator, a collimator, an attenuator, and a plano-convex lens. The optical circulator is a three-port device that allows light to travel in only one direction. Any changes in the properties of the light caused by passing through the device are not reversed by traveling in the opposite direction. The fiber collimator is pre-aligned to collimate light from an FC/APC-terminated fiber with diffraction-limited performance. The attenuator can decrease the light intensity, and the plano-convex lens can focus a collimated beam or collimate light from a point source. Then, it came back to the circulator after reflecting from the mirror. Meanwhile, in the sample arm, the light traversed across the circulator, two-dimensional (2D) galvanometer, and scanning lens. Subsequently, it reached the tissue to track the elastic wave propagation. Two returned beams from the sample and reference arms interfered in another broadband coupler (50:50), and then the interfered light was detected by the photodetector. Eventually, the signal was processed by a computer under C++ circumstance. In addition, the axial resolution, lateral resolution, imaging depth, and signal-to-noise ratio of the OCT system are 6.71 μm, 15 μm, 4.2 mm, and 95 dB, respectively.
To induce elastic wave in the tissue, a function generator (Tektronix AFG31102) was exploited to generate a single-channel 2 kHz burst signal. Then, the signal was magnified by a power amplifier (Spanawave PAS-00023-25) and transferred to the mechanical shaker (Bruel & Kjaer, mini-shaker type 4810; Duluth, GA, USA). Meanwhile, a metal rod was attached to the end of the shaker to induce elastic wave propagation [36], and the tip of the rod briefly came into contact with the beagle tongue surface and aligned with the OCT scanning beam [37].

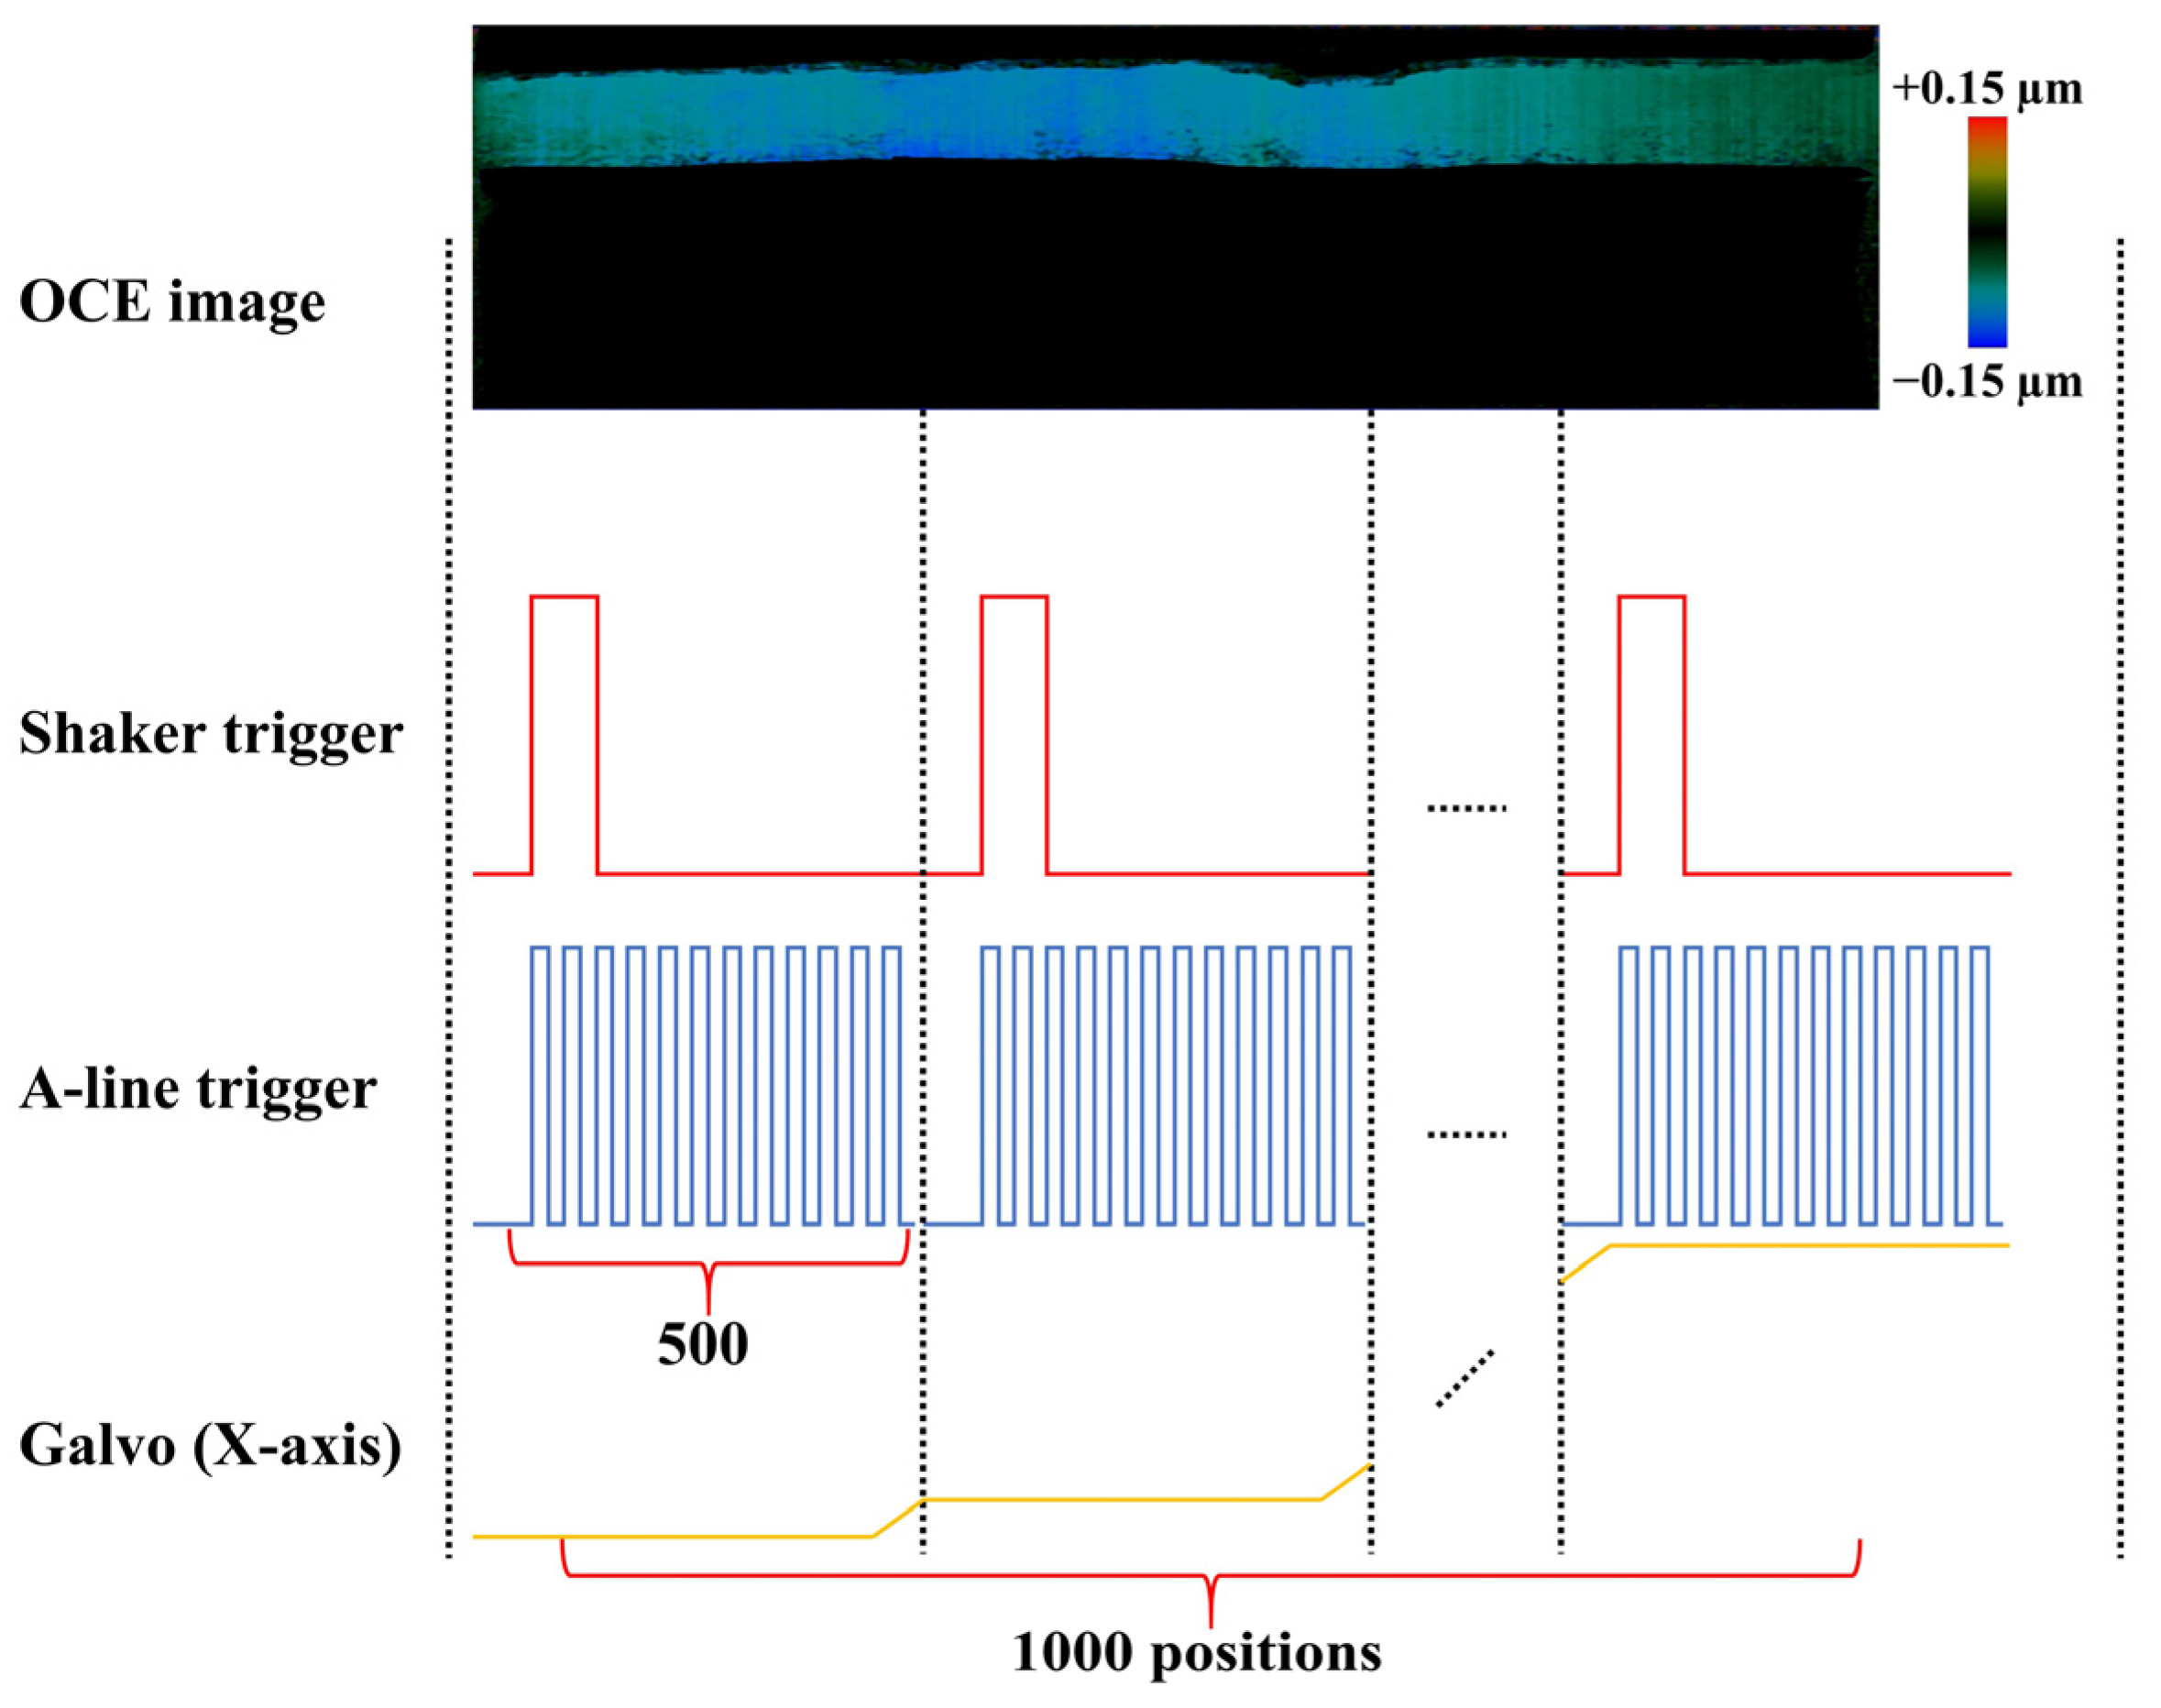
2.2. System Synchronization

In order to obtain the elastic information about the tongue, OCT data was obtained by the M-B scan model in the system. The λ trigger of the swept laser source was used to control the synchronization of the OCT scan light and the shaker excitation. The 500 A-lines (each A-line is spaced at 20 μs) and one shaker trigger were included in one M mode at each position, which takes 10 ms in total. Furthermore, the 2D galvanometer was used to move the OCT beam from one position to the next position. The same M-mode at 1000 locations was incorporated in one B-mode with a total time of 10 s. The timing diagram of the M-B mode is shown in Figure 2.

2.3. Biomechanical Characteristic Analysis

The tongue is regarded as an isotropic tissue in our experiments. Thus, the shear wave induced by the mechanical disturbance was used to quantify the biomechanical properties of the tongue. Doppler phase information at each location was acquired from the OCT raw data by utilizing the Hilbert transform. The phase difference Δφ between two adjacent A-lines taken from the contiguous data acquisition time was calculated by the phase resolution algorithm [38] in Equation (1):
Δ φ = tan 1 Im ( F m × F m + 1 ) Re ( F m × F m + 1 )
where Fm and Fm+1 are the complex data of the given position and its next position, respectively, and F*m+1 stands for the conjugate of Fm, while Im () and Re () are the imaginary and real parts of the product of Fm and F*m+1, respectively. Later, the displacement difference between adjacent A-lines was calculated by the phase difference [39], as shown in Equation (2):
Δ d = λ 0 4 π n Δ φ
where λ0 is the center wavelength of the laser, and n symbolizes the refractive index of the tongue. Upon the displacement difference, the Doppler OCT image can be acquired, from which the spatiotemporal propagation information of the shear wave can be extracted. The shear wave velocity Vs was calculated by the displacement of the shear wave over time [40], as shown in Equation (3):
V s = Δ x Δ t
where Δx and Δt are the displacement and time of the shear wave propagation. In addition, the relationship between the shear modulus and the shear wave velocity [41] is shown in Equation (4):
μ = ρ × V s 2
where ρ, Vs, and μ separately refer to the tongue’s density (1000 kg/m3), shear wave velocity, and shear modulus. According to the relationship between the shear modulus and the Young’s modulus [42], the Young’s modulus of the tongue can be calculated by Equation (5):
E = 2 μ × ( 1 + v )
where v represents the Poisson’s ratio (0.5) [43], while E is the Young’s modulus. Thus, the formula for calculating Young’s modulus [44] can be further simplified to Equation (6):
E = 3 × ρ × V s 2

2.4. Sample Preparation

In this paper, one tailor-made agar phantom was created to test the reliability and stability of the shaker-based OCE system. The preparation process of agar was as follows: (1) the agar powder was put into distilled water at room temperature, and the mixture was heated to 95 °C under continuous stirring; (2) the solution was cooled to 40 °C; and (3) 0.6% (v/v) intralipid solution was added into the mixture, then it was cooled to room temperature and placed in a prepared mold under vacuum condition.
The beagle experiments complied with the guidelines set forth by the Animal Experiment Ethics Committee of Nanchang Hangkong University (20190316/v1.0). One healthy beagle weighing 9.3 kg was used to serve as a laboratory sample. With ketamine (35 mg/kg) and xylazine (5 mg/kg) injections, the beagle was anesthetized before experiments. When the beagle was utterly senseless, it was placed on a custom-designed lifting table, with its mouth opened by a retractor. After experiments, the beagle was put back in its cage with regular feeding and monitoring.
Furthermore, five repeated experiments were conducted to ensure the accuracy of results and avoid accidental interference.

3. Results

3.1. Phantom Imaging

To verify the feasibility of the shaker-based OCE system, experiments on a homogeneous agar phantom were first performed. The 2D OCT image of the phantom is shown in Figure 3a, with the red line indicating the excitation position. Through the M-B scanning mode and Equations (1) and (2), 2D plots of shear wave propagation at five different time points were obtained, as shown in Figure 3b–f, where different colors symbolize different vibration directions and intensities. Meanwhile, to better visualize the propagation of shear wave along the entire lateral scanning range, a 3D image of shear wave propagation was reconstructed, as plotted in Figure 4. It can be seen that the propagation of the shear wave is continuous along the transverse measurement range. Meanwhile, the intensity and direction of wave vibration are different at distinct positions. Subsequently, by slicing it from the xt plane, the spatiotemporal Doppler image was acquired, as shown in Figure 5. The shear wave velocity could be evaluated to be 3.54 ± 0.03 m/s according to the slope of the spatiotemporal image and Equation (3). Then, the Young’s modulus could be quantified to be 37.64 ± 0.57 kPa based on Equations (4) and (6). In the meantime, a tensile test was carried out on the same agar model to verify the reliability of the outcomes, by which the Young’s modulus was calculated to be 39.26 ± 1.72 kPa. The results of our OCE experiments and tensile test are relatively consistent, which indicates that the OCE technique owns appropriate reliability and feasibility. As a result, it can be utilized for further tests on biological tissues.

3.2. In Vivo Beagle Tongue Imaging

After the confirmation of phantom experiments, our OCE system was used to conduct in vivo beagle tongue imaging. The tongue was kept dry throughout our experiment, and the shear wave mode was used to quantify the elasticity of the tongue. The whole test time should last no more than two hours to acquire good results and ensure the anesthetic effect. Meanwhile, three parts (see Figure 1) of the tongue including the right side of the dorsum linguae, the left side of the dorsum linguae, and the ventral surface of the tongue were measured to scrupulously analyze the elasticity of the tongue. The 2D OCT image of the right side of the dorsum linguae is shown in Figure 6a, where the red line symbolizes the position of excitation. Furthermore, the shear wave propagation at different time points was also obtained using the same methods described in the phantom experiments, as demonstrated in Figure 6b–f. The 3D image of shear wave propagation and spatiotemporal Doppler image were, respectively acquired to quantify its elasticity, as shown in Figure 7 and Figure 8. The shear wave velocity was calculated to be 4.38 ± 0.20 m/s. Subsequently, the corresponding Young’s modulus was evaluated to be 57.66 ± 5.30 kPa.
Similarly, the left side of the dorsum linguae and the ventral surface of the tongue were also evaluated by our OCE system. The 2D OCT image and shear wave propagation at different time points of the left side of the dorsum linguae are shown in Figure 9. Meanwhile, a 3D image of shear wave propagation and spatiotemporal image are demonstrated in Figure 10 and Figure 11. The corresponding shear wave velocity, and Young’s modulus were, respectively calculated to be 4.36 ± 0.17 m/s and 57.15 ± 4.37 kPa. The 2D OCT image and shear wave propagation of the ventral surface of the tongue are shown in Figure 12. The 3D image of shear wave propagation and spatiotemporal image are shown in Figure 13 and Figure 14, respectively. Based on the identical methods, the shear wave velocity and Young’s modulus were calculated to be 4.26 ± 0.18 m/s and 54.70 ± 4.79 kPa, respectively. The Young’s modulus results of these three parts are summarized in Figure 15. The boxplot indicates that the dorsum linguae is a little harder than the ventral of the tongue.

4. Discussion

The biomechanical properties of the tongue have been thought to contact intimately with their physiological status in many available studies. When the signal of lesion on the tongue occurs, some related diseases such as tongue cancer could appear to damage people’s health. In recent years, ultrasonographic elastography, introduced as an alternative technology enabling visualization of tissue elasticity, has been used to assess the degree of invasion of carcinomas. Elastography has been proven useful for differentiating between benign and malignant breast and thyroid gland lesions and for assessing liver fibrosis, and some studies have investigated the correlations between sonographic morphological features of the invasive front of tongue carcinoma and histopathological findings. Although some methods, such as MRE, strain elastography technique and shear-wave ultrasound elastography, have been used to evaluate the biomechanical properties of the tongue, their disadvantages of low resolution and invasive imaging could restrict further clinical application. Consequently, other techniques with the characteristic of non-destructive imaging and high resolution should be established to detect tongue elasticity.
In this paper, a shaker-based OCE method to detect the biomechanical properties of the tongue has been proposed for the first time. The shaker was used to impose an external incentive on the tissues, and the SS-OCT system was employed to track the propagation of the shear wave induced by the excitation. The system was used on the agar phantom to acquire structural information and visualize shear wave propagation. The corresponding result of the shear wave velocity was evaluated to be 3.54 ± 0.03 m/s based on the slope of the spatiotemporal image. Then, its Young’s modulus value was quantified to be 37.64 ± 0.57 kPa. Moreover, the experimental shear modulus and Young’s modulus’ results corresponded well with the data from tensile testing on the same phantom, which indicates that the system is dependable. Subsequently, experiments were conducted on three parts of the in vivo beagle tongue using our technique. The corresponding structural and elastic information were both obtained in the wake of processing the resulting raw data. In the experiments of the dorsum linguae, the Young’s modulus of the right and left sides of the dorsum linguae were quantified to be 57.66 ± 5.30 kPa and 57.15 ± 4.37 kPa, respectively. In the meantime, the corresponding Young’s modulus of the ventral surface of the tongue was calculated to be 54.70 ± 4.79 kPa. Then, the Young’s modulus results of the dorsum linguae and ventral surface of the tongue were summarized in a boxplot where the variance between them is evident, which indicates that the hardness of different areas on the tongue could be detected. Meanwhile, the slighter difference between the left and right sides of the dorsum linguae could also be recognized. These trials and results further reveal the capability of our shaker-based SS-OCE system to evaluate the biomechanical properties of the tongue. Moreover, based on the advantages of high sensitivity, high resolution, and non-contact imaging, this system may be anticipated to be utilized in the clinical detection of the tongue.
Although the shaker-based SS-OCE system has been validated for tongue elasticity measurement, it is still a little difficult to translate this technology into clinical use due to some challenges. To begin with, some inevitable physiological movements of the subject, such as volumetric movements induced by breathing or heartbeat, will occur during the whole experiment. Therefore, some motion artifacts will appear during data acquisition. Diminishing or even avoiding the effects of motion artifacts can be realized by increasing imaging speed, which may require a laser source with a higher repetition rate to provide faster line scan speeds [45,46]. Secondly, the imaging depth needs to be enhanced to facilitate better analysis of the structure of the tongue, which can be solved by the employment of a light source with a longer wavelength, and a photodetector with a larger bandwidth [47,48,49]. Thirdly, the imaging area should be expanded, which may be achieved by adding a lens with a 50 mm focal length in front of the scan lens to extend the field of view [50,51]. Eventually, the sensitivity and resolution of the system ought to be strengthened. Using lasers with wider bandwidths can be a bright solution to reinforce them [52].
In the future, we will further study and analyze the biomechanical properties of the tongue. For example, ex vivo and in vivo experiments will be conducted on more animal tissues such as rabbit tongue and pig tongue. On the one hand, it’s worthwhile to know the elastic difference between the ex vivo and in vivo tongues, on the other hand, the individual differences of biomechanical properties can be detected in various animals’ tongue. Subsequently, a large amount of sufficient data of tongue elasticity can be accumulated to establish a relatively comprehensive database. In addition, experiments on medicine-induced tongue cancer models will be performed to further explore how cancer influences the biomechanical properties of the tongue. It has been proved that tongue cancer is a complex clinical disease that should be understood deeply. Through the animal model with tongue cancer, the changes in elasticity of tongue cancer in the early, middle and terminal periods can be monitored, and thus our technology can be better applied to the clinical detection and diagnosis of tongue cancer in the future. In the meantime, the accuracy of the elastic quantification is expected to be further enhanced, which can be solved by improving the accuracy of phase difference estimation and phase stability of the system. Furthermore, the excitation unit and scanning objective lens can be integrated into a handheld probe through a 3D-printing technique or industrial production to facilitate the users. Eventually, this system and method may be applied to clinical testing through constant trials and improvement, which might help clinicians to better understand the pathological process of the disease and benefit from the timely diagnosis and treatment.

5. Conclusions

In this paper, a shaker-based OCE system is proposed to detect the biomechanical properties of the beagle tongue. This technique was first applied in the quantitative elasticity measurements of agar phantom, whose reliable results confirm that our system and method are stable and operable. Then, experiments on in vivo beagle tongue were performed to visualize 3D shear wave propagation and calculate the corresponding Young’s modulus. Revelation of the variance among the three parts of the tongue indicates that the elastic information of the tongue could be evaluated efficiently by our technique, and thus, it may be involved in the clinical detection of the tongue with continuous improvement in the future.

Author Contributions

All authors participated in the design, interpretation of the studies, and analysis of the data and review of the manuscript; J.L. and X.H (Xiao Han) conducted the experiments, G.S. was responsible for imaging processing; J.L. and Y.Z. wrote the manuscript; Y.Z., Q.Z. and X.H. (Xingdao He) contributed to critical revisions of the manuscript. All authors have read and agreed to the published version of the manuscript.

Funding

Financial support from the National Natural Science Foundation of China (12164028, 51863016, 12064029); Jiangxi Provincial Natural Science Foundation (20202BABL202024).

Institutional Review Board Statement

All experimental protocols in this study have been approved by the Animal Experiment Ethics Committee of Nanchang Hangkong University (20190316/v1.0).

Informed Consent Statement

Not applicable.

Data Availability Statement

Data underlying the results presented in this paper are not publicly available at this time but may be obtained from the authors upon reasonable request.

Conflicts of Interest

The authors declare no conflict of interest.

References

  1. Mangold, A.R.; Torgerson, R.R.; Rogers, R.S., III. Diseases of the tongue. Clin. Dermatol. 2016, 34, 458–469. [Google Scholar] [CrossRef] [PubMed]
  2. Moore, S.; Johnson, N.; Pierce, A.; Wilson, D. The epidemiology of tongue cancer: A review of global incidence. Oral Dis. 2000, 6, 75–84. [Google Scholar] [CrossRef] [PubMed]
  3. Bagan, J.; Sarrion, G.; Jimenez, Y. Oral cancer: Clinical features. Oral Oncol. 2010, 46, 414–417. [Google Scholar] [CrossRef] [PubMed]
  4. Ogura, I.; Amagasa, T.; Miyakura, T.; Fujii, E.; Sato, M.; Yoshimasu, H. Quantitative evaluation of consistency of early invasive carcinoma of the tongue. Int. J. Clin. Oncol. 1999, 4, 220–223. [Google Scholar] [CrossRef]
  5. Markopoulos, A.K. Current aspects on oral squamous cell carcinoma. Open Dent. J. 2012, 6, 126. [Google Scholar] [CrossRef]
  6. Shingaki, M.; Nikkuni, Y.; Katsura, K.; Ikeda, N.; Maruyama, S.; Takagi, R.; Hayashi, T. Clinical significance of intraoral strain elastography for diagnosing early stage tongue carcinoma: A preliminary study. Oral Radiol. 2017, 33, 204–211. [Google Scholar] [CrossRef]
  7. Chu, C.A.; Chen, Y.J.; Chang, K.V.; Wu, W.T.; Ozcakar, L. Reliability of Sonoelastography Measurement of Tongue Muscles and Its Application on Obstructive Sleep Apnea. Front. Physiol. 2021, 12, 12. [Google Scholar] [CrossRef]
  8. Cheng, S.; Gandevia, S.C.; Green, M.; Sinkus, R.; Bilston, L.E. Viscoelastic properties of the tongue and soft palate using MR elastography. J. Biomech. 2011, 44, 450–454. [Google Scholar] [CrossRef]
  9. Sarvazyan, A.; Hall, T.J.; Urban, M.W.; Fatemi, M.; Aglyamov, S.R.; Garra, B.S. An Overview of Elastography—An Emerging Branch of Medical Imaging. Curr. Med. Imaging 2011, 7, 255–282. [Google Scholar] [CrossRef]
  10. Garra, B.S. Elastography: History, principles, and technique comparison. Abdom. Imaging 2015, 40, 680–697. [Google Scholar] [CrossRef]
  11. Doyley, M.M.; Parker, K.J. Elastography: General principles and clincial applications. Ultrasound Clin. 2014, 9, 1. [Google Scholar] [CrossRef] [PubMed]
  12. Drakonaki, E.; Allen, G.; Wilson, D. Ultrasound elastography for musculoskeletal applications. Brit. J. Radiol. 2012, 85, 1435–1445. [Google Scholar] [CrossRef] [PubMed]
  13. Venkatesh, S.K.; Yin, M.; Ehman, R.L. Magnetic resonance elastography of liver: Technique, analysis, and clinical applications. J. Magn. Reson. Imaging 2013, 37, 544–555. [Google Scholar] [CrossRef]
  14. Ye, H.L.; Rahul; Dargar, S.; Kruger, U.; De, S. Ultrasound elastography reliably identifies altered mechanical properties of burned soft tissues. Burns 2018, 44, 1521–1530. [Google Scholar] [CrossRef]
  15. Kishimoto, R.; Suga, M.; Koyama, A.; Omatsu, T.; Tachibana, Y.; Ebner, D.K.; Obata, T. Measuring shear-wave speed with point shear-wave elastography and MR elastography: A phantom study. BMJ Open 2017, 7, 6. [Google Scholar] [CrossRef]
  16. Khalil, A.S.; Chan, R.C.; Chau, A.H.; Bouma, B.E.; Mofrad, M.R.K. Tissue elasticity estimation with optical coherence elastography: Toward mechanical characterization of In vivo soft tissue. Ann. Biomed. Eng. 2005, 33, 1631–1639. [Google Scholar] [CrossRef] [PubMed]
  17. Kennedy, B.F.; Kennedy, K.M.; Sampson, D.D. A Review of Optical Coherence Elastography: Fundamentals, Techniques and Prospects. IEEE J. Sel. Top. Quantum Electron. 2014, 20, 17. [Google Scholar] [CrossRef]
  18. Mulligan, J.A.; Untracht, G.R.; Chandrasekaran, S.N.; Brown, C.N.; Adie, S.G. Emerging Approaches for High-Resolution Imaging of Tissue Biomechanics with Optical Coherence Elastography. IEEE J. Sel. Top. Quantum Electron. 2016, 22, 20. [Google Scholar] [CrossRef]
  19. Lan, G.; Singh, M.; Larin, K.V.; Twa, M.D. Common-path phase-sensitive optical coherence tomography provides enhanced phase stability and detection sensitivity for dynamic elastography. Biomed. Opt. Express 2017, 8, 5253–5266. [Google Scholar] [CrossRef]
  20. Wang, S.; Larin, K.V. Optical coherence elastography for tissue characterization: A review. J. Biophotonics 2015, 8, 279–302. [Google Scholar] [CrossRef]
  21. Qi, W.J.; Chen, R.M.; Chou, L.; Liu, G.J.; Zhang, J.; Zhou, Q.F.; Chen, Z.P. Phase-resolved acoustic radiation force optical coherence elastography. J. Biomed. Opt. 2012, 17, 3. [Google Scholar] [CrossRef] [PubMed]
  22. Singh, M.; Zvietcovich, F.; Larin, K.V. Introduction to optical coherence elastography: Tutorial. J. Opt. Soc. Am. A 2022, 39, 418–430. [Google Scholar] [CrossRef] [PubMed]
  23. Zaitsev, V.Y.; Matveyev, A.L.; Matveev, L.A.; Sovetsky, A.A.; Hepburn, M.S.; Mowla, A.; Kennedy, B.F. Strain and elasticity imaging in compression optical coherence elastography: The two-decade perspective and recent advances. J. Biophotonics 2021, 14, 32. [Google Scholar] [CrossRef] [PubMed]
  24. Lan, G.; Aglyamov, S.; Larin, K.V.; Twa, M.D. In vivo human corneal natural frequency quantification using dynamic optical coherence elastography: Repeatability and reproducibility. J. Biomech. 2021, 121, 110427. [Google Scholar] [CrossRef] [PubMed]
  25. Zvietcovich, F.; Larin, K.V. Wave-based optical coherence elastography: The 10-year perspective. Prog. Biomed. Eng. 2022, 4, 012007. [Google Scholar] [CrossRef] [PubMed]
  26. Li, Y.; Zhu, J.; Chen, J.J.; Yu, J.X.; Jin, Z.; Miao, Y.S.; Browne, A.W.; Zhou, Q.F.; Chen, Z.P. Simultaneously imaging and quantifying in vivo mechanical properties of crystalline lens and cornea using optical coherence elastography with acoustic radiation force excitation. APL Phontonics 2019, 4, 10. [Google Scholar] [CrossRef]
  27. Lan, G.; Aglyamov, S.R.; Larin, K.V.; Twa, M.D. In vivo human corneal shear-wave optical coherence elastography. Optom. Vis. Sci. 2021, 98, 58. [Google Scholar] [CrossRef]
  28. Es’Haghian, S.; Kennedy, K.M.; Gong, P.J.; Li, Q.Y.; Chin, L.X.; Wijesinghe, P.; Sampson, D.D.; McLaughlin, R.A.; Kennedy, B.F. In vivo volumetric quantitative micro-elastography of human skin. Biomed. Opt. Express 2017, 8, 2458–2471. [Google Scholar] [CrossRef]
  29. Du, Y.; Liu, C.H.; Lei, L.; Singh, M.; Li, J.S.; Hicks, M.J.; Larin, K.V.; Mohan, C. Rapid, noninvasive quantitation of skin disease in systemic sclerosis using optical coherence elastography. J. Biomed. Opt. 2016, 21, 9. [Google Scholar] [CrossRef]
  30. Qi, W.J.; Li, R.; Ma, T.; Shung, K.K.; Zhou, Q.F.; Chen, Z.P. Confocal acoustic radiation force optical coherence elastography using a ring ultrasonic transducer. Appl. Phys. Lett. 2014, 104, 4. [Google Scholar] [CrossRef]
  31. Chan, R.C.; Chau, A.H.; Karl, W.C.; Nadkarni, S.; Khalil, A.S.; Iftimia, N.; Shishkov, M.; Tearney, G.J.; Kaazempur-Mofrad, M.R.; Bouma, B.E. OCT-based arterial elastography: Robust estimation exploiting tissue biomechanics. Opt. Express 2004, 12, 4558–4572. [Google Scholar] [CrossRef] [PubMed]
  32. Zhang, D.; Li, C.H.; Huang, Z.H. Relaxation time constant based optical coherence elastography. J. Biophotonics 2020, 13, 13. [Google Scholar] [CrossRef] [PubMed]
  33. Yasin Alibhai, A.; Or, C.; Witkin, A.J. Swept source optical coherence tomography: A review. Curr. Ophthalmol. Rep. 2018, 6, 7–16. [Google Scholar] [CrossRef]
  34. McNabb, R.P.; Grewal, D.S.; Mehta, R.; Schuman, S.G.; Izatt, J.A.; Mahmoud, T.H.; Jaffe, G.J.; Mruthyunjaya, P.; Kuo, A.N. Wide field of view swept-source optical coherence tomography for peripheral retinal disease. Br. J. Ophthalmol. 2016, 100, 1377–1382. [Google Scholar] [CrossRef] [PubMed]
  35. Spaide, R.F.; Akiba, M.; Ohno-Matsui, K. Evaluation of peripapillary intrachoroidal cavitation with swept source and enhanced depth imaging optical coherence tomography. Retina 2012, 32, 1037–1044. [Google Scholar] [CrossRef] [PubMed]
  36. Li, C.H.; Guan, G.Y.; Reif, R.; Huang, Z.H.; Wang, R.K.K. Determining elastic properties of skin by measuring surface waves from an impulse mechanical stimulus using phase-sensitive optical coherence tomography. J. R. Soc. Interface 2012, 9, 831–841. [Google Scholar] [CrossRef] [PubMed]
  37. Qian, X.J.; Li, R.Z.; Li, Y.; Lu, G.X.; He, Y.M.; Humayun, M.S.; Chen, Z.P.; Zhou, Q.F. In vivo evaluation of posterior eye elasticity using shaker-based optical coherence elastography. Exp. Biol. Med. 2020, 245, 282–288. [Google Scholar] [CrossRef]
  38. Zhao, Y.; Chen, Z.; Saxer, C.; Xiang, S.; de Boer, J.F.; Nelson, J.S. Phase-resolved optical coherence tomography and optical Doppler tomography for imaging blood flow in human skin with fast scanning speed and high velocity sensitivity. Opt. Lett. 2000, 25, 114–116. [Google Scholar] [CrossRef]
  39. Nguyen, T.-M.; Song, S.; Arnal, B.; Wong, E.Y.; Huang, Z.; Wang, R.K.; O’Donnell, M. Shear wave pulse compression for dynamic elastography using phase-sensitive optical coherence tomography. J. Biomed. Opt. 2014, 19, 016013. [Google Scholar] [CrossRef]
  40. Li, J.; Wang, S.; Manapuram, R.K.; Singh, M.; Menodiado, F.M.; Aglyamov, S.; Emelianov, S.; Twa, M.D.; Larin, K.V. Dynamic optical coherence tomography measurements of elastic wave propagation in tissue-mimicking phantoms and mouse cornea in vivo. J. Biomed. Opt. 2013, 18, 121503. [Google Scholar] [CrossRef]
  41. Xu, X.; Zhu, J.; Chen, Z. Dynamic and quantitative assessment of blood coagulation using optical coherence elastography. Sci. Rep.-UK 2016, 6, 24294. [Google Scholar] [CrossRef] [PubMed]
  42. Wang, S.; Lopez, A.L.; Morikawa, Y.; Tao, G.; Li, J.; Larina, I.V.; Martin, J.F.; Larin, K.V. Noncontact quantitative biomechanical characterization of cardiac muscle using shear wave imaging optical coherence tomography. Biomed. Opt. Express 2014, 5, 1980–1992. [Google Scholar] [CrossRef] [PubMed]
  43. Wang, S.; Larin, K.V.; Li, J.S.; Vantipalli, S.; Manapuram, R.K.; Aglyamov, S.; Emelianov, S.; Twa, M.D. A focused air-pulse system for optical-coherence-tomography-based measurements of tissue elasticity. Laser Phys. Lett. 2013, 10, 6. [Google Scholar] [CrossRef]
  44. Zaitsev, V.Y.; Matveyev, A.L.; Matveev, L.A.; Gelikonov, G.V.; Omelchenko, A.I.; Baum, O.I.; Avetisov, S.E.; Bolshunov, A.V.; Siplivy, V.I.; Shabanov, D.V. Optical coherence elastography for strain dynamics measurements in laser correction of cornea shape. J. Biophotonics 2017, 10, 1450–1463. [Google Scholar] [CrossRef] [PubMed]
  45. Wojtkowski, M. High-speed optical coherence tomography: Basics and applications. Appl. Opt. 2010, 49, D30–D61. [Google Scholar] [CrossRef] [PubMed]
  46. Srinivasan, V.J.; Adler, D.C.; Chen, Y.L.; Gorczynska, I.; Huber, R.; Duker, J.S.; Schuman, J.S.; Fujimoto, J.G. Ultrahigh-Speed Optical Coherence Tomography for Three-Dimensional and En Face Imaging of the Retina and Optic Nerve Head. Investig. Ophthalmol. Vis. Sci. 2008, 49, 5103–5110. [Google Scholar] [CrossRef]
  47. Carrion, L.; Lestrade, M.; Xu, Z.; Touma, G.; Maciejko, R.; Bertrand, M. Comparative study of optical sources in the near infrared for optical coherence tomography applications. J. Biomed. Opt. 2007, 12, 014017–014018. [Google Scholar] [CrossRef]
  48. Ishida, S.; Nishizawa, N. Quantitative comparison of contrast and imaging depth of ultrahigh-resolution optical coherence tomography images in 800–1700 nm wavelength region. Biomed. Opt. Express 2012, 3, 282–294. [Google Scholar] [CrossRef]
  49. Mao, Y.; Flueraru, C.; Chang, S.; Popescu, D.P.; Sowa, M.G. Performance analysis of a swept-source optical coherence tomography system with a quadrature interferometer and optical amplification. Opt. Commun. 2011, 284, 2622–2627. [Google Scholar] [CrossRef]
  50. Kimura, M.; Nozaki, M.; Yoshida, M.; Ogura, Y. Wide-field optical coherence tomography angiography using extended field imaging technique to evaluate the nonperfusion area in retinal vein occlusion. Clin. Ophthalmol. 2016, 10, 1291–1295. [Google Scholar] [CrossRef]
  51. Hirano, T.; Kakihara, S.; Toriyama, Y.; Nittala, M.G.; Murata, T.; Sadda, S. Wide-field en face swept-source optical coherence tomography angiography using extended field imaging in diabetic retinopathy. Br. J. Ophthalmol. 2018, 102, 1199–1203. [Google Scholar] [CrossRef] [PubMed]
  52. Xi, J.F.; Huo, L.; Li, J.S.; Li, X.D. Generic real-time uniform K-space sampling method for high-speed swept-Source optical coherence tomography. Opt. Express 2010, 18, 9511–9517. [Google Scholar] [CrossRef] [PubMed]
Figure 1. Schematic of the shaker-based OCE system.
Photonics 10 01143 g001
Figure 2. Timing diagram of the M-B mode.
Photonics 10 01143 g002
Figure 3. Imaging results of the phantom. (a) 2D OCT image, (bf) Maps of shear wave propagation at different time points.
Photonics 10 01143 g003
Figure 4. 3D image of shear wave propagation in the phantom (The scale bars in depth (z) are used to describe the tissue vibration depth induced by the excitation unit).
Photonics 10 01143 g004
Figure 5. Spatiotemporal OCT image of shear wave of the phantom.
Photonics 10 01143 g005
Figure 6. Imaging results of the right side of the dorsum linguae. (a) 2D OCT image, (bf) Maps of shear wave propagation at different time points.
Photonics 10 01143 g006
Figure 7. 3D image of shear wave propagation in the right side of the dorsum linguae.
Photonics 10 01143 g007
Figure 8. Spatiotemporal Doppler OCT image of the right side of the dorsum linguae.
Photonics 10 01143 g008
Figure 9. Imaging results of the left side of the dorsum linguae. (a) 2D OCT image, (bf) Maps of shear wave propagations at different time points.
Photonics 10 01143 g009
Figure 10. 3D image of shear wave propagation in the left side of the dorsum linguae.
Photonics 10 01143 g010
Figure 11. Spatiotemporal Doppler OCT image of the left side of the dorsum linguae.
Photonics 10 01143 g011
Figure 12. Imaging results of the ventral surface of the tongue. (a) 2D OCT image, (bf) Maps of elastic wave propagations at different time points.
Photonics 10 01143 g012
Figure 13. 3D image of shear wave propagation in the ventral surface of the tongue.
Photonics 10 01143 g013
Figure 14. Spatiotemporal Doppler OCT image of the ventral surface of the tongue.
Photonics 10 01143 g014
Figure 15. Boxplot of Young’s modulus of three parts of the tongue.
Photonics 10 01143 g015
Disclaimer/Publisher’s Note: The statements, opinions and data contained in all publications are solely those of the individual author(s) and contributor(s) and not of MDPI and/or the editor(s). MDPI and/or the editor(s) disclaim responsibility for any injury to people or property resulting from any ideas, methods, instructions or products referred to in the content.

