Communication

Micro-Nonuniformity of the Luminescence Parameters in Compositionally Disordered GYAGG:Ce Ceramics

1
National Research Center “Kurchatov Institute”, 123098 Moscow, Russia
2
NRC “Kurchatov Institute”—IREA, 107076 Moscow, Russia
3
Center for Materials Technologies, Skolkovo Institute of Science and Technology, 121205 Moscow, Russia
4
Institute for Nuclear Problems, Belarus State University, 11 Bobruiskaya, 220030 Minsk, Belarus
*
Author to whom correspondence should be addressed.
Photonics 2023, 10(1), 54; https://doi.org/10.3390/photonics10010054
Submission received: 30 November 2022 / Revised: 30 December 2022 / Accepted: 31 December 2022 / Published: 4 January 2023

Abstract

:
The nonuniformity of the photoluminescence properties in a single grain scale of (Gd,Y)3Al2Ga3O12:Ce (GYAGG:Ce) ceramics was studied by scanning confocal microscopy and fluorescence lifetime imaging microscopy (FLIM). Oxide powders Gd1.5−xCexY1.5Al2Ga3O12 (x = 0.005, 0.015, 0.060) were fabricated by co-precipitation and thermally treated. Transparent ceramics samples were obtained in an oxygen atmosphere by pressureless sintering. With increasing Ce concentration in the composition, photoluminescence intensity at the grain boundaries decreases in comparison with the inner volume. Meanwhile, photoluminescence kinetics show the opposite behavior—slower at the grain boundaries and faster at the grain volume. These effects are found to be the most pronounced for the ceramic sample with a Ce content of 0.060 f.u. and are the consequence of an increase in the heterogeneity of the activator distribution at its high concentration in the ceramics. This observation set a limit in the Ce concentration in GYAGG:Ce garnet-type ceramics to reach the high-performing photo-luminescence features.

1. Introduction

Compositionally disordered garnet-structure crystalline compounds in the form of ceramics and single crystals have good prospects for wide application as converters of excitation energy into light, for example, in laser systems, devices for illumination and photocatalysis [1,2,3,4,5,6,7] and as scintillators [8,9,10,11,12,13,14]. Three important aspects of such phosphors activated by ions having a d-type emitting level (Ce3+, Pr3+) should be noted. First, in such compounds, it is possible to control the position of this level in the conduction band by creating a compositional disorder in the Al/Ga and Gd/RE cationic sublattices (where RE are rare earth elements and yttrium) [15,16]. Second, in the case of using these materials as scintillators, it is also possible to increase the efficiency of transferring the energy of electronic excitations to the activator ions Ce3+, Tb3+ [17]. Finally, the crystal lattice of garnet, which has a cubic space group of symmetry, makes it possible to synthesize powders with many doping ions and obtain ceramics from them, as well as to manufacture ceramics from mixtures of powders of the same type with one dopant, for example, only with Ce, Tb or Eu [18]. Such a method of manufacturing luminescent ceramics provides inhomogeneous stabilization of each type of ion in the grains, which reduces the likelihood of interaction between ions of different types. This reduces the effects of luminescence quenching. Compositional disorder in the garnet lattice, in addition to the above features, also leads to spatial nonequivalence of activator localization positions, in particular, oxygen dodecahedrons, in which impurity RE ions are localized. It was shown in [19] that in Gd3Al2Ga3O12:Ce and (Gd,Y)3Al2Ga3O12:Ce single crystals, the luminescence band is inhomogeneously broadened; it is formed not by one, as in binary garnets, but by at least two doublets due to radiative transitions to the 2F5/2, 7/2 ground state. This also causes a change in the luminescence emission time along the spectral contour of the band. In contrast to single crystals, significant changes are also introduced by the presence of boundaries between grains in ceramics. In [20], the segregation of Ce activator ions near the grain boundaries in Gd3Al2Ga3O12:Ce ceramics was noted. For the first time, they demonstrated a change in the luminescence intensity from the center to the grain boundaries and a slight red shift of the luminescence band in the same direction. Partial substitution of Gd ions by Y ions in the sublattice leads to a fluctuation of the crystalline field straight [21]. This fluctuation at the crystal cell level includes an additional inhomogeneous broadening of the luminescence band and significant decay time dispersion along the luminescence band contour. However, the replacement of gadolinium ions by yttrium ions with a smaller ionic radius can lead to compensation of lattice distortions introduced when aluminum ions are replaced by larger gallium ions. This can affect both the solubility of the activator in the transition from ternary to quaternary garnet, and the distribution of the activator in the volume and at the grain boundary.
In this contribution, we report the study results of changes in luminescence parameters in the (Gd,Y)3Al2Ga3O12:Ce quaternary garnet at the micro level within a single randomly selected grain when the activator concentration was varied. We also limited ourselves to the excitation of Ce3+ ions to the lower excited state 5d1 in order to minimize the influence of point structure defects creating the deep traps in the matrix. The measurements were performed for a set of grains and confirmed the generality of the observations and conclusions made in the work.

2. Materials and Methods

Co-precipitation followed by heat treatment was used to produce oxide powders. This method makes it possible to synthesize a product with a high degree of homogeneity and reduce the temperature of garnet phase formation—which leads to decreasing the evaporation of Ga-containing components [22,23]. The synthesized powders were ground, compacted and sintered for the ceramic material.
Typical precursor containing Gd, Y, Al, Ga and Ce was synthesized by co-precipitation from mixed nitrate solutions, which were obtained from commercially available Gd2O3 (99.995% purity, Inner Mongolia Baotou Steel Rare Earth (group) Hi-Tech Co., LTD, Baotou, China), Y2O3 (99.995% purity, JSC “Vekton”, Saint Petersburg, Russia), AlOOH (99.998% purity, LLC “Prima”, Sarov, Russia), Ga (99.999% purity, RareEarthRF, Novosibirsk, Russia) and Ce(NO3)3 (99.95% purity, JSC ”Vekton”, Saint Petersburg, Russia). Raw materials containing the main components were dissolved in nitric acid (high-purity grade, LLC “Component-Reaktiv”, Moscow, Russia), a Ce(NO3)3—in deionized water (with special resistivity of 18 MΩ × cm). The individual metal solutions were mixed in a ratio depending on the desired composition of the synthesized powder and diluted with water to a total metal concentration of 1 mol/L. Next, the mixed solution was slowly added to the precipitant—a solution of ammonium bicarbonate NH4HCO3 (99.95% purity, KAO “Azot”, Kemerovo, Russia) with a concentration of 1.5 mol/L, under constant stirring with an overhead stirrer. Hydroxocarbonate precipitate was filtered off on a Buchner funnel, washed with a mixture of water and isopropanol and dried for 8 h at 100 °C in a forced convection oven. Finally, the precursor was thermally treated at 850 °C for 2 h to decompose the carbonates and form the garnet phase.
The synthesized powders were milled down to a median particle size of 1.0–1.2 μm in a planetary ball mill Retsch PM100 with corundum grinding media. Representative X-ray diffraction pattern and SEM images of initial powder are presented in Supplementary materials (Figures S1 and S2). Green bodies were prepared by uniaxial pressing at 64 MPa into 1.5 mm-thick disks of 20 mm in diameter. Compacts were pressureless sintered in an oxygen atmosphere for 2 h at 1650 °C. The resulting ceramic samples were translucent and had a density of ~99% of the theoretical one. Table 1 shows the numbers and compositions of the samples.
The ceramics were polished on a POLYLAB P12M polishing machine using sequentially replaced silicon carbide grinding wheels with a grain size of 50 to 3 µm and Kemet Aquapol-M diamond suspensions with a particle size of 0.5 to 0.1 µm. The polished samples intended for scanning electron microscopy were thermally etched for 10 min at 1200 °C to reveal grain boundaries.
Ceramic microstructure was studied using a Jeol JSM-7100F (JEOL, Ltd., Tokyo, Japan) scanning electron microscope with a Schottky cathode and a resolution of 3 nm at an accelerating voltage of 6 kV. SEM images were obtained in backscattered electron mode. Processing of the SEM images to determine the average grain sizes of ceramics was carried out using ImageJ software [24], measuring transverse dimensions of at least 300 grains for ceramics of each composition. Spatial distribution of luminescence intensity and spectral center of mass were studied on a WITec Alpha 300 S scanning confocal microscope according to the method described in [20]. Fluorescence lifetime imaging microscopy (FLIM) was performed on a PicoQuant MicroTime 200 confocal microscope with the excitation at 402 nm (repetition rate 3 MHz, pulse width 16 ps). Imaging was performed with an OlympusUPlanSApo 100 × 1.4 NA lens, image size was 600 × 600 pixels with an acquisition time of 0.8 ms/pixel, i.e., the acquisition time for the entire 80 × 80 µm image was 345 s.

3. Results and Discussion

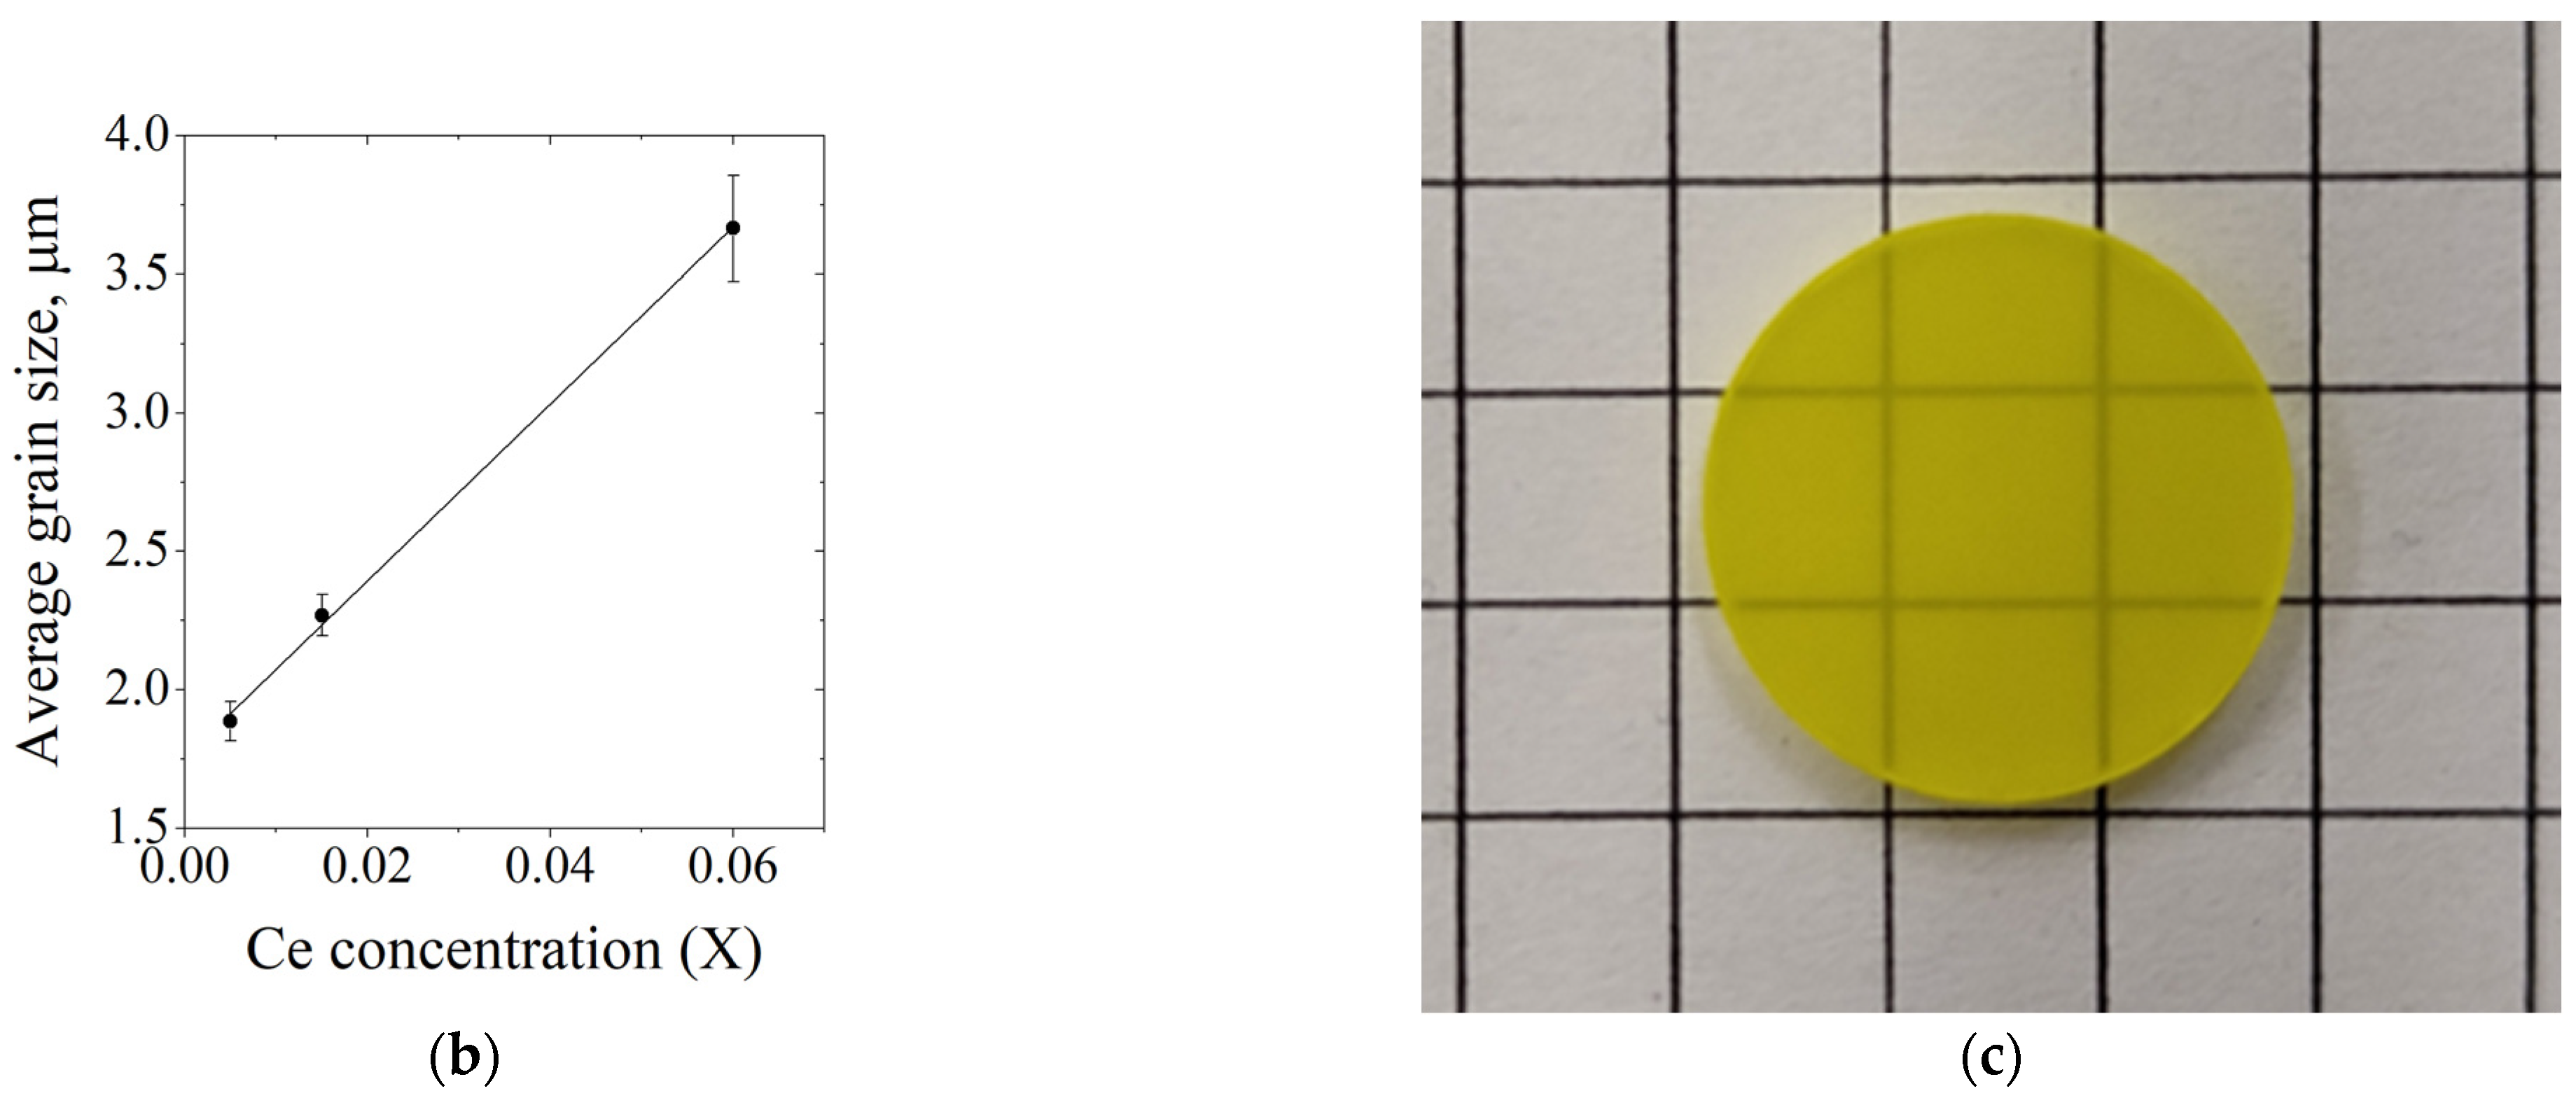
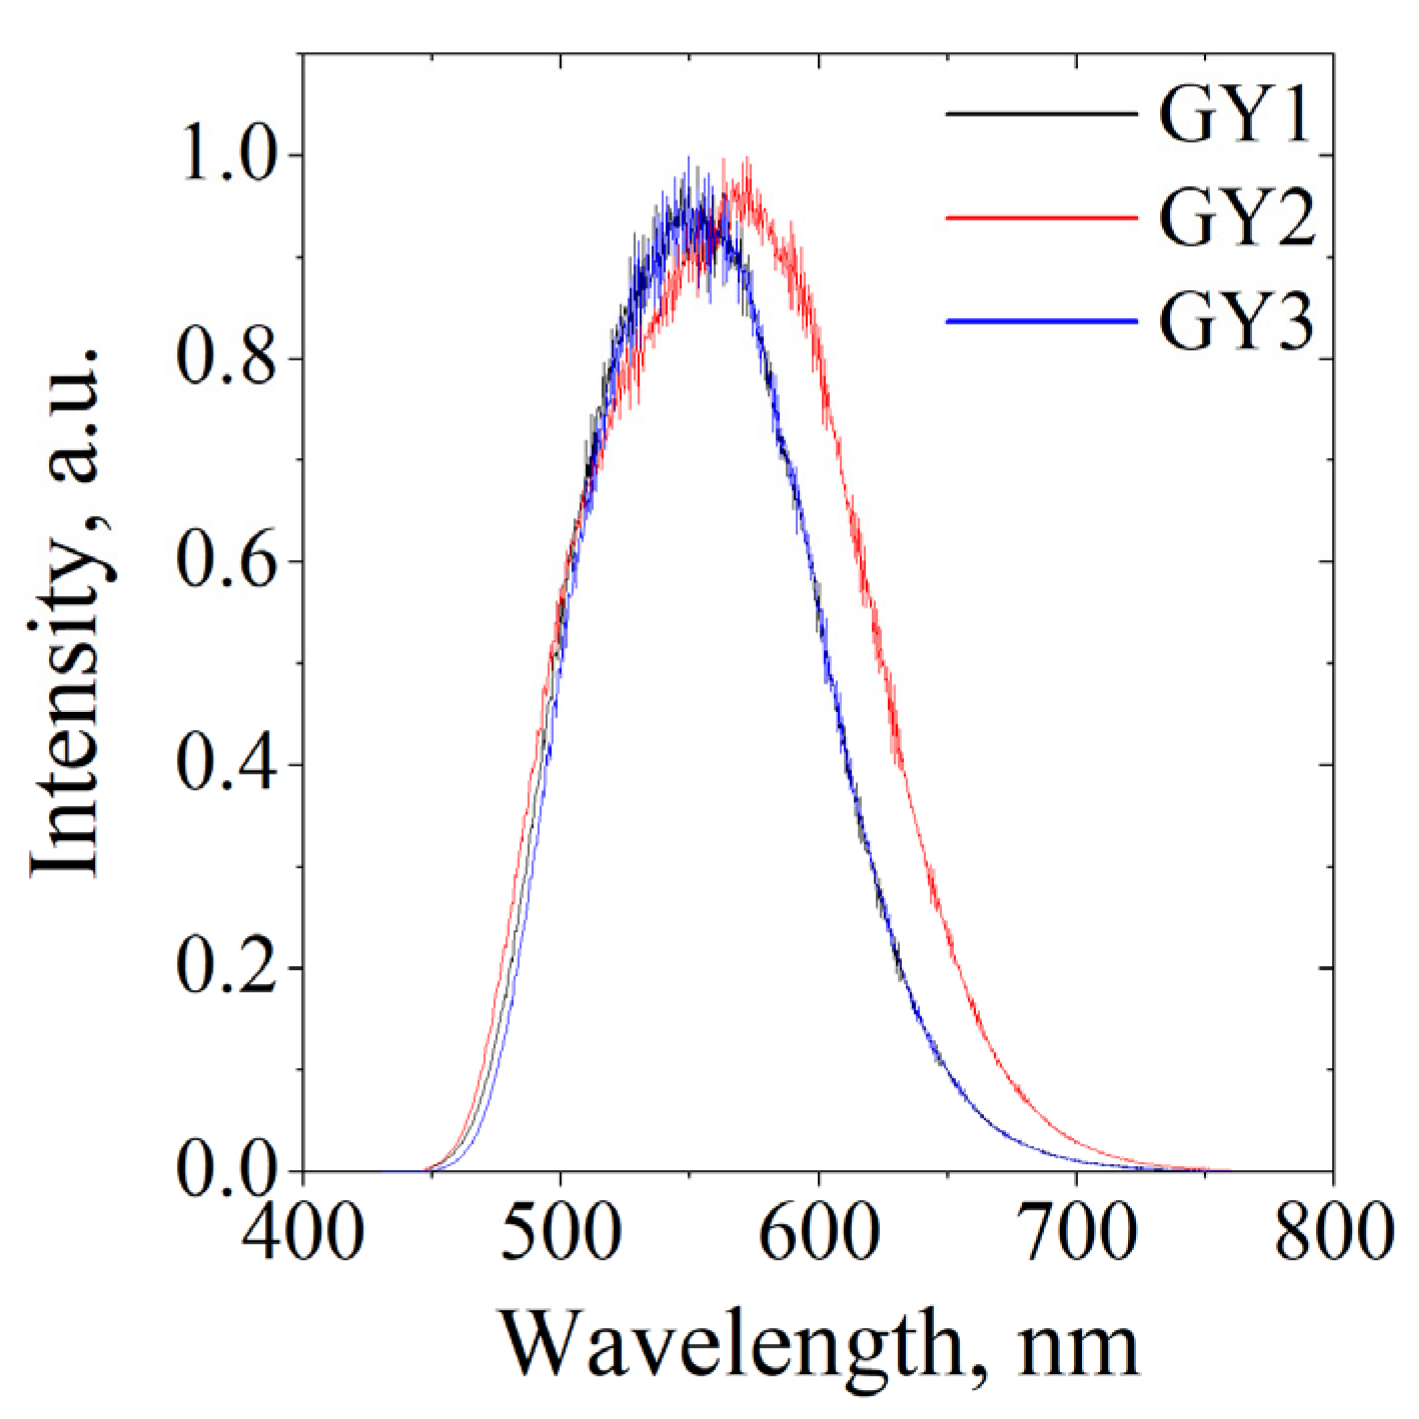
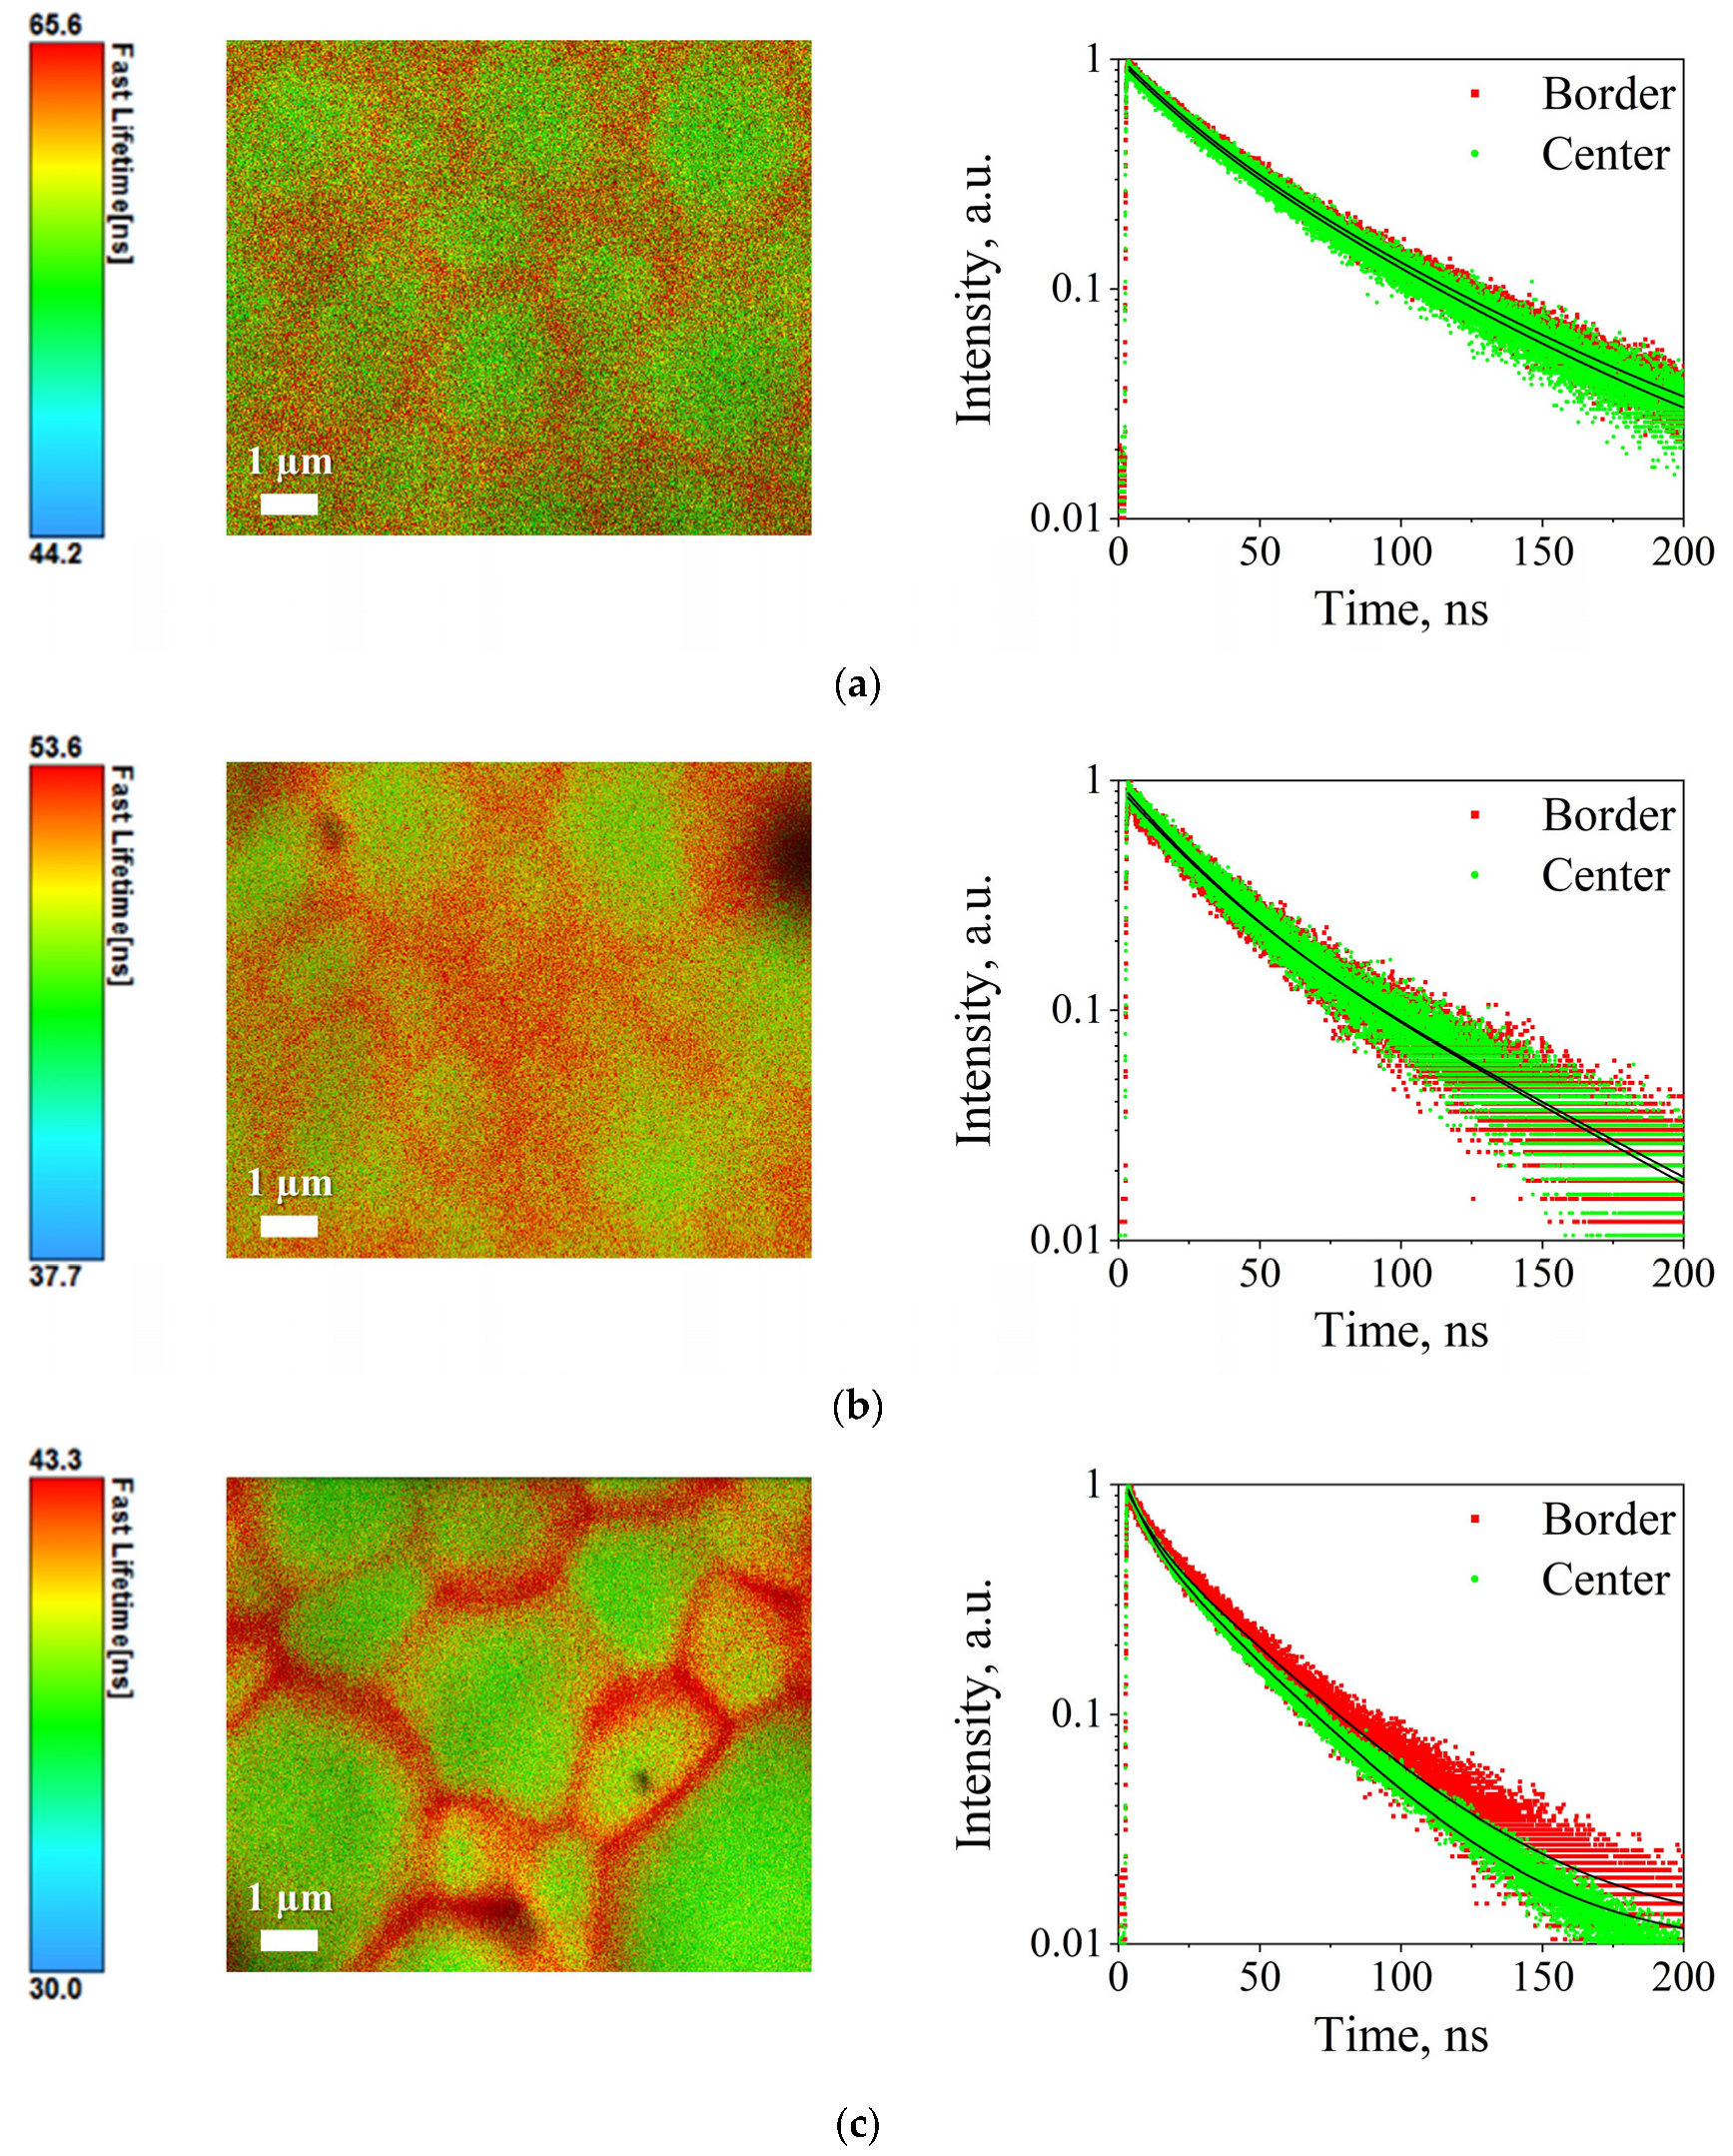
3.1. Microstructure of Ceramics

Figure 1 shows the SEM images of ceramics, dependence of the average grain size on the composition and transparency of a typical sample. The differences in grain contrast in the images obtained in the backscattered electron mode can be explained by different grain orientations. Additional SEM image for the ceramic sample GY3, X-ray diffraction patterns for all ceramic samples and EDX image for the ceramic sample GY3 are presented in Supplementary Materials as Figures S3, S4 and S5, respectively. Optical transmission curves for all ceramic samples are presented on Figure S6.
An increase in the average grain size with an increase in the Ce concentration in the ceramics was found. Previously, we demonstrated for Gd3Al2Ga3O12 composition [25] that Gd deficiency at a fixed Ce content promotes the formation of cationic vacancies in the dodecahedral sites of the garnet lattice, which inevitably leads to the appearance of anionic vacancies and a significant acceleration of grain growth. In the results obtained in this work, this effect is also present, but less pronounced, which may be due to the ability of CeO2 to act as a grain growth inhibitor, as is known from the works [26,27].

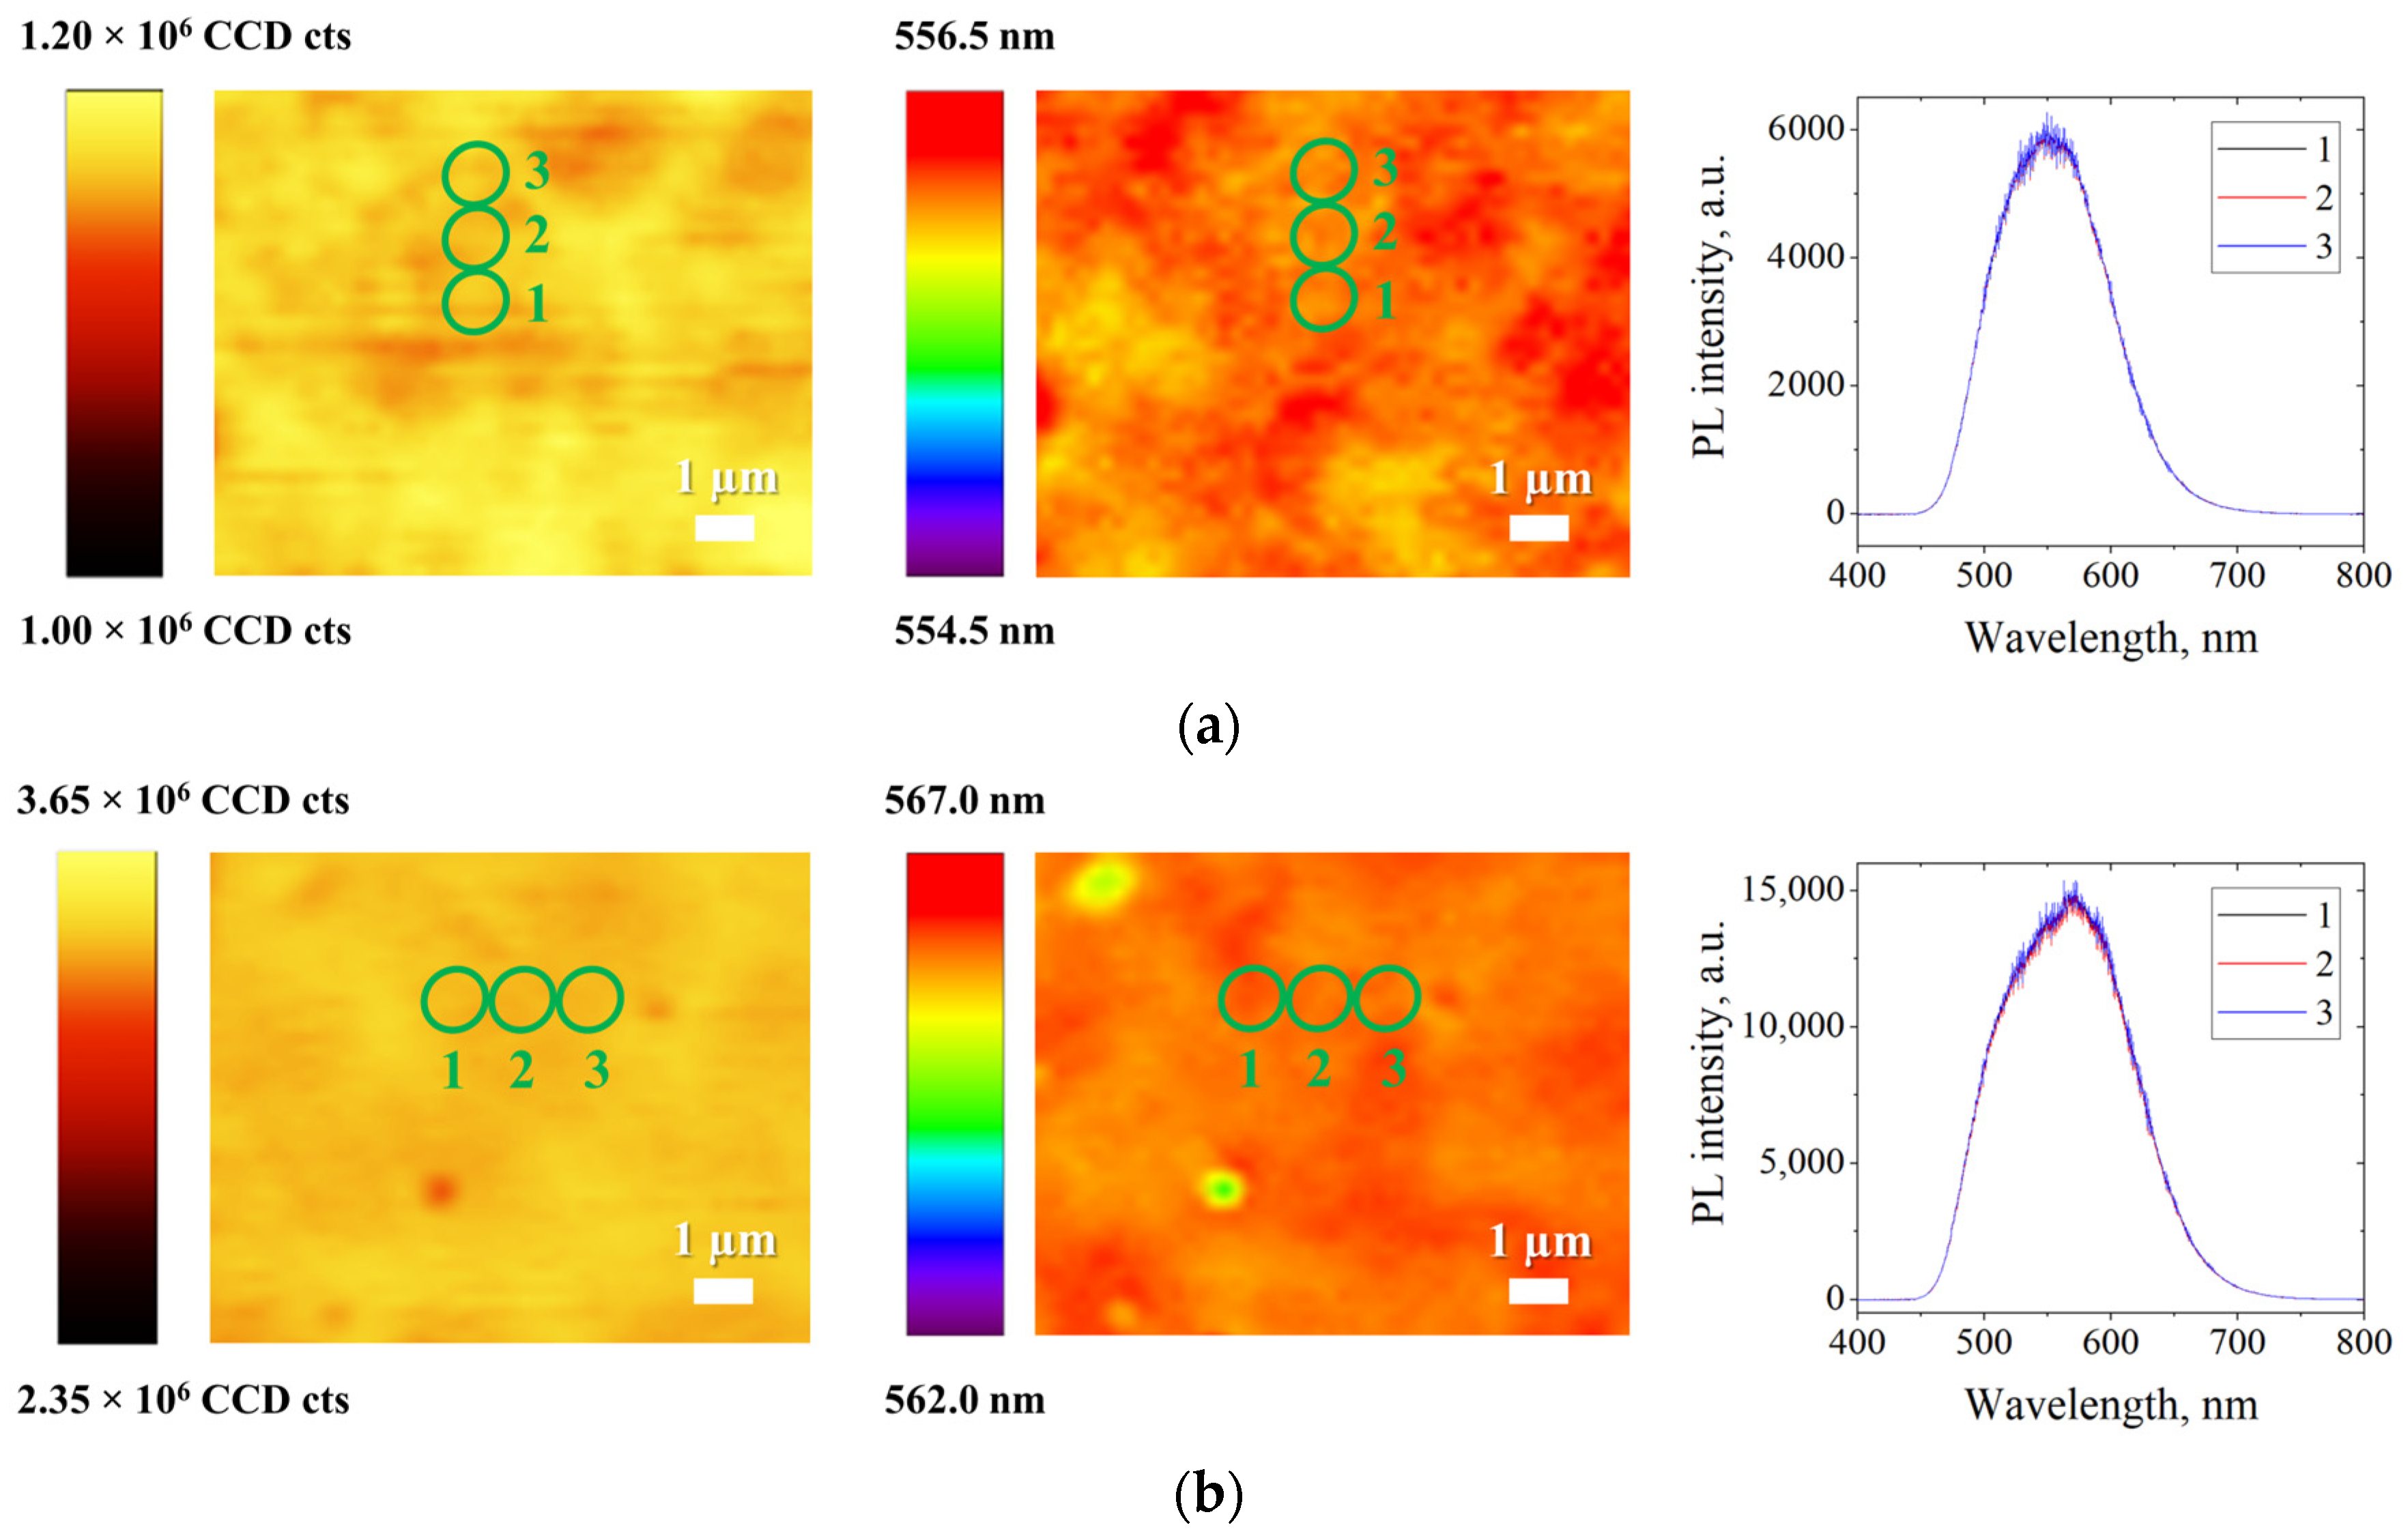
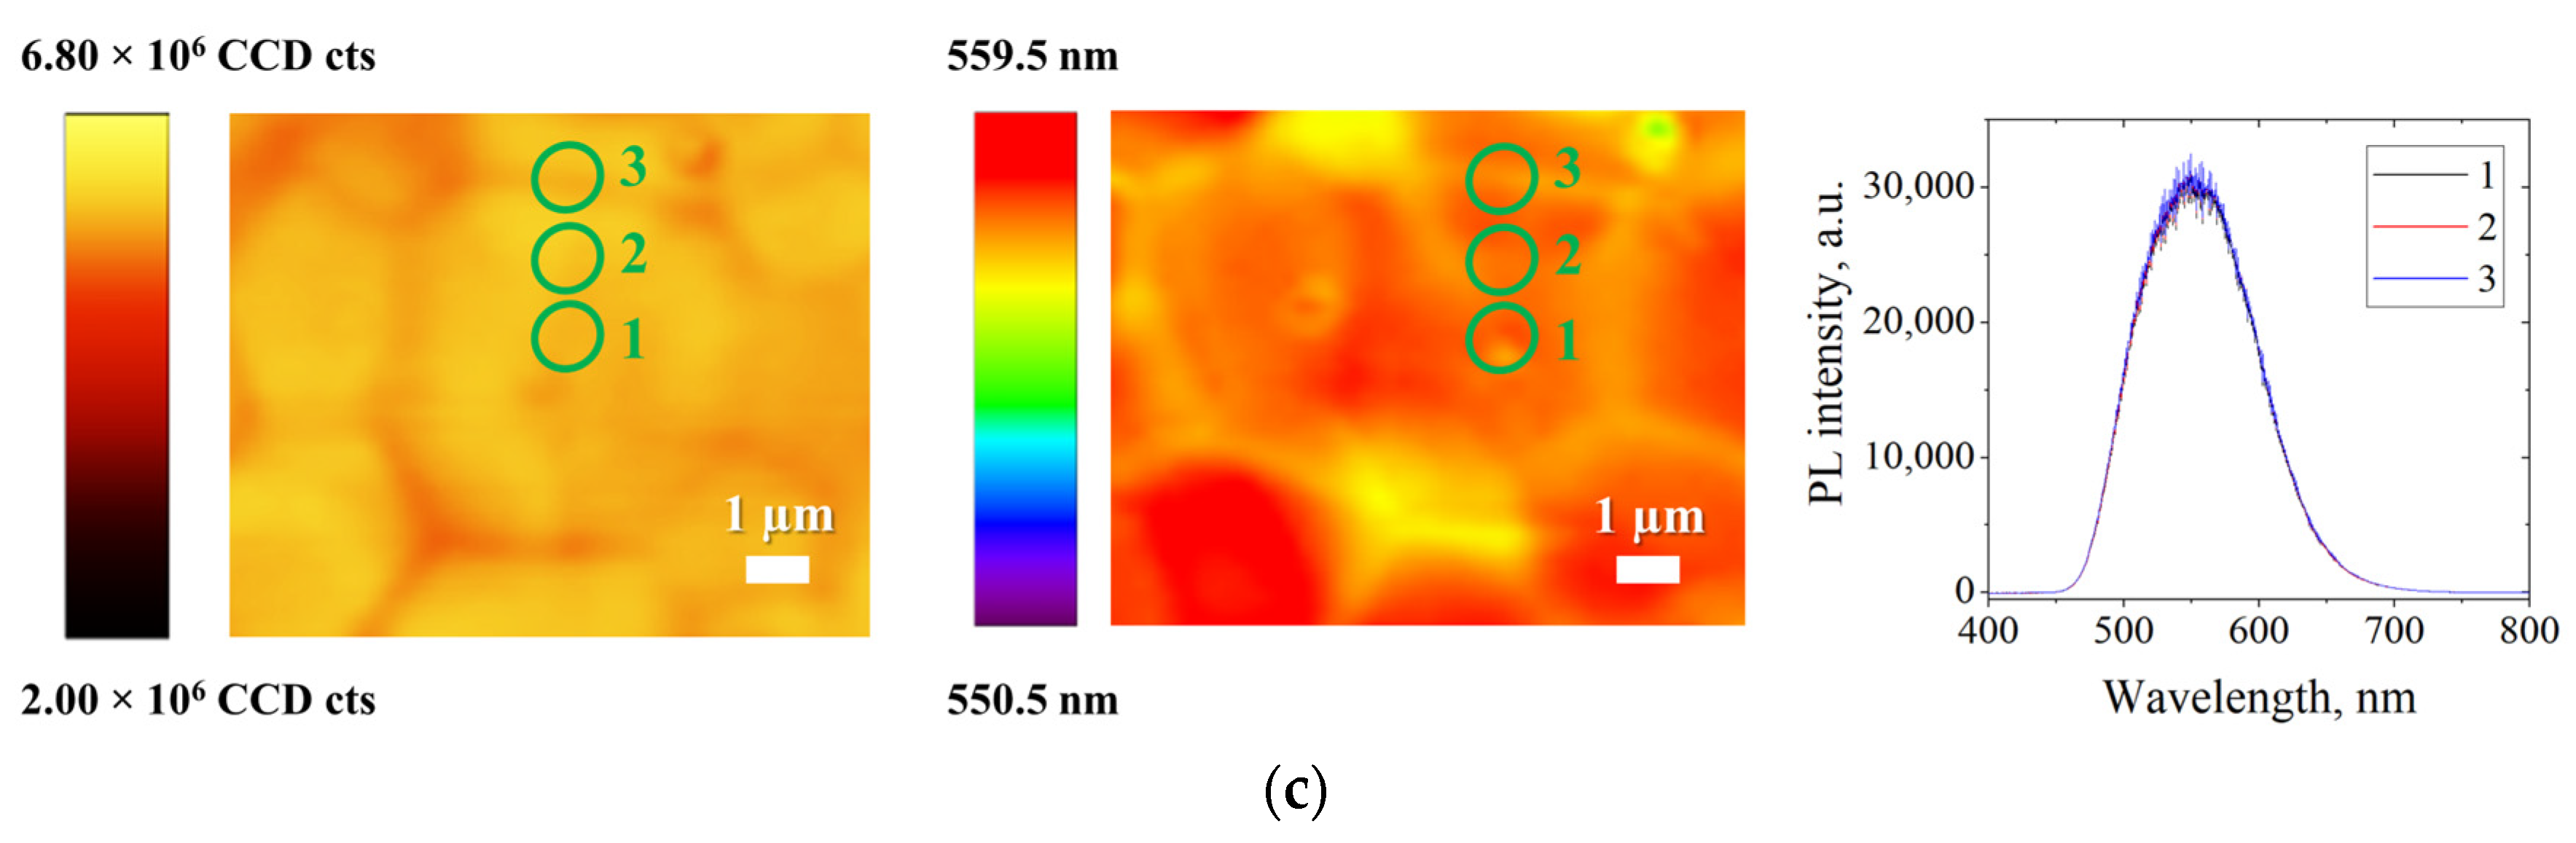
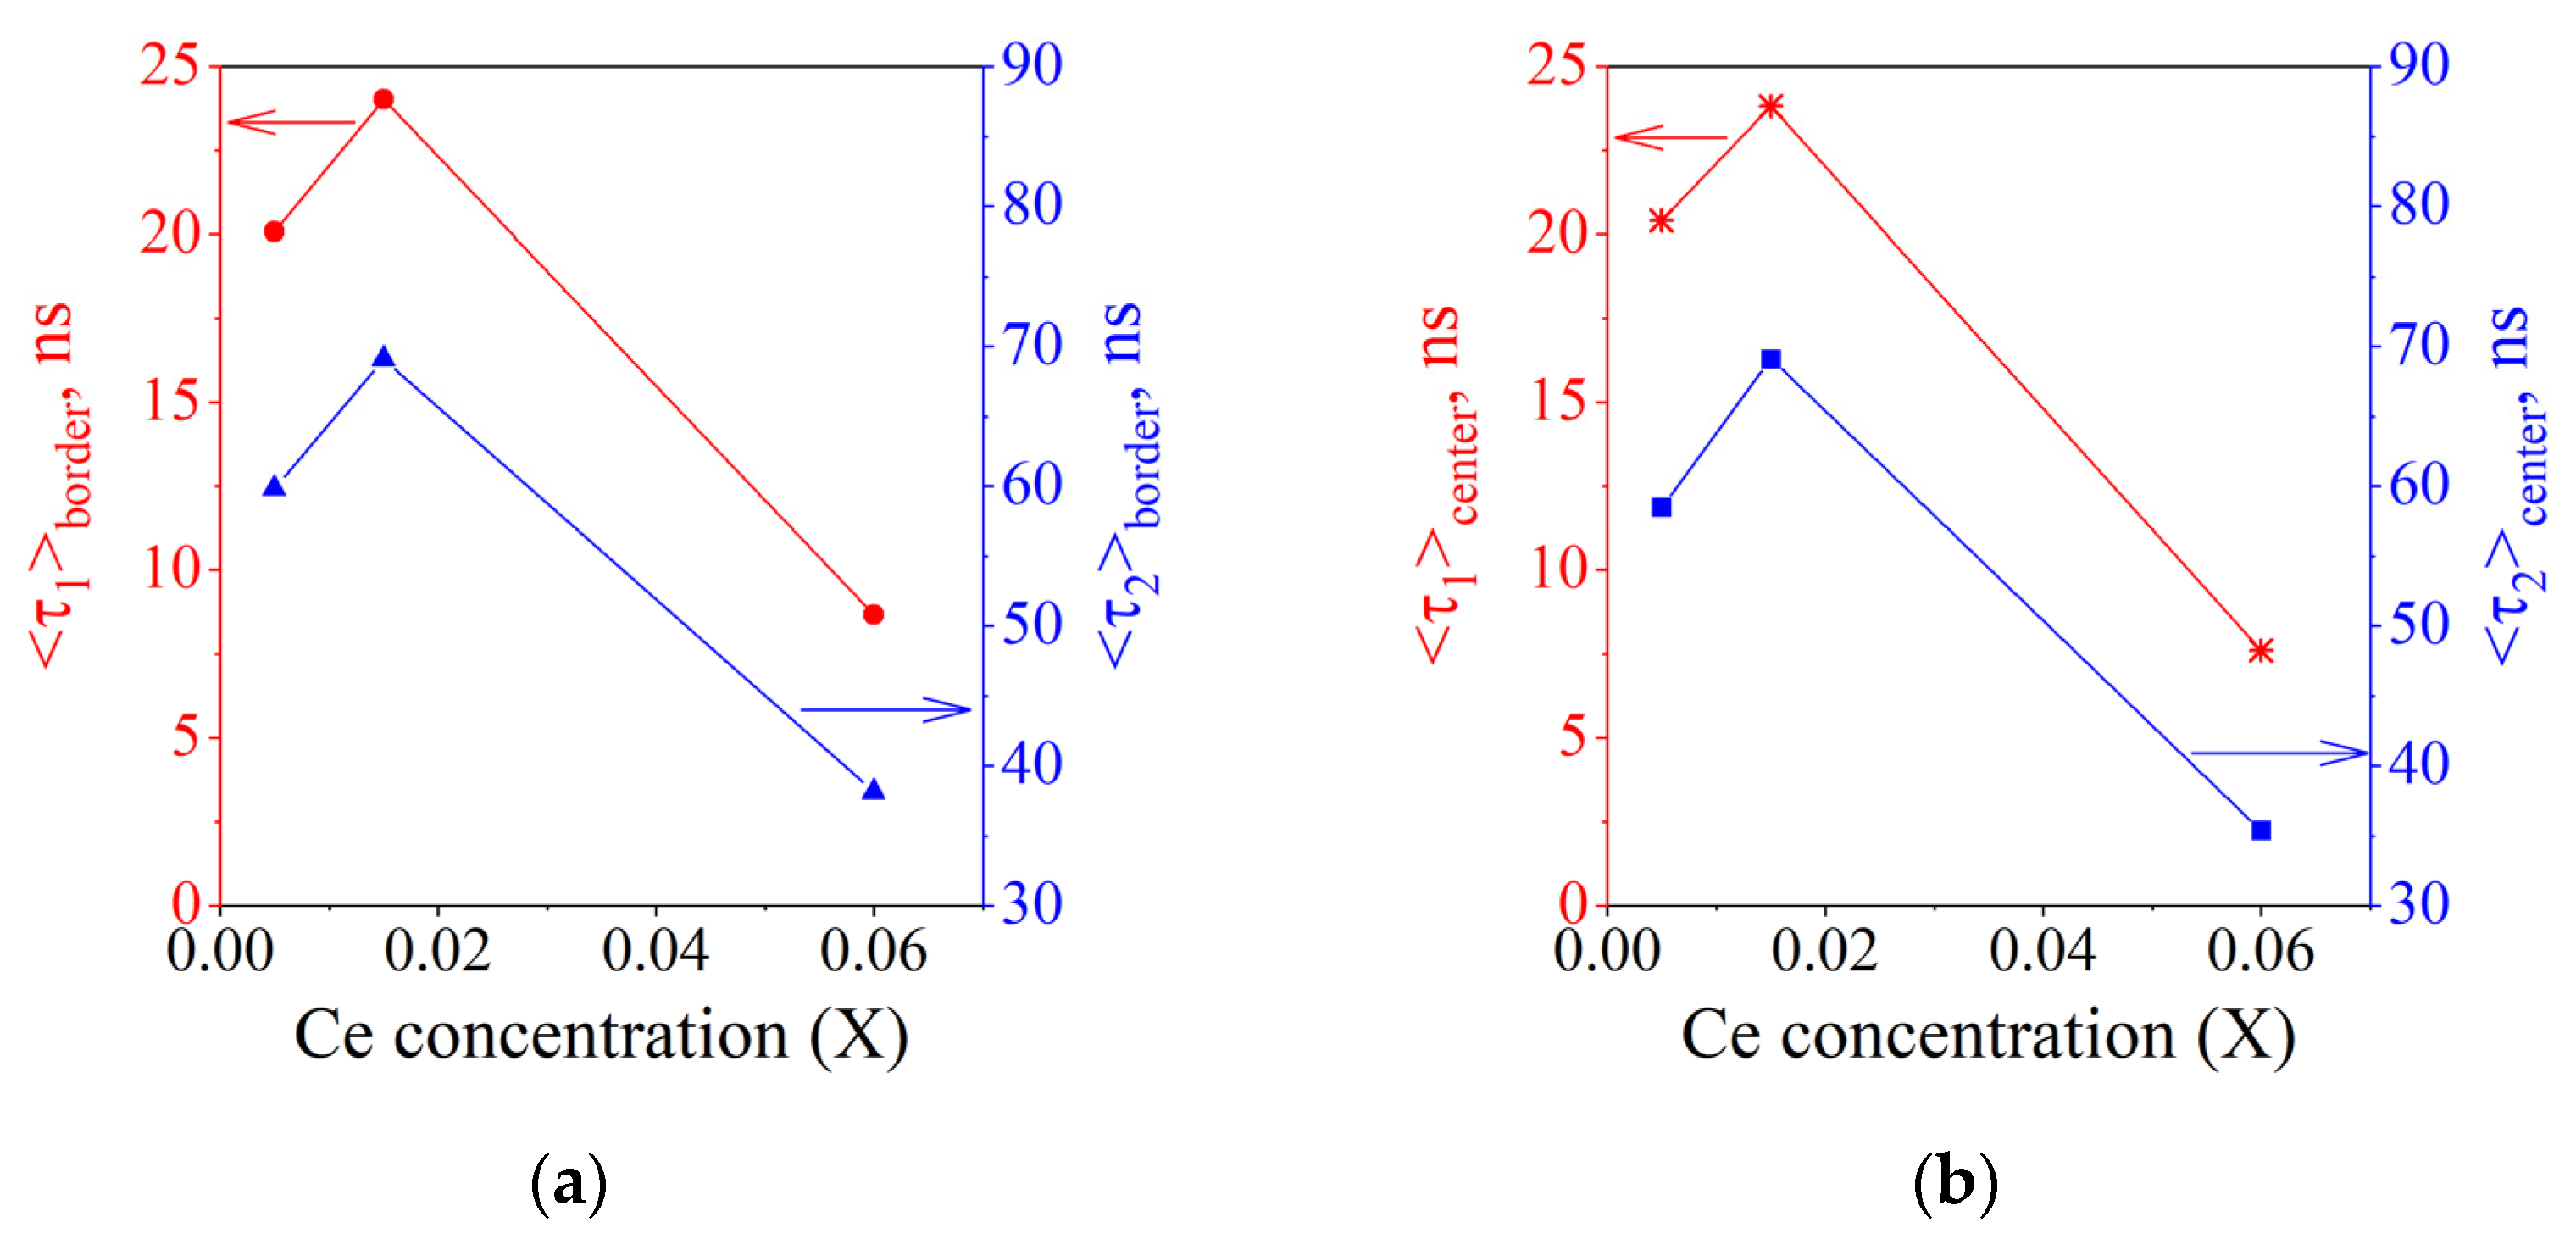
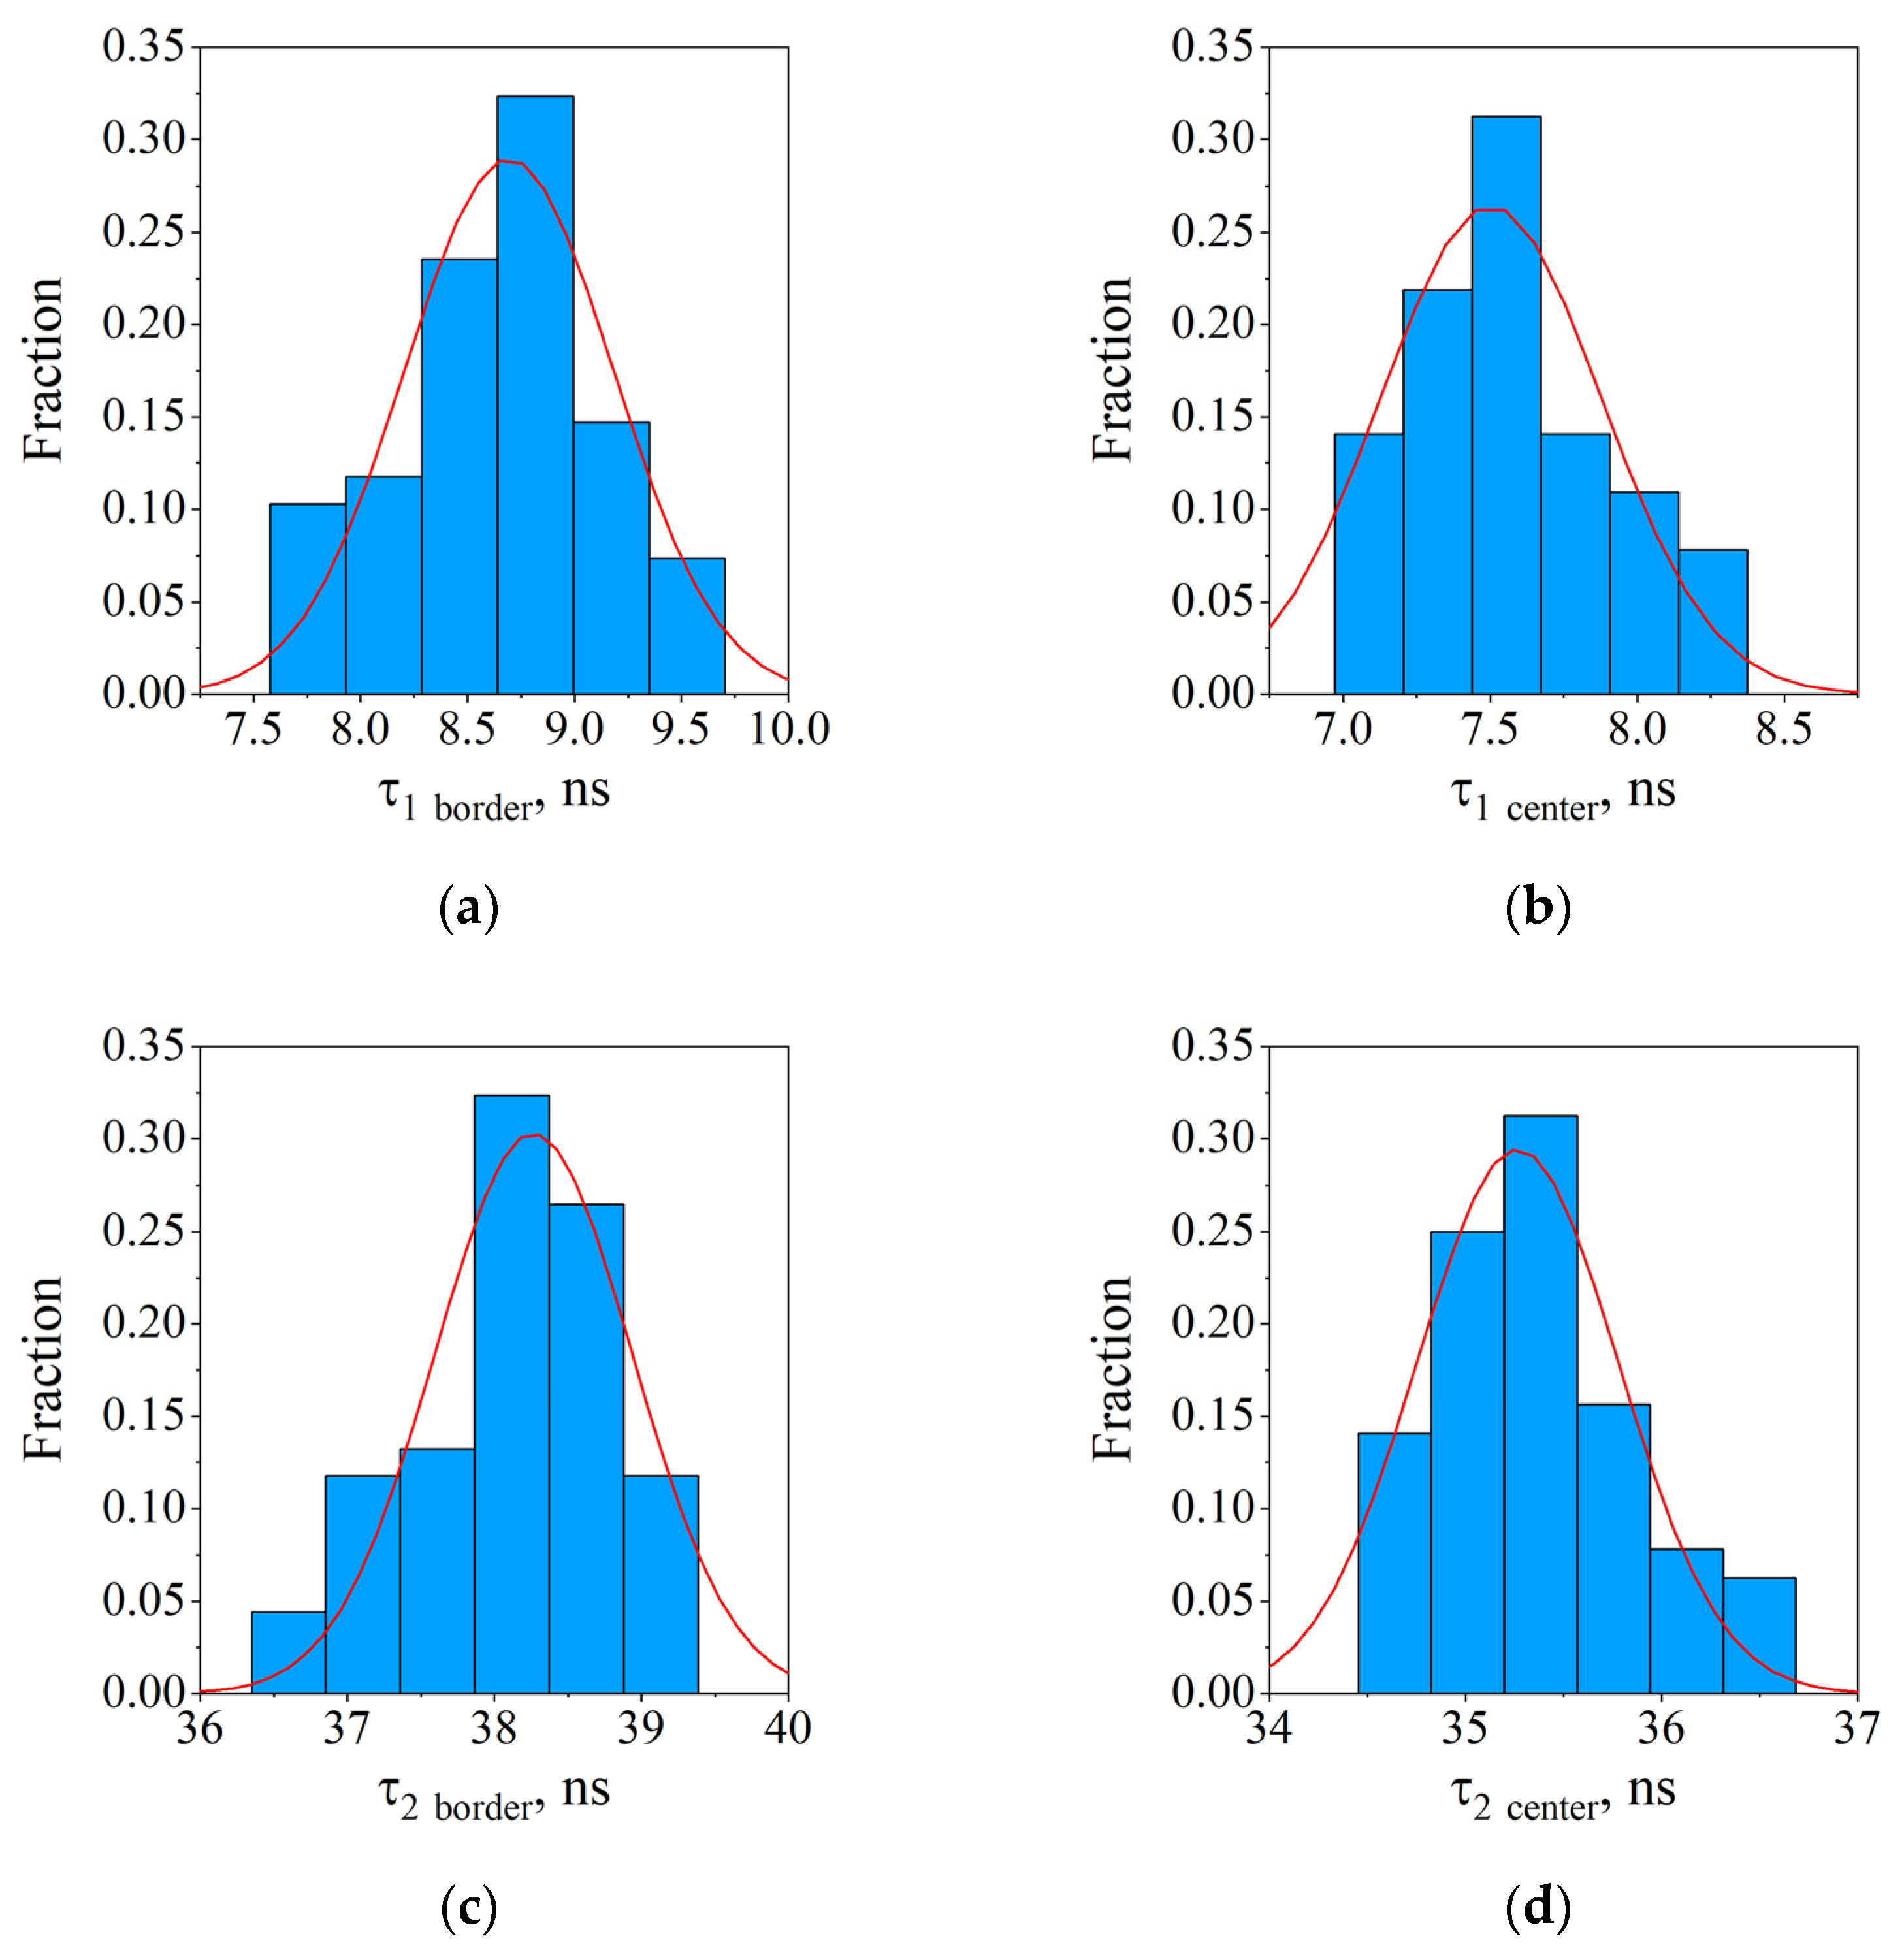
3.2. Spatial Distribution of Photoluminescence Properties

The spatial distribution of PL intensity (spectrally integrated from 450 to 730 nm) and the spectral center of mass, showing the position of the maximum PL band, were studied using confocal scanning microscopy, and the results are presented in Figure 2.
For quaternary garnets, the luminescence spectrum was maintained within the grain at all studied concentrations of the activator, while the spectra at the lowest and highest Ce concentrations practically coincided, as seen in Figure 3. However, for the middle Ce concentration, the spectrum was broadened due to the increase in the long wavelength part. In this work, we did not investigate the nature of the difference in the spectra; it was aimed to show that the spectrum within a randomly selected grain practically did not change when the excitation point was transferred from the center to the boundary. We also note that, at the lowest activator concentration, the luminescence intensity increased toward the grain edges; it was less pronounced than in the ternary garnet GAGG:Ce [20]. At the highest Ce3+ concentration, one can see the opposite trend—the intensity at the edges of the grains was lower. Apparently, this is explained by an increased concentration of Ce4+ ions near the grain boundaries and, as a consequence, additional quenching of the luminescence of Ce3+ ions. Since the excitation occurs in the lower excited state 5d1 of the Ce3+ ions, which is located ~0.2 eV below the bottom of the conduction band, the effects of electron thermoionization and trapping by nearby shallow traps occur [17]. This is confirmed by data on the luminescence kinetics measured upon excitation in the center of a randomly selected grain and in the region of grain boundaries.
Figure 4 shows the results of kinetic measurements from ceramic micro-regions obtained using fluorescence lifetime imaging microscopy (FLIM) at a detection wavelength of >520 nm, showing the spatial distribution of the mean glow time determined by fitting the kinetic curves (left panel). The right panel of the figure shows typical decay curves for grain boundaries and center. It can be seen that the luminescence kinetics inside the grains is somewhat faster than at the boundary in the investigated range of Ce3+ concentrations. This difference is most pronounced in the sample with the maximum Ce concentration.
The approximation of the luminescence kinetics curves by the sum of two exponentials for samples with different activator concentrations is shown in Figure 5. It can be seen that the concentration dependences for both the center of the crystallite and its boundary were similar: within the measurement accuracy up to the concentration Ce X = 0.015, the constants coincided. With a further increase in concentration, both the fast and slow components of the kinetics decreased.
Figure 6 shows the distribution of decay constants obtained by fitting a set of kinetic curves for sample GY3, which were used to determine the average value of these constants at the center and at the grain boundary. It can be seen that both components at the grain boundary somewhat exceeded those in the center.
The shape of the spectrum within grains in ceramics remains unchanged over a large concentration range. In this case, the tendency of both the fast and slow components of the luminescence kinetics to decrease is explained by concentration quenching. Since the conditions for measuring the luminescence kinetics do not exclude the possibility of the electron escaping via the conduction band, it can be argued that the slowing effect is most likely due to the interaction of Ce3+/Ce4+ ions, the predominant distribution of which near the grain boundary in the quaternary garnet can be similar to the ternary one, as described in [20]. Indeed, lattice-stabilized Ce4+ does not have a ground state in the bandgap. Thus, electron capturing by its 4f- and 5d-unfilled orbitals occurs. The slowdown mechanism consists of the chain of the processes. It includes thermally initiated ionization of the excited state of Ce3+ ions, the formation of the dynamic state of Ce4+ + e, and further, either electron scattering on inhomogeneities of the crystal potential caused by disordering with a return to the parent ion or its capture by the Ce4+ ion stabilized nearby in the lattice. Scattering by inhomogeneities of the crystal potential, introduced by compositional disordering, is apparently the same over the entire volume of the grain, including boundaries. The characteristic times associated with the capture of electrons at the inhomogeneities of the (Gd,Y)3Al2Ga3O12:Ce crystal lattice is in units of ps [19]. In regions near the boundaries, where an excess concentration of Ce4+ ions is, an additional possibility arises to capture electrons delocalized from Ce3+. The tetravalent Ce ion, which captured an electron, is transformed for a short time into an excited Ce3+ ion, followed by luminescence emission. Since Ce4+ is stabilized in the lattice by oxygen vacancies, the charge equilibrium recovery process occurs with the participation of intermediate charged states of oxygen vacancies of the F+,0 type. Therefore, this longer chain of processes prolongs the formation of an ensemble of excited Ce3+ ions, which slows down the luminescence kinetics. Thus, although the increased activator concentration leads to an expected reduction in the decay constant of luminescence kinetics, it also leads to a luminescence intensity decrease at the grain boundary. At the same time, due to the low relative concentration of the activator near the grain boundaries, the effect should not provide significant changes in the integral luminescent characteristics of the material.

4. Conclusions

Cerium concentration series of transparent ceramic samples Gd1.5−xCexY1.5Al2Ga3O12 (x = 0.005, 0.015, 0.060) was obtained from co-precipitated powders by sintering in an oxygen atmosphere. Using scanning confocal microscopy, it was determined that an increase in the activator content in the composition contributes to a decrease in the luminescence intensity at the grain boundaries in comparison with their inner volume. Utilizing the FLIM method, we found that the major photo-luminescence decay constant at the excitation in the lowest Ce3+ excited state 5d1 and measured near the boundaries or in the inner volume weakly depends on the concentration of Ce in the range x = 0.005–0.015 f.u., whereas at x = 0.060 it shows variation from 38.1 ± 0.5 to 35.4 ± 0.5 ns. An elongation of the luminescence kinetics at the grain boundaries relative to their inner volume is explained by the formation of Ce4+ ions in the boundary regions, which act as trapping centers for delocalized electrons from Ce3+. The results are important for optimizing the technology of the GYAGG:Ce ceramic luminescent material, in particular, for choosing the concentration of the activator.

Supplementary Materials

The following supporting information can be downloaded at: https://www.mdpi.com/article/10.3390/photonics10010054/s1, Figure S1: Representative SEM images of GYAGG powder (GY2) used in the work. Figure S2: The XRD pattern of 850 °C calcined GYAGG powder (GY2) and standard PDF card of # 46-0448 (Gd3Ga2Al3O12). Figure S3: The SEM image of GYAGG ceramic sample with 0.060 f.u. Ce (GY3) with an example of secondary phase CeO2. Figure S4: The XRD patterns of GYAGG ceramics and standard PDF cards of # 46-0448 (Gd3Ga2Al3O12) and # 43-1002 (CeO2). Figure S5: EDS map of GYAGG ceramic sample (GY3). Figure S6: Total transmission spectra of GYAGG ceramic samples.

Author Contributions

Conceptualization, M.K. and V.D.; methodology, V.D. and M.G.; software, V.D. and M.G.; validation, P.S. and I.K.; formal analysis, V.D.; investigation, M.G., R.S. and O.K.; resources, D.K.; data curation, V.D.; writing—original draft preparation, V.D. and M.K.; writing—review and editing, P.S., I.K. and D.K.; visualization, V.D. and M.G.; supervision, M.K. and D.K.; project administration, D.K.; funding acquisition, D.K. All authors have read and agreed to the published version of the manuscript.

Funding

Sample preparation for fluorescence lifetime imaging microscopy (FLIM) was funded by the NRC “Kurchatov Institute”. Samples for spatial distribution of PL intensity and spectral center of mass were fabricated and measured with the support of the Russian Ministry of Science and Education through Agreement No. 075-15-2021-1353 dated 12 October 2021. Scanning electron microscopy was performed using the scientific equipment of CKP NRC “Kurchatov Institute”—IREA, with the financial support of the project by the Russian Federation represented by the Ministry of Education and Science of Russia, Agreement No. 075-15-2022-1157, dated 16 August 2022.

Institutional Review Board Statement

Not applicable.

Informed Consent Statement

Not applicable.

Data Availability Statement

Not applicable.

Conflicts of Interest

The authors declare no conflict of interest.

References

  1. Ueda, J.; Tanabe, S. (INVITED) Review of Luminescent Properties of Ce3+-Doped Garnet Phosphors: New Insight into the Effect of Crystal and Electronic Structure. Opt. Mater. X 2019, 1, 100018. [Google Scholar] [CrossRef]
  2. Zhang, R.-Z.; Reece, M.J. Review of High Entropy Ceramics: Design, Synthesis, Structure and Properties. J. Mater. Chem. A 2019, 7, 22148–22162. [Google Scholar] [CrossRef] [Green Version]
  3. Zhang, G.; Wu, Y. High-entropy Transparent Ceramics: Review of Potential Candidates and Recently Studied Cases. Int. J. Appl. Ceramic Technol. 2022, 19, 644–672. [Google Scholar] [CrossRef]
  4. Nundy, S.; Tatar, D.; Kojčinović, J.; Ullah, H.; Ghosh, A.; Mallick, T.K.; Meinusch, R.; Smarsly, B.M.; Tahir, A.A.; Djerdj, I. Bandgap Engineering in Novel Fluorite-Type Rare Earth High-Entropy Oxides (RE-HEOs) with Computational and Experimental Validation for Photocatalytic Water Splitting Applications. Adv. Sustain. Syst. 2022, 6, 2200067. [Google Scholar] [CrossRef]
  5. Atuchin, V.V.; Beisel, N.F.; Galashov, E.N.; Mandrik, E.M.; Molokeev, M.S.; Yelisseyev, A.P.; Yusuf, A.A.; Xia, Z. Pressure-Stimulated Synthesis and Luminescence Properties of Microcrystalline (Lu,Y)3Al5O12:Ce3+ Garnet Phosphors. ACS Appl. Mater. Interfaces 2015, 7, 26235–26243. [Google Scholar] [CrossRef]
  6. Ji, H.; Wang, L.; Molokeev, M.S.; Hirosaki, N.; Xie, R.; Huang, Z.; Xia, Z.; ten Kate, O.M.; Liu, L.; Atuchin, V.V. Structure Evolution and Photoluminescence of Lu3(Al,Mg)2(Al,Si)3O12:Ce3+ Phosphors: New Yellow-Color Converters for Blue LED-Driven Solid State Lighting. J. Mater. Chem. C 2016, 4, 6855–6863. [Google Scholar] [CrossRef] [Green Version]
  7. Kuptsov, G.V.; Konovalova, A.O.; Petrov, V.A.; Laptev, A.V.; Atuchin, V.V.; Petrov, V.V. Laser Method for Studying Temperature Distribution within Yb:YAG Active Elements. Photonics 2022, 9, 805. [Google Scholar] [CrossRef]
  8. Cherepy, N.J.; Payne, S.A.; Asztalos, S.J.; Hull, G.; Kuntz, J.D.; Niedermayr, T.; Pimputkar, S.; Roberts, J.J.; Sanner, R.D.; Tillotson, T.M.; et al. Scintillators with Potential to Supersede Lanthanum Bromide. IEEE Trans. Nucl. Sci. 2009, 56, 873–880. [Google Scholar] [CrossRef] [Green Version]
  9. Kamada, K.; Endo, T.; Tsutumi, K.; Yanagida, T.; Fujimoto, Y.; Fukabori, A.; Yoshikawa, A.; Pejchal, J.; Nikl, M. Composition Engineering in Cerium-Doped (Lu,Gd)3(Ga,Al)5O12 Single-Crystal Scintillators. Cryst. Growth Des. 2011, 11, 4484–4490. [Google Scholar] [CrossRef]
  10. Nikl, M.; Yoshikawa, A. Recent R&D Trends in Inorganic Single-Crystal Scintillator Materials for Radiation Detection. Adv. Opt. Mater. 2015, 3, 463–481. [Google Scholar] [CrossRef]
  11. Lecoq, P. Inorganic Scintillators for Detector Systems: Physical Principles and Crystal Engineering; Springer: Berlin/Heidelberg, Germany; New York, NY, USA, 2016; ISBN 978-3-319-45521-1. [Google Scholar]
  12. Sidletskiy, O.; Gorbenko, V.; Zorenko, T.; Syrotych, Y.; Witkiwicz-Łukaszek, S.; Mares, J.A.; Kucerkova, R.; Nikl, M.; Gerasymov, I.; Kurtsev, D.; et al. Composition Engineering of (Lu,Gd,Tb)3(Al,Ga)5O12:Ce Film/Gd3(Al,Ga)5O12:Ce Substrate Scintillators. Crystals 2022, 12, 1366. [Google Scholar] [CrossRef]
  13. Sidletskiy, O. Trends in Search for Bright Mixed Scintillators. Phys. Status Solidi A 2018, 215, 1701034. [Google Scholar] [CrossRef]
  14. Korzhik, M.; Abashev, R.; Fedorov, A.; Dosovitskiy, G.; Gordienko, E.; Kamenskikh, I.; Kazlou, D.; Kuznecova, D.; Mechinsky, V.; Pustovarov, V.; et al. Towards Effective Indirect Radioisotope Energy Converters with Bright and Radiation Hard Scintillators of (Gd,Y)3Al2Ga3O12 Family. Nucl. Eng. Technol. 2022, 54, 2579–2585. [Google Scholar] [CrossRef]
  15. Dorenbos, P. Electronic Structure and Optical Properties of the Lanthanide Activated RE3(Al1−xGax)5O12 (RE=Gd, Y, Lu) Garnet Compounds. J. Lumin. 2013, 134, 310–318. [Google Scholar] [CrossRef]
  16. Yadav, S.K.; Uberuaga, B.P.; Nikl, M.; Jiang, C.; Stanek, C.R. Band-Gap and Band-Edge Engineering of Multicomponent Garnet Scintillators from First Principles. Phys. Rev. Appl. 2015, 4, 054012. [Google Scholar] [CrossRef] [Green Version]
  17. Auffray, E.; Augulis, R.; Fedorov, A.; Dosovitskiy, G.; Grigorjeva, L.; Gulbinas, V.; Koschan, M.; Lucchini, M.; Melcher, C.; Nargelas, S.; et al. Excitation Transfer Engineering in Ce-Doped Oxide Crystalline Scintillators by Codoping with Alkali-Earth Ions. Phys. Status Solidi A 2018, 215, 1700798. [Google Scholar] [CrossRef]
  18. Korjik, M.; Bondarau, A.; Dosovitskiy, G.; Dubov, V.; Gordienko, K.; Karpuk, P.; Komendo, I.; Kuznetsova, D.; Mechinsky, V.; Pustovarov, V.; et al. Lanthanoid-Doped Quaternary Garnets as Phosphors for High Brightness Cathodoluminescence-Based Light Sources. Heliyon 2022, 8, e10193. [Google Scholar] [CrossRef]
  19. Nargelas, S.; Talochka, Y.; Vaitkevičius, A.; Dosovitskiy, G.; Buzanov, O.; Vasil’ev, A.; Malinauskas, T.; Korzhik, M.; Tamulaitis, G. Influence of Matrix Composition and Its Fluctuations on Excitation Relaxation and Emission Spectrum of Ce Ions in (GdxY1-x)3Al2Ga3O12:Ce Scintillators. J. Lumin. 2022, 242, 118590. [Google Scholar] [CrossRef]
  20. Dosovitskiy, G.; Dubov, V.; Karpyuk, P.; Volkov, P.; Tamulaitis, G.; Borisevich, A.; Vaitkevičius, A.; Prikhodko, K.; Kutuzov, L.; Svetogorov, R.; et al. Activator Segregation and Micro-Luminescence Properties in GAGG:Ce Ceramics. J. Lumin. 2021, 236, 118140. [Google Scholar] [CrossRef]
  21. Retivov, V.; Dubov, V.; Komendo, I.; Karpyuk, P.; Kuznetsova, D.; Sokolov, P.; Talochka, Y.; Korzhik, M. Compositionally disordered crystalline compounds for next generation of radiation detectors. Nanomaterials 2022, 12, 4295. [Google Scholar] [CrossRef]
  22. Yang, S.; Sun, Y.; Chen, X.; Zhang, Y.; Luo, Z.; Jiang, J.; Jiang, H. The Effects of Cation Concentration in the Salt Solution on the Cerium Doped Gadolinium Gallium Aluminum Oxide Nanopowders Prepared by a Co-Precipitation Method. IEEE Trans. Nucl. Sci. 2014, 61, 301–305. [Google Scholar] [CrossRef]
  23. Sun, Y.; Yang, S.; Zhang, Y.; Jiang, J.; Jiang, H. Co-Precipitation Synthesis of Gadolinium Aluminum Gallium Oxide (GAGG) via Different Precipitants. IEEE Trans. Nucl. Sci. 2014, 61, 306–311. [Google Scholar] [CrossRef]
  24. ImageJ. Image Processing and Analysis in Java. Available online: https://imagej.nih.gov/ij/ (accessed on 28 November 2022).
  25. Retivov, V.; Dubov, V.; Kuznetsova, D.; Ismagulov, A.; Korzhik, M. Gd3+ Content Optimization for Mastering High Light Yield and Fast Gd3Al2Ga3O12:Ce3+ Scintillation Ceramics. J. Rare Earths 2022. In Press. [Google Scholar] [CrossRef]
  26. Chen, C.; Li, X.; Feng, Y.; Lin, H.; Yi, X.; Tang, Y.; Zhang, S.; Zhou, S. Optimization of CeO2 as Sintering Aid for Tb3Al5O12 Faraday Magneto-Optical Transparent Ceramics. J. Mater. Sci. 2015, 50, 2517–2521. [Google Scholar] [CrossRef]
  27. Chen, P.-L.; Chen, I.-W. Grain Boundary Mobility in Y2O3: Defect Mechanism and Dopant Effects. J. Am. Ceram. Soc. 1996, 79, 1801–1809. [Google Scholar] [CrossRef]
Figure 1. SEM images of ceramic samples in backscattered electron mode (a); average grain size of ceramic samples versus Ce concentration in formula units X (b); typical ceramic sample (c).
Photonics 10 00054 g001aPhotonics 10 00054 g001b
Figure 2. Images of the spatial distribution of PL intensity (left panel), spectral center of mass (middle panel) and luminescence spectrum recorded at excitation with 442 nm ((a) GY1, (b) GY2, (c) GY3). Circles define the area in the grain, which were used to take data on luminescence spectrum and its intensity.
Photonics 10 00054 g002aPhotonics 10 00054 g002b
Figure 3. Normalized photoluminescence spectra of the samples.
Photonics 10 00054 g003
Figure 4. FLIM images and typical kinetics curves on grain border and center: (a) GY1, (b) GY2, (c) GY3.
Photonics 10 00054 g004
Figure 5. Luminescence decay components obtained from the approximation of the kinetics curve averaged from 102 measurements for each Ce concentration in the batch: (a) grain border, (b) grain center. Error of decay constant calculation was defined to be +/− 0.5 ns.
Photonics 10 00054 g005
Figure 6. Typical histograms of kinetics components (GY3 sample): (a) τ1 for grain border, (b) τ1 for grain center, (c) τ2 for grain border, (d) τ2 for grain center.
Photonics 10 00054 g006
Table 1. Sample number and composition.
Sample NumberComposition
GY1Gd1.495Ce0.005Y1.5Al2Ga3O12 (x = 0.005)
GY2Gd1.485Ce0.015Y1.5Al2Ga3O12 (x = 0.015)
GY3Gd1.440Ce0.060Y1.5Al2Ga3O12 (x = 0.060)
Disclaimer/Publisher’s Note: The statements, opinions and data contained in all publications are solely those of the individual author(s) and contributor(s) and not of MDPI and/or the editor(s). MDPI and/or the editor(s) disclaim responsibility for any injury to people or property resulting from any ideas, methods, instructions or products referred to in the content.

