1. Introduction
All-fiber sensor devices have been actively used in various industries, medicine, and applied science for the past two decades [
1,
2,
3,
4]. By manipulating the geometry [
2,
5], the refractive index, and the composition of silica [
6,
7,
8], it is possible to adapt an optical fiber for various tasks based on interaction with the energy propagating through the core of this fiber. To enhance the interaction of light traveling through the fiber core with the environment, it is necessary to use optical fibers whose structure is changed in some area by chemical thinning [
9], thermal stretching [
10], or side polishing [
11]. This approach is used both in fiber-optic sensors [
4,
9,
10,
11] and in pulsed fiber lasers [
12,
13,
14].
Part of the energy propagating along the fiber outside the core is called the evanescent field [
15,
16]. The transverse extent of the evanescent field depends on the ratio of the refractive indices of the reflective cladding and core, as well as on their thicknesses. With a local decrease in the thickness of the reflective cladding, a significant part of the light energy is transferred outside the fiber core [
17], which facilitates its interaction with the environment. The amount of scattering of the outgoing radiation from the thinned section of the fiber depends on the refractive index of the environment and affects the overall level of “gray loss” in the optical path. If a layer of an optically transparent material with a high refractive index is applied to the side surface of a thinned fiber segment, then under the influence of the tails of the optical field of the fundamental mode of the fiber light guide, modes can be excited in the coating layer (in the film). Due to the coupling effect, part of the energy from the light-guiding core of the fiber will be transferred to the coating film and then dissipated. As a result, a dip appears in the transmission spectrum in a certain wavelength range with a clearly defined extremum (resonance) [
9,
10,
11,
18,
19,
20]. The position and depth of the resonance depend on the refractive indices of the deposited layer and the environment, as well as on the material of the coating film and its thickness [
4,
21]. As a result, a change in the refractive index of the medium in which the coated thin fiber is placed will lead to a corresponding change in the spectral position of the resonance. Fiber sensors are based on this principle, registering changes in the refractive index of various media, and hence composition [
22], humidity [
9], temperature [
23], and so on. This phenomenon is widely known in the literature as lossy mode resonance (LMR) [
18].
For the appearance of resonance, it is necessary that the coating deposited on the optical fiber satisfy certain requirements, which are described in detail in [
24,
25,
26]. To detect resonance, it is necessary that the real part of the permittivity of the coating material deposited on the surface of the optical fiber exceed the analogous parameter for the fiber and be greater than the absolute value of the imaginary part of the dielectric permittivity of the film substance. Examples of such materials are oxides of tin, titanium, indium, and combinations thereof. An important fact is that the higher the refractive index of the coating, the higher the sensitivity of the resonance to changes in the optical density of the external medium [
26]. The LMR phenomenon arises from the coupling of an optical waveguide mode and a specific loss mode in a coating film at a finite thickness. The mode coupling mainly depends on the overlapping between the mode fields and the state of phase matching. The state of phase matching is reached when the propagation constant of the guiding mode and the lossy mode match. When the lossy modes are close to the mode cutoff condition, both conditions are met, and the lossy modes begin to pass through the coated film.
A separate direction in sensorics based on fiber refractometers is devoted to working with living cells [
27], bacteria [
28]. Knowing that the LMR spectral position depends on the optical density of the medium surrounding the sensor, it is possible to determine a number of parameters that determine the life cycle of the biological objects under study. For example, some modification of the sensitive surface of the LMR fiber sensor makes it possible to determine the specific type of antibodies present in the analyzed analyte [
27]. The modified surface better binds to a specific type of cells, thereforein the sensitive area, the main role in the change in the refractive index is played by an increase in the absolute number of these cells in the layer adjacent to the sensor. Therefore, when studying a specific living culture with the help of LMR, it is possible to determine the change in the concentration of living micro-objects (cells) in the analyte volume adjacent to the sensor. The issue of determining the absolute amount (dry weight) is acute when growing microalgae suitable in many areas. Among the vast biodiversity of microalgae described and analyzed [
29], the most remarkable is the green eukaryotic microalgae
Chlorella vulgaris (algae). It is a source of products such as proteins, carbohydrates, pigments, vitamins, and minerals [
30]. In addition, microalgae capture sunlight and carry out photosynthesis, producing about half of the atmospheric oxygen on Earth and absorbing huge amounts of carbon from carbon dioxide as their main food. Algae are also able to accumulate a significant amount of lipids, especially after nitrogen starvation [
31,
32]. Depending on the conditions and methods of growing algae [
31,
33,
34,
35], the final amount of dry matter will differ, and each individual organism will contain different amounts of protein and lipids. Real-time measurement of these parameters during microalgae cultivation using all-fiber refractometers will help to quickly assess and determine the effectiveness of growth processes. However, in the course of their life activity, the cells under study can and will move in the liquid and move away from the sensitive part, therefore, for correct measurement, a method is required to keep them on the sensor surface.
Optical tweezers are a proven method of influencing nano- and microparticles [
36]. A phenomenon in which, under the influence of optical radiation, particles falling into the gradient of the optical field tend to arrive to the point with the highest intensity and stay at this point. Using chemical thinning of a fiber section and launching light into the fiber, it is possible to create a region in which the intensity gradient will have a maximum near the surface of the fiber [
37]. In this case, under the influence of the evanescent optical field, particles (cells) from the analyte will be attracted to the region of the maximum of the evanescent optical field, that is, to the surface of the thinned section of the fiber and will be held there. Such localization of the cell suspension makes it possible to conduct a detailed study of the life course of cellular biological objects.
In our work, we present the results of a study of the possibility of monitoring the vital activity of the unicellular algae under various growth conditions using a fiber LMR refractometer and the effect of optical tweezing. In
Section 3.1, a comparison of the sensitivities of fiber LMR sensors based on various films of titanium and tin oxides, as well as their combinations, is described. The materials were chosen due to the simultaneous simplicity of their synthesis by the MOCVD method and chemical resistance to the influence of various liquid media. Coatings were deposited on chemically thinned sections of multimode fibers by metalorganic chemical vapor deposition (MOCVD).
Section 3.2 demonstrates the effectiveness of optical tweezers for concentrating cells from algae suspension near the surface of a thinned light guide section. To do that, various sources of coherent radiation were used.
Section 3.3 is devoted to the study of the influence of microalgae on the effective refractive index of a liquid layer depending on their concentration, as well as in the process of their life under different conditions.
2. Materials and Methods
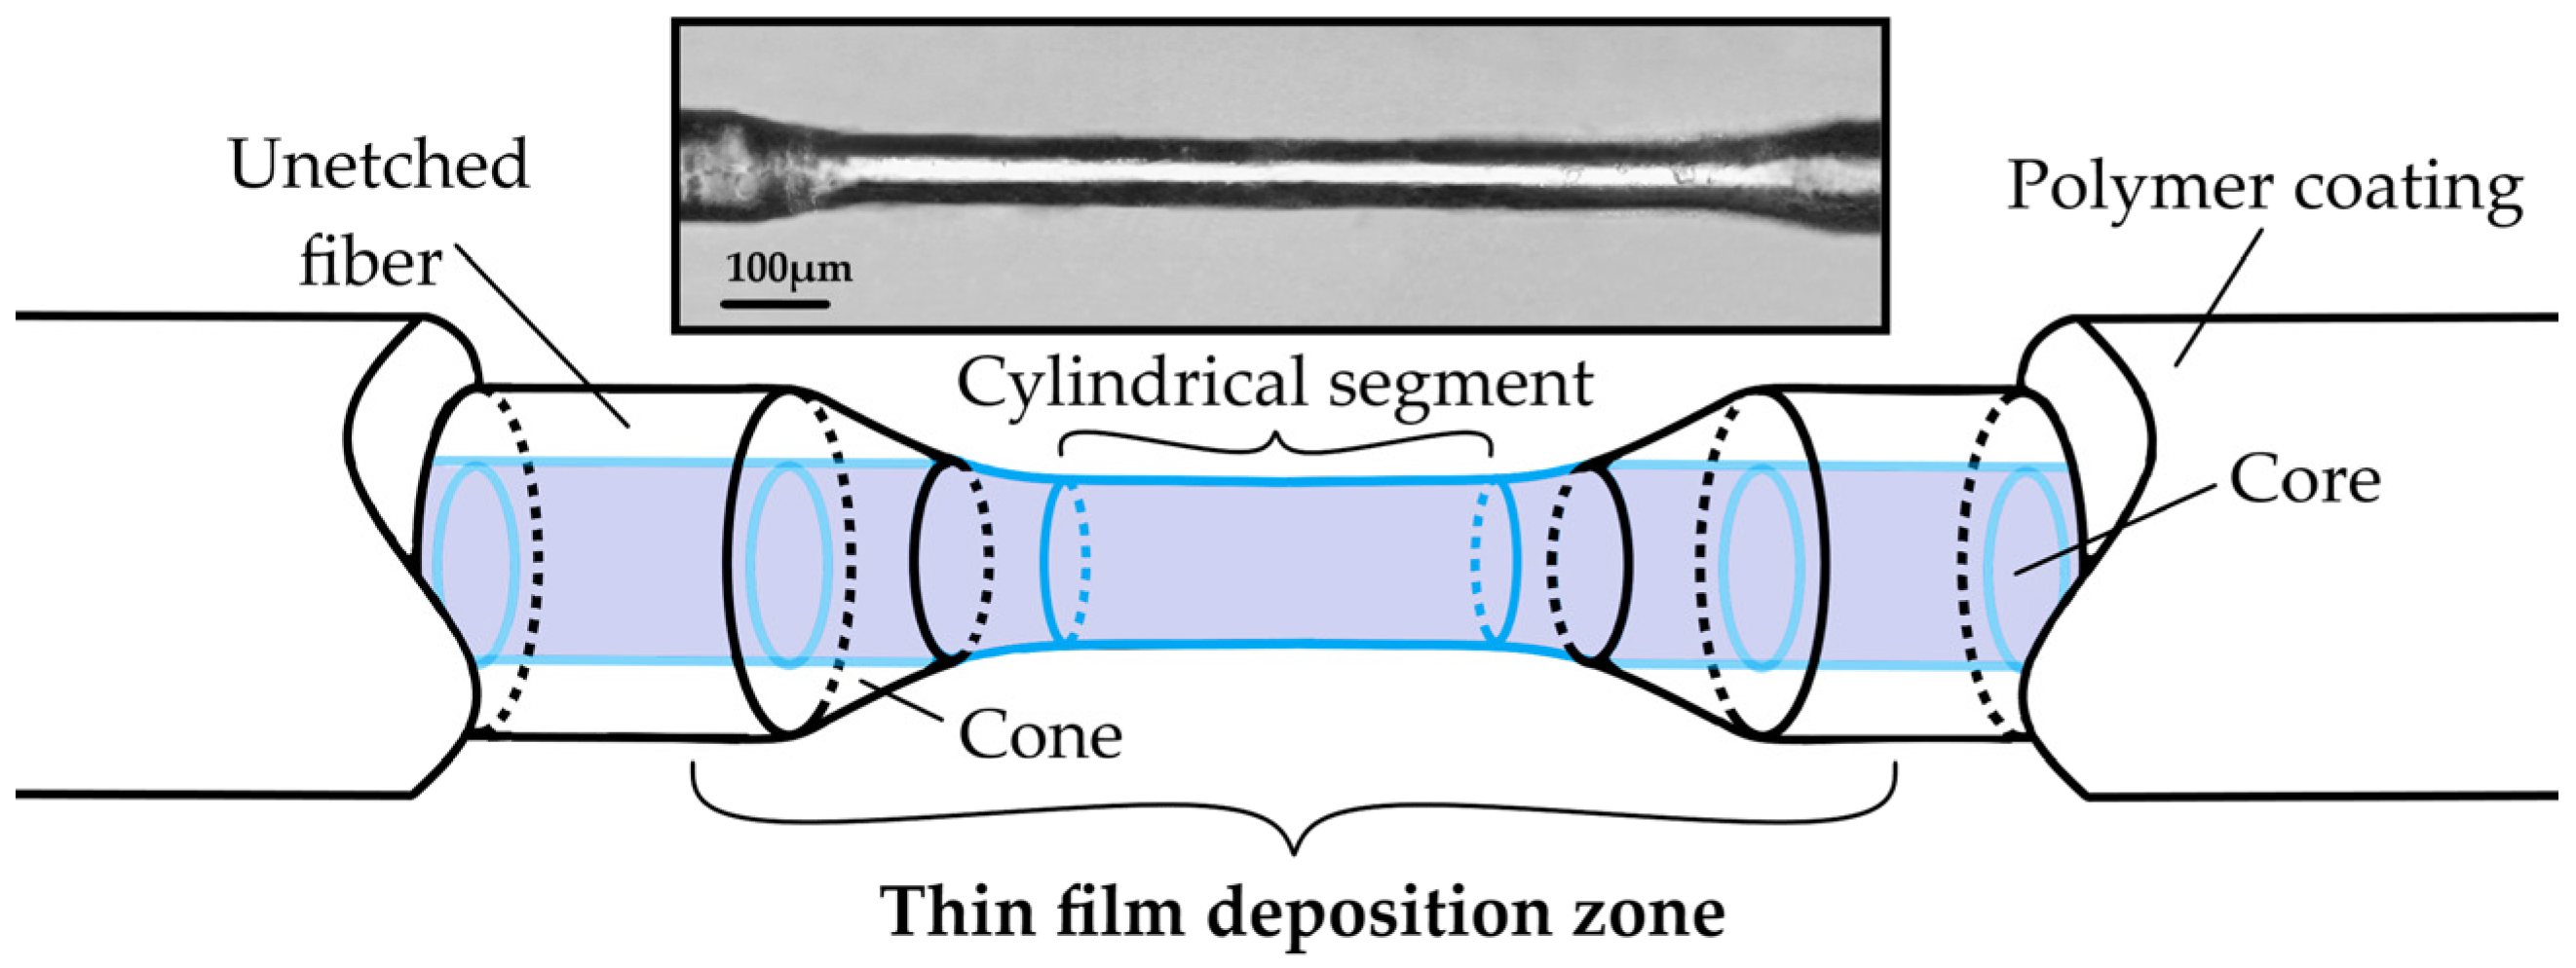
A single-mode SMF-28 fiber and a multimode fiber of our own production with a pure silica core of 95 microns in diameter and a fluorine doped silica light-reflecting cladding were chemically etched in a 3.5 mm long section using a low-toxic polishing etchant [
38]. After preliminary cleaning of the protective polymer, a fiber section of about 3.5 mm in length was flooded several times with an aqueous solution of an etchant based on a mixture of fluoride (NH
4F) and ammonium sulfate ((NH
4)
2SO
4). After each pouring, the diameter and quality of the side surface of the fiber were monitored using an optical microscope. When the required diameter was reached (23 microns for single-mode fibers, 80 microns for multimode fibers), etching was stopped, and the etchant residues were washed off with distilled water. In detail, we describe the process of manufacturing a thinned fiber section in [
38]. A diagram and photograph of a section of a multimode optical fiber thinned by chemical etching is shown in
Figure 1.
To apply a film coating by the MOCVD method, a piece of fiber with a fabricated thinned section, cleared of the protective polymer sheath, was placed in a special tubular quartz glass reactor with sealed leads outward from two opposite sides.
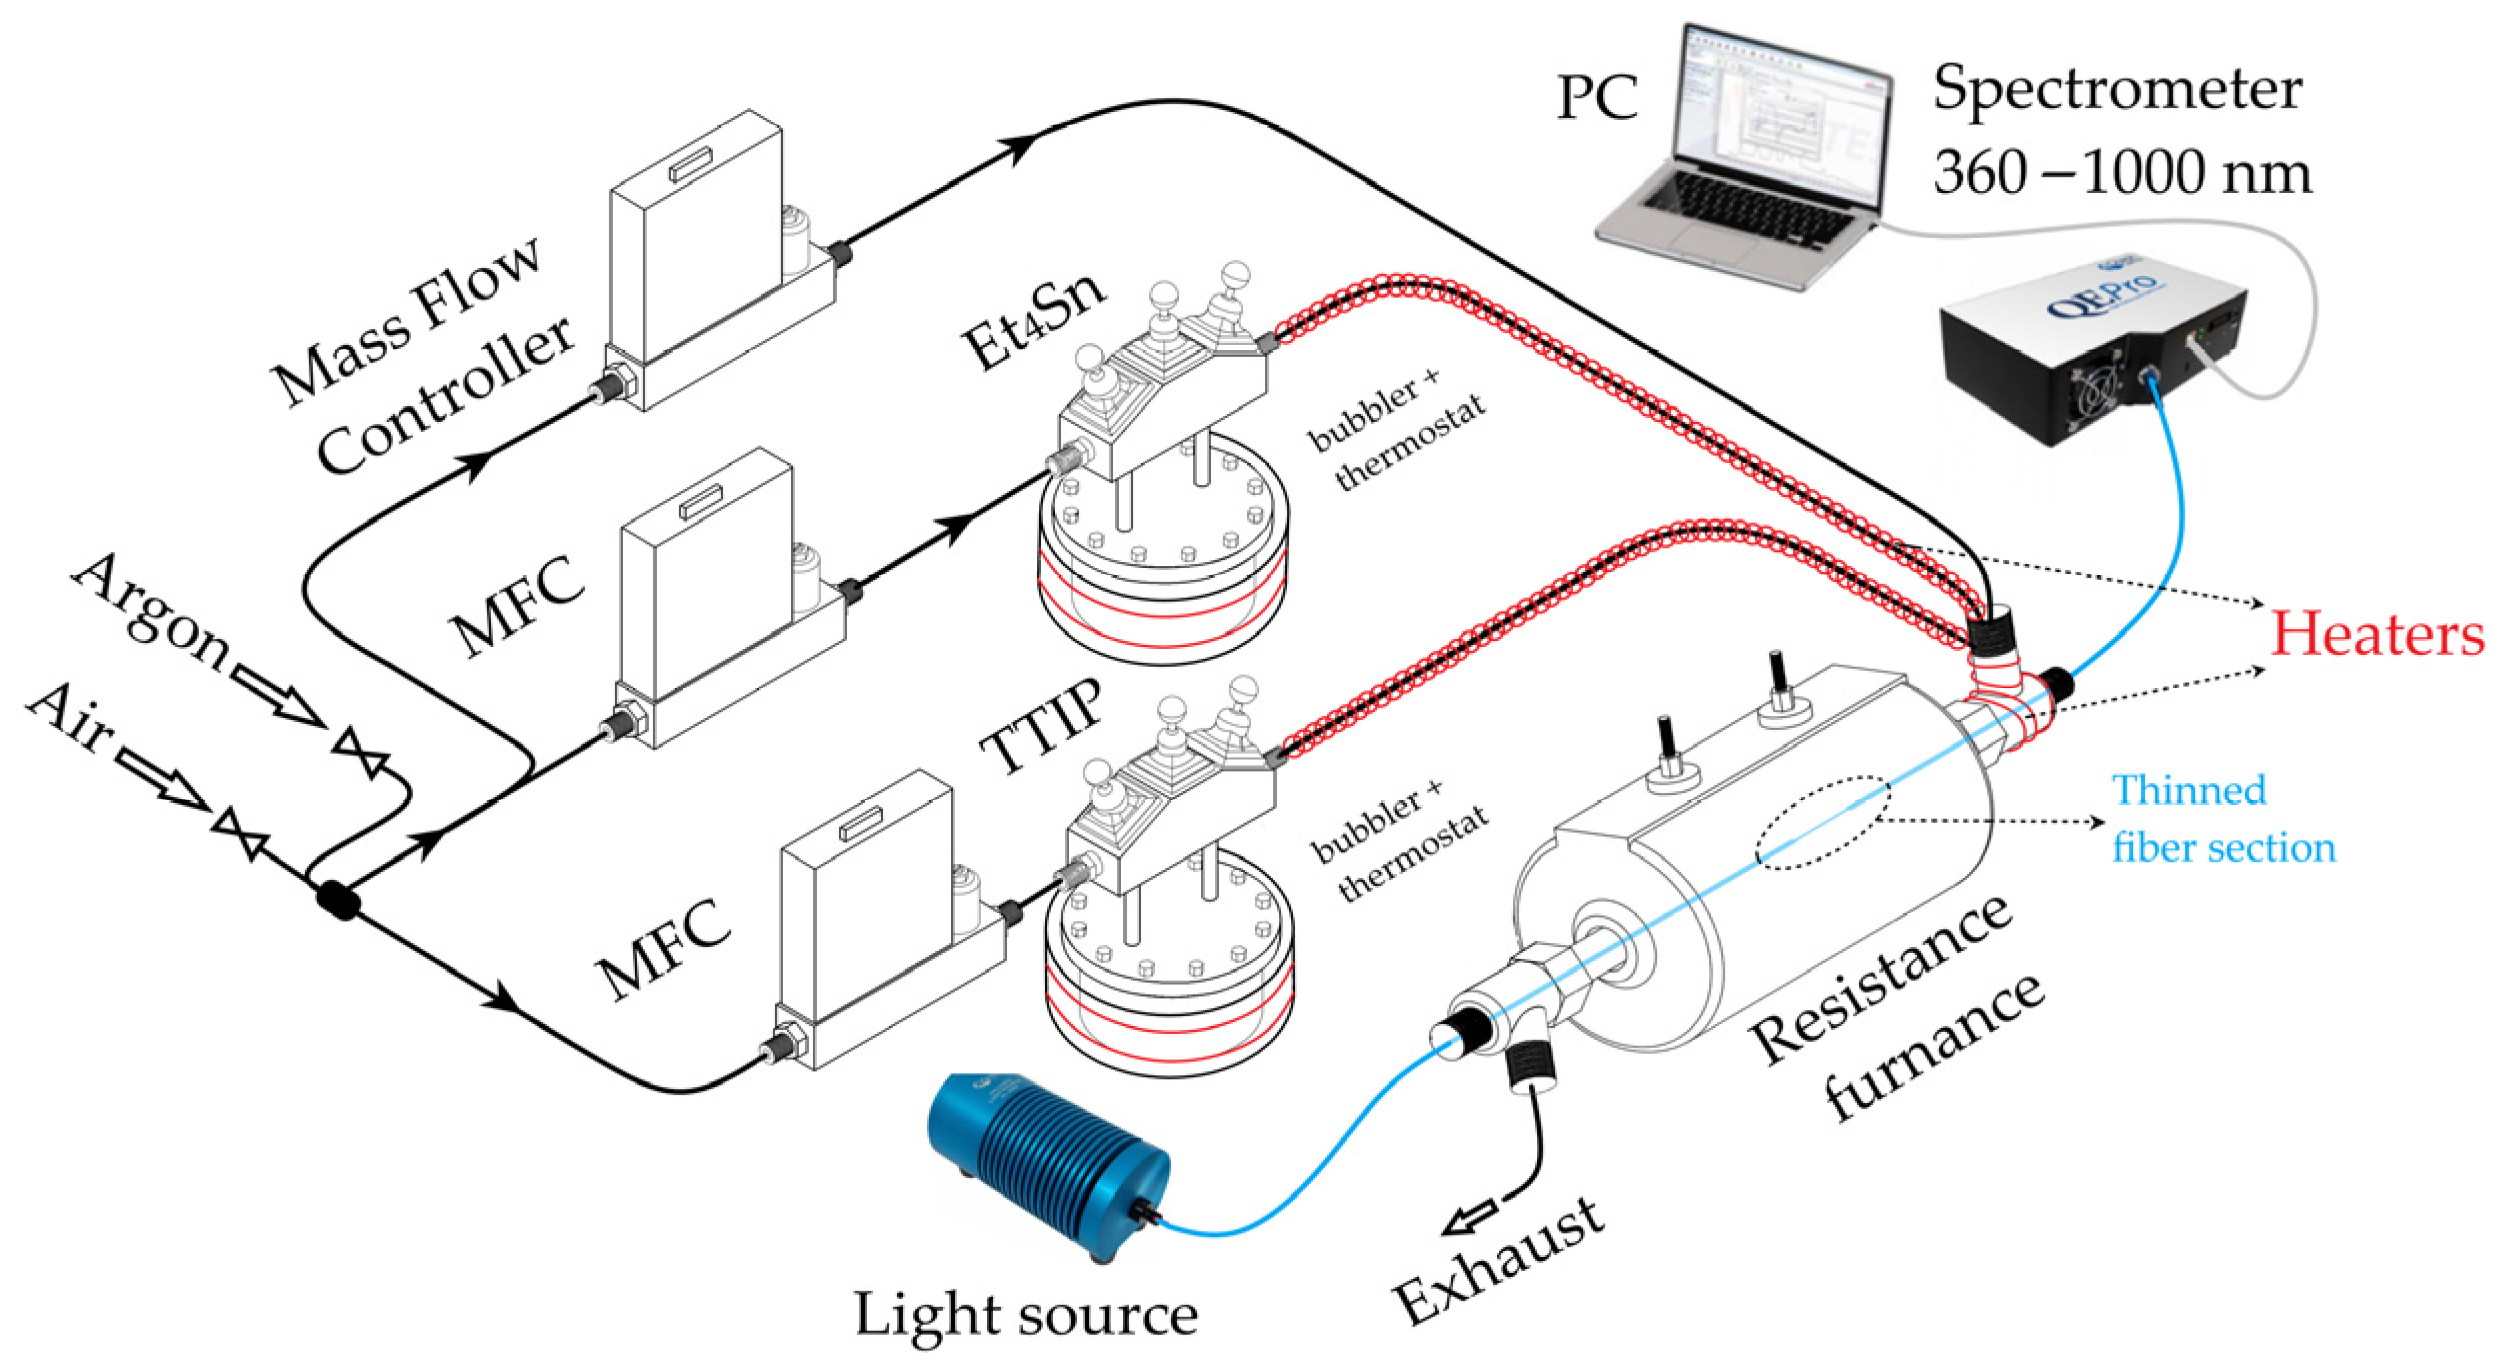
The film coating process was divided into two stages. At the first stage, a titanium oxide film was synthesized in an atmosphere of dried argon with a dew point of −80 °C. The deposition was carried out using a cylindrical resistive furnace at a temperature of 335 °C. The source of titanium was Titanium (IV) isopropoxide (TTIP) in a stainless steel evaporation container. The oxygen contained in the molecule of the organic compound was sufficient for the formation of an oxidized film. The container with the reagent, as well as the gas lines, were thermostated at 60 °C. Inert argon acted both as a carrier gas for titanium organics and as a diluent that controlled the position of the precipitation zone in the resistive furnace. The argon flow rate through the TTIP evaporator was constant and amounted to 50 cm3/min. Taking into account the dilution rate, the total linear velocity of the mixture in the gas flux inside the reactor was 10 cm/s.
At the second stage, a coating with a tin oxide film was applied. In contrast to the previous stage, air passed through a dryer at atmospheric pressure was used instead of argon. The organic Tetraethyltin (Et
4Sn) served as a source of tin, and atmospheric oxygen served as an oxidizer. The synthesis was carried out at the same temperature of 335 °C and gas flow rates. The container with organic matter and the supply lines were thermostated at 35 °C. The scheme of applying thin-film coatings on optical fibers with real-time control of the transmission spectrum of the fiber path is shown in
Figure 2.
During all deposition processes, the optical transmission of the thinned fiber section was continuously monitored in the wavelength range of 360–1000 nm on a QEPro spectrometer from OceanOptics. An HL-2000 halogen lamp served as the light source. When synthesizing a two-layer coating in a single technological cycle, a titanium oxide film was first deposited. The process was carried out until the LMR that appears in the transmission spectrum as the film is deposited reaches a wavelength of 450 nm. Upon reaching the required wavelength, the supply of reagents was stopped, and the reactor was cooled to room temperature. After cooling and blowing the reaction zone to remove organic residues, air was fed through all gas paths, and after reheating, a tin oxide film was synthesized. As a result, the LMR wavelength shifted to 650 nm. The position of the resonance in aqueous solutions around 750–850 nm was chosen specifically to correspond to the first telecom window.
Elemental analysis to confirm the stoichiometry of film coatings was carried out on an EDX spectrometer built into a scanning electron microscope (SEM) with a tungsten thermionic cathode JSM-6480LV (Jeol Ltd., Tokyo, Japan). The same microscope was used to obtain images of the surface of the film coatings. An additional indirect confirmation of the composition of the deposited films was the optical transmission spectra of silica plates with oxide films deposited on them in the same experiments, obtained using a Specord UV VIS spectrophotometer (Carl Zeiss, Jena, Germany).
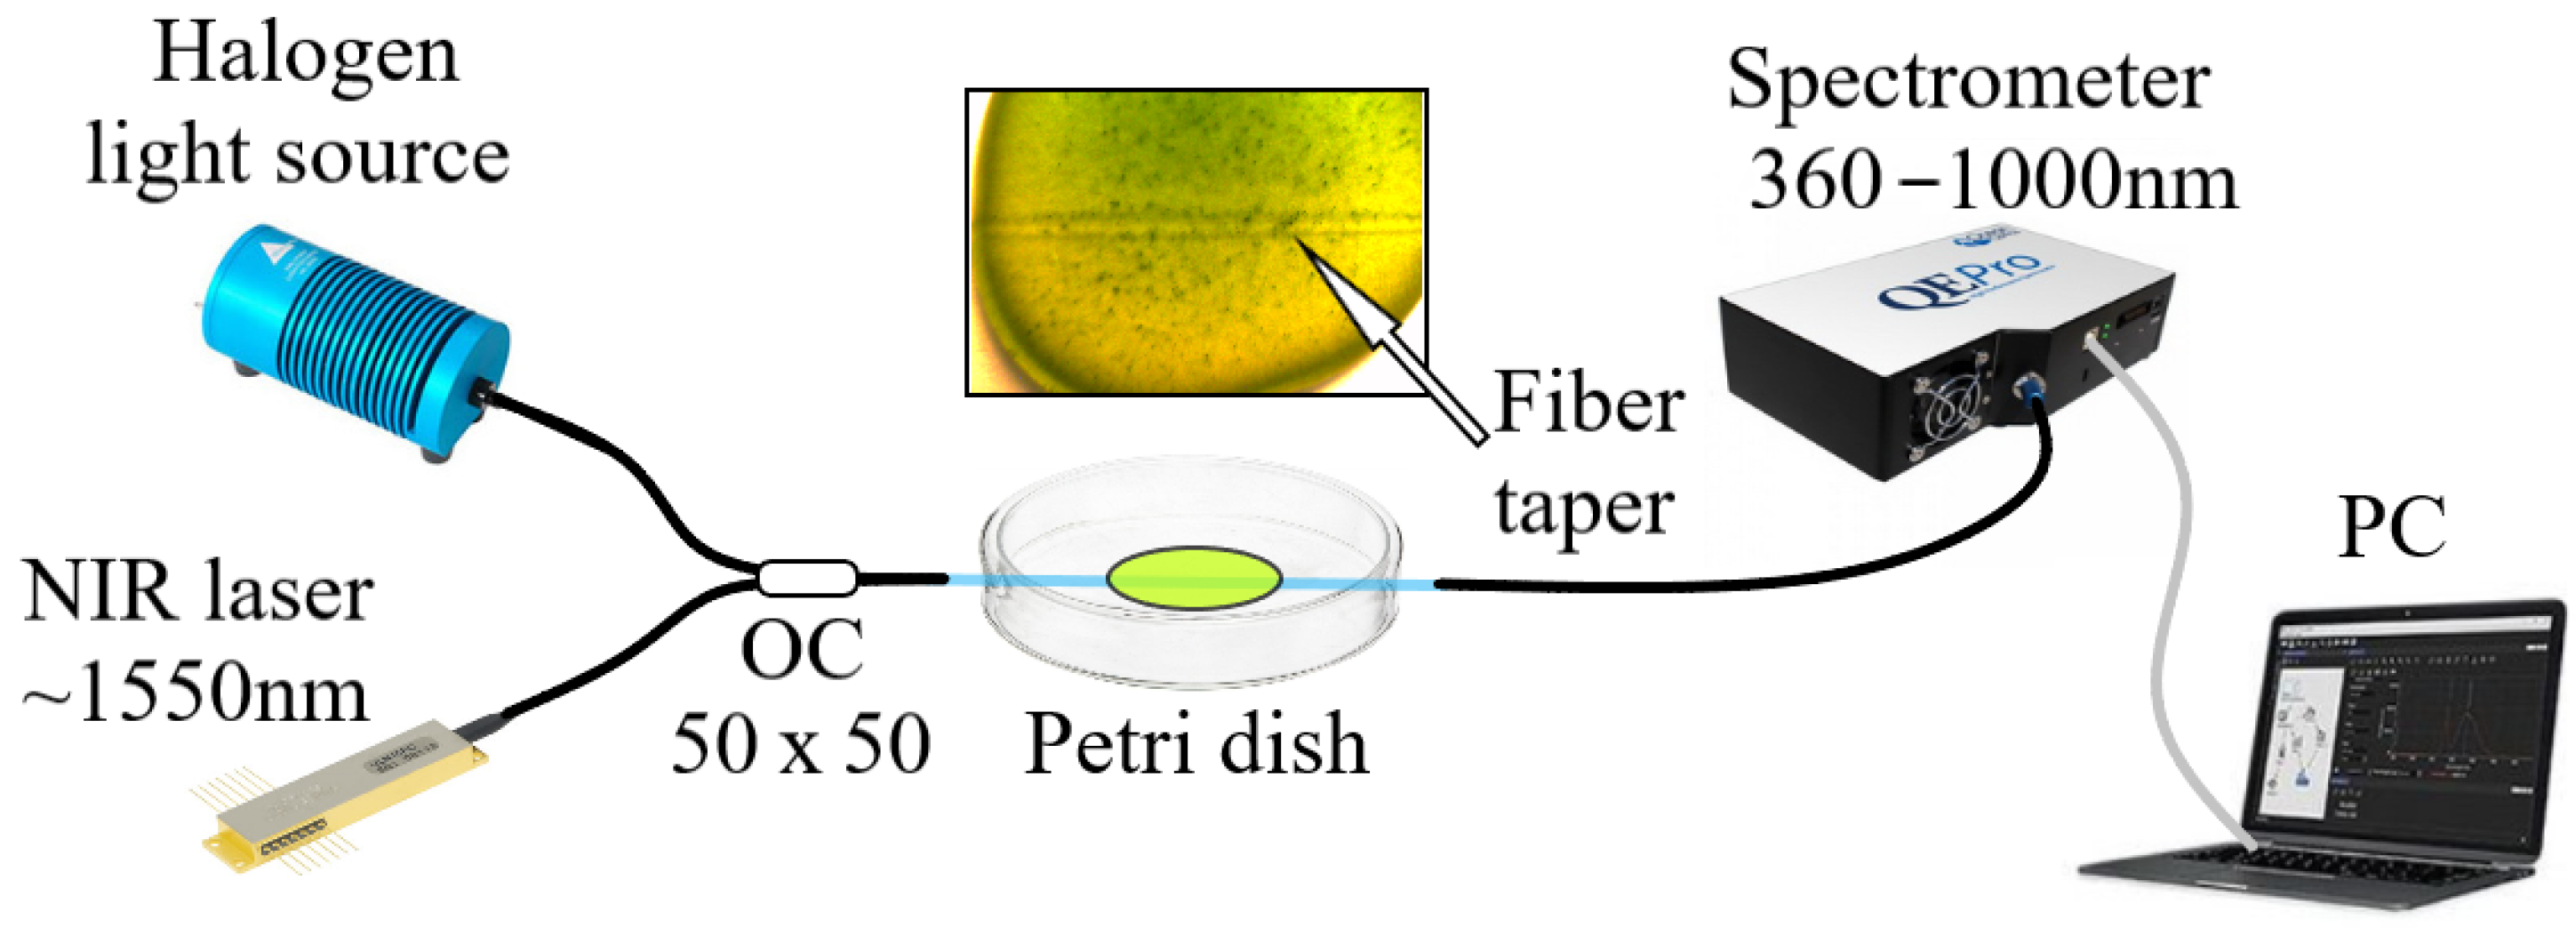
After the completion of the deposition process, the film-coated fiber was removed from the reactor and kept in air for about 12 h at room temperature, and then washed with distilled water several times until the resonance position stabilized. Samples of the obtained LMR sensors were tested for sensitivity in aqueous solutions of NaCl salt, the concentration of which varied from 1 to 10 weight percent. After determining the sensitivity, the fiber sensor was placed on the bottom of a specially prepared Petri dish in a stretched state and spliced into the measuring circuit shown in
Figure 3.
To implement the effect of optical tweezers, light from a home-made fiber laser at a wavelength of 1553 nm and output power of 10 mW was launched into the fiber with a sensor through an optical splitter (
Figure 3). Visual observation of the effect of optical tweezers was carried out via a microscope equipped with a digital camera and an incandescent lamp for additional illumination.
Live microalgae Chlorella vulgaris (Mira Inc., Moscow, Russia) were stored as a frozen suspension containing, in addition to the algae and water, some nutrients. The average cell size of microalgae was 4 microns. The suspensions under study contained a dry mass density in the range from 0.7 to 9 kg/m3. The prepared suspension of thawed algae was poured into a Petri dish and kept there for several days during which the change in the LMR spectral position was recorded. After the experiment, the suspension was poured out of the cup and washed several times in distilled water. To remove the remaining algae from the surface of the fiber, the thinned part was flooded with a one-molar solution of sulfuric acid (H2SO4 • H2O) for 15 min and washed again with water. The absence of particles on the sensitive surface of the fiber sensor was confirmed by the return of the LMR spectrum to its original position before pouring.
3. Results and Discussions
3.1. Fabrication and Characterization of Fiber Refractometers
Optically transparent in the visible and NIR spectral regions, metal oxide films are widely used in the creation of fiber sensors, and the higher the refractive index of the film material, the greater the response of the refractometer to changes in the parameters of the environment. The best choice is titanium (TiO
2) and tin (SnO
2) oxide films, which have the highest refractive indices after silicon and nitrides. However, coatings based on TiO
2 are porous due to the specifics of the film growth process, and upon contact with liquids, they can be retained in pores for a long time. In addition, upon irradiation with light at a wavelength shorter than 590 nm, photocatalysis [
39] can take place on the surface, changing the properties of the deposited film. Coating with the titanium dioxide (TiO
2) film and subsequent coating with a tin dioxide (SnO
2) film, which has stable properties even being in contact with corrosive liquids, the aforementioned disadvantage can be eliminated and the stability and high sensitivity of the sensor can be maintained.
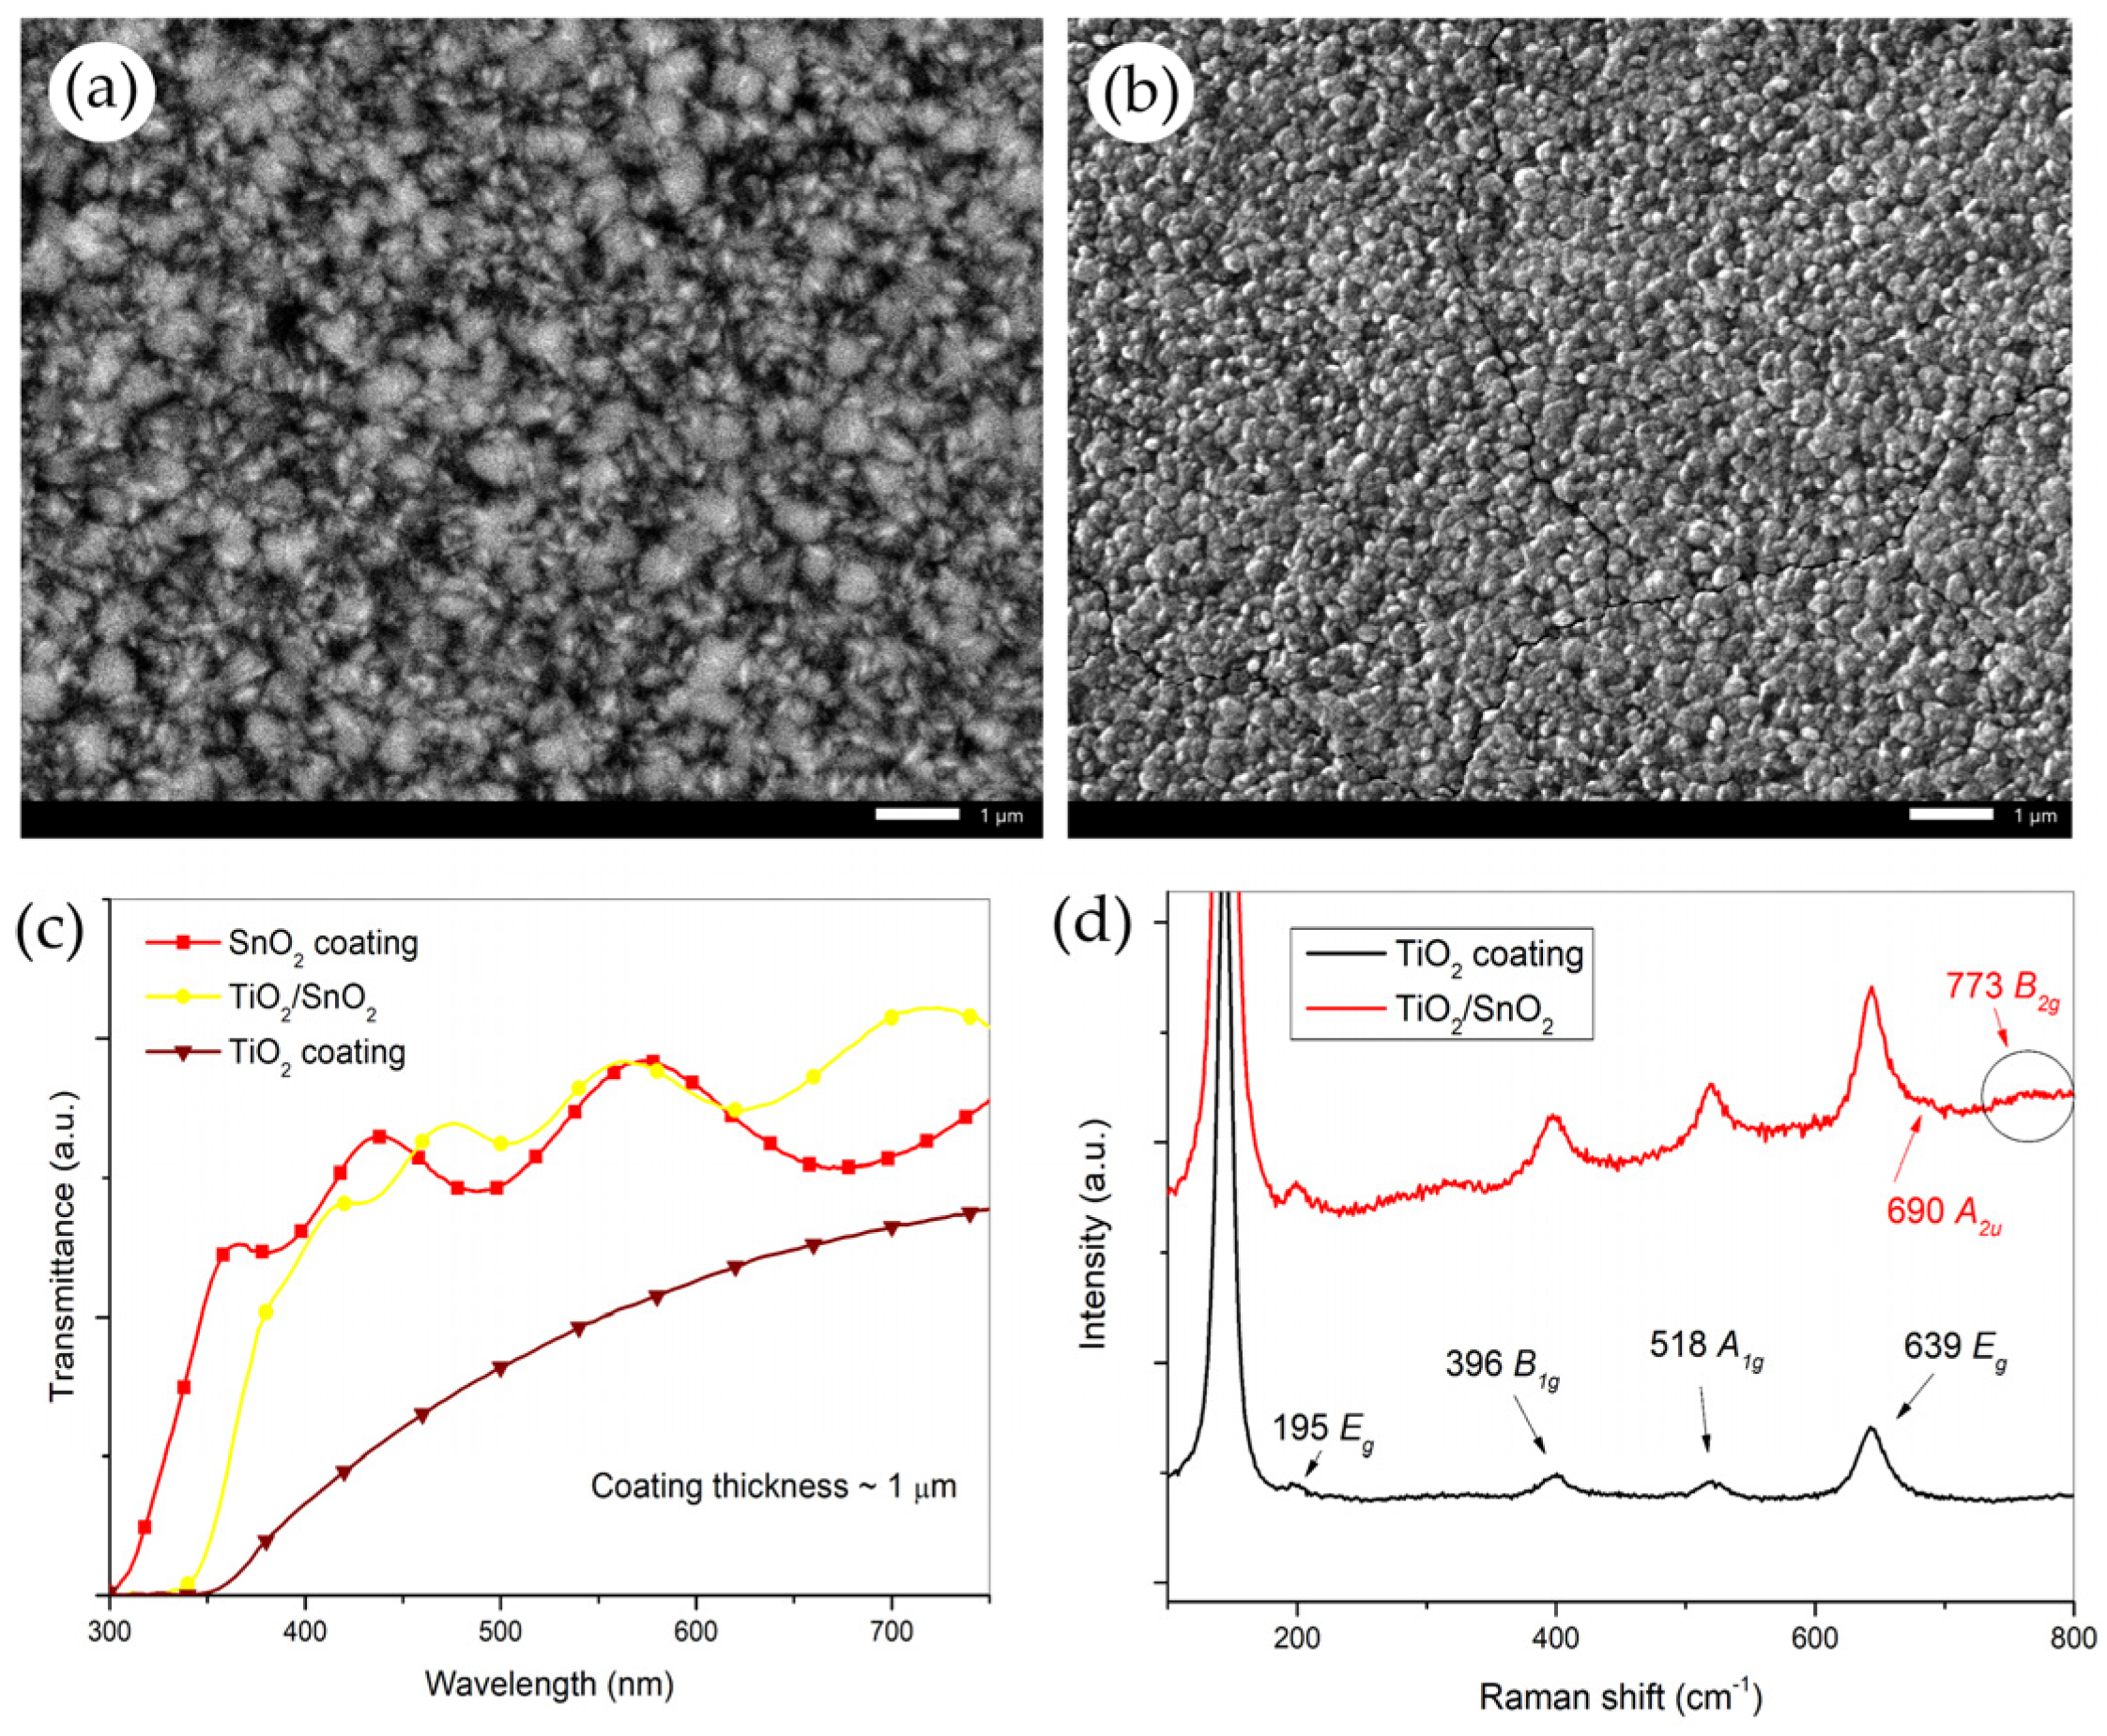
Figure 4 shows the results of testing titanium and tin oxide films deposited on quartz glass substrates.
Coating bilayers of tin and titanium oxides reached a thickness of ~1 micron, each layer being about 500 nm thick. Comparison between photographs in an electron microscope (
Figure 4a,b) shows that the top layer of tin oxide fills the voids between the columns of the developed surface of titanium oxide, increasing the smoothness of the surface. The spectral position of the fundamental absorption edge (
Figure 4c) for a titanium oxide film is difficult to determine due to the high scattering of a developed rough surface. The transmission edge upon coating with an additional upper layer (3.39 eV) is closer to the position in the spectrum of pure tin oxide (3.7 eV). The Raman spectra (
Figure 4d) of the titanium oxide film contain peaks [
40] allowing us to state that the coating is TiO
2–anatase. After applying an additional coating, small peaks A2u (690 cm
−1) and B2g (773 cm
−1) are observed in the Raman spectrum, which are typical for tin oxide [
41]. The dominant peak at 632 cm
−1 [
41] is overlapped by E
g (639 cm
−1) of titanium oxide. The Raman spectra obtained allow us to conclude that the synthesized films are indeed titanium and tin oxides [
42,
43,
44,
45], while the upper coating does not occupy the entire surface area of the lower one and has a low crystallinity. The quantitative measurement of oxygen content in combination with the content of tin via Energy Dispersive X–Ray Analysis (EDX) is challenging due to partial overlap of lines in the emission spectra intrinsic for these elements, especially in the case of a thin film deposited on an oxygen-containing substrate. Detailed characteristics of the SnO
2 film synthesized by the MOCVD method can be found in [
46].
In order to estimate LMR sensitivity to the variation of ambience refractive index, we have prepared a set of fiber sensors. The sensor comprises etched out fiber section of about 23 μm in diameter and 3.5 mm in length coated with thin films. Aqueous NaCl solutions with predefined salt concentrations were used for refractive index reference.
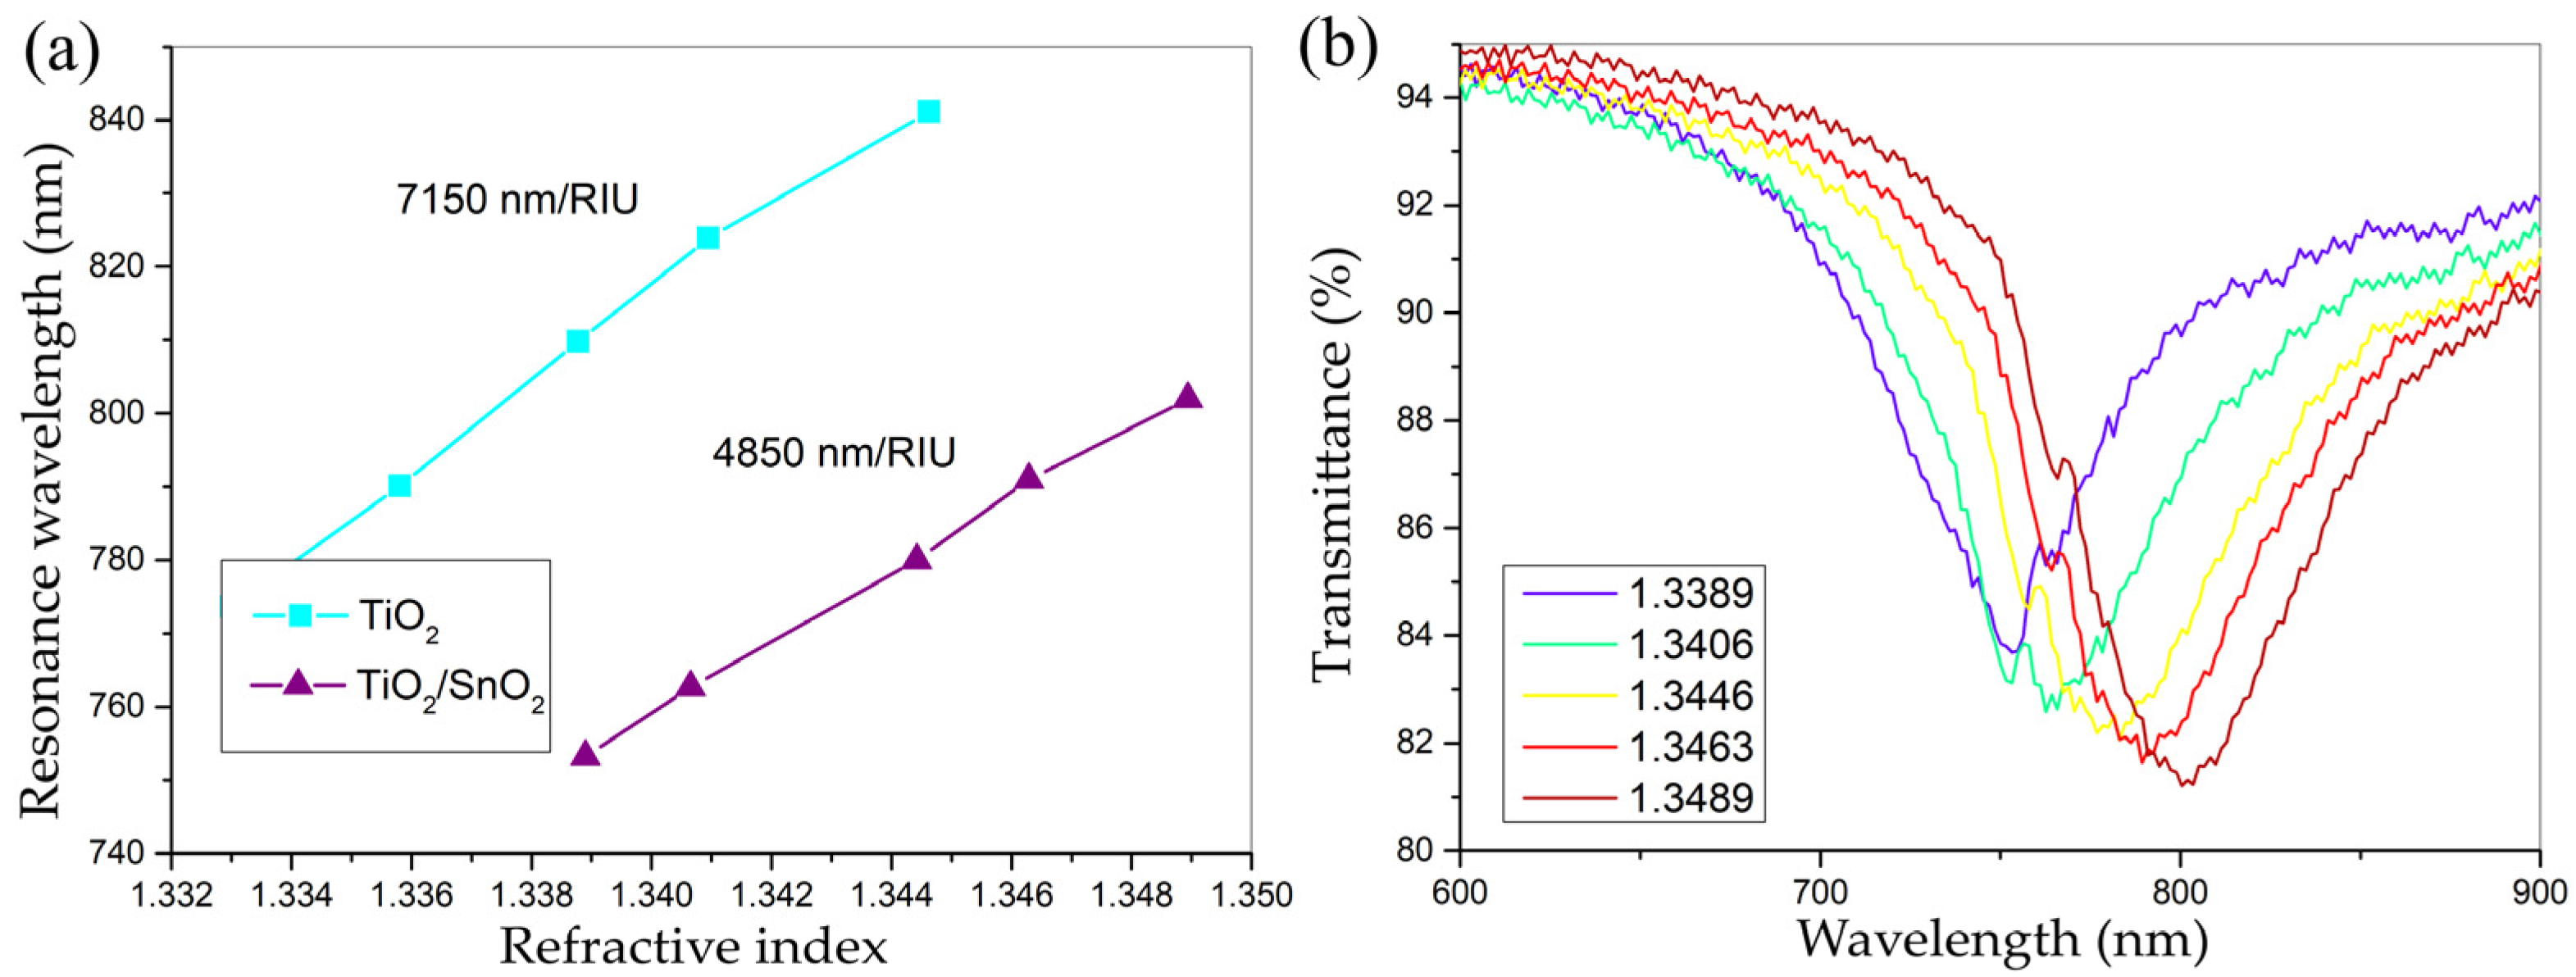
Figure 5 illustrates a comparison of the resonance shift dependence on the amount of salt in water for three different sensors. The values of the refractive index of aqueous salt solutions are taken from the handbook [
47]. Single-mode SMF-28 fiber sensors were used to characterize the coatings more accurately since the resonances are narrower due to a fewer number of modes.
It can be seen from the data presented, that in the studied range of refractive indices, the sensor with two layers shows a rather high sensitivity compared to analogues mentioned in the literature [
48]. The comparison is not completely correct, however, there is no information in the literature about the sensor with alternating thin-film layers, as in the presented work. The outstanding work [
49] is as close as possible for comparison, however, the sensor basically uses a D-shape fiber. Even in this case, the sensitivity to a change in the refractive index presented in the work is greater. At the same time, the sensitivity is less than that of a sensor with a single TiO
2 coating. This decrease is due to a decrease in roughness and a decrease in the area of the interacting coating. However, testing by repeated pouring with distilled water showed that the resulting sensor is as stable as that based on tin oxide and does not need to be heated to remove residual water from surface pores. Using the theoretical model presented in our previous paper [
26], we used optical constants for individual coatings of titanium and tin oxides to reliably confirm the resonance order on a single-mode fiber sensor.
Figure 5b shows a 1st TE-LMR. In the wavelength range of the used spectrometer, when the resonance reaches a position of about 900 nm, 1st TM-LMR is formed at a wavelength of about 500 nm, but its depth does not exceed the noise level. In addition, as is known from numerous publications and experimentally confirmed, the sensitivity of 1st TE-LMR is greater, and it is advantageous to use this resonance component from the sensitivity point of view.
It is difficult to estimate reliably the optical constants of a thin-film material covering a cylindrical surface by direct measurements, and by means of unconfirmed theoretical calculations as well. The partial purpose of the present study was not to characterize coatings by means of LMR, but only to demonstrate a possibility of reducing the roughness of TiO2 in sensors. For these reasons, we do not focus on the theoretical part.
3.2. The Effect of Optical Tweezers in a Thinned Fiber
The phenomenon of optical tweezers consists in the interaction of light with a large spatial intensity gradient and small particles (less than 10 μm) in size. Usually, in optical tweezers, the intensity gradient is created by focusing the light beam with a lens [
50,
51]. At the same time, a spatial (radial) intensity gradient is also formed in the vicinity of the light-guiding core of the thinned fiber. To obtain and use the effect of optical tweezers in a thinned fiber section by chemical etching, thinning of the fiber must be carried out almost to the light-guiding core, that is, to the conditional boundary of penetration of the evanescent optical field from the core into the cladding [
37]. The optimal distance from the outer boundary to the core in the thinned area will be approximately equal to the wavelength at which the measurements will take place.
LMR sensors based on film-coated single-mode fibers have a strong dependence of resonance on the distance between the light-guiding core of the fiber and the film of the coating material. For tin and titanium oxide films, a waist of cylindrical segment less than 20 μm leads to the fact that the dynamic range of standard spectrometers is insufficient to resolve the resonance position in the transmission spectrum due to the closeness of the transmitted light intensity to zero. In addition, a large difference in the CTE of quartz glass and the deposited film leads to the destruction of sensors prepared on the thinned fiber section. Simultaneously the effect of optical tweezers and the possibility of controlling the position of the resonance in the transmission spectrum of the optical path, it is more convenient to use multimode fibers with a thin reflective sheath, which can be etched out down to the core without the problems described earlier. Further experiments were carried out on multimode fiber sensors.
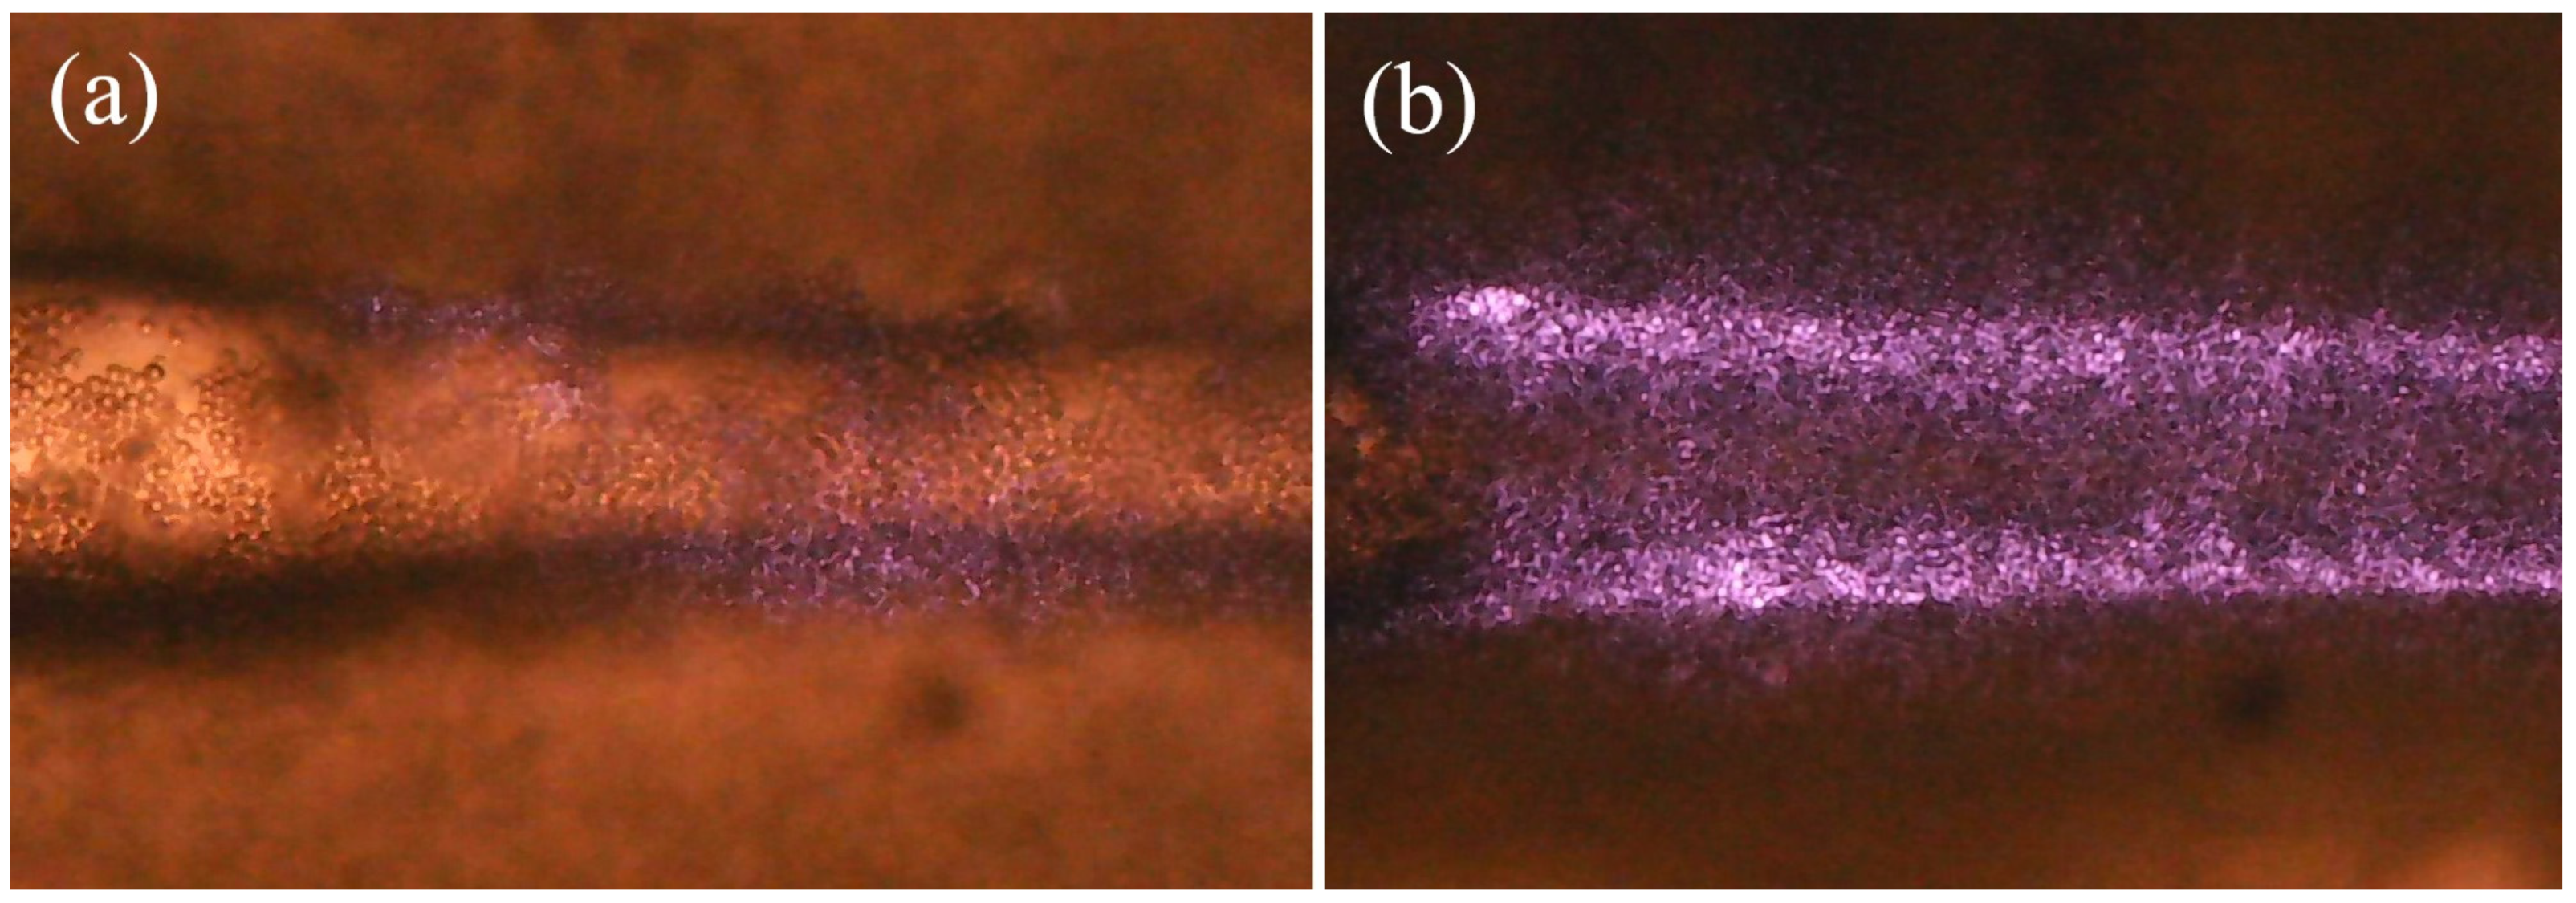
Figure 6 shows optically enlarged images of a section of the fiber surface immersed in a liquid containing microalgae. Since the digital camera of the microscope could register an image in infrared light, for better visualization of the fiber surface, radiation from a laser diode with a maximum at a wavelength of 976 nm was introduced into the fiber. Scattered by an inhomogeneous surface due to cell adhesion, IR radiation creates a characteristic glow visible in photographs (
Figure 6).
A segment of a multimode fiber etched to a diameter of 90 microns on a segment 3.5 mm long and covered with a thin two-layer film was placed in an aqueous solution containing microalgae. The nutrient medium was diluted with distilled water so that the dry weight of the microalgae suspension in the resulting solution was 1.6 kg/m
3. Under the action of an evanescent optical field, microalgae cells are attracted to the surface of the fiber in the vicinity of the bare core of the fiber and are grouped at the maximum of the radial gradient at the boundary (
Figure 6a). As a result of an hour-long exposure to the laser light injected into the fiber, the microalgae adhered tightly to the surface of the fiber, causing strong scattering of the injected laser light (
Figure 6b). Experience has shown that if after complete evaporation of the liquid, without removing the introduced radiation, the thinned fiber section is again filled with water, the algae will still remain on the surface of the light guide.
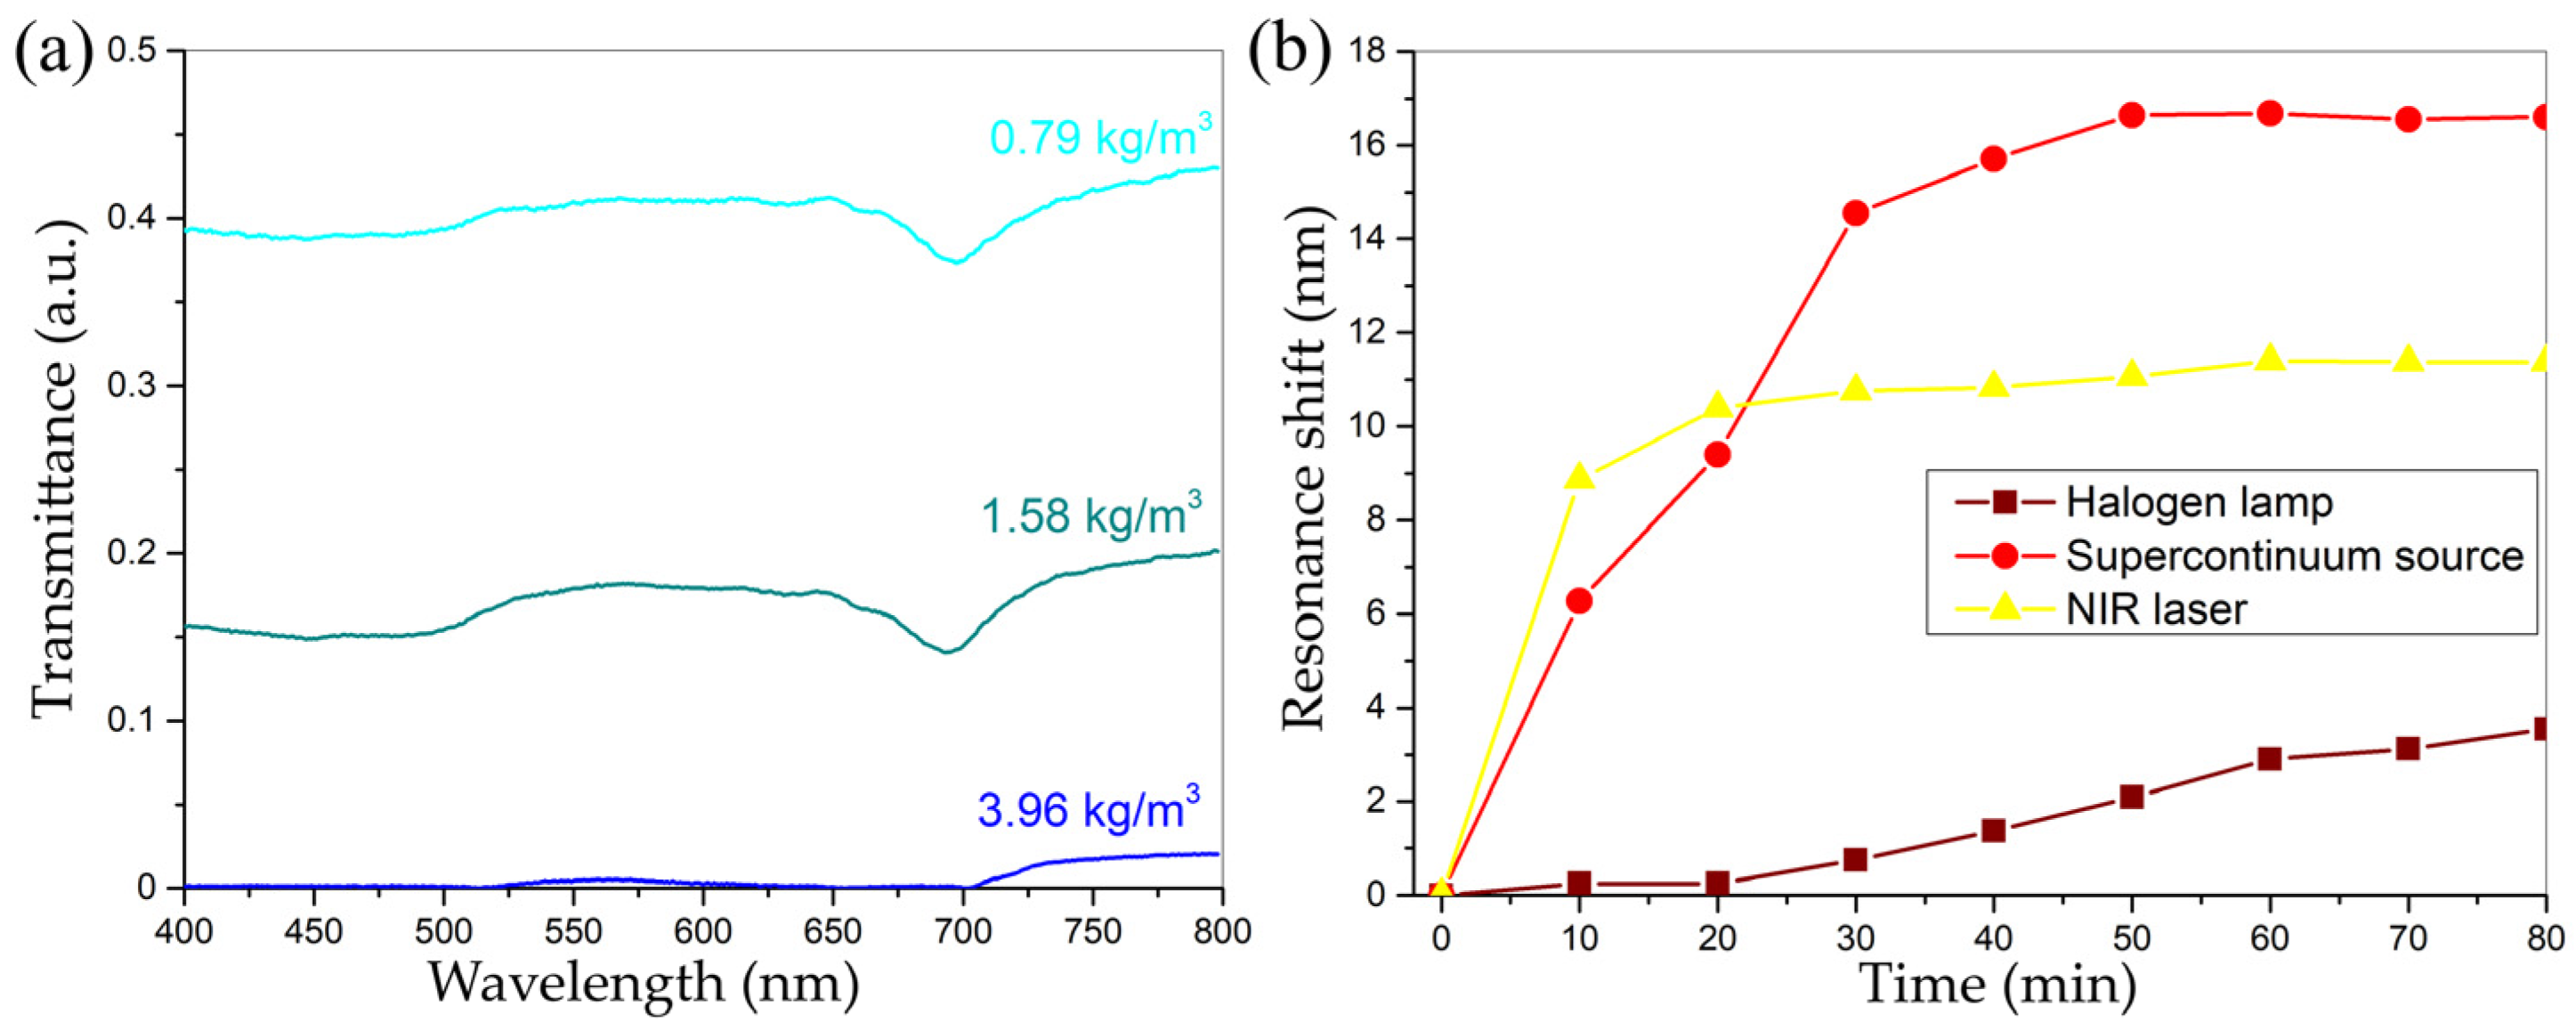
Chlorella vulgaris is green unicellular microalgae, and due to the presence of a cell suspension in water, characteristic features in the visible region appear in the transmission spectra (
Figure 7a). Transmission spectra in
Figure 7 of a live algae suspension coincide with the literature data for a similar concentration of dry matter in solution [
52]. To register small changes in the refractive index, as many microorganisms as possible should be attracted to the surface of the fiber from the solution. Various radiation sources can be used to implement the optical tweezers method.
Figure 7b shows a comparison of the LMR shift in an aqueous solution containing chlorella, caused by the concentration of cells on the surface of the sensor using the effect of optical tweezers for this purpose when radiation from various sources is introduced into the fiber.
Comparison of the effect of optical tweezers on a thinned fiber section using different light sources showed that, compared to light from an incandescent lamp, the effect of coherent radiation is much stronger (
Figure 7b). The shift of the LMR shows that in the sensor-sensitive area adjacent to the fiber, the optical density of the medium increases, and consequently, the number of algae cells increases, and the greater the shift, the more microalgae cells appear on the surface of the fiber. The best result was shown by a supercontinuum source with a wide spectrum of light generation in the wavelength range from 360 to 1800 nm and an integrated power in the visible spectral range of about 10 mW. However, as mentioned earlier, radiation with a wavelength shorter than 590 nm stimulates photocatalysis on the surface of the titanium dioxide film, so the use of an IR laser is preferable. In addition, the graphs show that after 60 min of exposure, all dependences reached a linear level, which means that the amount of dry matter stopped arriving in the sensitive area. This time coincides with the time of sedimentation of a suspension of algae in water to the bottom of a container or cuvette in a two-millimeter column of liquid.
3.3. Study of Algae and Their Vital Activity Using LMR
The LMR bias can also be used for absolute control of such parameters as the refractive index of the mixture with algae and the amount of dry matter.
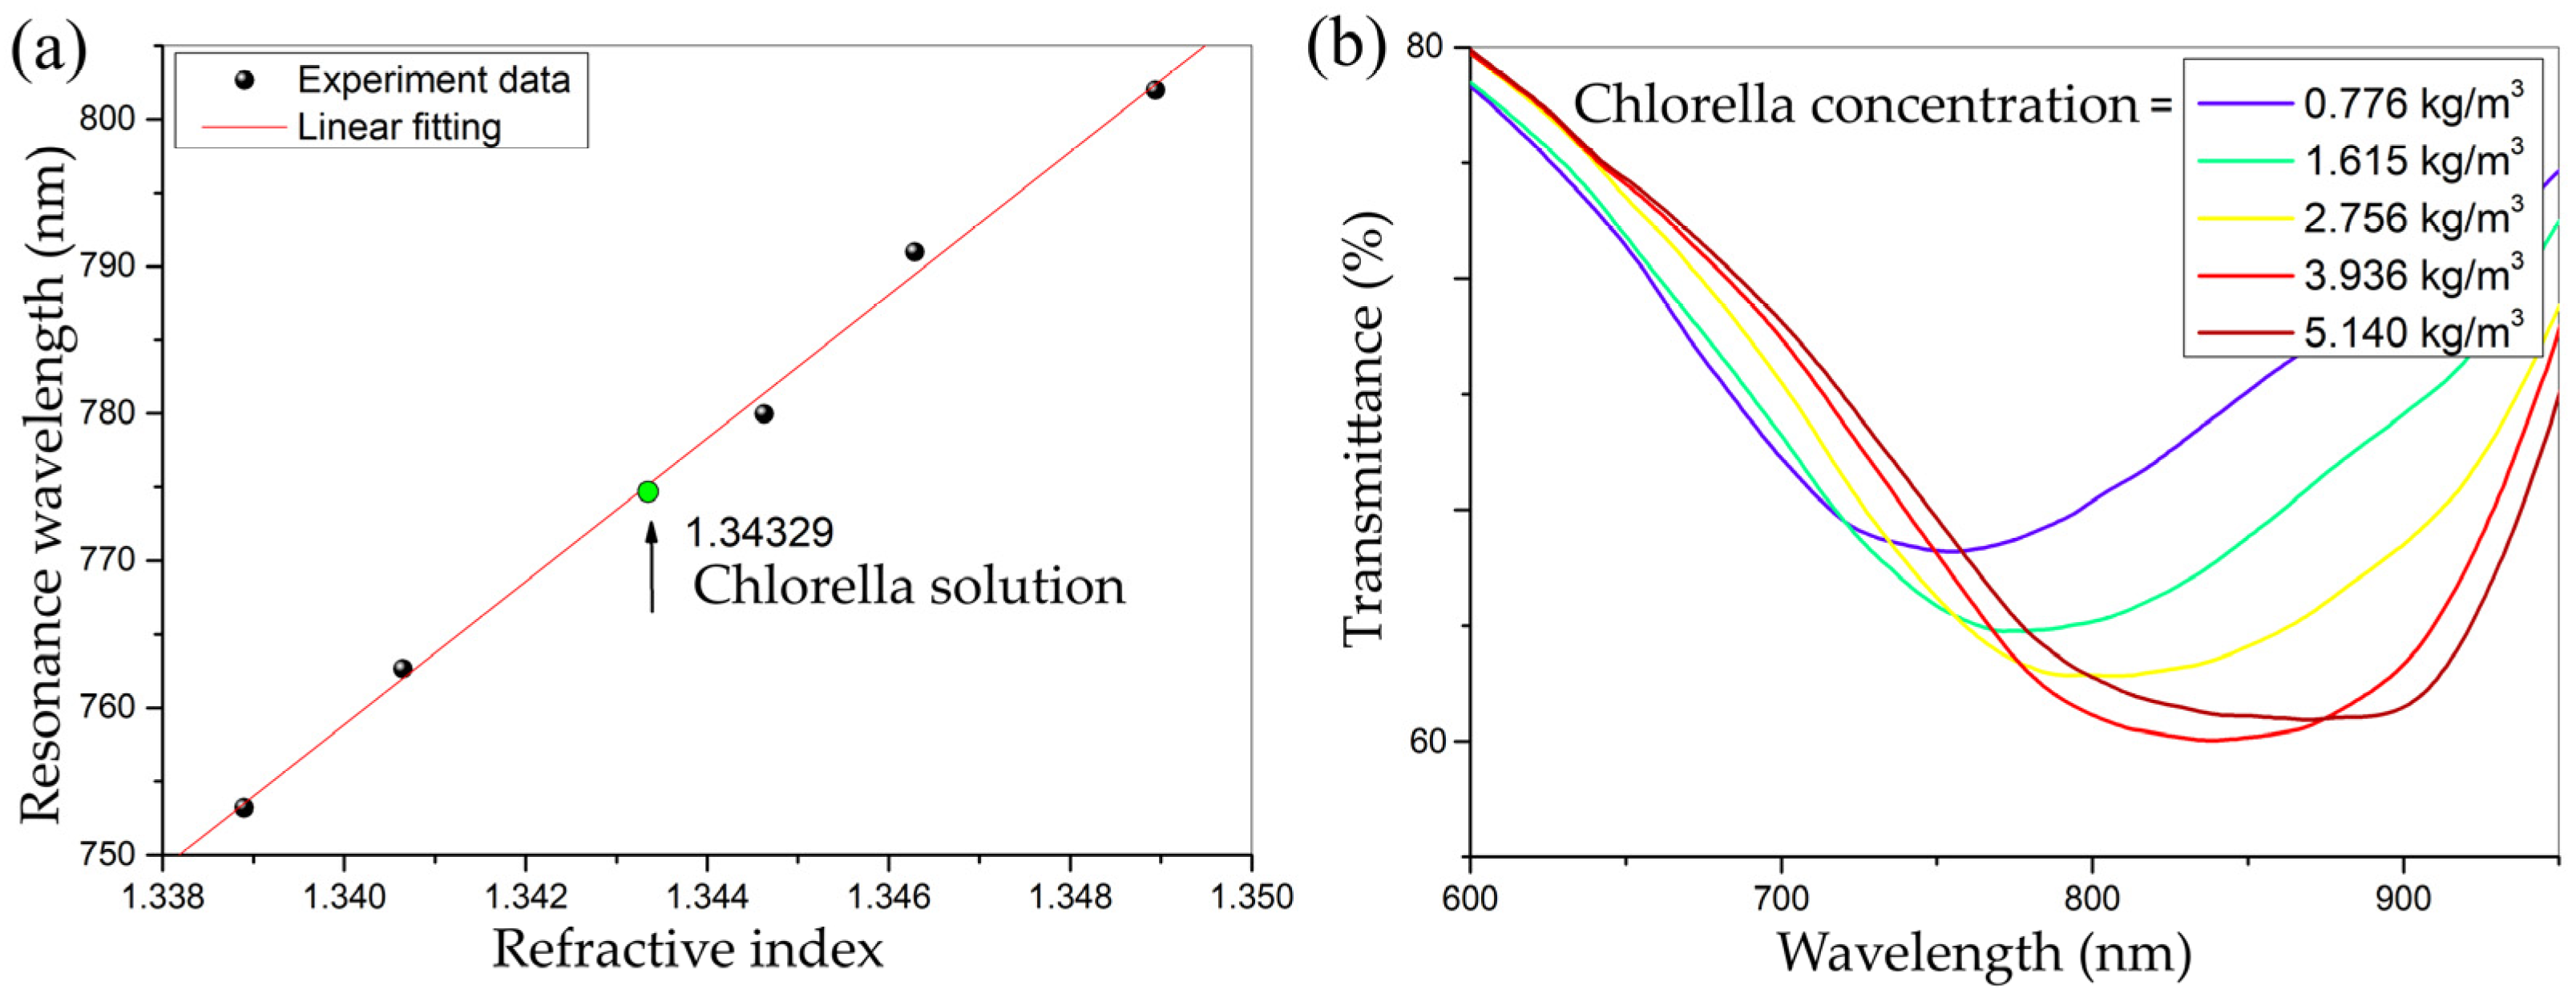
A calibration plot of resonance position versus liquid refractive index based on aqueous NaCl solutions is shown in
Figure 8a. The points can be approximated linearly due to the relatively small interval in the refractive index. Using the resulting linear dependence, one can obtain the approximate refractive index of a liquid containing 1.6 kg/m
3 of dry weight of algae equal to 1.34329 (
Figure 8a—green dot).
Figure 8b illustrates the transmission spectra of solutions with which further experiments described in the text are being carried out. The resonance maximum is determined by the point with maximum depth since the graphs are rather smooth. The position of the resonance was not determined for the concentration of 5.14 kg/m
3 in
Figure 8b since the resonance wavelength position is too close to the detection edge of the spectrometer.
Based on the data on the shift of the resonance for different concentrations of algae cells, an experiment was carried out to control the dry mass in the process of reproduction of microalgae. Depending on environmental conditions, such as the availability of light for photosynthesis and carbon for food, algae adds varying amounts of mass over time. Under optimal conditions, green algae are completely divided in 24 h.
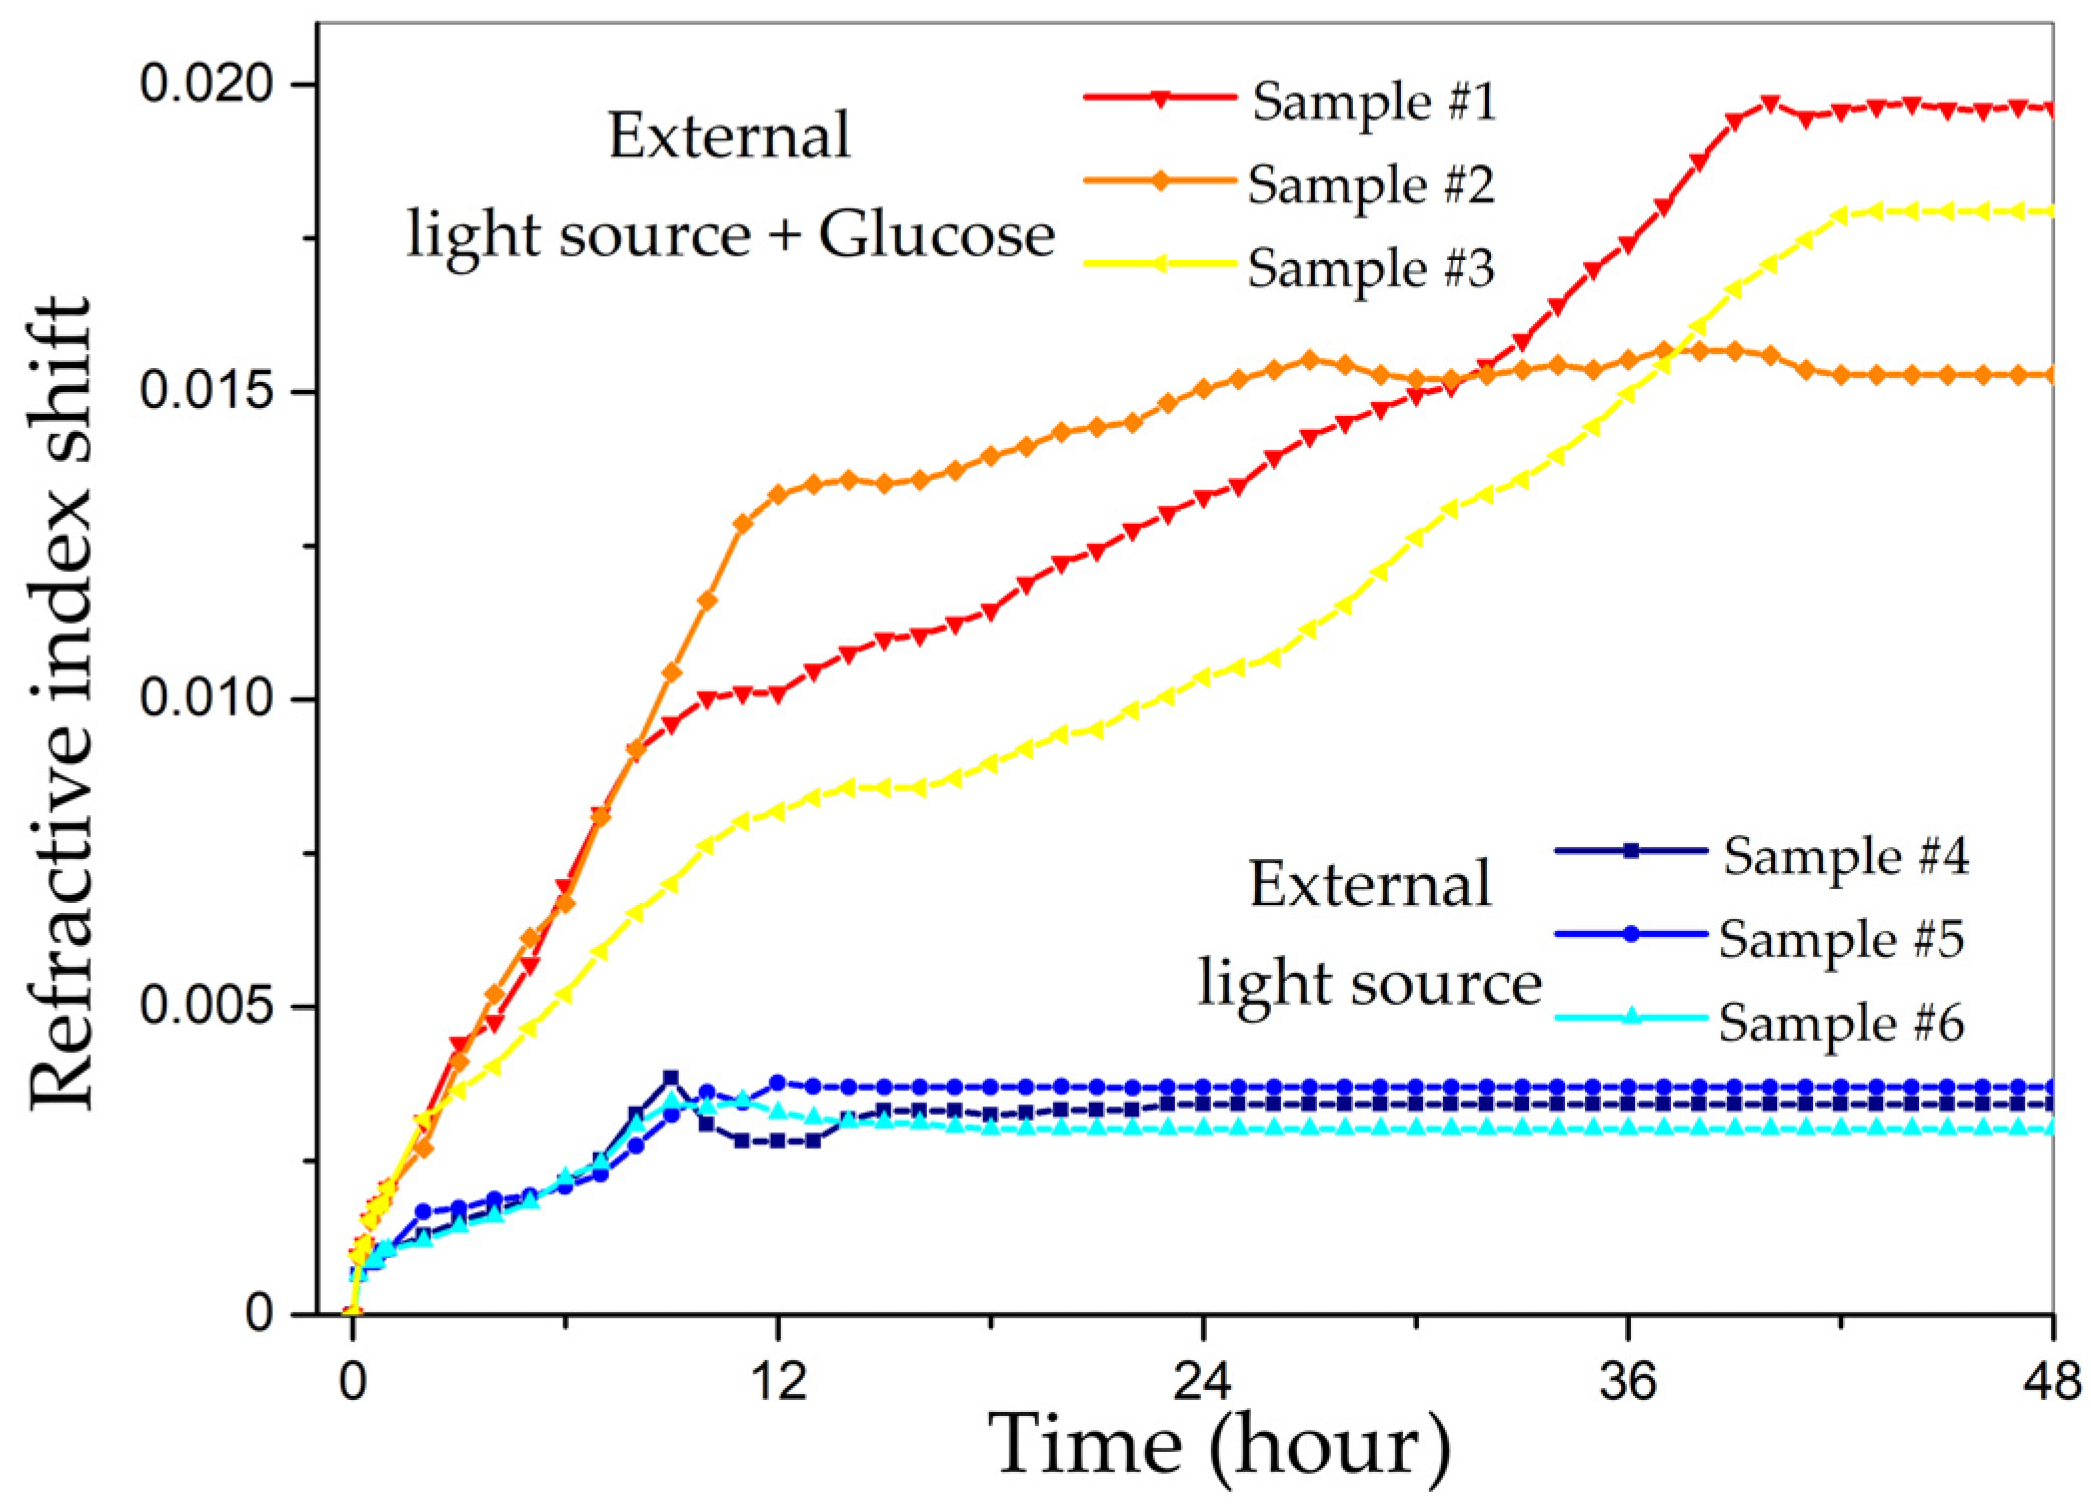
Figure 9 illustrates the displacement of the resonance under different environmental conditions. The liquids were thermostatically controlled at a temperature of about 25 ± 0.5 °C.
Different samples denote successive measurements of the same solutions with microalgae under various conditions, performed on the same fiber sensor. Suspension samples 1–3 provide information on testing suspensions containing additional glucose and using an external light source. Suspension samples 4–6 did not contain additional glucose but were only illuminated. The suspension in which algae are located contains a small amount of glucose and amino acids so that after defrosting, the algae have enough food. During the first hour, the algae settle, accompanied by an active resonance shift. When irradiated with external light for the first 9–11 h, cell division occurs, accompanied by an increase in the refractive index. Dead microalgae also continue to be held by the effect of optical tweezers. At this stage, we cannot separate the influence of living and dead cells separately on the position of the resonance. With a lack of food, most of the algae die, and the remaining organisms have time to absorb the remaining glucose from the liquid, due to which the refractive index of the boundary layer will decrease. This phenomenon is accompanied by a reverse shift of the resonance, after which the position stabilizes at a certain level. It can be concluded that this is where active life stops. When glucose is added to the solution, for a larger amount of food equal to the amount of dry mass of algae in the solution, the shift in the first 9–11 h is more significant. When compared with previous tests, the growth of algae cells was more than two times. After the stage of active growth, some of the cells die, but there is still enough food to continue life, but at a slower pace. After the 40th hour, the position of the resonance stabilizes. At the same time, if neither additional food nor external lighting is used, after settling, the resonance shifts in the opposite direction, after which it stabilizes by the 4th hour. This means that in addition to the breakdown of glucose from the liquid, active life does not occur. Based on the results obtained, it can be said that the conditions were not optimal for complete division, but that their influence is well traced and recorded on the increase in the live weight of chlorella.


