Communication

Fossil Plant Remains Diagnostics by Laser-Induced Fluorescence and Raman Spectroscopies

by
Alexey F. Bunkin
1,*,
Sergey M. Pershin
1,
Diana G. Artemova
1,
Sergey V. Gudkov
1,
Alexey V. Gomankov
2,
Pavel A. Sdvizhenskii
1,
Mikhail Ya. Grishin
1 and
Vasily N. Lednev
1
1
Prokhorov General Physics Institute, Russian Academy of Sciences, 38 Vavilova Street, 119991 Moscow, Russia
2
Komarov Botanical Institute, Russian Academy of Sciences, 2 Professora Popova Street, 197376 Saint-Petersburg, Russia
*
Author to whom correspondence should be addressed.
Photonics 2023, 10(1), 15; https://doi.org/10.3390/photonics10010015
Submission received: 8 November 2022 / Revised: 3 December 2022 / Accepted: 21 December 2022 / Published: 24 December 2022
(This article belongs to the Topic Advances in Optical Sensors)

Abstract

:
Fossilized plant remains have been studied simultaneously by laser induced fluorescence and Raman spectroscopies, to reveal the prospective methods for onsite or/and laser remote sensing in future extraterrestrial missions. A multiwavelength instrument, capable of fluorescence and Raman measurements, has been utilized for the study of isolated plant fossils, as well as fossils associated with sedimentary rocks. Laser-induced fluorescence spectroscopy revealed that plant fossils and rocks’ luminosity differed significantly due to chlorophyll derivatives (chlorin, porphyrins, lignin components etc.); therefore, fossilized plants can be easily detected at rock surfaces onsite. Raman spectroscopy highly altered the fossilized graphitic material via the carbon D and G bands. Our results demonstrated that combined laser-induced fluorescence and Raman spectroscopy measurements can provide new insights into the detection of samples with biogenicity indicators such as chlorophyll and its derivatives, as well as kerogenous materials. The prospects of multiwavelength LIDAR instrument studies under fieldwork conditions are discussed for fossils diagnostics. The method of laser remote sensing can be useful in geological exploration in the search for oil, coal-bearing rocks, and rocks with a high content of organic matter.

1. Introduction

The development of new instrumentation for remote sensing is in high demand in different fields of industry and research, due to its capability to perform measurements in the required time and place. LIDAR (Light Detection And Ranging) instruments [1,2] are utilized in a broad range of applications, from agricultural applications [3,4,5,6,7,8,9], the discovery of ancient cities [10], as well as for the study of the Earth’s atmosphere [11,12,13,14]. For example, a Cloud-Aerosol Lidar with Orthogonal Polarization (CALIOP) instrument was installed on a satellite to study clouds and atmospheric aerosol dynamics [11,12]. Another example is a SuperCam instrument, installed on the Perseverance rover for NASA’s Mars 2020 exploration program [15,16,17]. The SuperCam instrument combines three different techniques for remote measurements at distances up to 7 m: laser-induced breakdown spectroscopy (LIBS) for elemental analysis, Raman spectroscopy for the identification of minerals, and laser-induced fluorescence spectroscopy for the detection of chromophore molecules. The detection of life on Mars is the primary goal of NASA’s Mars 2020 exploration program; therefore, the SuperCam instrument was developed to find indicators of hidden or/and past life on Mars. The same Perseverance rover carries the SHERLOC (Scanning Habitable Environments with Raman and Luminescence for Organics and Chemicals) instrument to reveal bioactive molecules such as proteins or DNA. The SHERLOC instrument is based on a continuous wave UV-laser for the careful investigation of an area of interest via contact measurements [18,19]. Owing to the environmental conditions of Mars, the possible indicators of past life on Mars might include carbonated spores and bacteria, although some unicellular algae might be found under the surface. Consequently, the detection of such species by laser remote sensing is very promising.
Another promising application of laser remote sensing technology is in paleobotany. Paleobotanical samples are studied by laboratory-based techniques such as optical microscopy, scanning electron microscopy (SEM), and synchrotron radiation X-ray tomographic microscopy (SRXTM) [20]. Recently, alternative analytical techniques have been utilized for paleontological sample studies to extract more information on the chemical structure, rather than the morphology of the sample. For example, Raman spectroscopy provided information on the molecular structure and fossil biogenicity [21,22]. Raman spectroscopy has become increasingly prominent in paleobiology due to its potential to detect large bioactive molecules (proteins, DNA etc.) and bacteria [23,24,25]. The laser-induced fluoresce technique can be also utilized for the detection of large bioactive molecules, but it has a significantly higher sensitivity for detecting chemicals at a very low concentration level [7,26,27].
Here, we utilized both laser-induced fluorescence and Raman spectroscopies for plant fossil sensing to demonstrate the prospects of laser remote sensing for onsite or/and remote measurements at the place of interest. We were focused on the study of fossilized plants (also called “compressions”) by laser spectroscopy methods. Fossilized plants are the coalified remains of plant material that preserve the organic nature of the molecules composing them. The interest in studying fossilized material is due to the fact that, despite some chemical transformations in a plant after its death, in many cases, the products of these transformations remain for hundreds of millions of years [28,29]. The part of higher plants that, chemically, changes the least is the cuticle, a thin surface film secreted by soft plant organs (leaves, petals) to protect against chemically active substances contained in the air [30]. The cuticle mainly consists of cutin, an organic fat-like substance, and a mixture of polyesters and hydroxy acids, impervious to water and gases [31]. Cutin is rather chemically stable which ensures, on the one hand, its protective function during the life of the plant, and, on the other hand, good preservation after a death and the burial of the plant in the rock. Fossilized plant materials, as a rule, mainly contain a cuticle, inside which there are the remnants of plant tissues that have undergone, generally, stronger chemical and physical alterations.

2. Experiment

2.1. Instrumentation

For laser-induced fluorescence and Raman spectroscopy measurements, the nanosecond LIDAR was developed at Prokhorov General Physics Institute of RAS [5]. The instrument is based on a pulsed Nd:YAG laser (1064, 532 and 355 nm; pulse energy 600, 280 and 100 mJ for fundamental, second and third harmonics respectively). The fundamental harmonic was converted to the second (532 nm) and third (harmonic) by KDP and BBO crystals, respectively, but output laser beams were combined coaxially by dielectric mirrors. Two prisms were used to align the probe laser beam and the optical path of the receiving channel. The laser beam was directed by a plane aluminum-coated mirror to the remote target. The same mirror reflected scattered photons to the telescope (200 mm in diameter, aperture of 1/3), which focused the irradiation to the spectrograph input slit via another aluminum-coated mirror (l × h:4 × 3 cm) and dielectric edge-filter to suppress the elastic scattering. Depending on the utilized wavelength, we can install the required edge-filter for 532 or 355 nm in order to prevent damage to the detector. Different diffraction gratings (300 and 1200 lines per mm) can be used depending on the required spectral resolution. In the first diffraction order of the spectrograph (300 lines/mm grating), the single-measurement spectral window was 525 nm with a 0.5 nm spectral resolution, which was sufficient to record the broadband fluorescence spectra. The spectrograph was equipped with an intensified CCD (ICCD) camera (Andor iStar). The minimum detector gate is 3 ns, but the laser pulse duration is 8 ns; therefore, for Raman spectroscopy measurements, we used a gate of 10 ns, while for fluorescence spectroscopy measurements, the gate was set to 200 ns. The position of the sample surface was located by finding the elastic scattering maximum for the spectra acquired with the different delays. The gated detection effectively suppressed the captured sun irradiance, so the background was almost zero.

2.2. Samples

Fossilized plants at the rock surface, as well as those isolated from the rock, and several chemically treated samples were measured by laser-induced fluorescence and Raman spectroscopy. Descriptions of the samples and their corresponding photos are presented in Table 1. The samples originate from the different geological deposits and have been dated to be in the range of 250–400 million years old. In order to estimate the capabilities of onsite laser-induced fluorescence spectroscopy, measure the imprint of the fossilized plants, and distinguish the plant material from the rock, the cuticle should be obtained in its pure form. To obtain the cuticle in pure form, the fossil materials were subjected to a chemical treatment process. At the first stage, they were treated with a Schulze’s reagent (concentrated nitric acid (HNO3) and Bertolet’s salt (KClO3)); as a result, all organic substances, with the exception of cutin, were oxidized into humic acids. At the second stage, these oxidation products were dissolved in ammonia. Additionally, we studied a dry leaf of the gymnosperm Ginkgo biloba, which is the closest modern relative of the studied plants, including Tatarina and Phylladoderma.

3. Results and Discussion

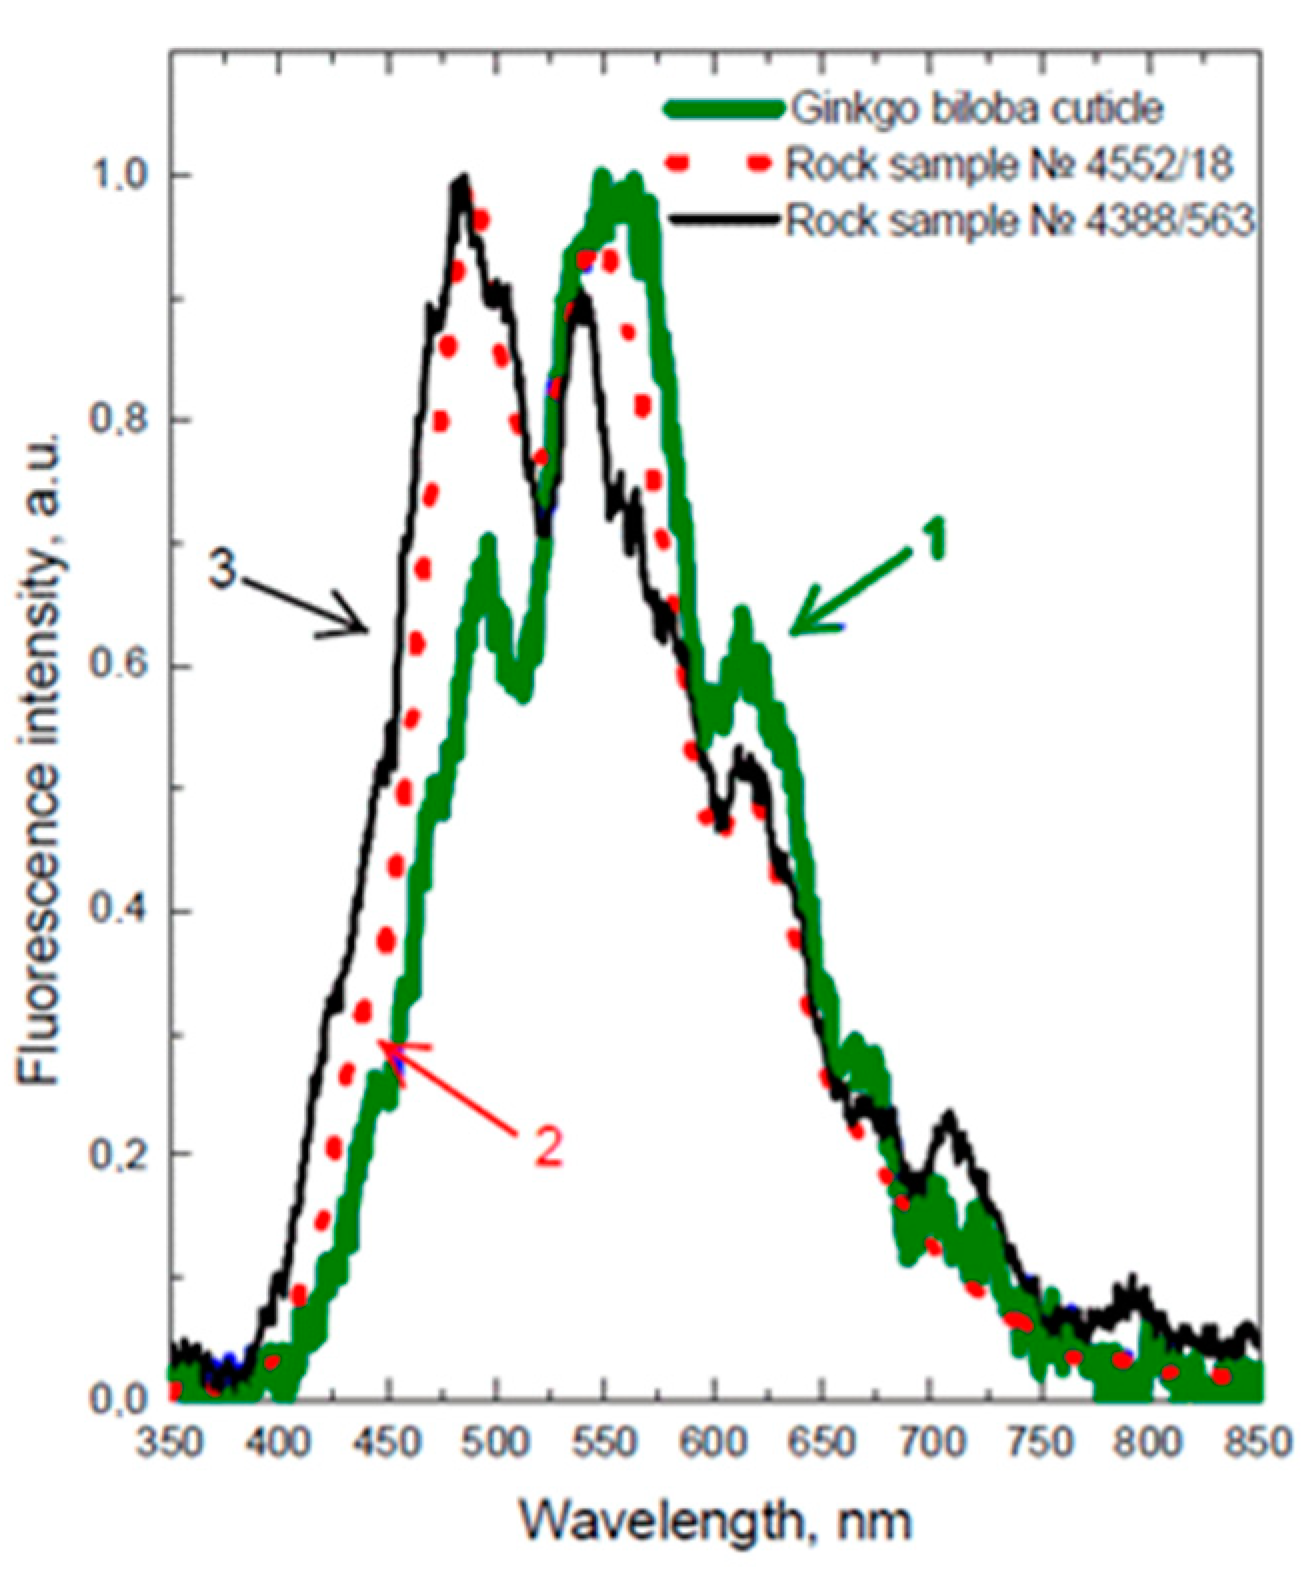
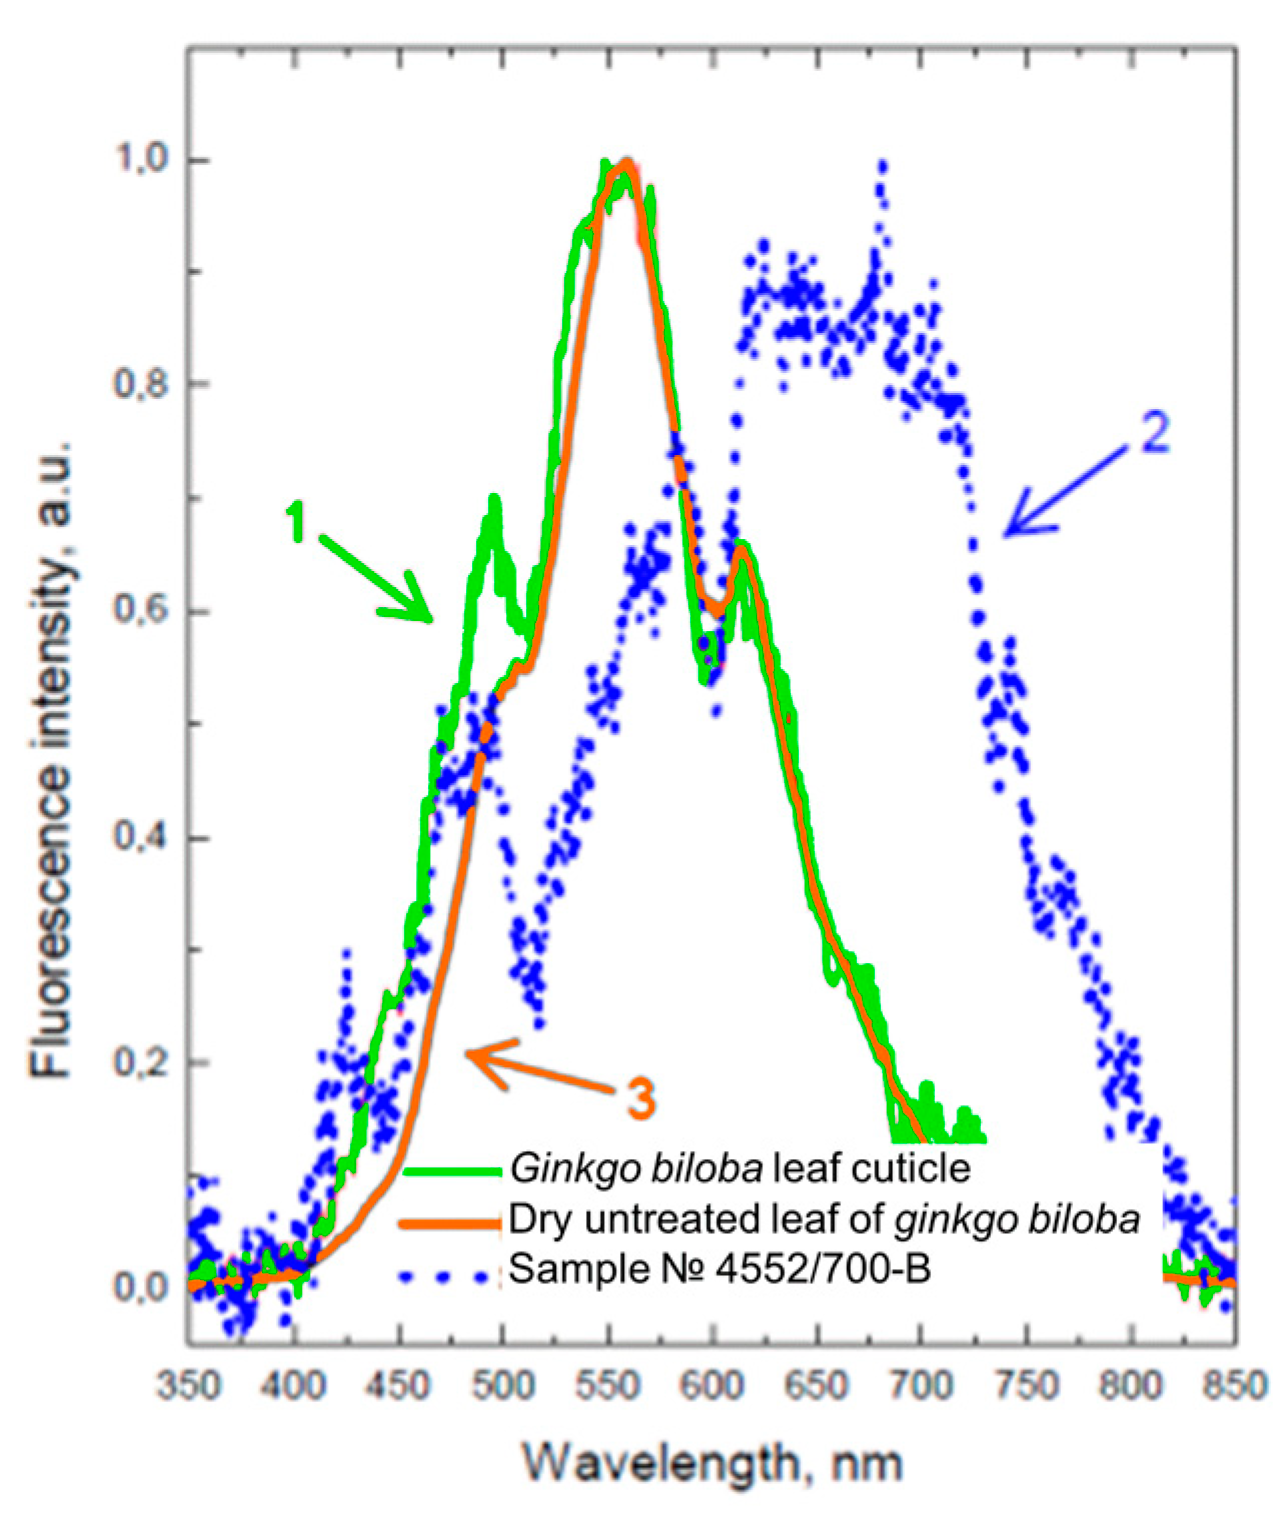
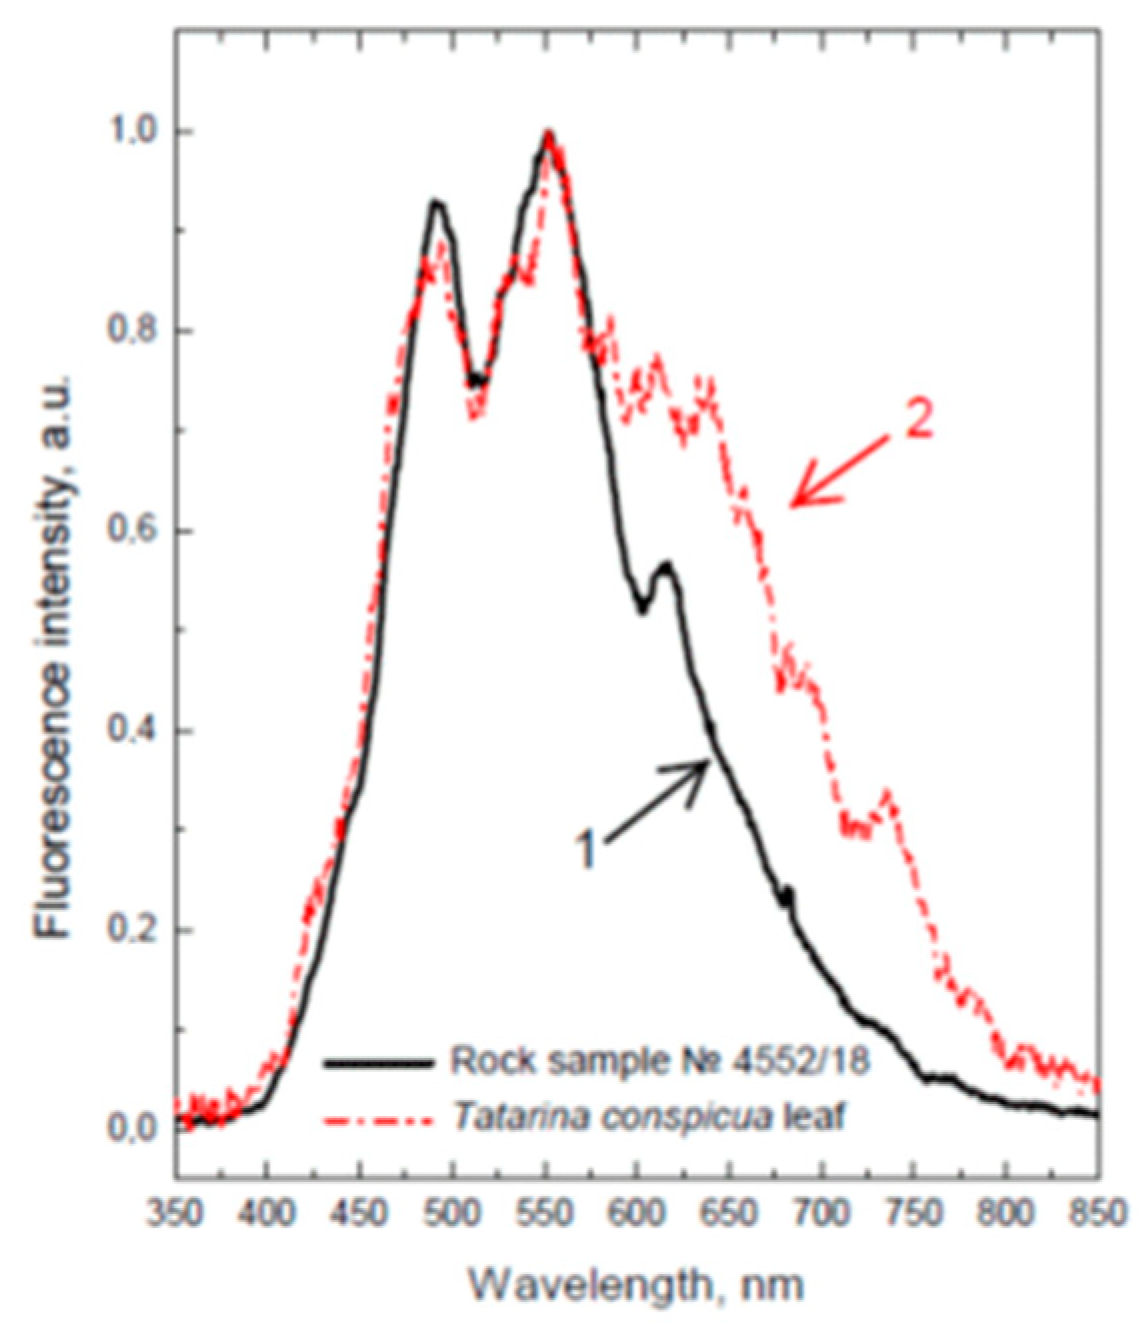
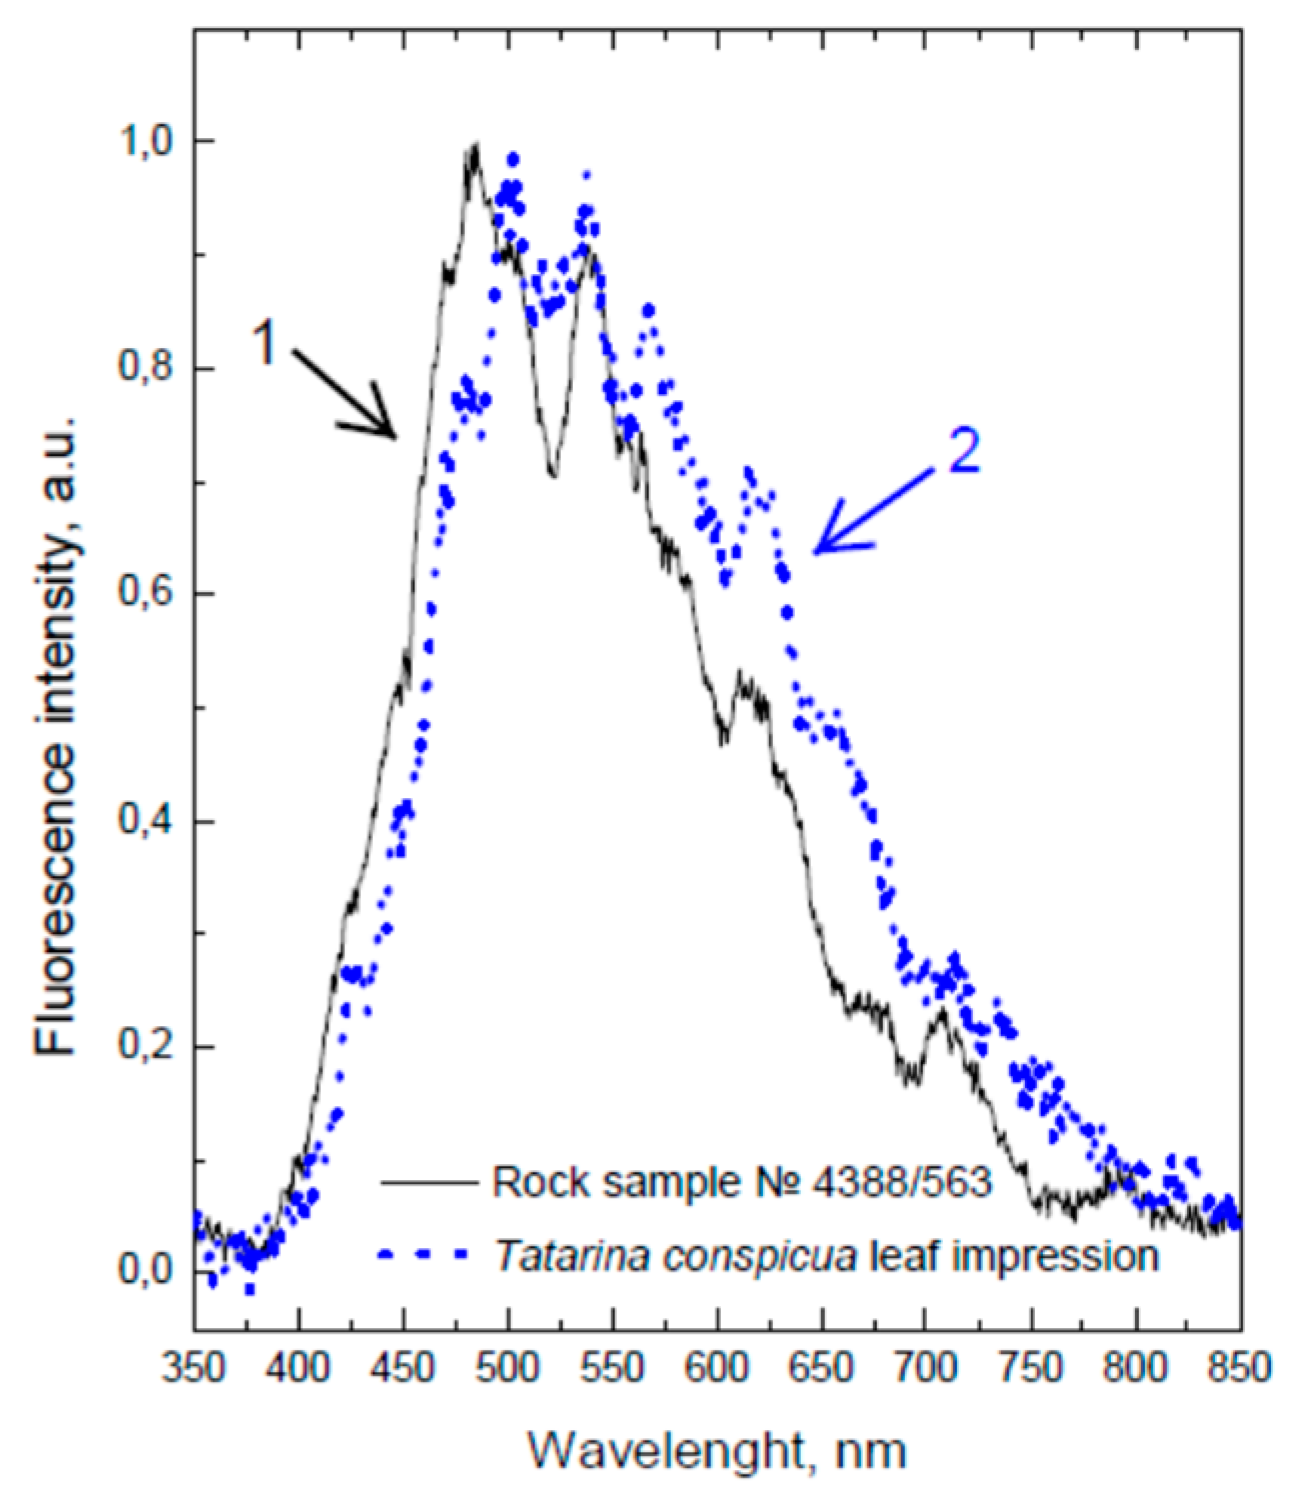
3.1. Laser-Induced Fluorescence

Before laser-induced fluorescence measurements were performed, we utilized conventional fluorescence spectroscopy with varied excitation wavelengths. For the isolated fossilized material (sample 1865/3), a fluorescence map was acquired with a fluorescence spectrometer (FP 8300 by JASCO); the results are presented in Figure 1. The fluorescence spectra intensity was very low for the fossilized material, so Figure 1’s signal was scaled for a better presentation. Some spectral features at 305, 325 and 350 nm excitation can be distinguished. These features originate from the fossilized material or from the fluorescence spectrometer instrument, since the fluorescence map was quantified at a very broad intensity range, while low intensity signals were what we were interested in. To verify this assumption, we measured the fluorescence spectrum at a 305 nm excitation for Spectralon® material, which did not produce fluorescence at a UV excitation. However, fossilized plant samples and Spectralon® have the same spectra, so the spectral features on the fluorescence map (Figure 1a) should be attributed to the instrument function.
Since no meaningful results were achieved by conventional fluorescence spectroscopy with Xe-lamp excitation sources, we utilized laser-induced fluorescence spectroscopy; this is known to provide very high sensitivity, up to single molecule detection [32,33,34]. Both the 355 and 532 nm excitations were utilized for laser-induced fluorescence measurements. However, a wide broadband emission without any peaks has been observed for the 532 nm excitation, so all of the fluorescence data discussed below were achieved with the 355 nm excitation. It should be noted that no visual defects were observed by optical microscopy for spots sampled by laser pulses. We also did not detect any difference in the fluorescence spectra if the same spot was sampled multiple times; therefore, the material damage was estimated to be negligible. Examples of the laser fluorescence spectra of the studied samples are presented in Figure 2, Figure 3, Figure 4, Figure 5 and Figure 6 for the 370–850 nm spectral range. Almost all of the spectra show three peaks; these are in the regions of 480, 550 and 620 nm, and a weakly pronounced peak is near 670 nm. The exceptions are the untreated leaves of Ginkgo biloba, which show only a small shoulder instead of a maximum of 480 nm (Figure 2), and sample No 4552/700-B (cuticle of Phylladoderma annulata), which does not have a distinct maximum of 550 nm (Figure 3). The similarity of the fluorescence bands, in objects as different as the fresh prepared cuticle and the fossil imprint (Figure 2), can be considered as proof of the similarity between the chemical compounds contained in the samples.
The fluorescence spectrum of the untreated Ginkgo biloba leaf was very close to the spectrum of its cuticle (Figure 3), while the cuticle spectrum of the fossil Phylladoderma (Aequistomia) annulata (sample No 4552/700-B) differs significantly both from the spectrum of the modern cuticle (Figure 3) and from the spectrum of its untreated fossilized material (Figure 4 and Figure 5); compare the bands at 600–700 nm and the absorption of the 700–800 nm range. The spectra of fossilized material (samples No 4388/563 and 4552/18) differ, although not much, from the spectra of the rocks containing them, with a higher intensity in the red band (600–800 nm, Figure 4 and Figure 5). The greater the quantity of plant that has been contained, the greater the difference between the spectra of the fossilized material and the spectra of the rock. All samples demonstrate another additional maximum in the region of 570–580 nm (Figure 2, Figure 3, Figure 4 and Figure 5).
According to our earlier studies, the residual organic matter of ancient sedimentary rocks (algal limestones) has a wide maximum (520–580 nm), associated with the fluorescence of condensed aromatic structures [5,35]. This band can be distinguished from the rock fluorescence spectrum and used as an indicator to characterize the “ancient” organic matter.
Condensed aromatic structures that make up the cellulose–lignin complex of cell walls can also contribute to the yellow–green fluorescence maximum (λ = 550 nm). Preparations of soluble lignin (for example, from Ginkgo biloba leaves) in 0.1-N NaOH have a fluorescence maximum of 540–560 nm. A green leaf, from which soluble substances have been removed by acid treatment, emits at 560–580 nm (this radiation refers to the cellulose–lignin complex) [36,37]. In the process of coalification, the green leaf loses part of its organic matter, while fiber, lignin, and newly formed humic substances (the last two groups of compounds cause the maximum emission at 560–580 nm) remain in the imprint.
Fluorescence in the region of 420–460 nm (see Figure 2, Figure 4 and Figure 5) is caused by aromatic hydrocarbons, such as 3,4-benzpyrene, perylene, 1,12-benzperylene and coronene, widely distributed in rocks of various origins (sedimentary, igneous, volcanic and hydrothermal) and detected by fluorescence spectroscopy directly or in its extracted solutions [38,39].
Fluorescence bands in the 600–750 nm region were attributed to chlorophyll and its products, which originated in the Archean age. For example, pheophytin, pheophorbide, phytochlorin and its complexes with copper are rather stable and can be found in soils and sediments, including ancient samples [40,41]. Chlorins (7,8-dihydroporphyrins), starting from the Tertiary period, can be transformed into metalloporphyrins, as has been demonstrated in the literature [40]. Moreover, such substances can also be found in biofossil samples. In other words, already in the Pliocene (i.e., 2 Myr), the chlorophyll pigments were present in plants; however, these were converted into non-polar metalloporphyrins in fossils. The exception is the clay shale of the Serpiano formation of the Triassic age (200–225 million years), in which chlorins and porphyrins with free bases were found [42,43]. For example, it was shown in laboratory artificial fossilization experiments for Spirulina platensis cells that chlorophylls a and b had been transformed to chlorins and porphyrins of the phyllo- and etiotype [44,45].
The first group of pigments is formed according to the following scheme: chlorophyll → pheophytin → pheophorbide → pheoporphyrin → phylloerythrin. These pigments still contain the fifth cyclopentanone ring of chlorophyll in their structure and belong to the forbin group. The second group of pigments is formed according to the following scheme: chlorophyll → pheophytin → pheophorbide → chlorin → mesochlorin → mesochloroporphyrin. At the stage of the pheophorbide transformation to chlorin, the cyclopentanone ring breaks with the formation to form etiotype porphyrins. Porphyrins and chlorins with free bases have a fluorescence maxima of 630, 675 nm and 670, 715 nm, respectively. Chlorin and pheoporphyrin have similar fluorescence spectra, measured by well-recognized methods [46,47,48].
The 540–550 nm band was attributed to the lignin and aromatic structures of the humic type, while the peak at 580 nm is for perylene-3,10-quinone and its derivatives. For example, such pigments have been found in the Eocene deposits [49]. More specifically, 4,9-dimethoxy perylene-3,10-quinone (in CH2Cl2) absorbs at 494 and 527 nm, while the 570–580 nm band is dominated in its fluorescence spectrum. On the other hand, the 580 nm fluorescence band can be associated with the afterglow of Zn porphyrins, which are found in the cells of aerobic and photosynthetic bacteria, as well as in the etiolated leaves of higher plants [50].
The fossilized leaf fluorescence spectrum, in the 600–750 nm range (see Figure 3 and Figure 5), should be attributed to the chlorophyll products: bands at 670 and 720 nm are for chlorins, and bands at 620–630 and 675–680 nm are for porphyrin. The studied material age (the Permian) is close to that for the above-mentioned shales originating from the Triassic period, which is consistent with the presence of free porphyrins and 7,8-dihydroporphyrins. The green leaf practically does not contain porphyrins; therefore, the relict porphyrins of the leaves can be considered to be the products of the ancient chlorophyll transformation over 250 million years. These suppositions are consistent with the model experiments [44]. For green leaves, the fluorescence band at 700–750 nm is due to the chlorophyll–protein complex. In a dry or yellow leaf, the chlorophyll–protein complexes are destroyed, and chlorophyll turns into pheophytin and pheophorbide (peaks at 672 and 715 nm, respectively). During the fossilization process inside sedimentary rocks (if the age of the deposits has already reached the tertiary period), porphyrins can be formed in the leaf fossil (see peaks at 630 and 675 nm in Figure 4 and Figure 5).

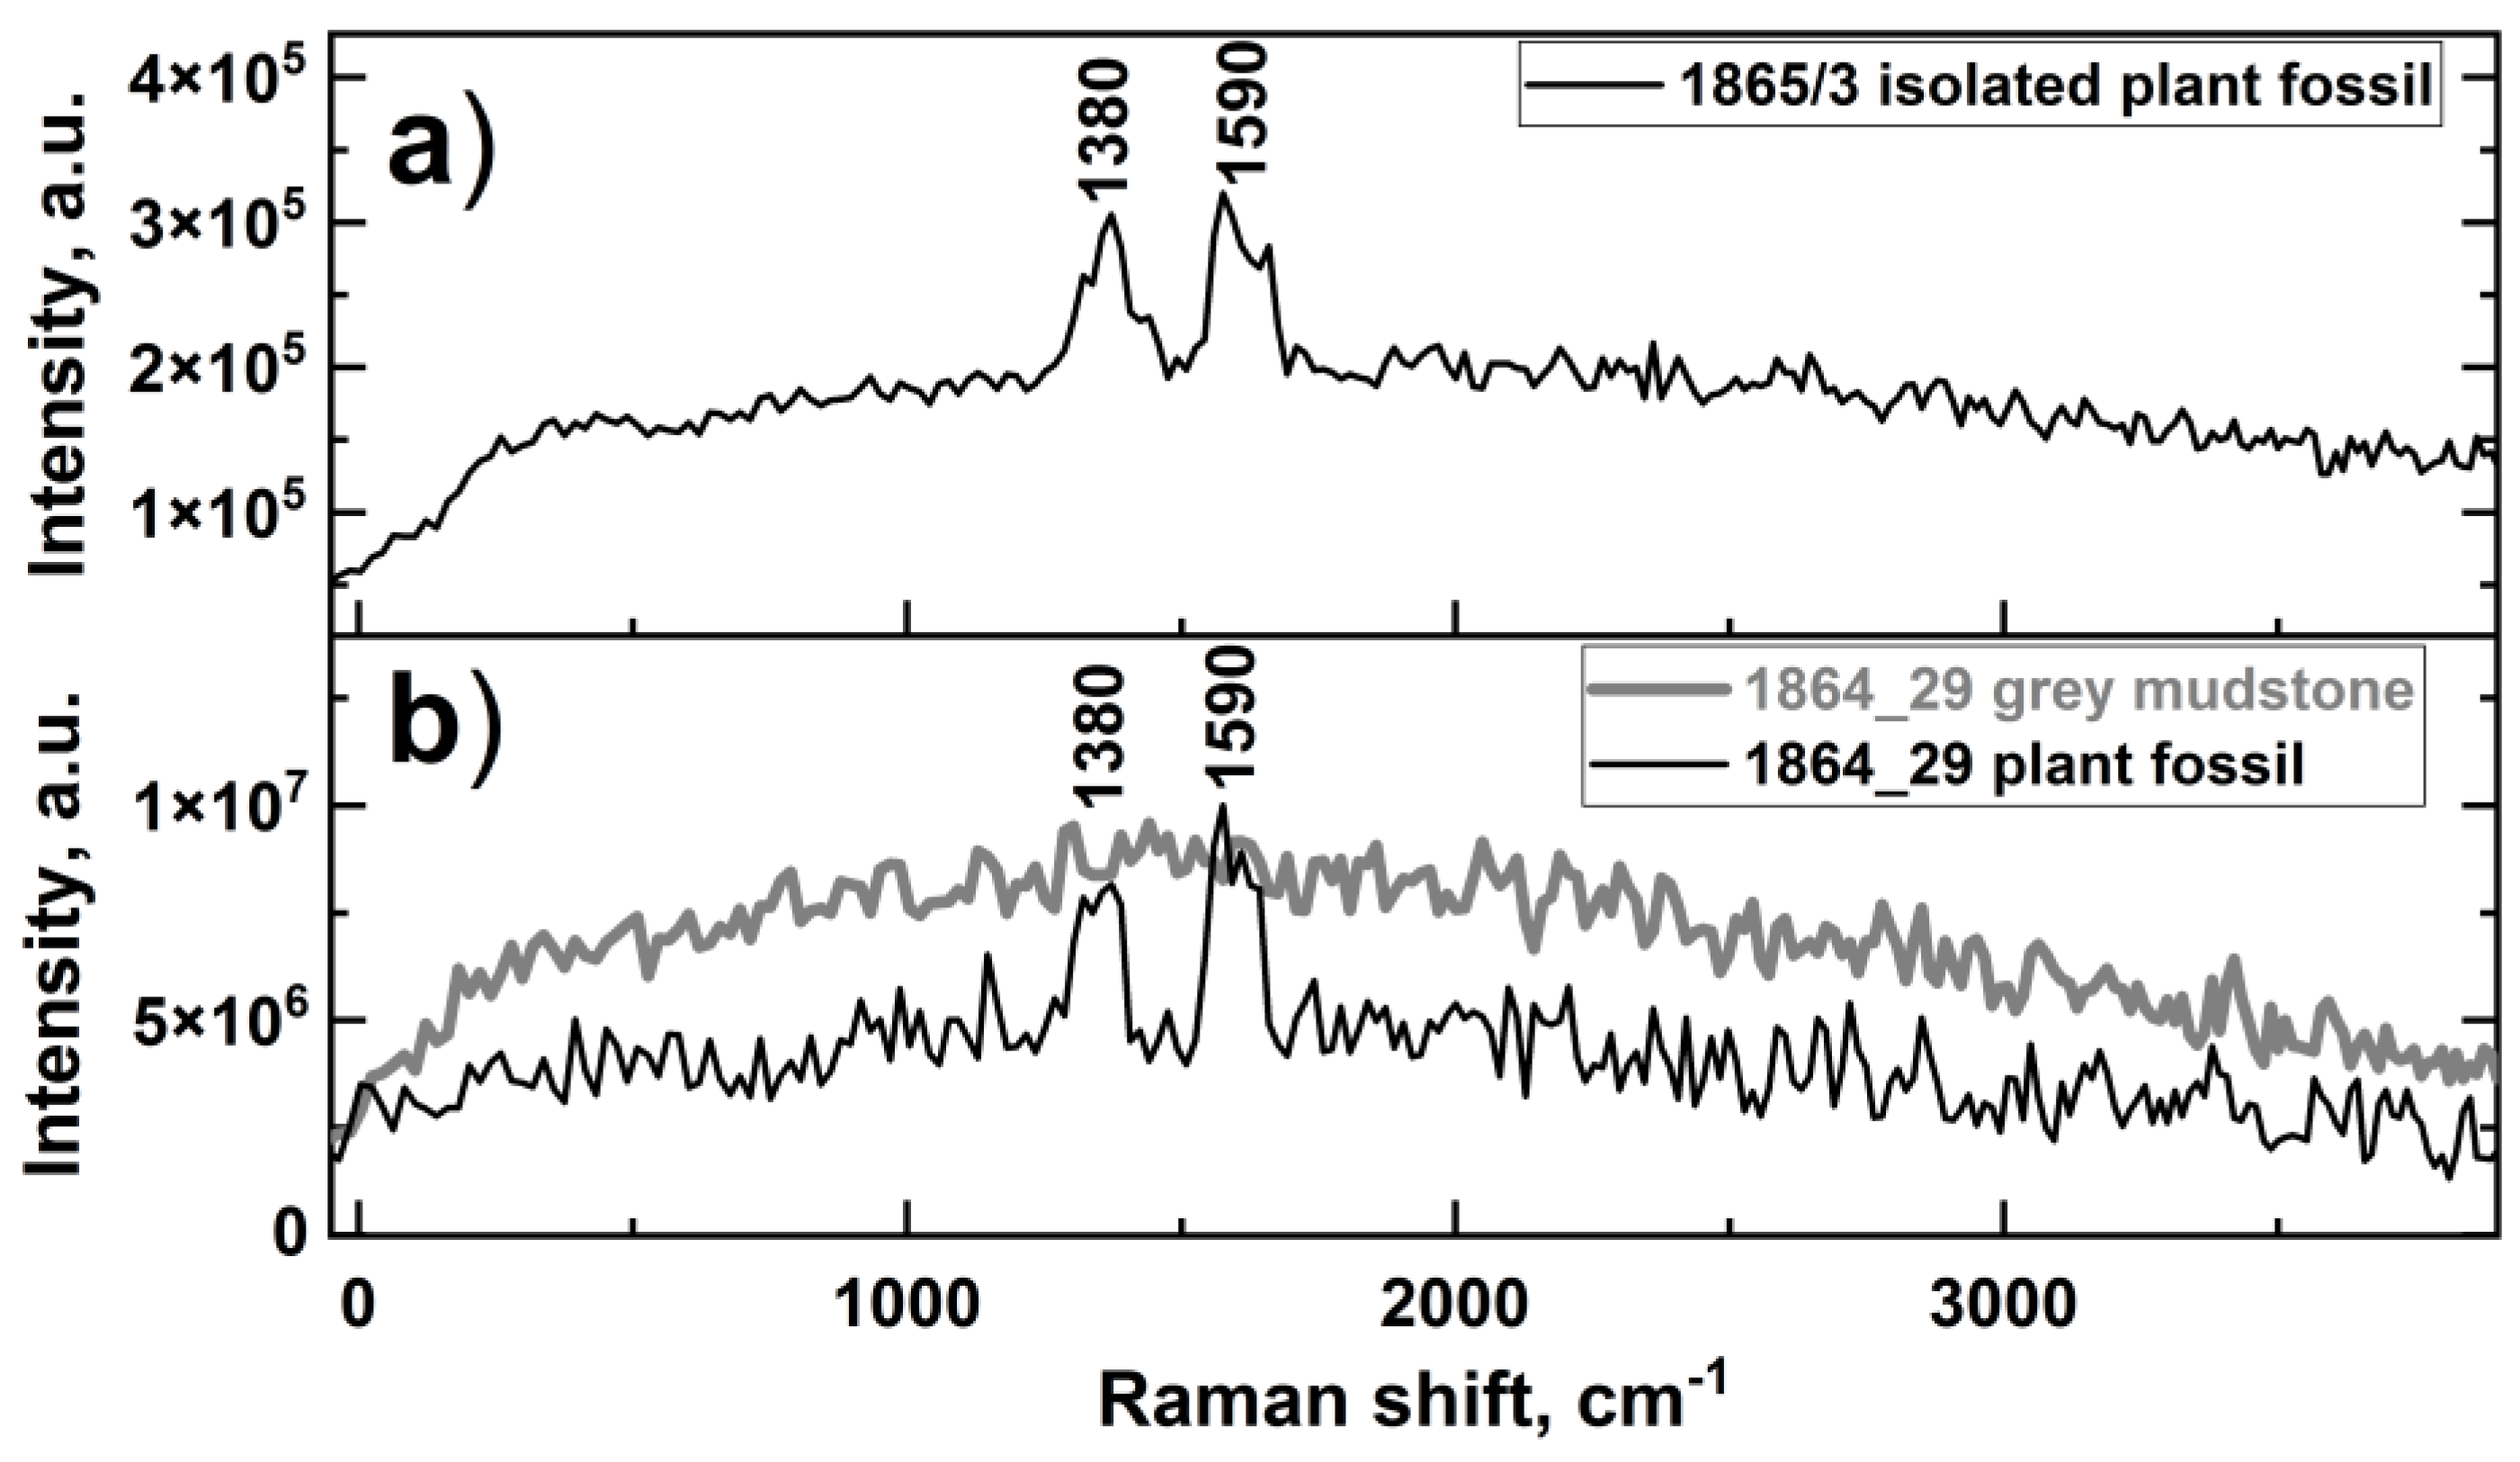
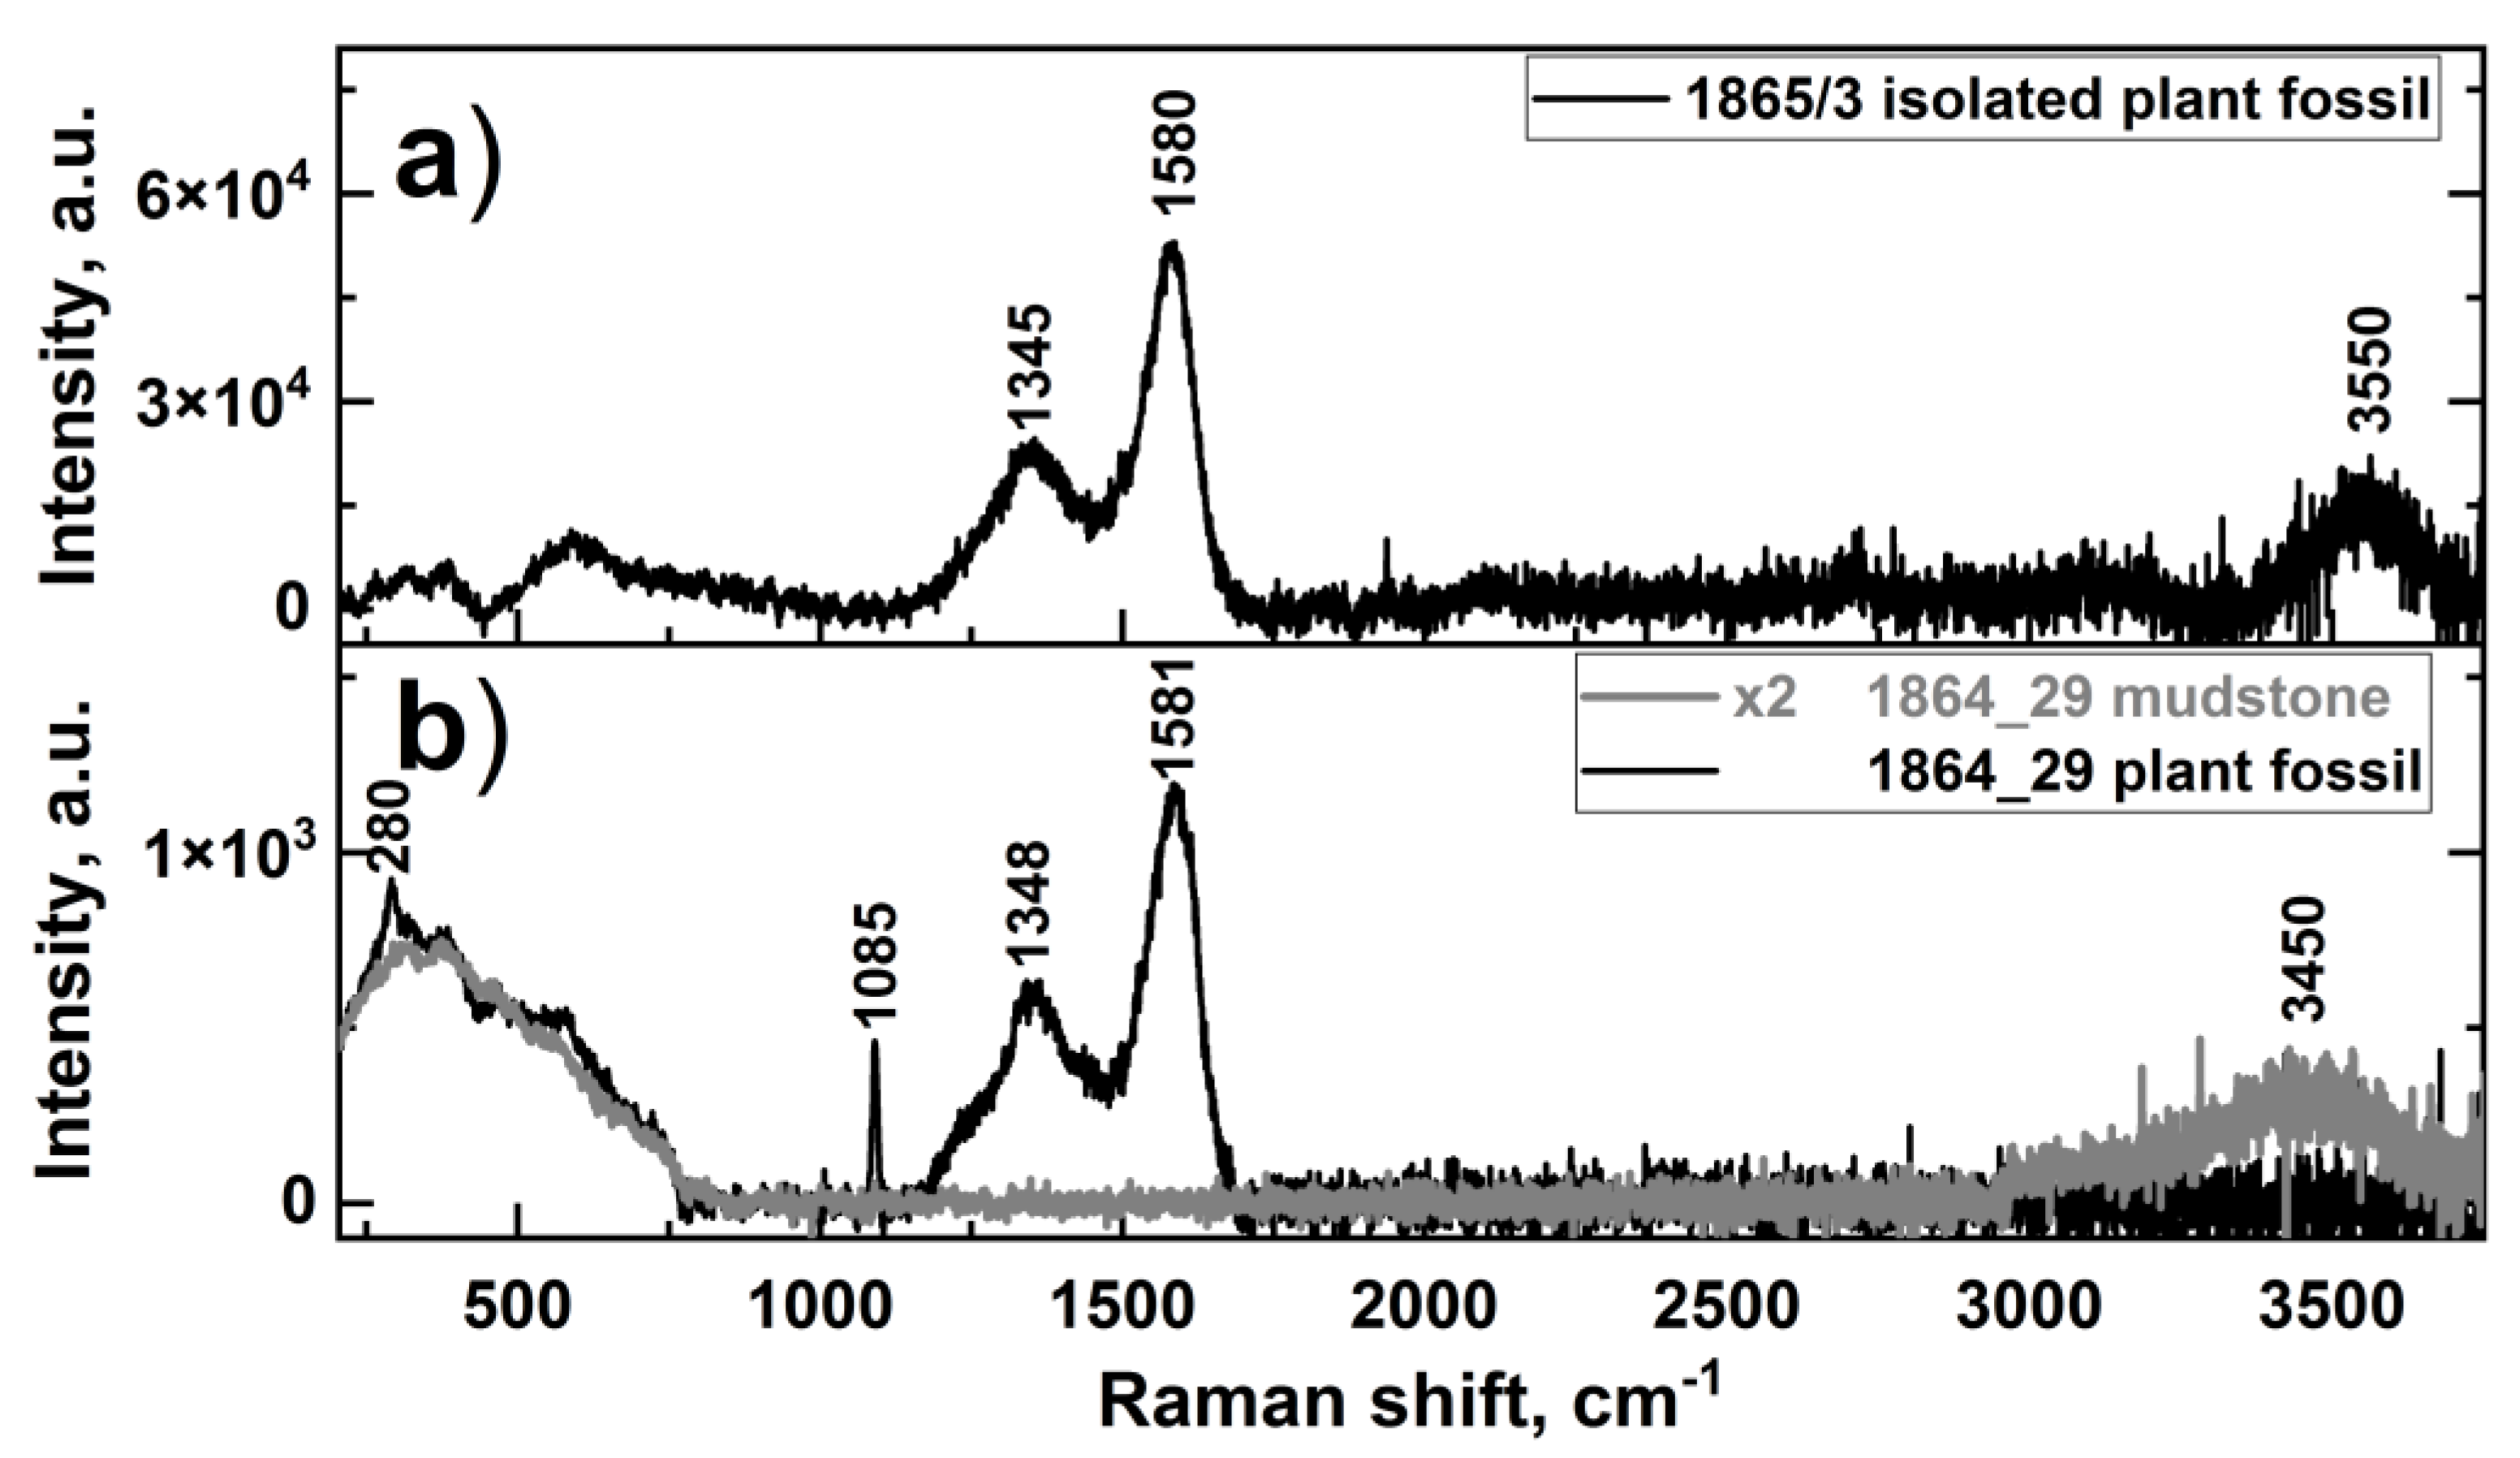
3.2. Raman Spectroscopy

Fluorescence spectroscopy is a very sensitive technique, but its selectivity is rather low for objects such as fossilized plant material. Alternatively, Raman spectroscopy has a very high selectivity for revealing molecular/crystal structures, but its sensitivity is rather poor due to its low efficiency in the Raman scattering process. Raman spectroscopy has been successfully utilized for diagnostics regarding fossilized remains in multiple studies. For example, Schopf et al. [51] applied micro Raman spectroscopy to the identification of Precambrian fossil microbes. They demonstrated that the valid identification of fossil microbes, via a combination of optical microscopy and Raman spectroscopy imaging, provides a new way to prove the biological origin of the earliest cellular fossils known. Later, Raman spectroscopy was used for detecting different fossilized organisms, such as fungi or bacteria [22,52,53]. Furthermore, Raman spectroscopy became a powerful instrument for finding indicators of extraterrestrial life or its fossils [22,24,54].
Here, we utilized pulsed Raman spectroscopy to estimate the prospects of our developed LIDAR for capturing Raman spectra under daylight conditions. The examples of Raman spectra for the isolated fossilized material and the spectra in the mudstone surface are presented in Figure 6. The signal-to-noise ratio was rather low in the pulsed Raman spectrum, but two bands at 1380 and 1590 cm−1 can be distinguished. These vibrational bands are characteristic for carbon-based materials and are commonly designated as ‘D’ (disordered) and ‘G’ (graphitic) bands, respectively, because of their presence in various forms of graphite [55]. The wide and intense background in the Raman spectrum was attributed to the sample fluorescence. The fluorescence of the fossil sample, associated with the grey mudstone (sample 1864/29, see photo in Table 1), also had a broad band, but the same bands (1390 and 1580 cm−1) can also be quantified for this sample. Raman spectra demonstrated that the fossilized material embedded in the rock can be distinguished from the matrix, including virtually all other mineral phases that are identifiable by Raman analysis. However, the pulsed Raman measurements provided spectra of poor quality without the details of D and G Raman bands; therefore, we decided to acquire better quality spectra and utilized a commercial laboratory-based Raman microscope (EnSpectr Raman Microscope M532/785, Enhanced Spectrometry, Inc., Meridian, MS, USA) for this purpose.
The EnSpectr Raman microscope was equipped with two continuous wave laser sources (532 and 785 nm); however, with 785 nm pumping, we could not get any meaningful measurements at a power density below that which would cause thermal damage to the sample (detected by cracks and defects after Raman spectra measurements; damage threshold: spot 10 μm, 15 mW). The 532 nm excitation wavelength was more effective, and the high-quality Raman spectra of the isolated or incorporated fossils were acquired (Figure 7). For the isolated fossilized material, the Raman spectra contained D and G bands with maxima at 1345 and 1580 cm−1, respectively. A broad band at 3550 cm−1 was attributed to O-H stretching vibrations. We did not detect any bands of 2800–2900 cm−1, corresponding to the C-H vibrations. Two narrow peaks at 280 and 1085 cm−1 are for calcite (CaCO3) crystals contaminating the sample surface. A broad band at 300–700 cm−1 contained broad bands; this can be attributed to the fluorescence, but also the presentation of the Raman scattering peaks. The spectra obtained from the fossilized plants (Figure 7) were similar to the Raman data acquired for the microbial fossil, with the most informative “D” and “G” bands attributed to the organic matter presented in the fossils in concentrations much greater than for the kerogen embedded in rock [51,56]. We have not observed any Raman bands for chlorophyll or its derivatives (pheophytin, pheoporphyrin, phylloerythrin etc.), compared to the fluorescence spectroscopy measurements discussed above. This can be explained by a low concentration of chlorophyll derivatives and the low efficiency of Raman scattering for these substances. Still, combining laser-induced fluorescence and Raman spectroscopy data is a good way to detect traces of materials of biogenetic origin. If applied to particularly poorly preserved remains, this combined technique would provide convincing evidence of biogenicity, even if optical microscopy failed to do so. For example, this technique could be applied to prove or refute the presence of microfossils in, for example, some meteorites [57].

4. Conclusions

The study of fossilized plants, using a combination of laser-induced fluorescence and Raman spectroscopy, has been carried out. A multiwavelength LIDAR instrument has been developed for both laser-induced fluorescence and pulsed Raman spectroscopy measurements under field conditions or/and onsite studies. To demonstrate the prospects for the onsite/fieldwork detection of plant fossils, we have measured the fluorescence and Raman spectra of both isolated fossilized plants and fossilized plants associated with rock of different origins.
Laser-induced fluorescence spectroscopy revealed that fluorescence spectra of pure cuticles and chemically untreated leaves did not differ very much from each other, for both recent and fossilized leaves. It means that the cuticle, in any case, makes the main contribution to the laser-induced fluorescence spectrum. The organic matter of the plant undergoes chemical changes over geological time, resulting in humification and the transformation of reduced chlorophyll derivatives (chlorin) into oxidized forms (chlorin, porphyrins).
Laser remote sensing of isolated and embedded fossilized material samples by Raman spectroscopy has been carried out for the first time. Graphitic bands (D and G) were quantified by pulsed Raman spectra for both isolated material samples and those associated with a rock.
Our results demonstrated that, applied to ancient and geochemically highly altered (graphitic, carbonized) microscopic fossils, a combination of laser-induced fluorescence and Raman spectroscopy measurements provides more comprehensive sample characterization, including the detection of biogenicity indicators such as chlorophyll and its derivatives, as well as kerogenous material. The method of laser remote sensing can be useful in geological exploration fieldworks in the search for oil and coal-bearing rocks, and rocks with a high content of organic matter.
This study opens new doors for soil pigment composition studies, which can be useful in studies of the soil genetics of organic matter, migration in the soil profile, and microbiological activity in various soil horizons. The high sensitivity of the laser-induced fluorescence spectroscopy (in relation to the main representatives of the pigment system of cells—tetrapyrroles, flavins, as well as lignin components) makes the express identification of the organic molecules in soil, peat, rivers and sea waters, and plant materials possible. Alternatively, Raman spectroscopy can distinguish carbonated fossilized materials, so it will guide laser-induced fluorescence measurements and find locations of interest. The combination of laser-induced fluorescence and Raman spectroscopy is very beneficial to extraterrestrial missions that focus on the detection of traces of life.

Author Contributions

A.F.B. Conceptualization, Methodology, Writing—Original Draft; S.M.P. Conceptualization, Investigation, Writing—Original Draft; D.G.A. Writing—Original Draft; S.V.G. Writing—Review & Editing, Supervision; A.V.G. Investigation, Writing—Review & Editing; P.A.S. Visualization, Writing—Review & Editing, M.Y.G., Writing—Review & Editing; V.N.L. Investigation, Writing—Review & Editing. All authors have read and agreed to the published version of the manuscript.

Funding

This work was supported by a grant of the Ministry of Science and Higher Education of the Russian Federation (075-15-2022-315) for the organization and development of a World-class research center ‘‘Photonics”.

Institutional Review Board Statement

Not applicable.

Informed Consent Statement

Not applicable.

Data Availability Statement

MDPI Research Data Policies.

Conflicts of Interest

The authors declare no conflict of interest.

References

  1. Measures, R.M. Laser Remote Sensing: Fundamentals and Applications; John Wiley & Sons, Ltd.: New York, NY, USA, 1984; ISBN 0894646192. [Google Scholar]
  2. Bunkin, A.; Voliak, K. Laser Remote Sensing of the Ocean: Methods and Applications; Wiley: New York, NY, USA; Chichester, UK; Weinheim, Germany; Brisbane, Australia; Singapore; Toronto, ON, Canada, 2001; ISBN 0471389277. [Google Scholar]
  3. Lin, H.; Zhang, Y.; Mei, L. Fluorescence Scheimpflug LiDAR developed for the three-dimension profiling of plants. Opt. Express 2020, 28, 9269–9279. [Google Scholar] [CrossRef] [PubMed]
  4. Grishin, M.Y.; Lednev, V.N.; Pershin, S.M.; Kapralov, P.O. Ultracompact Fluorescence Lidar Based on a Diode Laser (405 nm, 150 mW) for Remote Sensing of Waterbodies and the Underlying Surface from Unmanned Aerial Vehicles. Dokl. Phys. 2021, 66, 153–155. [Google Scholar] [CrossRef]
  5. Lednev, V.N.; Bunkin, A.F.; Pershin, S.M.; Grishin, M.Y.; Artemova, D.G.; Zavozin, V.A.; Sdvizhenskii, P.A.; Nunes, R.A. Remote Laser Induced Fluorescence of Soils and Rocks. Photonics 2021, 8, 411. [Google Scholar] [CrossRef]
  6. Mei, L.; Guan, Z.G.; Zhou, H.J.; Lv, J.; Zhu, Z.R.; Cheng, J.A.; Chen, F.J.; Löfstedt, C.; Svanberg, S.; Somesfalean, G. Agricultural pest monitoring using fluorescence lidar techniques. Appl. Phys. B 2012, 106, 733–740. [Google Scholar] [CrossRef]
  7. Hackley, P.C.; Jubb, A.M.; McAleer, R.J.; Valentine, B.J.; Birdwell, J.E. A review of spatially resolved techniques and applications of organic petrography in shale petroleum systems. Int. J. Coal Geol. 2021, 241, 103745. [Google Scholar] [CrossRef]
  8. Saito, Y.; Ichihara, K.; Morishita, K.; Uchiyama, K.; Kobayashi, F.; Tomida, T. Remote Detection of the Fluorescence Spectrum of Natural Pollens Floating in the Atmosphere Using a Laser-Induced-Fluorescence Spectrum (LIFS) Lidar, Y.-I. Remote Detection of the Fluorescence Spectrum of Natural Pollens Floating in the Atmosphere Using a Laser-Induced-Fluorescence Spectrum (LIFS) Lidar. Remote Sens. 2018, 10, 1533. [Google Scholar]
  9. Zheng, D.; Peng, T.; Zhu, S.; Lian, M.; Li, Y.; Wei, F.; Xiong, J.; Svanberg, S.; Zhao, Q.; Hu, J.; et al. Optical characterization of Chinese hybrid rice using laser-induced fluorescence techniques—laboratory and remote-sensing measurements. Appl. Opt. 2018, 57, 3481–3487. [Google Scholar] [CrossRef]
  10. Chase, A.F.; Chase, D.Z.; Weishampel, J.F.; Drake, J.B.; Shrestha, R.L.; Slatton, K.C.; Awe, J.J.; Carter, W.E. Airborne LiDAR, archaeology, and the ancient Maya landscape at Caracol, Belize. J. Archaeol. Sci. 2011, 38, 387–398. [Google Scholar] [CrossRef]
  11. Chand, D.; Anderson, T.L.; Wood, R.; Charlson, R.J.; Hu, Y.; Liu, Z.; Vaughan, M. Quantifying above-cloud aerosol using spaceborne lidar for improved understanding of cloudy-sky direct climate forcing. J. Geophys. Res. Atmos. 2008, 113, D13206. [Google Scholar] [CrossRef] [Green Version]
  12. Zhang, Z.; Meyer, K.; Yu, H.; Platnick, S.; Colarco, P.; Liu, Z.; Oreopoulos, L. Shortwave direct radiative effects of above-cloud aerosols over global oceans derived from 8~years of CALIOP and MODIS observations. Atmos. Chem. Phys. 2016, 16, 2877–2900. [Google Scholar] [CrossRef] [Green Version]
  13. Comerón, A.; Muñoz-Porcar, C.; Rocadenbosch, F.; Rodríguez-Gómez, A.; Sicard, M. Current research in lidar technology used for the remote sensing of atmospheric aerosols. Sensors 2017, 17, 1450. [Google Scholar] [CrossRef] [PubMed]
  14. Ceolato, R.; Berg, M.J. Aerosol light extinction and backscattering: A review with a lidar perspective. J. Quant. Spectrosc. Radiat. Transf. 2021, 262, 107492. [Google Scholar] [CrossRef]
  15. Manrique, J.A.; Lopez-Reyes, G.; Cousin, A.; Rull, F.; Maurice, S.; Wiens, R.C.; Madsen, M.B.; Madariaga, J.M.; Gasnault, O.; Aramendia, J.; et al. SuperCam Calibration Targets: Design and Development. Space Sci. Rev. 2020, 216, 138. [Google Scholar] [CrossRef]
  16. Maurice, S.; Wiens, R.C.; Bernardi, P.; Caïs, P.; Robinson, S.; Nelson, T.; Gasnault, O.; Reess, J.-M.; Deleuze, M.; Rull, F.; et al. The SuperCam Instrument Suite on the Mars 2020 Rover: Science Objectives and Mast-Unit Description. Space Sci. Rev. 2021, 217, 47. [Google Scholar] [CrossRef]
  17. Pershin, S.M.; Pungin, V.G. The Search for Water on Mars by the Differential Absorption Method Using the 970 nm Band of the Second Overtone of OH Vibrations. Phys. Vib. 2001, 9, 84–89. [Google Scholar]
  18. Bhartia, R.; Beegle, L.W.; DeFlores, L.; Abbey, W.; Razzell Hollis, J.; Uckert, K.; Monacelli, B.; Edgett, K.S.; Kennedy, M.R.; Sylvia, M.; et al. Perseverance’s Scanning Habitable Environments with Raman and Luminescence for Organics and Chemicals (SHERLOC) Investigation. Space Sci. Rev. 2021, 217, 58. [Google Scholar] [CrossRef]
  19. Beegle, L.; Bhartia, R.; White, M.; DeFlores, L.; Abbey, W.; Wu, Y.-H.; Cameron, B.; Moore, J.; Fries, M.; Burton, A.; et al. SHERLOC: Scanning habitable environments with Raman & luminescence for organics & chemicals. In Proceedings of the 2015 IEEE Aerospace Conference, Montana, MT, USA, 7–14 March 2015; pp. 1–11. [Google Scholar]
  20. Glauser, A.L.; Harper, C.J.; Taylor, T.N.; Taylor, E.L.; Marshall, C.P.; Marshall, A.O. Reexamination of cell contents in Pennsylvanian spores and pollen grains using Raman spectroscopy. Rev. Palaeobot. Palynol. 2014, 210, 62–68. [Google Scholar] [CrossRef]
  21. Marshall, A.O.; Wehrbein, R.L.; Lieberman, B.S.; Marshall, C.P. Raman Spectroscopic Investigations of Burgess Shale–Type Preservation: A New Way Forward. Palaios 2012, 27, 288–292. [Google Scholar] [CrossRef]
  22. Shkolyar, S.; Eshelman, E.J.; Farmer, J.D.; Hamilton, D.; Daly, M.G.; Youngbull, C. Detecting Kerogen as a Biosignature Using Colocated UV Time-Gated Raman and Fluorescence Spectroscopy. Astrobiology 2018, 18, 431–453. [Google Scholar] [CrossRef]
  23. Schopf, J.W.; Kudryavtsev, A.B.; Agresti, D.G.; Czaja, A.D.; Wdowiak, T.J. Raman Imagery: A New Approach to Assess the Geochemical Maturity and Biogenicity of Permineralized Precambrian Fossils. Astrobiology 2005, 5, 333–371. [Google Scholar] [CrossRef]
  24. Marshall, C.P.; Edwards, H.G.M.; Jehlicka, J. Understanding the Application of Raman Spectroscopy to the Detection of Traces of Life. Astrobiology 2010, 10, 229–243. [Google Scholar] [CrossRef] [PubMed] [Green Version]
  25. Bonneville, S.; Delpomdor, F.; Préat, A.; Chevalier, C.; Araki, T.; Kazemian, M.; Steele, A.; Schreiber, A.; Wirth, R.; Benning, L.G. Molecular identification of fungi microfossils in a Neoproterozoic shale rock. Sci. Adv. 2022, 6, eaax7599. [Google Scholar] [CrossRef]
  26. Hackley, P.C.; Jubb, A.M.; Burruss, R.C.; Beaven, A.E. Fluorescence spectroscopy of ancient sedimentary organic matter via confocal laser scanning microscopy (CLSM). Int. J. Coal Geol. 2020, 223, 103445. [Google Scholar] [CrossRef]
  27. Jiang, Y.L.; Liu, Y.-S. A simple and convenient determination of perylene preserved in the Late Neogene wood from northeastern Tennessee using fluorescence spectroscopy. Org. Geochem. 2008, 39, 1462–1465. [Google Scholar] [CrossRef]
  28. Da Conceição, D.M.; Da Silva, J.H.; Cisneros, J.C.; Iannuzzi, R.; Viana, B.C.; Saraiva, G.D.; Sousa, J.P.; Freire, P.T.C. Spectroscopic studies on Permian plant fossils in the Pedra de Fogo Formation from the Parnaíba Basin, Brazil. J. King Saud Univ. Sci. 2018, 30, 483–488. [Google Scholar] [CrossRef]
  29. Tahoun, M.; Gee, C.T.; McCoy, V.E.; Sander, P.M.; Müller, C.E. Chemistry of porphyrins in fossil plants and animals. RSC Adv. 2021, 11, 7552–7563. [Google Scholar] [CrossRef] [PubMed]
  30. McElwain, J.C.; Chaloner, W.G. The fossil cuticle as a skeletal record of environmental change. Palaios 1996, 11, 376–388. [Google Scholar] [CrossRef]
  31. Mösle, B.; Collinson, M.E.; Finch, P.; Stankiewicz, B.A.; Scott, A.C.; Wilson, R. Factors influencing the preservation of plant cuticles: A comparison of morphology and chemical composition of modern and fossil examples. Org. Geochem. 1998, 29, 1369–1380. [Google Scholar] [CrossRef]
  32. Taylor, A.T.; Lai, E.P.C. Current State of Laser-Induced Fluorescence Spectroscopy for Designing Biochemical Sensors. Chemosensors 2021, 9, 275. [Google Scholar] [CrossRef]
  33. Naumov, A.V. Low-temperature spectroscopy of organic molecules in solid matrices: From the Shpol’skii effect to laser luminescent spectromicroscopy for all effectively emitting single molecules. Phys. Uspekhi 2013, 56, 605. [Google Scholar] [CrossRef]
  34. Johnson, M.E.; Landers, J.P. Fundamentals and practice for ultrasensitive laser-induced fluorescence detection in microanalytical systems. Electrophoresis 2004, 25, 3513–3527. [Google Scholar] [CrossRef] [PubMed]
  35. Bunkin, A.F.; Kolesnikov, M.P.; Pershin, S.M. Laser Fluorescence of Soil: Online Remote Sensing of the Earth’s Surface. Phys. Vib. 1998, 6, 249–255. [Google Scholar]
  36. Agati, G.; Biricolti, S.; Guidi, L.; Ferrini, F.; Fini, A.; Tattini, M. The biosynthesis of flavonoids is enhanced similarly by UV radiation and root zone salinity in L. vulgare leaves. J. Plant Physiol. 2011, 168, 204–212. [Google Scholar] [CrossRef] [PubMed]
  37. Koşar, M.; Dorman, H.J.D.; Hiltunen, R. Effect of an acid treatment on the phytochemical and antioxidant characteristics of extracts from selected Lamiaceae species. Food Chem. 2005, 91, 525–533. [Google Scholar] [CrossRef]
  38. Florovskaya, V.N.; Zezin, R.B.; Ovchinnikova, L.I.; Pikovsky, Y.I.; Teplitskaya, T.A. Diagnostics of Organic Substances in the Rocks and Minerals of Magmatic and Hydrothermal Origin; Moscow, Russia, 1968. (In Russian) [Google Scholar]
  39. Kolesnikov, M.P.; Voronova, N.I.; Egorov, I.A. Metalloporphyrins and Perylene in the Products of Volcano Eruption. Dokl. Akad. Nauk SSSR 1979, 247, 749–752. [Google Scholar]
  40. Hodgson, G.W.; Hitchon, B.; Taguchi, K.; Baker, B.L.; Peake, E. Geochemistry of porphyrins, chlorins and polycyclic aromatics in soils, sediments and sedimentary rocks. Geochim. Cosmochim. Acta 1968, 32, 737–772. [Google Scholar] [CrossRef]
  41. Kolesnikov, M.P.; Egorov, I.A. Chlorophyll derivatives in modern soils in connection with the problem of the chemical evolution and origin of life on earth. Dokl. Biochem. Akad Nauk SSSR 1977, 235, 228–231. [Google Scholar]
  42. O’Malley, C.E.; Ausich, W.I.; Chin, Y.-P. Deep echinoderm phylogeny preserved in organic molecules from Paleozoic fossils. Geology 2016, 44, 379–382. [Google Scholar] [CrossRef] [Green Version]
  43. Blumer, M.; Omenn, G.S. Fossil porphyrins: Uncomplexed chlorins in a Triassic sediment. Geochim. Cosmochim. Acta 1961, 25, 81–90. [Google Scholar] [CrossRef]
  44. Kolesnikov, M.P.; Egorov, I.A. Metalloporphyrins in precambrian deposits as probable evidence of ancient photosynthesis [Spirulina platensis, Algae]. Dokl. Biochem. Akad. Nauk 1979, 244, 470–473. [Google Scholar]
  45. Svec, W.A. The isolation, preparation, characterization, and estimation of the chlorophylls and the bacteriochlorophylls. Porphyrins 1978, 5, 341–399. [Google Scholar]
  46. Koifman, O.I.; Askarov, K.A.; Berezin, B.D. Enikolopyan NS Natural Sources of Porphyrins. Methods for Isolation and Modification of Natural Porphyrins. Porphyr. Struct. Prop. Synth. 1985, 1, 75–204. [Google Scholar]
  47. Ellsworth, R.K.; Carney, C.F. Preparation of Chlorin-E6 from Microgram Quantities of Pheophorbide-A and Its Absorption-Spectrum in Diethyl-Ether. Photosynthetica 1975, 9, 333–336. [Google Scholar]
  48. Dolphin, D. The Porphyrins V1: Structure and Synthesis, Part A; Academic Press: Cambridge, MA, USA, 2012. [Google Scholar]
  49. Watts, C.D.; Simoneit, B.R.; Maxwell, J.R.; Ragot, J.P. The quincyite pigments. A novel series of fossil “dyes” from an Eocene sediment. In Proceedings of the Advances in Organic Geochemistry 1975: Actas del 7th Congreso Internacional de Geoquimica Organica, Madrid, Spain, 16–19 September 1975; Volume 19, pp. 223–235. [Google Scholar]
  50. Shuvalov, V.A.; Krasnovskii, A.A. The luminescence of zinc-porphyrins in microorganisms and plants: Phosphorescence and delayed fluorescence. Mol. Biol. 1971, 5, 557–566. [Google Scholar] [PubMed]
  51. Schopf, W.J.; Kudryavtsev, B.A.; Agresti, G.D.; Wdowiak, J.T.; Czaja, D.A. Laser--Raman imagery of Earth’s earliest fossils. Nature 2002, 416, 73–76. [Google Scholar] [CrossRef] [PubMed]
  52. Gan, T.; Luo, T.; Pang, K.; Zhou, C.; Zhou, G.; Wan, B.; Li, G.; Yi, Q.; Czaja, A.D.; Xiao, S. Cryptic terrestrial fungus-like fossils of the early Ediacaran Period. Nat. Commun. 2021, 12, 641. [Google Scholar] [CrossRef]
  53. Schopf, J.W.; Kudryavtsev, A.B. Three-dimensional Raman imagery of precambrian microscopic organisms. Geobiology 2005, 3, 1–12. [Google Scholar] [CrossRef]
  54. Pasteris, J.D.; Wopenka, B. Necessary, but Not Sufficient: Raman Identification of Disordered Carbon as a Signature of Ancient Life. Astrobiology 2003, 3, 727–738. [Google Scholar] [CrossRef]
  55. Tuinstra, F.; Koenig, J.L. Raman Spectrum of Graphite. J. Chem. Phys. 1970, 53, 1126–1130. [Google Scholar] [CrossRef]
  56. Bower, D.M.; Steele, A.; Fries, M.D.; Green, O.R.; Lindsay, J.F. Raman imaging spectroscopy of a putative microfossil from the∼ 3.46 Ga Apex chert: Insights from quartz grain orientation. Astrobiology 2016, 16, 169–180. [Google Scholar] [CrossRef]
  57. Rozanov, A.Y.; Hoover, R.B.; Krasavin, E.A.; Samyilina, O.S.; Ryumin, A.K.; Kapralov, M.I.; Saprykin, E.A.; Afanasyieva, A.N. The Orgueil Meteorite (Atlas of Microfossils); JINR: Moscow, Russia, 2020; ISBN 978-5-903825-42-4. [Google Scholar]
Figure 1. (a)—Fluorescence spectra map for isolated plant fossil sample No 1865/3; (b)—fossil sample No 1865/3 and Spectralon® fluorescence spectra comparison with the 305 nm excitation.
Photonics 10 00015 g001
Figure 2. Laser-induced fluorescence spectra of (1) Ginkgo biloba cuticle, (2) rock sample No 4552/18, and (3) rock sample No 4388/563.
Photonics 10 00015 g002
Figure 3. Laser fluorescence spectra of (1) Ginkgo biloba leaf cuticle, (2) Phylladoderma (Aequistomia) annulata cuticle (sample No 4552/700-B), and (3) dry untreated leaf of Ginkgo biloba.
Photonics 10 00015 g003
Figure 4. Laser fluorescence spectra of (1) rock sample No 4552/18 and (2) fossilized material of Tatarina conspicua leaf (the same sample No 4552/18).
Photonics 10 00015 g004
Figure 5. Laser fluorescence spectra of (1) rock sample No 4388/563 and (2) Tatarina conspicua leaf impression with fossilized material residues (the same sample No 4388/563).
Photonics 10 00015 g005
Figure 6. Pulsed Raman spectra of fossilized sample 1865/3 and 1864_29 samples measured by LIDAR with 532 nm excitation. Spectra are summed for 1000 laser pulses to improve signal-to-noise ratio.
Photonics 10 00015 g006
Figure 7. Continuous wave Raman spectra of isolated fossilized material 1865/3 (a) and 1864_29 samples at the mudstone (b) measured by Enspectra R532 with 532 nm. (The mudstone rock Raman spectrum was multiplied 2-fold for better view). Spectra were acquired with the 180 s gate and were corrected on background emission.
Photonics 10 00015 g007
Table 1. Fossil plant (compressions) samples.
SamplePhotoDescriptionOriginAge, Myr
1865/3Photonics 10 00015 i001isolated chemically untreated fossilized material of Schuguria ornataKursk Region, Mikhailovsky quarry, Kursk Magnetic Anomaly383
4552/18Photonics 10 00015 i002well-preserved fossilized leaf of Tatarina conspicua in rock (siltstone)Vologda Region, the right bank of the Malaya Severnaya Dvina River at the Aristovo pier257
4388/563Photonics 10 00015 i003impression of the gymnospermous plant Tatarina conspicua (family Peltaspermaceae, order Peltaspermales) leaf in rock (siltstone) with fossilized material residuesKirov Region, the right bank of the Vyatka River 13 km below Kotelnich city260
4552/700Photonics 10 00015 i004isolated chemically untreated fossilized leaf of the gymnospermous plant Phylladoderma (Aequistomia) annulata (family Cardiolepidaceae, order Peltaspermales)Vologda Region, the right bank of the Malaya Severnaya Dvina River at the Aristovo pier257
4552/700-B pure cuticle of the same leaf (Phylladoderma (Aequistomia) annulata)Vologda Region, the right bank of the Malaya Severnaya Dvina River at the Aristovo pier257
1860/218APhotonics 10 00015 i005impressions of leaves of cordaites (primitive gymnosperms) Cordaites sp. with scarcely preserved coal matter in grey siltstoneYaman-Us well, South Mongolia251
1864/29Photonics 10 00015 i006impression of conifer twig Taxodiella bardaeana with scarcely preseved organic matter in grey mudstoneOrenburg Region, Dubensky quarry270
Disclaimer/Publisher’s Note: The statements, opinions and data contained in all publications are solely those of the individual author(s) and contributor(s) and not of MDPI and/or the editor(s). MDPI and/or the editor(s) disclaim responsibility for any injury to people or property resulting from any ideas, methods, instructions or products referred to in the content.

