Article

Prediction of Erosive Processes in the Río Piedras and Flecha de El Rompido Salt Marsh (Huelva, Spain) Using Iterative Models and GIS

by
Emilio Ramírez-Juidias
1 and
José-Lázaro Amaro-Mellado
2,3,*
1
Instituto Universitario de Arquitectura y Ciencias de la Construcción (IUACC), Universidad de Sevilla, 2 Reina Mercedes Avenue, 41012 Seville, Spain
2
Departamento de Ingeniería Gráfica, Universidad de Sevilla, 41092 Seville, Spain
3
Instituto Geográfico Nacional-Servicio Regional en Andalucía, 41013 Seville, Spain
*
Author to whom correspondence should be addressed.
Limnol. Rev. 2023, 23(3), 190-202; https://doi.org/10.3390/limnolrev23030012
Submission received: 22 October 2023 / Revised: 23 November 2023 / Accepted: 1 December 2023 / Published: 3 December 2023

Abstract

:
Global warming is an essential factor to consider when studying tidal wetlands. The Río Piedras and Flecha de El Rompido salt marsh is one of the main wetlands in Andalusia, Spain. From the mid-1950s to the present day, Land Use Changes (LUCs) have caused significant alterations to the landscape. These changes, along with the effects of climatic variables and human activity, have led to an unprecedented impact on the environment. In this study, a patented method is used to obtain the total cubic meters of eroded soil and the average erosion prediction between 2015 and 2021 in the marshland area. Additionally, the various factors contributing to this phenomenon and the influence of intertidal processes are discussed. The results demonstrate how the enhanced integration of LIDAR technologies, digital elevation models, and Geographic Information Systems (GIS), in conjunction with regression models, has proven highly useful in describing, analyzing, and predicting the volumetric change process in the study area. In conclusion, the methodology used is helpful for any type of coastal marshes influenced by tidal processes and climate change.

1. Introduction

Salt marshes are ecosystems that emerge at the land–sea interfaces, usually in low-energy tidal settings, and do tend to disappear as a result of the sedimentation process [1,2]. However, human activity has accelerated this process, leading to the loss of their surface area. Several studies suggest that marshes may be an ecosystem that has experienced significant alteration due to human actions [3,4,5,6]. In fact, current estimates specify that European salt marshes have decreased by approximately 80% [4,7,8].
While both ecosystem processes and their implications for future land degradation mitigation have been considered in various pieces of field research worldwide, it is challenging to extrapolate findings from field studies at a patch scale to other areas [9]. Although satellite platforms can offer a solution to this problem, the use of LIght Detection and Ranging (LIDAR) imagery has a significant advantage. This is due to LIDAR that accurately captures all the physical characteristics of marshes, which are often inadequately reflected in traditional contour mapping [4,10]. Thus, LIDAR data furnish the vital spatial information required for examining the associations between climatic variables and soil erosion in a comprehensive marsh-scale analysis. As is well known, LIDAR operates by scanning its field of view using one or multiple laser beams to determine the distance of an object from the laser single transmitter [11]. At times, a light pulse may not only reflect off a single object. In situations such as with trees, a single light pulse can result in multiple returns. LiDAR systems are capable of capturing data from the upper part of the canopy down through the canopy to the ground [12]. Thereby, removing the vegetation, a more accurate digital elevation model (DEM) can be gathered from LIDAR data.
On a global scale, the studies undertaken by some researchers [13,14,15] should be highlighted, as they lay the foundations for the erosion problem that has occurred in salt marshes as a result of climate change. In this regard, over the past few years, several researchers have explored salt marshes and their dynamics in the Iberian Peninsula [1,2,16,17,18], even some of them the marshlands allocated in the Gulf of Cadiz. Within the Río (River) Piedras and Flecha de El Rompido marshland(s) (Huelva, Spain), sediment residence times in their respective river systems are lengthy, with substantial intermediate storage of eroded material, as is typical in many of the world’s major river systems, as observed, for example, in Chile [19]. Moreover, the increased sediment storage can trigger significant alterations in the physical shape of the marshland river system and its ecological well-being. This latter aspect is critical due to the marshland river system’s importance for studying the area’s flora and fauna. Other work employs geomatic techniques to evaluate the dynamics and evolution of a coastal sandy system in the Cantabrian Sea, northern Spain [20].
Another consequence of the extended sediment residence times in the river system, as per [4,7,19], is that major historical changes can influence the system’s behavior for decades. It is also imperative for us to acquire and evaluate the response trajectory to global historical change, with the temporal scale of analysis being highly relevant for predicting the relationship between net sediment response and flood distribution over the years.
So far, in most marsh-related studies, researchers have primarily focused on addressing soil loss and erosion processes solely through mapping changes in vegetation cover and vegetation abundance, or Land Use Changes (LUCs) in a general sense. Indeed, some researchers have explored different methods capable of deriving the state of variables based on soil reflectance characteristics or vegetation cover characteristics [9]. Furthermore, there are studies in which LUCs were used to define dynamics in watersheds [21] or to assess the degradation of fluvial sediment transport [22]. On the other hand, while the use of LIDAR imagery can be considered innovative in this field of study, the ratio of published articles is low, which could be attributed, despite LIDAR’s enormous potential, to the difficulty in obtaining LIDAR data at any scale compared to the ease of acquiring satellite images. Clearly, this fact facilitates the use of remote sensing, a widely adopted technique in marshland studies.
Furthermore, quantifying erosion processes through LIDAR techniques, scientific procedures founded on iterative processes, in conjunction with fieldwork, can provide new insights required to predict the total volume of eroded soil not only in any wetland but also in other regions worldwide. Nevertheless, high-resolution LIDAR data are necessary when the area comprises a complex network of basins or aquifers. One potential solution is applying emerging image processing techniques [23], presently accepted by researchers worldwide.
In this context, the primary objective of this study would be to forecast the average erosion in the study area (Río Piedras and Flecha de El Rompido marshland), using LIDAR data and geographic information systems (GIS) as a novel approach. Achieving this objective would first require predicting volumetric change processes, which serves as a necessary secondary goal. In order to achieve both aims, it would be of great importance to take into account the research works carried out by different researchers [1,10,18,24], since they all emphasize coastal gulf areas (Cádiz, Spain, and Texas, USA).

2. Study Area

The marshland of Río Piedras and Flecha de El Rompido, with a total area of 2530 hectares, is located in the southwestern part of Spain (Figure 1), specifically in the province of Huelva (in the Autonomous Community of Andalusia).
Designated as a Natural Site on 28 July 1989 [25], this salt marsh extends along the mouth of the Piedras River, where the contributions of materials from the riverbed, combined with the influence of tides, have given rise to a unique landscape consisting of a marsh system and a distinct sandy formation, approximately ten kilometers in length, parallel to the coast, forming the so-called Flecha de El Rompido.
According to Rodríguez-Ramírez et al. [26], the Piedras River flowed into the Gulf of Cadiz during the last glacial period, carving deep valleys in the current continental shelf. During the subsequent sea level rise, an estuary formed, reaching its maximum extension during the most significant regression of estuarine littoral bars around ca. 6500 calibrated years before the present. It was later filled with sediments, nearly completely colmatating, mainly due to the progressive development of the littoral bar of El Rompido at the river mouth.
Furthermore, the marshland feature vegetation adapted to saline environments [26], such as maritime esparto grass meadows, sea purslane, sea lavender, limonium, and sea heath. In the dunes of the littoral bar, the vegetation is typical of non-consolidated sandy soils, with sea daffodil, rush, sea thistle, and sea lily. This area is excellent for the wintering and passage of numerous wading birds and other wetland species. In addition to providing coastal protection against the onslaught of the Atlantic Ocean, the existing vegetation shelters species of interest, such as the chameleon.

3. Methodology

The methodology developed in this work consists of the following steps (Figure 2). First, digital elevation models (DEMs) of the study area are acquired for different dates (2015, 2020 and the end of 2021 in this work). Then, a series of control points are selected, and their elevations are determined from the DEMs. Subsequently, a genetically modified algorithm model (by iterative processes) [23] is trained using the previously obtained elevation data (during training, 1% (21 points) out of the total 2100 points obtained at random were used), and changes in land use are taken into account. Next, the model (whose goal is to develop an equation capable of predicting the erosion depth) is instructed to estimate the output at a series of randomly selected points distributed proportionally across the study area. In this step, the output is an estimation of depth. Afterward, considering climatic variables and tide levels, along with the randomly selected points, the model is requested to obtain sediment transport simulations both into the future and into the past. Later, the model predicts the surface and volumetric changes over the temporal series (prediction is carried out with the 2100 randomly acquired points). Finally, the model forecasts the average erosion in the marshland.
Regarding knowledge of DEMs, it must be highlighted that is essential to help adequately determine the erosion prediction as a result of climate change. In fact, DEMs are considered critical as global geospatial data by the United Nations, the INSPIRE Directive, and the Spanish National Cartographic System [27]. In this sense, the Spanish National Geographic Institute (Instituto Geográfico Nacional, IGN) has employed LIDAR point clouds from the PNOA photogrammetric flight, as well as ground control points and aerotriangulation for the generation of aerial photographs, and later interpolation or correlation techniques to obtain the digital elevation model [28].
In this study, we strategically positioned 21 control points across the study area (Figure 3), each accurately georeferenced in the GIS within the ETRS89-UTM29 system (EPSG: 25829).
In order to obtain the total cubic meters of eroded soil in the study area, and from the IGN, LIDAR data from 2015 and 2020 were acquired to generate the respective DEMs, with resolutions of 5 m and 2 m, respectively, since they are only accessible at these resolutions [28]. All DEMs were supplemented with selected control points to enable the calculation of the total volume through iterative processes [29]. Similarly, a data processing method based on iterative processes was employed to determine the average water depth in the study area, which was necessary to obtain data on soil erosion in the Natural Site.
According to Conradi et al. [4], an extensive literature review was undertaken to ascertain the potential existence of a precipitation record spanning a sufficiently long time to derive results, discussions, and conclusions relevant to this study. From this perspective, based on [30], precipitation (daily rainfall data) and temperature (daily data) records (both from 1991 to 2021) for all populations near the study area (Cartaya, Lepe, El Portil, and La Antilla) were obtained. These records allowed the extraction of pertinent variables (Figure 4) for the Río Piedras and Flecha de El Rompido salt marsh, during which the current research was performed (from 1 January 2015 to 31 December 2021).
In another vein, to predict soil erosion between 2015 and 2021 through data mining, it is essential to emphasize that this is a process of identifying relevant information extracted from vast datasets to uncover patterns and trends. The obtained information is structured in an understandable manner for subsequent use by modified genetic algorithms in this study. Thus, the modified genetic algorithms used [9] operate as a parallel process, functioning as follows. First, the extensive dataset to be categorized is stored in a central storage unit. When the execution begins, individual sections are handled through separate mapping tasks. Later, each mapping task initially accesses the training dataset and proceeds to train the classifier. Subsequently, the trained classification model is used to categorize the extensive dataset. The repeated training process for each mapping task should have a minimal impact on computational performance since the training dataset is relatively small compared to the substantial dataset, which accounts for most of the processing time.

4. Results

4.1. DEM Generation

The first step is related to DEM generation. In this case, two DEMs were gathered from LIDAR data to provide a coherent explanation of the erosion processes that took place (Figure 5).

4.2. Land Use Changes

The Río Piedras and Flecha de El Rompido marshland has undergone a significant transformation due to the expansion of areas dedicated to tourism activities. According to [31], and considering Land Use Changes (LUCs) between 1956 and 2007, it is worth noting that these marshes experienced substantial growth due to urban development expansion in coastal areas due to increased tourism in the study area.
The evolution of agricultural practices has been varied. While arable land has remained relatively stable regarding surface area, the extent of other land uses, such as afforestation, decreased significantly by 70% between 1956 and 2007. Meanwhile, irrigated land has benefited from technological advancements, leading to a substantial increase in its surface area between 1956 and 2007.
Although there was a slight increase in the surface area of the Río Piedras and Flecha de El Rompido salt marsh due to the expansion of aquaculture in 2010, the total area of the Natural Site was approximately 12% smaller compared to the surface that existed in 1956.
To visualize the changes between 2015 and 2021, and concerning the average yearly precipitation and temperature data, the closest land cover maps to the start and end dates, 2016 and 2020 (Figure 6), were compiled with a GIS for the study area.

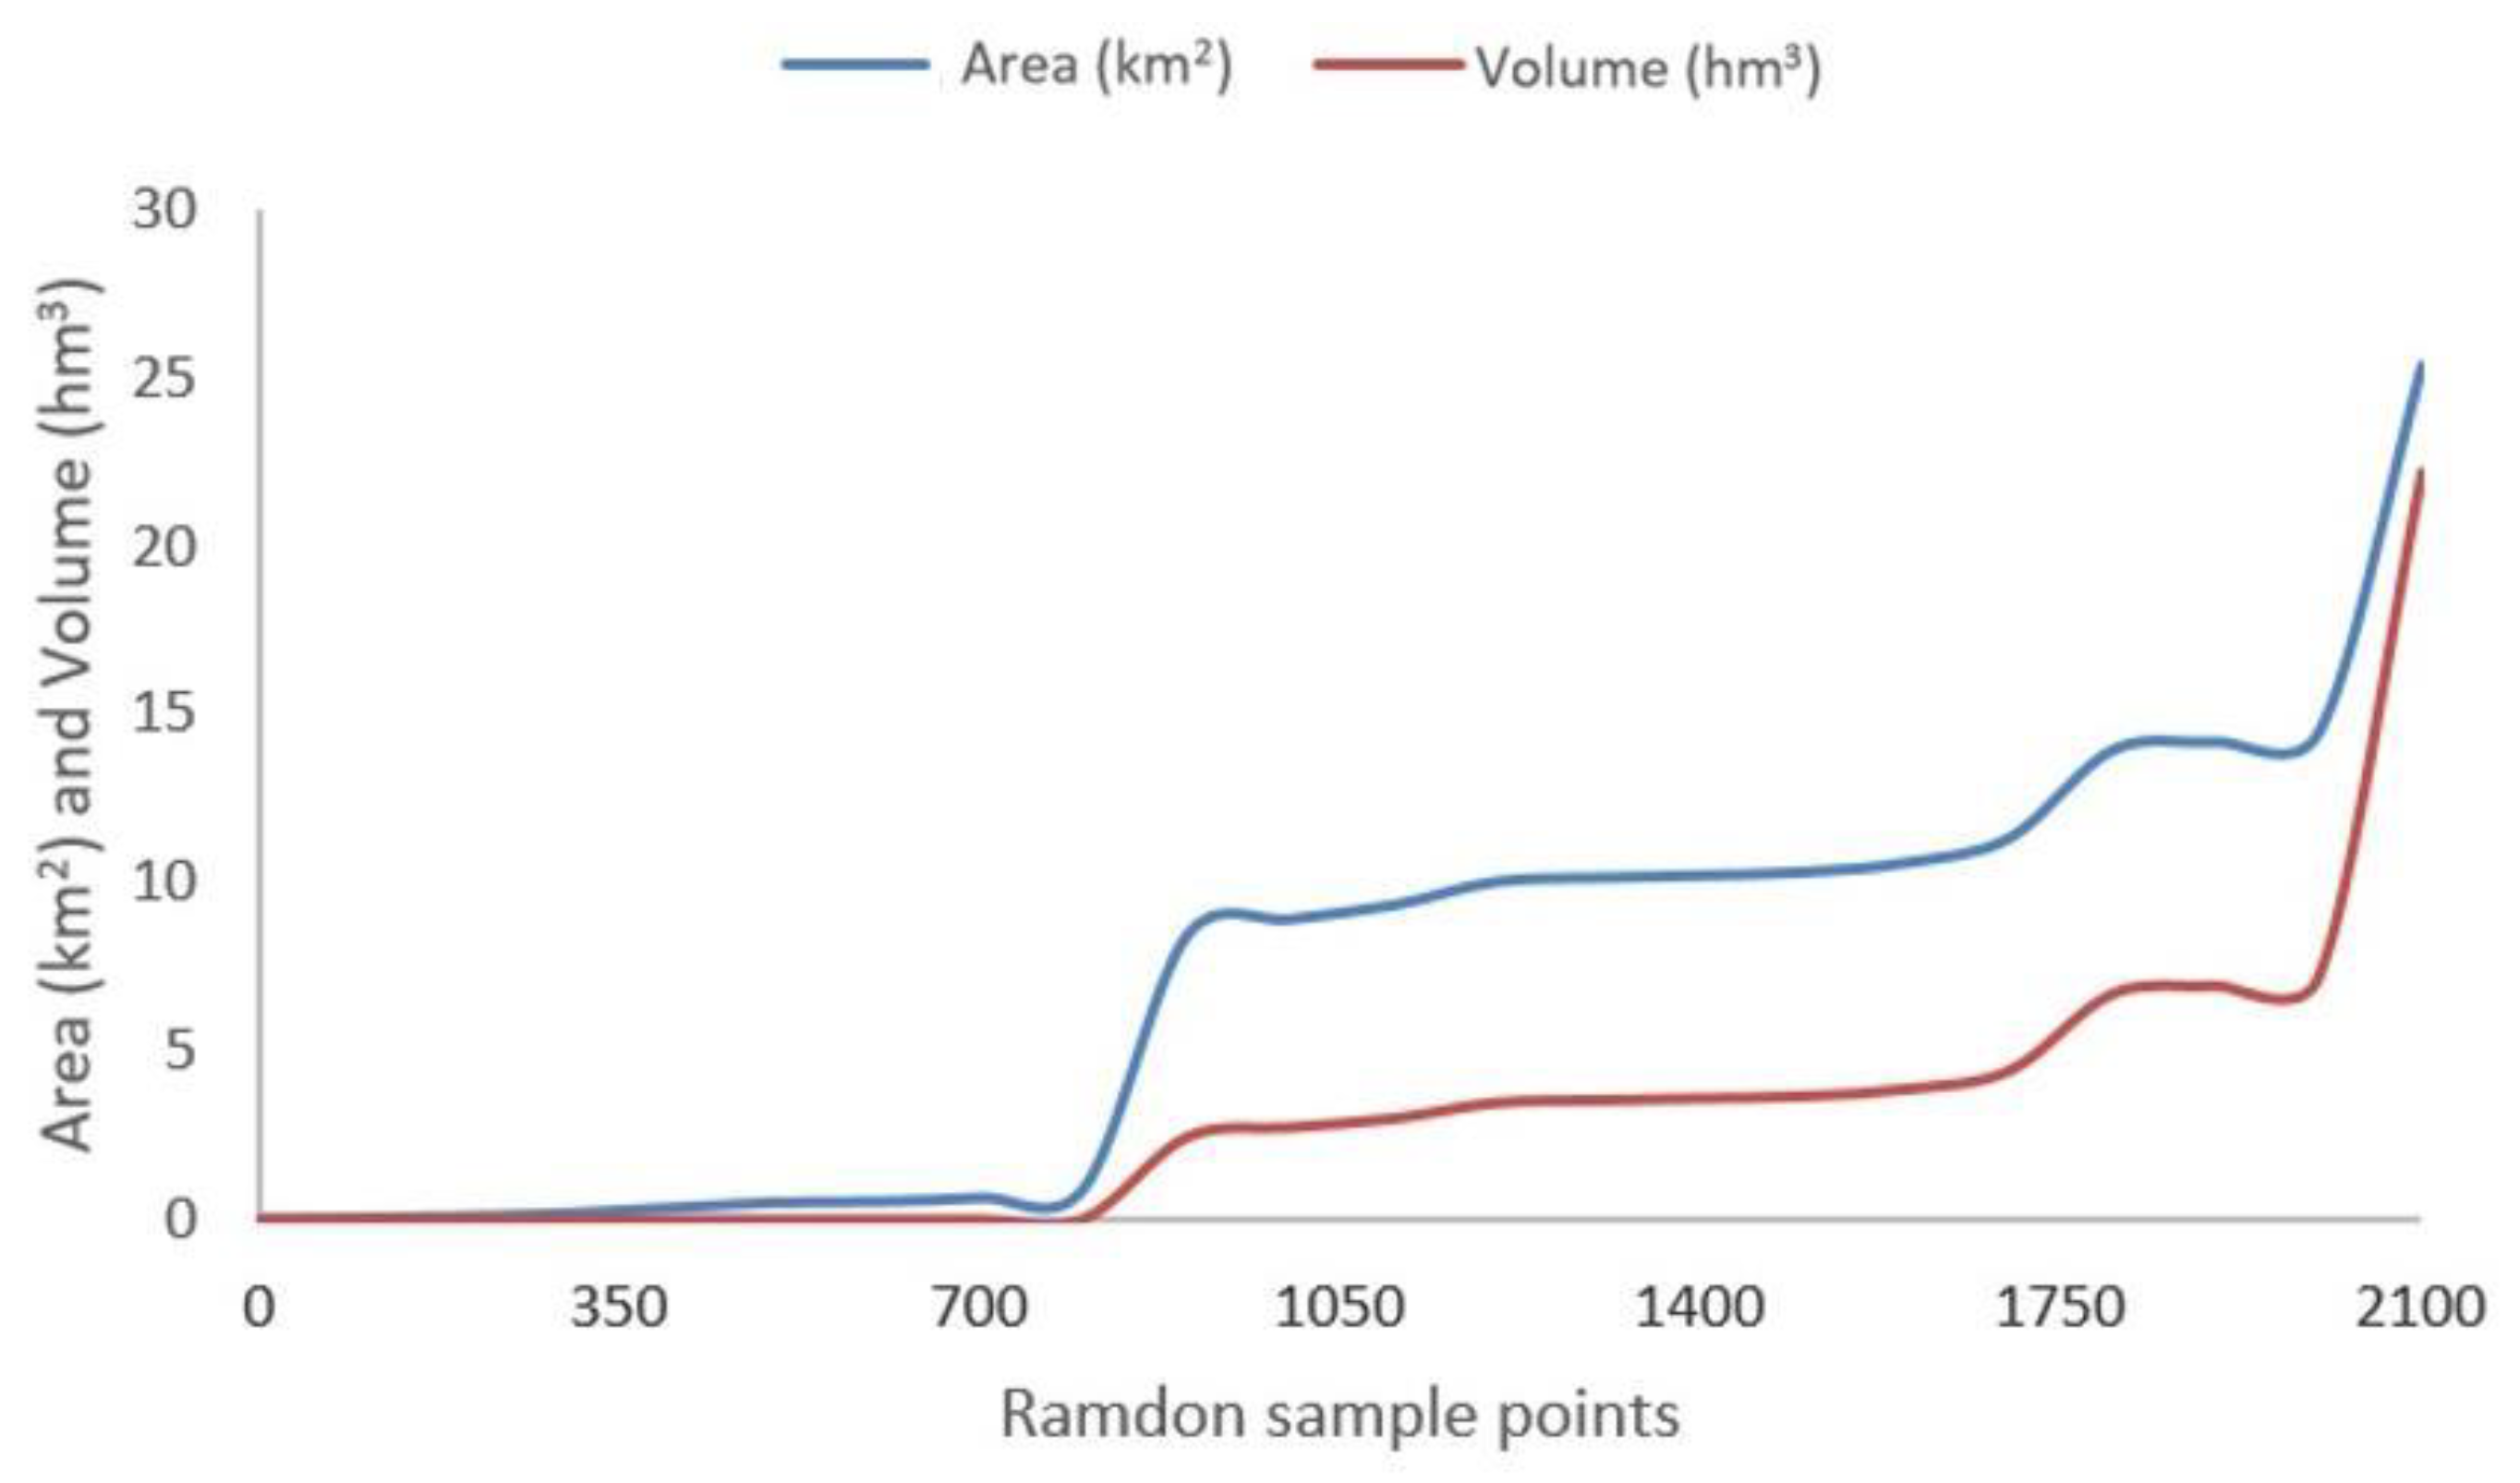
4.3. Prediction of Volumetric Change Processes

Based on [3,4,7], and after analyzing all available data, a progressive decrease in surface water was detected in the study area as a result of the dry period the area is experiencing. Subsequently, using GIS, an analysis [7] was undertaken between the DEM of the Natural Area and the climatic characteristics of the region to obtain the prediction of the average cubic meters of flooded surface. The result was inferred after applying a multiple linear regression [1], which is presented below (Equation (1)):
y = 0.032 0.133 × S D 1.164 × T r = 0.973 ; R 2 = 0.941
where “r” is the Pearson correlation coefficient, “R2” is the determination coefficient, “y” is the prediction of the total volume of eroded soil in the Río Piedras and Flecha de El Rompido salt marsh in hm3, “SD” is the equivalent area in km2 where the volume of eroded soil has occurred and where there has been an increase or decrease in the elevation “T” counted from the lowest elevation obtained through iterative processes between DEMs.
The estimated depth (Table 1) in the study area was obtained through iterative processes using a total of 2100 randomly selected sampling points (training points) from the DEM, which was a necessary step to identify the eroded soil in both the analyzed salt marshes.
Furthermore, after conducting the volumetric prediction of the Río Piedras and Flecha de El Rompido salt marsh, and based on precipitation, temperature data, and the topographic characteristics of the study area, it was confirmed that the total surface area of the marsh, 2530 hectares, corresponded to a flooding volume of 22.14 hm3. Figure 7 displays the trend followed by both the surface and the volume based on the previously selected 2100 random sampling points.
Moreover, a one-way analysis of variance for correlated samples was carried out for the estimated depth variable (this analysis was undertaken considering only the values shown in Table 1) in terms of the DEM used in the study area. These results are summarized in Table 2.
In order to properly understand Table 2, it is necessary to highlight that “Treatment (between groups)” corresponds to the treatment carried out after the statistical comparison between the DEMs shown in Table 1. On the other hand, “Error” is the error existing after the statistical treatment of the different DEMs, which in turn correspond to the different “Blocks” taken into account (Table 1). Finally, “Total” is the sum of the values corresponding to “Treatment (between groups)”, “Error”, and “Block (DEMs)”.
As observed in Table 2, there are significant differences (p ≤ 0.05) in the estimated depth for the different dates considered. This fact was expected due to the unique conditions of the Río Piedras and Flecha de El Rompido salt marsh. Likewise, it is essential to take into account the level of anthropogenic pressure in the study area as another factor of great importance.
With the aim of finding out the possible existence of significant differences between the elevations obtained for the DEMs shown in Table 1, an Honestly Significant Difference test (Tukey HSD test) was conducted (as is well known, the Tukey test allows us to discern whether the differences in results between three or more different treatments applied to three or more groups with the same characteristics have significantly and honestly different average values). The test result did not show significant differences between the elevations obtained for the DEMs of 2015 and 2020, nor for the DEMs of 2015 and 2021. However, significant differences (p ≤ 0.05) were obtained between the elevations of the DEMs corresponding to 2020 and 2021. This result suggests that, in terms of elevation mean value, the 2020 DEM and the estimated DEM at the end of 2021 are significantly different.

4.4. Prediction of Average Erosion in the Río Piedras and Flecha de El Rompido Salt Marsh

The sediment transport was obtained using the method patented by [23]. The results are depicted in Figure 8, where the sediment transport is simulated between 2015 and 2021 based on the sediment characteristics, precipitation, and temperature in the marsh. The reason for the division carried out in Figure 8 (2015–2018 and 2018–2021) is that between 2015 and 2021, a total of seven years are covered, with 2018 being the central year. Due to this fact, the division 2015–2018 and 2018–2021 was considered. Specifying that these results rely on an algorithm that depends on the existing surface shape factor in the study area is crucial.
Finally, it is important to remark that the dynamics of the erosion process divide these marshes into two zones. Firstly, the southern zone has an average total erosion of 0.013 m, with industrial activities being responsible for the increase in erosion [4]. Secondly, the northern zone (with a significant influence from the municipality of Cartaya) has an average total erosion of 0.018 m. It is evident that the growing industrial activity in recent years has led to an increasing vulnerability in the area.

5. Discussion

According to [31], one of the main causes of the rise in tidal levels in the study area, as well as their speed and drag force, is wind speed (ranging from 8 to 22 km/h). This fact is highly significant, as in the present study, it was observed that the maximum levels of sediment transport show a direct correlation with wind speed (always blowing towards the Iberian Peninsula). A portion of the changes in land cover occurring in the study area depends on this effect.
Regarding sediment transport, a relevant factor to consider is the construction of the Juan Carlos I dam, which disrupts the natural sediment flow in the study area and causes marine currents to carry sediments toward the Isla Cristina marshes [10], resulting in overfilling in this Natural Area. Additionally, the natural barrier effect of the Flecha de El Rompido contributes to this. Analogous works regarding anthropogenic actions have been conducted in northern Spain, such as that conducted by de SanJosé et al. [20].
Concerning sediment transport between 2017 and 2018, it must be noted that wind speed is the main cause. On a different note, the construction works of the Real de la Almadraba de Nueva Umbría are the primary cause of increased sediment transport between late 2020 and late 2021.
Furthermore, even though the tidal predictions made by the Spanish Navy Hydrographic Institute for the ports are calculated with a precision of 1 cm in height and 1 min in time, refs. [10,31] have demonstrated significant differences between the theoretical predictions and the actual data recorded by the tide gauge of the Port Authority of Huelva. This makes Equation (1) an important prediction tool, particularly due to its independence from tidal predictions and its high probability of success in reality.
While this is the first time predictive models have been obtained for the entire study area, it is relevant to note that they could be used in other marshes independent of the southern Iberian Peninsula, with adjustments based on the predominant climate variables in each region.

6. Conclusions

The Río Piedras and Flecha de El Rompido salt marshes experience an annual filling process during the months of higher rainfall and a focused water loss during the summer period. Comparing the volume of water between 2015 and 2021, a slight decrease in the 1.76% in the annual water volume entering the marsh was observed, which is related to global warming in the study area.
The results obtained in this study align with those carried out by [4,7,10,18,31] in various wetlands. Hence, it can be deduced that the methodology patented by [23] has been validated, making it entirely safe and reliable.
Although the use of LIDAR data to acquire and simulate sediment transport in marshes is currently underutilized, this research demonstrated that the combined approach of LIDAR (DEM) and GIS was highly successful in visualizing erosive level differences in the study area during the analysis period (2015–2021). It is important to emphasize that an improvement in LIDAR data resolution, as well as increased and better global access to such data, will likely lead to a greater utilization of LIDAR in erosion-related research.
The results show that LIDAR data can be used to visualize water level variations resulting from changes in climate variables. This may be essential for raising public awareness about socioecological issues caused by global warming. In addition, it should be noted that this research work is of great importance, since it allows for predicting the future erosion trend and, therefore, carrying out both area recovery policies and protection plans focused on the renewal of the marsh through tidal flow.
As a future development, a comparison of existing erosive transport, using the methodology outlined in Ramírez-Juidias et al. [23], is planned for the various marshes in the South of the Iberian Peninsula. Furthermore, another study to conduct could be the comparison between the southern Iberian Peninsula salt marshes with those found at the same latitude. It is relevant to point out that Florida State, USA, presents similar climatic conditions to the southern Iberian Peninsula.

Author Contributions

Conceptualization, E.R.-J. and J.-L.A.-M.; methodology, E.R.-J. and J.-L.A.-M.; formal analysis, E.R.-J. and J.-L.A.-M.; investigation, E.R.-J. and J.-L.A.-M.; resources, E.R.-J. and J.-L.A.-M.; writing—original draft preparation, E.R.-J. and J.-L.A.-M.; writing—review and editing, E.R.-J. and J.-L.A.-M.; supervision, E.R.-J. and J.-L.A.-M.; project administration, E.R.-J. All authors have read and agreed to the published version of the manuscript.

Funding

This research received no external funding.

Data Availability Statement

The data used to support the findings of this study can be made available by the corresponding author upon request.

Conflicts of Interest

The authors declare no conflict of interest.

References

  1. Ramírez-Juidias, E. Sedimentation Processes in the Tinto and Odiel Salt Marshes in Huelva, Spain. In Sedimentation Engineering; IntechOpen: London, UK, 2018. [Google Scholar]
  2. Gouveia, M.M.; Magni, N.N.; Lopes, C.L.; Ribeiro, A.S.; Dias, J.M.; Silva, H. The Importance of Soil Elevation and Hydroperiods in Salt Marsh Vegetation Zonation: A Case Study of Ria de Aveiro. Appl. Sci. 2023, 13, 4605. [Google Scholar] [CrossRef]
  3. Sousa, A.; García-Murillo, P.; Sahin, S.; Morales, J.; García-Barrón, L. Wetland place names as indicators of manifestations of recent climate change in SW Spain (Doñana Natural Park). Clim. Chang. 2010, 100, 525–557. [Google Scholar] [CrossRef]
  4. Nguyen, C.; Starek, M.J.; Tissot, P.; Gibeaut, J. Unsupervised Clustering of Multi-Perspective 3D Point Cloud Data in Marshes: A Case Study. Remote Sens. 2019, 11, 2715. [Google Scholar] [CrossRef]
  5. Gilby, B.L.; Weinstein, M.P.; Baker, R.; Cebrian, J.; Alford, S.B.; Chelsky, A.; Colombano, D.; Connolly, R.M.; Currin, C.A.; Feller, I.C.; et al. Human Actions Alter Tidal Marsh Seascapes and the Provision of Ecosystem Services. Estuaries Coasts 2021, 44, 1628–1636. [Google Scholar] [CrossRef]
  6. Finotello, A.; Tognin, D.; Carniello, L.; Ghinassi, M.; Bertuzzo, E.; D’Alpaos, A. Hydrodynamic Feedbacks of Salt-Marsh Loss in the Shallow Microtidal Back-Barrier Lagoon of Venice (Italy). Water Resour. Res. 2023, 59, e2022WR032881. [Google Scholar] [CrossRef]
  7. Conradi, M.; Sánchez-Moyano, J.E.; Bhuiyan, M.K.A.; Rodríguez-Romero, A.; Galotti, A.; Basallote, M.D.; DelValls, A.; Parra, G.; Riba, I. Intraspecific variation in the response of the estuarine European isopod Cyathura carinata (Krøyer, 1847) to ocean acidification. Sci. Total Environ. 2019, 683, 134–145. [Google Scholar] [CrossRef] [PubMed]
  8. Arias-García, J.; Gómez-Zotano, J. La planificación y gestión de los humedales de Andalucía en el marco del Convenio Ramsar. Investig. Geográficas 2015, 63, 117–129. [Google Scholar] [CrossRef]
  9. Phinzi, K.; Ngetar, N.S. The assessment of water-borne erosion at catchment level using GIS-based RUSLE and remote sensing: A review. Int. Soil Water Conserv. Res. 2019, 7, 27–46. [Google Scholar] [CrossRef]
  10. Ramírez-Juidias, E.; Víquez-Urraco, F.; Noguero-Hernández, D. Sedimentary processes in the Isla Cristina salt-marshes: Geomorphological changes of landscape. Ocean Coast. Manag. 2017, 143, 148–153. [Google Scholar] [CrossRef]
  11. Lopac, N.; Jurdana, I.; Brnelić, A.; Krljan, T. Application of Laser Systems for Detection and Ranging in the Modern Road Transportation and Maritime Sector. Sensors 2022, 22, 5946. [Google Scholar] [CrossRef]
  12. Debnath, S.; Paul, M.; Debnath, T. Applications of LiDAR in Agriculture and Future Research Directions. J. Imaging 2023, 9, 57. [Google Scholar] [CrossRef]
  13. Sapkota, Y.; White, J.R. Marsh edge erosion and associated carbon dynamics in coastal Louisiana: A proxy for future wetland-dominated coastlines world-wide. Estuar. Coast. Shelf Sci. 2019, 226, 106289. [Google Scholar] [CrossRef]
  14. Castillo, J.M.; Luque, C.J.; Castellanos, E.M.; Figueroa, M.E. Causes and consequences of salt-marsh erosion in an Atlantic estuary in SW Spain. J. Coast. Conserv. 2000, 6, 89–96. [Google Scholar] [CrossRef]
  15. Houttuijn Bloemendaal, L.J.; FitzGerald, D.M.; Hughes, Z.J.; Novak, A.B.; Phippen, P. What controls marsh edge erosion? Geomorphology 2021, 386, 107745. [Google Scholar] [CrossRef]
  16. Martins, D.; Alves da Silva, A.; Duarte, J.; Canário, J.; Vieira, G. Changes in Vessel Traffic Disrupt Tidal Flats and Saltmarshes in the Tagus Estuary, Portugal. Estuaries Coasts 2023, 46, 1141–1156. [Google Scholar] [CrossRef]
  17. Gutiérrez-Mas, J.; García-López, S. Recent evolution of the river mouth intertidal zone at the Río San Pedro tidal channel (Cádiz Bay, SW Spain): Controlling factors of geomorphologic and depositional changes. Geol. Acta 2015, 13, 123–136. [Google Scholar] [CrossRef]
  18. Ramírez-Juidias, E. Use of satellite images to study erosion processes at Isla Cristina’s salta-marshes. South Florida J. Dev. 2021, 2, 4828–4836. [Google Scholar] [CrossRef]
  19. Soto, M.V.; Arriagada, J.; Cabello, M.; Molina, M.; Maerker, M. Geoamenazas Hidro-Geomorfológicas en subcuencas de los Andes Costeros de Chile Semiárido. Rev. Estud. Latinoam. Sobre Reducción Del Riesgo Desastr. REDER 2022, 6, 47–59. [Google Scholar] [CrossRef]
  20. de Sanjosé Blasco, J.; Gómez-Lende, M.; Sánchez-Fernández, M.; Serrano-Cañadas, E. Monitoring Retreat of Coastal Sandy Systems Using Geomatics Techniques: Somo Beach (Cantabrian Coast, Spain, 1875–2017). Remote Sens. 2018, 10, 1500. [Google Scholar] [CrossRef]
  21. Temima, I.; Bethel, G.; Fikrey, T. Spatio-Temporal Dynamic of Land Use and Land Cover in Andit Tid Watershed, Wet Frost/Afro-Alpine Highland of Ethiopia. Edelweiss Appl. Sci. Technol. 2021, 5, 33–38. [Google Scholar] [CrossRef]
  22. El Aoula, R.; Mhammdi, N.; Dezileau, L.; Mahe, G.; Kolker, A.S. Fluvial sediment transport degradation after dam construction in North Africa. J. Afr. Earth Sci. 2021, 182, 104255. [Google Scholar] [CrossRef]
  23. Ramírez-Juidias, E.; Pozo-Morales, L.; Galán-Ortiz, L. Procedimiento para la Obtención de una Imagen Teledetectada a Partir de Fotografía. Patent No. ES2537783B2, 12 June 2015. [Google Scholar]
  24. Delgado, A., Jr. Quantifying Coastal Marsh Erosion Using a LIDAR Terrestrial Laser Scanner: The Role of Waves, Soil, and Vegetation. Texas A & M University: College Station, TX, USA, 2016. [Google Scholar]
  25. Gobierno de España Ley 2/1989, de 18 de Julio, por la que se Aprueba el Inventario de Espacios Naturales Protegidos de Andalucía y se Establecen Medidas Adicionales para su Protección. Available online: https://www.boe.es/buscar/doc.php?id=BOE-A-1989-20636 (accessed on 21 October 2023).
  26. Rodríguez-Ramírez, A.; Villarías-Robles, J.J.R.; Celestino-Pérez, S.; López-Sáez, J.-A.; Pérez-Asensio, J.N.; León, Á. Extreme-Wave Events in the Guadalquivir Estuary in the Late Holocene: Paleogeographical and Cultural Implications. In Historical Earthquakes, Tsunamis and Archaeology in the Iberian Peninsula; Springer Nature: Singapore, 2022; pp. 127–150. [Google Scholar]
  27. Instituto Geográfico Nacional PNOA-LiDAR. Available online: https://pnoa.ign.es/web/portal/pnoa-lidar/presentacion (accessed on 15 November 2023).
  28. Centro Nacional de Información Geográfica Download Center. Available online: http://centrodedescargas.cnig.es/CentroDescargas/locale?request_locale=en (accessed on 11 October 2023).
  29. Matgen, P.; Schumann, G.; Henry, J.-B.; Hoffmann, L.; Pfister, L. Integration of SAR-derived river inundation areas, high-precision topographic data and a river flow model toward near real-time flood management. Int. J. Appl. Earth Obs. Geoinf. 2007, 9, 247–263. [Google Scholar] [CrossRef]
  30. Climate Research Group (University of Seville, S. Global Climate Monitor). Available online: http://www.globalclimatemonitor.org/# (accessed on 1 October 2023).
  31. Consejería de Medio Ambiente (Junta de Andalucía). Medio Siglo de Cambios en la Evolución de Usos del Suelo en Andalucía 1956–2007; Junta de Andalucía: Seville, Spain, 2011.
  32. REDIAM (Junta de Andalucía) Download REDIAM Service. Available online: https://portalrediam.cica.es/descargas (accessed on 7 October 2023).
Figure 1. Study area.
Limnolrev 23 00012 g001
Figure 2. Research workflow.
Limnolrev 23 00012 g002
Figure 3. Control point distribution. Coordinates in km. Source: own elaboration from [28].
Limnolrev 23 00012 g003
Figure 4. Mean year ombrothermic diagram (1991–2021) of the study area. Source: own elaboration from [30].
Limnolrev 23 00012 g004
Figure 5. LIDAR elevation map comparison for the period 2015–2020. Coordinates in km. Source: own elaboration from [28].
Limnolrev 23 00012 g005
Figure 6. Land-cover changes between 2016 and 2020. Coordinates in km. Source: own elaboration from [32].
Limnolrev 23 00012 g006
Figure 7. Estimation of surface and volume.
Limnolrev 23 00012 g007
Figure 8. Variation in depth in the Río Piedras and Flecha de El Rompido salt marshes due to sediment transport between 2015 and 2021. Positive values indicate soil deposition, while negative ones mean soil erosion.
Limnolrev 23 00012 g008
Table 1. Elevation data for the sample check points (training points).
Check Point DEM 2015 (m)DEM 2020 (m)End 2021
DEM Estimation (m)
10.0000.0000.000
20.0070.0000.000
30.0140.0110.016
40.0270.0200.026
50.0390.0330.037
60.0410.0400.043
70.0500.0500.054
80.0720.0610.267
90.6550.3630.570
100.6920.6730.691
110.7240.7080.730
120.7790.7510.771
130.7880.7830.787
140.7940.7910.794
150.8000.7970.805
160.8230.8120.834
170.8810.8520.926
181.0840.9821.054
191.1021.0931.103
201.1251.1131.412
211.9691.5471.845
Table 2. Summary of the analysis of the variance (ANOVA) for the estimated depth variable (SS = sum of squares; df = degrees of freedom; MS = mean squared; F = value of the test statistic; p = significance).
SSdfMSFp
Treatment (between groups)0.04732920.0236645.030.011256
Error0.1872400.0047
Block (DEMs)15.503320
Total15.73782962
Disclaimer/Publisher’s Note: The statements, opinions and data contained in all publications are solely those of the individual author(s) and contributor(s) and not of MDPI and/or the editor(s). MDPI and/or the editor(s) disclaim responsibility for any injury to people or property resulting from any ideas, methods, instructions or products referred to in the content.

