Article

Dipteran Prey Vulnerability in Intraguild Predation (IGP) System Involving Heteropteran Predators: Density and Habitat Effects

Department of Zoology, University of Calcutta, 35 Ballygunge Circular Road, Kolkata 700019, India
*
Author to whom correspondence should be addressed.
Limnol. Rev. 2023, 23(1), 1-20; https://doi.org/10.3390/limnolrev23010001
Submission received: 19 April 2023 / Accepted: 19 April 2023 / Published: 27 April 2023

Abstract

:
(1) Background: The effects of density and the habitat conditions on the prey vulnerability in the Intraguild Predation (IGP) system were evaluated using the water bug D. rusticus as the top predator. (2) Methods: Using two different density levels (low or high) of the dipteran prey (mosquito and chironomid), the IGP system was set with A. bouvieri as the IG prey. (3) Results: The prey vulnerability was reduced in complex habitat conditions, irrespective of the prey and predator density levels and the prey identity. Correspondingly, the IG prey vulnerability was higher in the low shared prey density and complex habitat. The IG prey consumption by the top predator was higher with the mosquito as shared prey than chironomid as shared prey. Observations on the prey consumption indicated that the consumption of both the chironomid and the mosquito prey dwindled with the time for all combinations of the prey density and the habitat conditions. On a comparative scale, the prey clearance rates were higher for mosquitoes in contrast to the chironomid larvae as shared prey. (4) Conclusions: Apparently, a complex set of interactions involving the habitat conditions, top predator and the prey determines mosquito prey vulnerability against the water bug. Such interactions provide evidence for the coexistence of the mosquito larvae along with multiple predators in the wetland ecosystem.

1. Introduction

Intraguild predation and habitat complexity are important factors that influence the outcome of prey–predator interactions in freshwater communities [1,2,3,4,5,6,7]. Empirical examples suggest that the habitat complexity reduces the space of interaction between the predators and prey [8]. As a consequence, the vulnerability of the prey to the predators may be enhanced. The different elements of the habitats create a structure which can reduce the foraging ability of predators by interfering with a predator’s ability to locate and handle prey [9,10,11]. Alternatively, the prey may be able to utilize the habitat elements as refuge, thereby enhancing survival in the complex habitats [12,13,14]. These propositions are particularly relevant for the macroinvertebrate prey and predators in the freshwater ecosystems. In the context of the habitat complexity, the orientation and the interactions of the predators and prey become more relevant. Additionally, the density-dependent interactions between the predators and the prey, the prey preference of the predators and the predator efficacy are also factors that influence the outcome of the predator and prey interactions in the complex habitat conditions. With the changing density of the predators and the prey, the interaction changes both in the open and the complex habitat conditions, observed for the water bugs [5,15] and fish as the predators [16]. In a multiple predator system, the prey vulnerability varies with the identity of the predators and the relative density of the predators and the prey [3,17,18,19].
In a freshwater community, the abundance of the insect predators and prey is common, along with a multitude of annelids, arthropods and snails that contribute to the diversity and the functional aspects [20,21,22,23,24]. The co-occurrence of multiple predators enhances the complexity of the food web, which is characterized by numerous predatory links, many of which are recognized as the indirect interactions [25]. The simple linear prey–predator interaction is altered when multiple predators compete for a single species of prey, giving rise to an intraguild predation (IGP) system [26,27,28,29]. In an IGP system, two or more predators engage in predation of each other, thus reducing the vulnerability of the shared prey. One or more of the predators in the IGP system can be placed as intraguild prey (IG prey), which may consume the shared prey or may be consumed by the IG predator (the top predator) in a context-dependent manner. The relative density of the shared prey and the IG prey and the top predator influences the consumption pattern of the IG prey, as well as the IG predator [18,30]. As a consequence, the population level effects are altered for both the IG prey and the shared prey. The impact of the IGP system on the IG prey and the shared prey may be intensified by the vegetation present in the habitats. Such complexity of the habitats may influence the movement of the predators, as well as the aggregation of the prey, thereby potentially altering the extent of interactions.
The common habitats of the insect predators are featured by ample heterogeneity with spatial structures and abundant prey. The structural complexity of the habitats can influence the prey selection by the predators, and therefore it is considered significant in the mosquito prey control. The habitat complexity increases species abundance, as well as stabilizes prey–predator interactions, which is well evident from the studies on predation by fishes on chironomid [31] and mosquitoes [32]. Sometimes the presence of vegetation reduces the vulnerability of mosquito larvae due to impaired prey hunting or the reduced maneuverability of water bugs [5]. Similar observations were reported for the water bugs Belostoma oxyurum [33] and B. fluminea and the odonate nymphs Anax junius [34] preying on tadpoles. In addition, the predation rate, prey selection and interaction of multiple predators also change with the habitat complexity.
When multiple predators share the same prey, the prey consumption can be “more than” or “less than’’ the expected values, based on the individual consumption by the predators [17,35,36,37]. If the expected consumption value is more than observed, it indicates a synergistic effect, which can be recognized as an augmentation of risk of predation on target prey [3,38]. In situations where expected consumption is less than observed, it indicates a risk reduction for target prey, perhaps as a consequence of the interference competition with the intraguild prey in IGP system. Thus, the interaction between the IG predator and IG prey influences the population of shared prey, as IG prey becomes vulnerable to IG predators, and that means a reduced number of predators available and prey switching by top predator for a greater nutrient reserve. Thus, the fate of shared prey can be changed by the manipulation of its own density in contrast to the IG prey and IG predator. To test the effects of density and habitat heterogeneity on shared prey consumption, we considered the belostomatid bug Diplonychus rusticus Fabricius, 1781, as an intraguild predator (IG predator); the notonectid bug Anisops bouvieri KirkaIdy, 1741, as an intraguild prey (IG prey); and the IV instar larvae of Culex quinquefasciatus and chironomid larvae as shared prey in laboratory mesocosms. These predatory insects co-occur with mosquitos in tropical wetlands such as rice fields [21,22,23,39,40,41]. The presence of immature mosquitos as one of the dietary choices of these predators makes them suitable as one of the mosquito control agents [42,43,44,45]. In view of the predatory behavior of these water bugs, the relative density of prey and predator can be a useful explanatory behavior to infer about the effects of density on mosquito larvae consumption in an IGP system.
In natural conditions such as rice fields and allied wetlands, mosquito and chironomid larvae coexist with a multitude of insect predators [23,25,46,47]. It is imperative that the interactions between mosquito prey and its insect predators be dictated by the habitat conditions and intraguild predation. The beneficial regulatory effects of insect predators on mosquito larvae may be altered due to the IGP and habitat complexity [5,15,48]. In terms of vulnerability of mosquito larvae to the insect predators, possible risk enhancement or risk reduction may result from IGP and habitat complexity. An appraisal of the effects of IGP and habitat complexity on the vulnerability of mosquito and chironomid prey would enable us to comment on the regulatory effects of insect predators. The present experiment was carried out by using D. rusticus as the key predator, A. bouvieri as the IG prey and mosquito and chironomid larvae as the shared prey. The prey risk assessment was made for nine consecutive days to highlight variations in prey regulation among the days concerned. The results of the study will provide a more precise assessment of the regulation of the dipteran prey by the predator population in the natural conditions, keeping mosquito biocontrol as a primary objective. An approximation to the natural conditions can be made through this study wherein the simulated natural habitat was present as a background for the interactions of the predators and the prey.

2. Material and Methods

2.1. Collection and Maintenance of Water Bugs

The adult morphs of the water bug Diplonychus rusticus and Anisops bouvieri were collected from wetlands near Ballygunge, Kolkata and ponds of the Ballygunge Science College campus (22°31′37″ N, 88°21′46″ E), Kolkata, India. The collected water bugs were brought to the laboratory and placed separately in plastic buckets containing tap water, with a few specimens of Ipomoea sp., Hydrilla sp. and Jussiaea repens. These were added to the bucket to simulate natural conditions and acclimatization. After a period of seven days of acclimation in the laboratory, the water bugs were used for experiments. During this period, the water bugs were supplied with mosquito larvae and chironomids as food ad libitum. The water of the containers was changed every 24 h to prevent fouling. The water bugs were maintained at a density of the 25 no/16 L of water. During the course of the experiments, the collection of the water bugs was continued and maintained in a similar way. This was performed to comply with the requirements of true replications. In a trial of predation experiments, a random choice of water bug predators was possible, and the trials were conducted at different dates, so that the trials were randomized and interspersed. Any individual predator was used in only a single experimental trial. Following completion of the experiment, the individual was placed in a different container to isolate it from the conspecifics to be used in further trials. Before using the predators for the experiments, these were fed to satiation and starved for 24 h. The excess number of preys in the rearing containers was indicative of the predator satiation. The belostomatid bug D. rusticus ranged between 15 and 18 mm in length (mean 16.4 ± 0.14 SE) and 94.6 and 176.3 mg in weight (mean 141.3 ± 4.55 SE), while the IG prey A. bouvieri ranged in length from 5.8 to 7.2 mm (mean 6.32 ± 0.08 SE) and 7.9 to 12.6 mm in weight (mean 9.89 ± 0.24 SE).

2.2. Collection and Maintenance of Mosquito Larvae

The immature Culex quinquefasciatus (Say 1823) specimens were collected from the sewage drains in and around the Ballygunge Science College campus, Kolkata, India, at an interval of 3 to 4 days, as per the requirement of the experiment. The collected larvae were then kept in enamel trays (30 × 20 × 10 cm3) in the laboratory, and larger larvae corresponding to IV instar stage (ratio between length of siphon and body length) were separated. These larvae were placed in a separate tray containing aged tap water and were used for experiments. Relatively smaller larvae were kept and reared in containers (using fish food and daphnia dust, well mixed, as food) to IV instar stage and supplemented the number of preys in the experiments when required.
For the segregation and maintenance of chironomid larvae, the sediment collected was poured into enamel trays (9 × 27 × 54 cm3) containing sewage-drain and tap water (1:1; v/v) and was placed under a light source. The setup was left undisturbed for 3–4 h to allow the sediment to settle down and the chironomid larvae to emerge from the sediment and cling to the sides of the tub. Subsequently, the larvae were separated with a pipette; the larger ones (20 mm in length and 1.9–2.5 mg in weight) were sorted and placed on smaller trays with a little sediment from where they were used for the experimental purposes. The red color and striations in ventromental plates formed the basis for identification of these larvae under subfamily Chironominae, family Chironomidae. In the present text, these larvae are termed chironomid larvae.

2.3. Experimental Design

In the laboratory, six plastic tubs (62.2 × 62.2 × 29.2 cm3), each with an 80 L water capacity were filled with water (pond:tap, 1:1; v/v). Each experiment was observed under two habitat conditions:
(1)
Simple or open habitat: without pebbles and vegetation.
(2)
Complex habitat: with pebbles and vegetation (4 Ipomoea sticks at 2 corners of aquarium and some Pistia were given, which were in a floating state).
The experiments were carried out using two densities of prey larvae, 50 and 200 against two densities of D. rusticus (top predator), 2 and 4 and constant density of A. bouvieri (10). Two controphic species, mosquito and chironomid larvae were used as prey, both separately and in different relative ratios.
The experimental mesocosms were set for mosquito and chironomid larvae separately, using similar conditions. Six replicates were made for both open and complex habitats. Using two levels of predator density and two levels of prey density, the prey mortality was observed at the end of 24 h for a period of nine consecutive days. On each day, the experimental mesocosms were set with a required density of shared prey and predators. Data on the shared prey mortality were used as an input to judge the risk to predation of mosquito and chironomid larvae. The experimental design and the data analysis are shown in Table 1.

2.4. Data Analysis

2.4.1. Multiplicative Risk Model

The data on the prey consumption were used to assess the risk of predation for the two dipteran preys in the IGP system. As a part of the IGP system, the shared prey is supposed to face the risk of predation from both the top predator and the intraguild prey, which was the basis for the application of the model. A “multiplicative risk model” [17,35,36,37] was used to quantify the risk of predation as stated below.
To assess the independence between predator effects, the observed predation rates and the generated predicted values were compared by the multiplicative risk model. This model predicts the combined risk to the prey when both the IG predator and IG prey are present but their effects are independent. Specifically, this model predicts that the expected proportion of prey killed by predator species A and B together (pAB) is as follows:
pAB = pA + pB − pApB
where pAB is the predicted combined consumption for a particular initial prey density, pA is the probability of being consumed by predator species A in isolation, and pB is the probability of being consumed by predator species B in isolation over a 24 h period of exposure. The pApB term in the model accounts for prey removal by both predators. A disparity in the observed and expected values for this model were assessed using the t-test for each of the combination of the prey and predator density and the prey type in both the simple and the complex habitats.

2.4.2. Clearance Rates
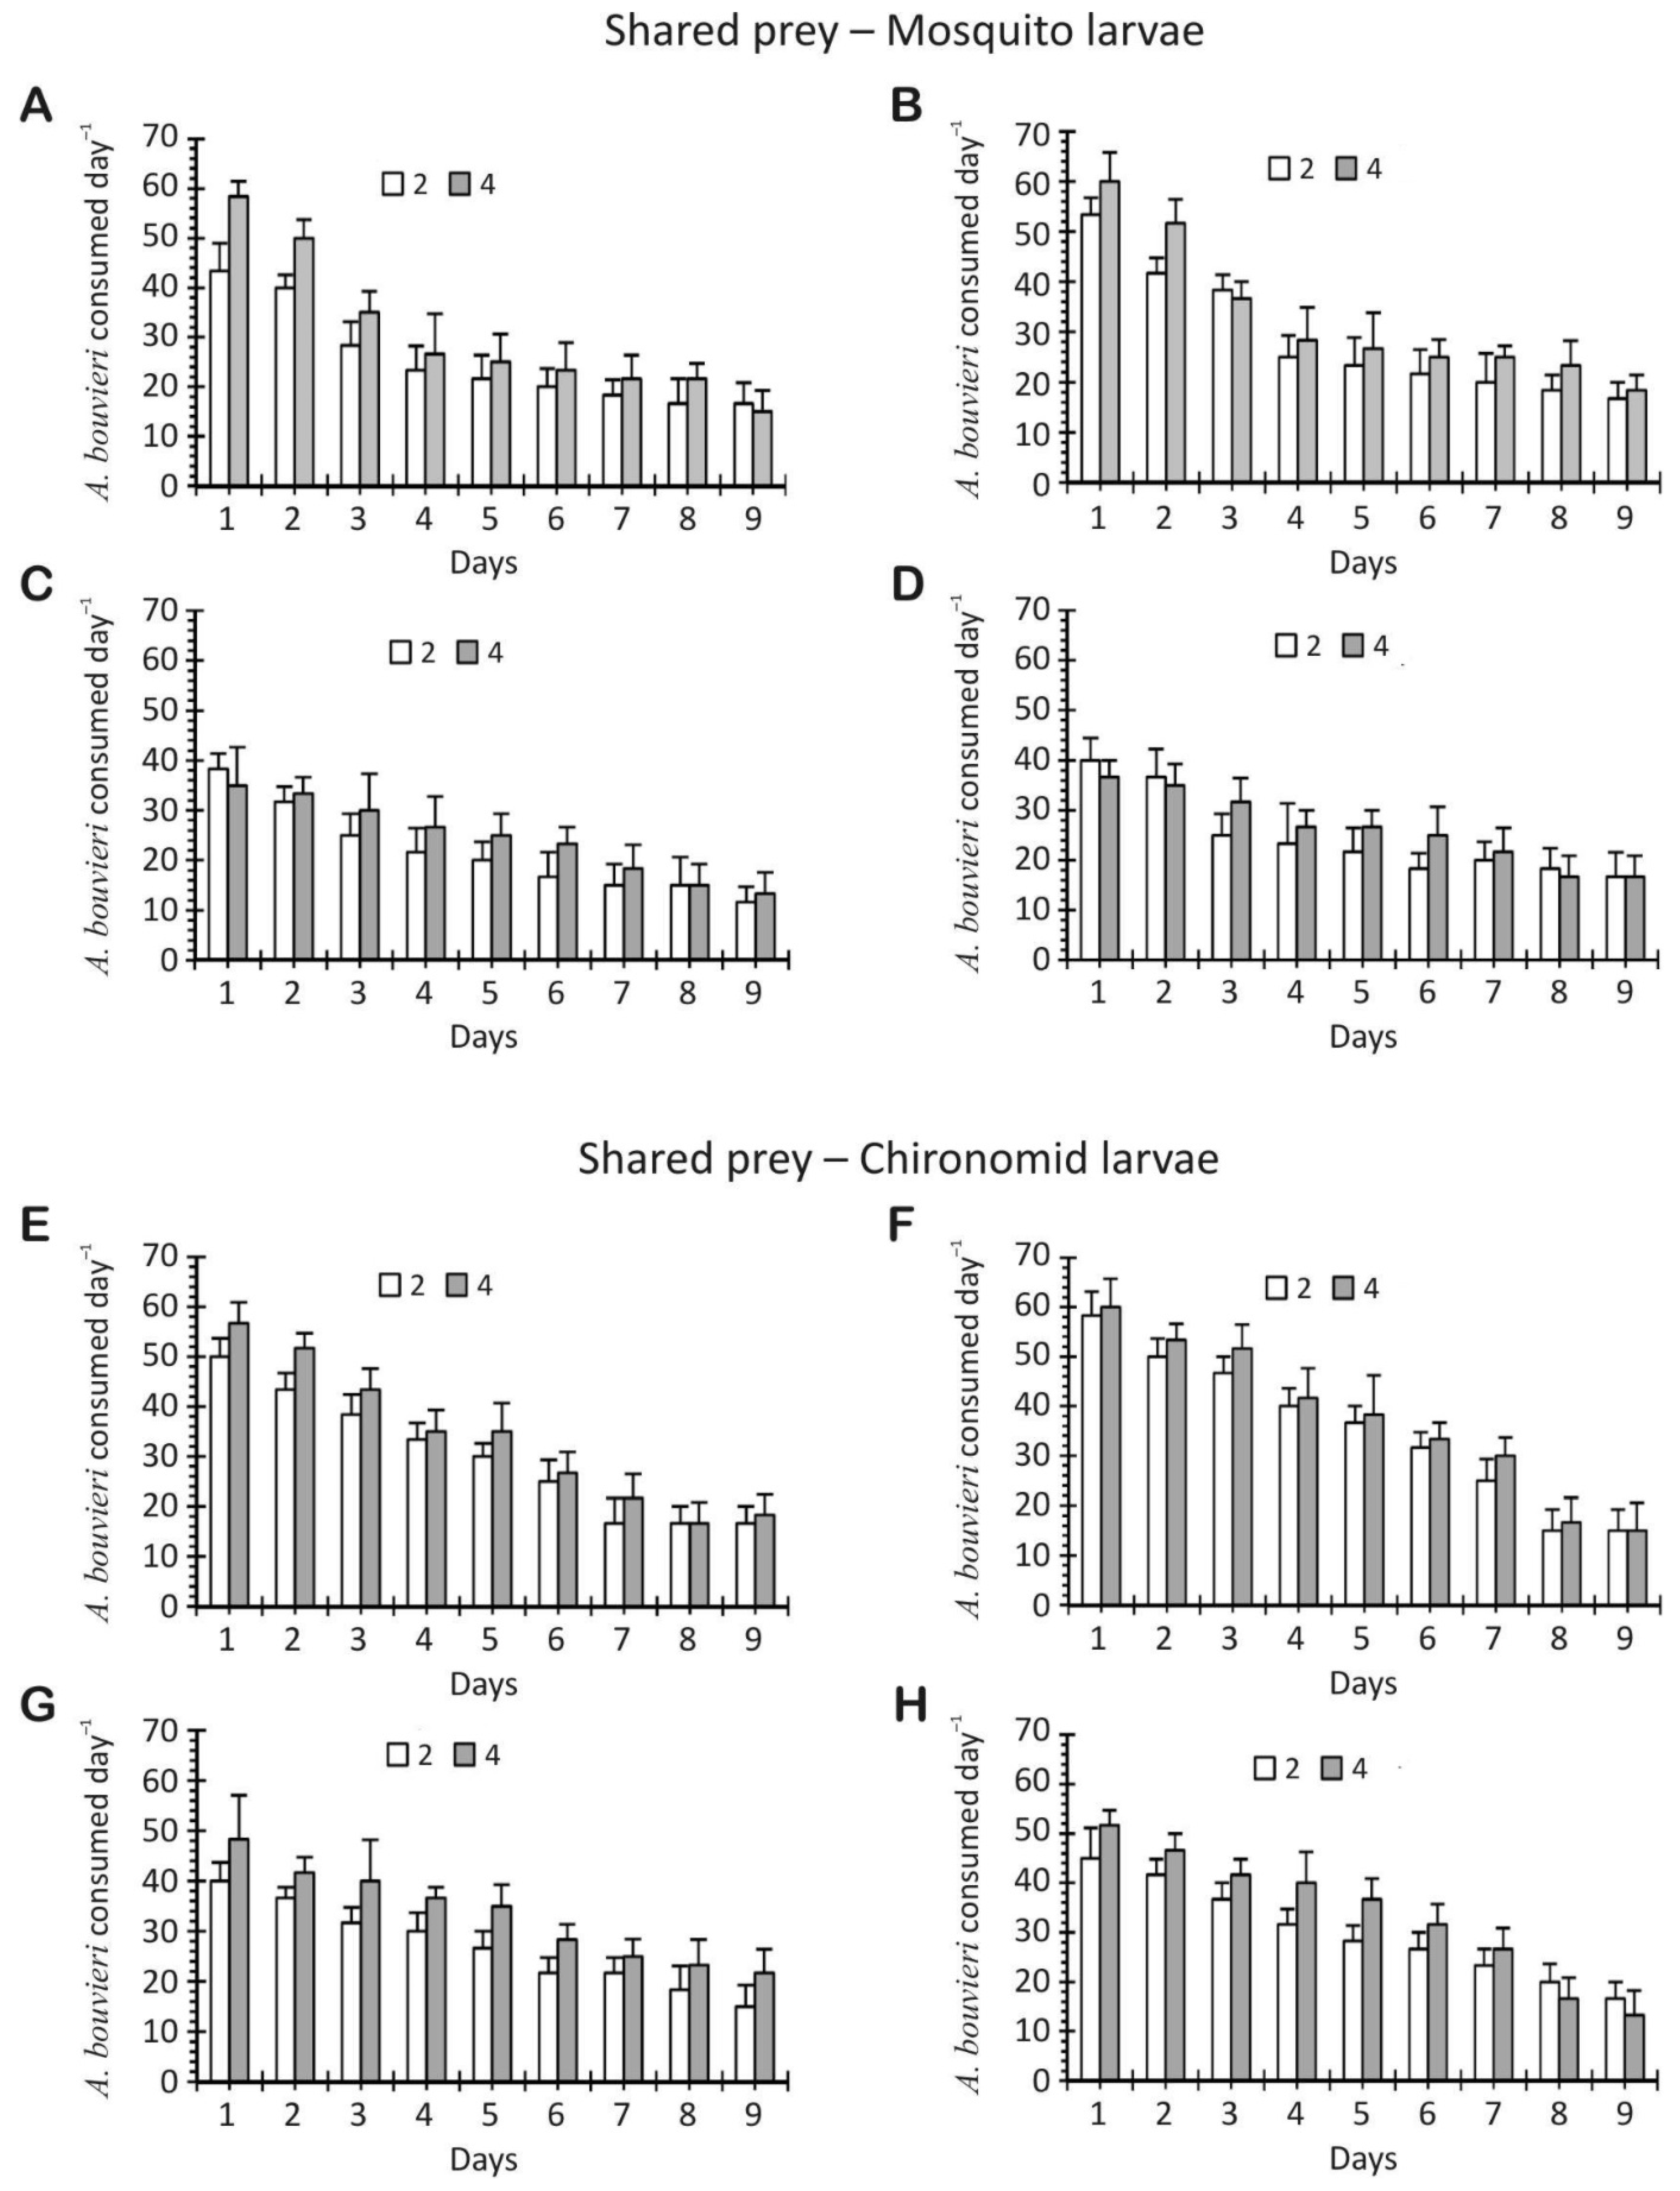
The data obtained on the shared prey consumption and the intraguild prey consumption were assessed using the clearance rate values, following Gilbert and Burns (1999) and Hampton (2004). In the course of the calculation of the CR value, the space (volume of water), number of predator individuals and time of the predation are integrated along with the prey consumed. The formula used to deduce the CR value is as follows:
CR = VlnPe/NT
where V is the volume of water (litres), T is the time (days), N is the number of predators, and Pe is the number of preys left after time T.
A habitat-specific difference in the CR value was assessed by using the t-test [51], with reference to the deviation from the 0, assuming that there is no difference between the habitat on the prey consumption pattern. The CR values were compared for the simple and complex habitats for the nine consecutive days for both the shared prey and the intraguild prey. In addition, a logistic regression was applied for the justification of the differences in the CR values observed for the shared prey and the IG prey in the different habitat conditions and the prey and predator density combinations.

3. Results

The mortality of the shared prey (mosquito larvae and chironomid larvae) dwindled with time in the IGP system with the water bug D. rusticus as IG predator and A. bouvieri as IG prey for all densities and combinations (Figure 1). The IG prey mortality varied in correspondence with the identity and relative density of the shared prey and the top predator (Figure 2). Under open habitat conditions, at a low density (50 individuals) of mosquitos as shared prey, the mortality of 20 individuals on the first day was reduced to 6 individuals on the ninth day in presence of 2 top predators (IG predator, D. rusticus). In contrast, the mortality of mosquitos on day 1 was 8.5, and it was reduced to 4.5 on day 9 under complex habitat conditions with same density of the IG predator (Figure 1A,B). Similar trends were observed at a shared prey density of 200 mosquitoes (Figure 1C,D); however, in all instances, the effect of the top predator density was prominent. In the case of the chironomid as shared prey, a comparable trend in the mortality pattern was observed where the effects of the habitat complexity and relative density of the predators were noticeable (Figure 1). Although the IG prey mortality was reduced with the increase in the relative density of the shared prey, the effects of the habitat conditions were observed in all instances irrespective of the shared prey identity (Figure 2). When mosquitos were present as shared prey at a density of 50 individuals (low density), the IG prey mortality on day 1 was 4.3 in simple habitat conditions compared to 5.3 under complex habitat conditions, and this was gradually reduced to 1.67 individuals on day 9 for both the habitat conditions (Figure 2A,B). With a high IG predator density of 4 individuals, the mortality of IG prey was higher in contrast to the density of 2 individuals. However, at a high prey density of 200 individuals of mosquito larvae, the mortality of the IG prey was lower compared to the low shared-prey density (Figure 2C,D).
For chironomid larvae as shared prey, a similar trend was observed, where mortality of the IG prey was dependent on the habitat conditions, density of the shared prey and density of the IG predator. In comparison to the mortality of 5 IG prey at a shared prey density of 50 under simple habitat conditions, the mortality of IG prey was 5.83 under complex habitat conditions on day 1, and this was reduced to 1.5 on day 9. The results of the repeated-measures ANOVA shared prey consumption (Table 2), and the IG prey mortality (Table 3) justifies the variations with reference to the explanatory variables, such as the day, the habitat type and the prey and predator densities used in the experimental trials.
The general trends observed in the IG prey mortality over the days were as follows:
(a)
IG prey mortality was IG-predator dependent—high mortality at high IG predator density;
(b)
IG prey mortality was shared-prey-density dependent—low mortality at high shared-prey density;
(c)
IG prey mortality was habitat-condition dependent—high mortality in complex habitat condition.

3.1. Multiplicative Risk Model

The shared-prey mortality showed a similar trend as the (a) density and (b) habitat condition. The multiplicative risk model revealed that the expected mortality of the shared prey (both chironomid and mosquito) differed with the observed values significantly (Figure 3). The observed values were less than the expected values for multiple predator effects on shared prey mortality, suggesting the reduction in risk to predation. The consistency in the observed/expected (O/E) values reveal that, for all instances, the presence of IG prey reduced the mortality of the shared prey. The extent of this effect differed with the habitat condition, since the values of observed/expected (O/E) for open conditions were far less than the complex conditions all through the days and the prey–predator combinations (Figure 3). The t-values for the corresponding prey–predator combinations are shown in Table 4. The comparison of the effects of multiple predators in the presence and absence of the vegetations (simple versus complex conditions) revealed significant differences, as revealed through the one-tailed t-test (Table 4). Thus, the shared prey mortality under intraguild predation appears to be affected by the habitat conditions and the relative density of the IG predator (D. rusticus).

3.2. Clearance Rates

The clearance rates for the mosquito (Figure 4) and chironomid (Figure 5) exhibited differences owing to the predator density, the prey density and, above all, the habitat conditions. In all instances, the paired t-test showed significant (p < 0.05) differences between the simple and complex habitat conditions with reference to the clearance rates of the mosquito and the chironomid larvae as shared prey and the corresponding IG prey. The application of the logistic regression on the data on the clearance rate (CR) in the consecutive days revealed significant effects of the prey type, the predator density, the prey density and the habitat type. Prey consumption as a function of the predator density, prey density and habitat type following the GLM model was obtained as follows:
IG prey consumed (y) = 1/(1 + exp(−(−7.51 − 5.12 − 03* prey-type + 0.48 * Prey-density + 6.84 − 02 * Predator-density − 6.60 − 02 * Habitat)))
Here, except the prey type, all the other model parameters are significant at the p < 0.001 level (intercept = −7.509 ± 0.098; Wald χ2 = 5931.334; prey type = −0.005 ± 0.031; Wald χ2 = 0.027; prey density = 0.482 ± 0.032; Wald χ2 = 225.682; predator density = 0.068 ± 0.031; Wald χ2 = 4.808; habitat = −0.066 ± 0.031; Wald χ2 = 4.472).
As shown in Figure 4 and Figure 5, the CR declined uniformly for the mosquito as the shared prey and less uniformly for the chironomid larvae as the shared prey irrespective of the habitat conditions and the density of the prey and the predators. However, the distinction in the logistic regressions for the two prey types, chironomid larvae and the mosquito larvae, suggests differences in the prey preference by the water bug. In the case of the chironomid larvae as shared prey, the per capita consumption was comparatively lower than that of the mosquito larvae in all combinations. The IG prey consumption varied with the prey type, prey density and the predator density, which could be represented through the logistic regression as follows:
IG prey consumed(y) = 1/(1 + exp(−(−7.32 + 0.22* prey type − 0.11*prey density + 0.14* predator density + 0.11* habitat type)))
The Al parameters of the logistic regression model defining the IG prey consumption were significant at the p < 0.05 level (Intercept = −7.320 ± 0.167; Wald χ2 = 1931.877; prey type = −0.22 ± 0.054; Wald χ2 = 16.386 p < 0.0001; prey density = 0.106 ± 0.054; Wald χ2 = 3.878 p < 0.049; Predator density = 0.142 ± 0.054; Wald χ2 = 6.923 p < 0.0096; Habitat = 0.110 ± 0.054; Wald χ2 = 4.198 p < 0.04).
The consumption pattern of the IG prey seems to complement the shared prey consumption pattern in the clearance rate values. On the whole, the prey consumption pattern was dependent on the habitat type, prey and predator density for both the shared prey and the IG prey in the concerned system.

4. Discussion

The prey consumption by the IG predator (D. rusticus) varied with the habitat condition, prey species, prey density, predatory density and days of observation. In all instances, a gradual decline in the prey consumption was observed which was more prominent for the mosquito in comparison to the chironomid larvae. In situations where the predator is exposed to a similar prey type and density, a predator may exhibit a non-consumptive effect on the prey through alteration in the habitat quality. Variations in the prey availability with time may be reduced, and therefore the number of the prey consumed may vary accordingly. In case of the D. rusticus predation on the mosquito and the chironomid larvae, the per capita consumption for the first three days was similar to the observations made in earlier studies that used either the single prey [44,45] or IGP system [18,19]. In the case of the single prey experiments, the variations in the prey consumption over the successive days were known [45], although the density effects and the space effects of the predator were not observed. In the present instance, however, the shared prey and the IG prey consumption dwindled monotonically. Among the probable reasons, the changes in the predatory behavior of D. rusticus can be linked to the prey search time and yield in the prey. This appears to be similar to the prey searching in the crabs [52], where the habitat complexity induced alterations in the prey–predator interaction patterns. Following consumption of the prey for the first few days, a steady decline was observed, probably linked with the satiation of the water bug D. rusticus.
Considering the experiments being carried out in tubs that were large in size (62.2 × 62.2 × 29.2 cm3), the space available (80 L water) for the prey refuge was quite high. As a consequence, the search area of the predator was higher, and this may have led to reduced prey attack. A difference in the prey consumption in the two habitat conditions was prominent for the mosquito and the chironomid as the prey. The per capita prey consumption was always inclined towards the mosquitoes, irrespective of the habitat and the predator combinations. A consistent difference in the consumption of the mosquito and the chironomid larvae as prey was observed against the different habitat conditions. As prey, the chironomid and mosquito larvae exhibit contrasting behavior, with the mosquito larvae using more of the water column space, while the chironomid larvae exploit more of the benthic zone. Even if the biomass or the body length of the two preys were similar, the movement across the microcosm remained different, and this may have affected the prey searching and capture by the water bugs. From the results, it may be assumed that the capture of the chironomid prey was considerably easier than that of the mosquito prey. Previous observations [5,53,54,55] suggest that the preference for the chironomid larvae is lower than that for the mosquito larvae, reflected through the number of preys consumed by water bugs such as D. rusticus. Similarly, the number of chironomid larva consumed in a single day was considerably lower than the mosquito larvae consumed in the same time period. The effect of the habitat condition was similar for both preys, as reflected through the similar pattern of vulnerability to the predator D. rusticus. The decline in the prey consumption was less profound for the chironomid larvae, perhaps supporting the energy content factor for this prey. When comparing the chironomid larvae and the mosquito larvae of equal length, the biomass and, thus, the energy content of the chironomid larvae remain considerably higher. As a consequence, the predator achieves satiation earlier, consuming a lower number of prey and saving energy. On the whole, the differences in the energy content or the distribution along the surface, column or bottom layers of the freshwater can also contribute to the differences in the prey consumption by the predator.
Irrespective of the shared prey identity, the IG prey consumption in the habitat conditions varied in a similar pattern. For the open space, the consumption of the IG prey was higher than the complex habitat conditions.
The effects of the vegetation and other forms of habitat complexity on the prey mortality are well established for heteropteran [5,56] and odonate predators [6,57,58]. In most instances, the complexity of the habitats provided refuges for the predators and altered prey–predator interactions, resulting in deviation from the expected mortality values [12,52,59,60,61]. However, a variety of experiments have shown deviation in the foraging activity of the predators due to the presence of heterospecific or conspecific predators [62,63]. In all such instances, the observed mortality rate of the shared prey deviated from the expected values (assuming the multiplicative risk model or risk-of-predation model), indicating obvious interference among the predators. This is illustrated through the foraging behavior of the intertidal crab species against amphipod predation [14,64]. The mortality of the amphipod prey in the presence of the Carcinus maenas as the intermediate predator (IG prey) and Hemigrapsus sanguineus (top predators/IG predator) was found to be density dependent, as well as habitat-condition dependent. It was revealed that the presence of algae in the intertidal zones altered the predatory behavior of both the intertidal crab species reducing the mortality of the amphipods. On a broader scale, the mortality of the IG prey (C. maenas) was also observed to be density dependent. Irrespective of habitat conditions, the prey mortality was reduced by (1) change in the foraging activity of the IG prey with respect to the presence of the IG predator, which possibly was due to (2) increased vulnerability of the IG prey to the top predators when both were present together, and (3) the density reduction of intermediate predators. However, in the rocky areas, the effects were more pronounced than in algal-mat-dominated areas, suggesting that the behavioral alteration may be induced by the habitat conditions [14]. Similar to these observations in the present conditions, the habitat effects were more prominent, with a greater reduction in the prey consumption, in complex habitat conditions than in simple habitat conditions. It appears that the presence of vegetation spread over a larger area was more effective in reducing the contact between the prey (both IG prey and shared prey) with the IG predator. Furthermore, owing to the consumption of IG prey, the satiation factor of the IG predator may have reduced the hunting effect on the shared prey. It is imperative that the movement of the IG preys was reduced in the complex habitat condition, but the preys were free moving under simple habitat conditions and were more vulnerable to the IG predators.
Thus, it was apparent in the present experiment that the intraguild predation involving D. rusticus as the top predator and A. bouvieri as the IG prey influences the mortality of the shared prey (mosquito and chironomid) differentially with the habitat conditions. The shared prey and IG prey mortality was reduced due to complex habitat conditions, and the total predation rate dwindled with time. The consistent reduction in the prey consumption over time suggests that possible predators altered the foraging strategy as a consequence of multiple predator interference. If researchers extend these observations in field conditions, it may be expected that the presence of multiple predators will reduce the chances of successful regulation of mosquito prey. Thus, efforts should be taken to reduce the predatory interference and increase the density of intermediate predator to reduce the effects of the habitat conditions and the predator interference on the mortality of the target prey.
The use of the predatory insects as a means of regulating the mosquito prey has long been promoted through several theoretical and empirical studies. Among the predatory insects, the water bugs, dytiscid beetles, and odonata larvae qualify as probable candidates in the regulation of mosquitoes. However, being generalists in nature, many of these predators include chironomid larvae, tadpole and smaller instars of their own in the diet. As a result, the chances of indirect interactions increase immensely, resulting in the interference in the appropriate intervention of the mosquito population. Such indirect interactions pose a major concern in the regulation of the mosquitoes [65]. In the present instance, we explored the indirect interactions with D. rusticus as the key species. Earlier studies using the density factors and the predator identity proved to alter the predatory efficacy of D. rusticus and other water bugs. In this study, a long-term observation showed considerable fluctuation in the shared prey consumption, as well as the IG prey consumption, though the impact was higher for the mosquitoes than the chironomid as prey. The risk to predation was reduced for both mosquito and chironomid larvae of all combinations, where the observed pAB was lower than the expected pAB based on the multiplicative risk model. Among the possible reasons for the reduced predatory activity may be the predator satiation and the interaction between the guild members. Habitat size remained considerably larger, simulating natural conditions, which may have enabled the prey and predators to utilize the refuge well and reduce the chances of interactions. Thus, under natural conditions where multiple predators will be a part of intraguild predation, the effective mortality of the shared prey will be dampened as a consequence, leading to increased pupal productivity. However, factors such as the density of the interacting species, taxonomic identity and habitat conditions may induce a change in the pupal productivity of the mosquito and chironomid prey. The prospective interactions among the predators and the prey may show considerable variations in the regulation of the target prey if the predators are included in the biological regulation of the chironomid and the mosquito prey.

Author Contributions

Conceived and designed by G.A., G.K.S. and S.B.; executed by S.B. and D.S.; data collection and analysis S.B. and G.A.; compilation by S.B. and G.A. All authors have read and agreed to the published version of the manuscript.

Funding

This research received no external funding.

Data Availability Statement

The data used in this article can be provided upon authentic and reasonable request.

Acknowledgments

We acknowledge the Head of the Department of Zoology University of Calcutta for the facilities provided, including DST-FIST, UGC, and DRS-SAP.

Conflicts of Interest

The authors declare no conflict of interest.

References

  1. Wissinger, S.A. Niche overlap and the potential for competition and intraguild predation between size-structured populations. Ecology 1992, 73, 1431–1444. [Google Scholar] [CrossRef]
  2. Wissinger, S.A.; McGrady, J. Intraguild predation and competition between larval dragonflies: Direct and indirect effects on shared prey. Ecology 1993, 74, 207–218. [Google Scholar] [CrossRef]
  3. Crumrine, P.W. Size structure and substitutability in an odonate intraguild predation system. Oecologia 2005, 145, 132–139. [Google Scholar] [CrossRef]
  4. Denno, R.F.; Finke, D.L.; Langellotto, G.A. Direct and indirect effects of vegetation structure and habitat complexity on predator-prey and predator-predator interactions. In Ecology of Predator-Prey Interactions; Barbosa, P., Castellanos, I., Eds.; Oxford University Press: London, UK, 2005; pp. 211–239. [Google Scholar]
  5. Saha, N.; Aditya, G.; Saha, G.K. Habitat complexity reduces vulnerability of preys: An experimental analysis using aquatic insect predators and dipteran immature. J. Asia-Pac. Entomol. 2009, 12, 233–239. [Google Scholar] [CrossRef]
  6. Flynn, K.E.; Moon, D.C. Effects of habitat complexity, prey type, and abundance on in traguild predation between larval odonates. Hydrobiologia 2011, 675, 97–104. [Google Scholar] [CrossRef]
  7. Gagnon, A.-È.; Heimpel, G.E.; Brodeur, J. The ubiquity of intraguild predation among predatory arthropods. PLoS ONE 2011, 6, e28061. [Google Scholar] [CrossRef] [PubMed]
  8. Jana, D.; Bairagi, N. Habitat complexity, dispersal and metapopulations: Macroscopic study of a predator-prey system. Ecol. Complex. 2014, 17, 131–139. [Google Scholar] [CrossRef]
  9. Crowder, L.B.; Cooper, W.E. Habitat structure complexity and the interaction be tween Bluegills and their prey. Ecology 1982, 63, 1802–1813. [Google Scholar] [CrossRef]
  10. Summerson, H.C.; Peterson, C.H. Role of predation in organizing benthic communities of a temperate-zone seagrass bed. Mar. Ecol. Prog. Ser. 1984, 15, 63–77. [Google Scholar] [CrossRef]
  11. Hughes, A.R.; Gabrowsky, J.H. Habitat context influences predator interference interactions and the strength of resource partitioning. Oecologia 2006, 146, 256–264. [Google Scholar] [CrossRef]
  12. Finke, D.L.; Denno, R.F. Intraguild predation diminished in complex habitats: Implications for top-down suppression of prey populations. Ecology 2002, 83, 643–652. [Google Scholar] [CrossRef]
  13. Siddon, C.E.; Witman, J.E. Behavioral indirect interactions: Multiple predator effects and prey switching in rocky subtidal. Ecology 2004, 85, 2938–2945. [Google Scholar] [CrossRef]
  14. Griffen, B.D.; Byers, J.E. Intraguild predation reduces redundancy of predator species in multiple predator assemblage. J. Anim. Ecol. 2006, 75, 959–966. [Google Scholar] [CrossRef]
  15. Buxton, M.; Cuthbert, R.N.; Dalu, T.; Nyamukondiwaa, C.; Wassermana, R.J. Predator density modifies mosquito regulation in increasingly complex environment. Pest. Manag. Sci. 2020, 76, 2079–2086. [Google Scholar] [CrossRef] [PubMed]
  16. De Roy, E.M.; Scott, R.; Hussey, N.E.; Maclsaac, H.J. Density dependence mediates the ecological impact of an invasive fish. Divers. Distrib. 2020, 26, 867–880. [Google Scholar] [CrossRef]
  17. Vance-Chalcraft, H.D.; Soluk, D.A. Multiple predator effects result in risk reduction for prey across multiple prey densities. Oecologia 2005, 144, 472–480. [Google Scholar] [CrossRef]
  18. Brahma, S.; Sharma, D.; Kundu, M.; Saha, N.; Aditya, G.; Saha, G.K. Mosquito prey vulnerability in intraguild predation between Ranatra filiformis and Anisops bouvieri: Implications in biological control. Proc. Zool. Soc. 2015, 68, 36–44. [Google Scholar] [CrossRef]
  19. Brahma, S.; Sharma, D.; Kundu, M.; Saha, N.; Saha, G.K.; Aditya, G. Intraguild predation in Heteroptera: Effects of density and predator identity on dipteran prey. Neotrop. Entomol. 2015, 44, 374–384. [Google Scholar] [CrossRef]
  20. Fischer, S.; Marinone, M.C.; Fontanarrosa, M.S.; Nieves, M.; Schweigmann, N. Urban rain pools: Seasonal dynamics and entomofauna in a park of Buenos Aires. Hydrobiologia 2000, 444, 45–63. [Google Scholar] [CrossRef]
  21. Bambaradeniya, C.N.B.; Edirisinghe, J.P.; Silva, D.N.; Gunatilleke, C.V.S.; Ranawana, K.B.; Wijekoon, S. Biodiversity associated with rice agro-ecosystem in Sri Lanka. Biodivers. Conserv. 2004, 13, 1715–1753. [Google Scholar] [CrossRef]
  22. Das, P.K.; Sivagnaname, N.; Amalraj, D.D. Population interactions between Culex vishnui mosquitoes and their natural enemies in Pondicherry, India. J. Vector. Ecol. 2006, 31, 84–88. [Google Scholar] [CrossRef] [PubMed]
  23. Banerjee, S.; Aditya, G.; Saha, N.; Saha, G.K. An assessment of macroinvertebrate as semblages in mosquito larval habitats –space and diversity relationship. Environ. Monit. Assess. 2010, 168, 597–611. [Google Scholar] [CrossRef]
  24. Urcola, J.I.; Fischer, S. Seasonal and environmental variables related to the abundance of immature mosquitoes in rain-pools of a peri-urban park of Buenos Aires (Argentina). J. Med. Entomol. 2019, 56, 716–724. [Google Scholar] [CrossRef] [PubMed]
  25. Kundu, M.; Sharma, D.; Brahma, S.; Pramanik, S.; Saha, G.K.; Aditya, G. Insect predators of mosquitoes of rice fields: Portrayal of indirect interactions with alternative prey. J. Entomol. Zool. Stud. 2014, 2, 97–103. [Google Scholar]
  26. Polis, G.A.; Myers, C.A.; Holt, R.D. The ecology and evolution of intraguild predation: Potential competitors that eat each other. Annu. Rev. Ecol. Evol. Syst. 1989, 20, 297–330. [Google Scholar] [CrossRef]
  27. Polis, G.A.; Holt, R.D. Intraguild predation: The dynamics of complex trophic interacttion. Trends Ecol. Evol. 1992, 7, 151–154. [Google Scholar] [CrossRef]
  28. Holt, R.D.; Polis, G.A. A theoretical framework for intraguild predation. Am. Nat. 1997, 149, 745–764. [Google Scholar] [CrossRef]
  29. Arim, M.; Marquet, P.A. Intraguild predation: A widespread interaction related to species biology. Ecol. Lett. 2004, 7, 557–564. [Google Scholar] [CrossRef]
  30. Brahma, S.; Aditya, G.; Sharma, D.; Saha, N.; Kundu, M.; Saha, G.K. Influence of density on intraguild predation of aquatic hemipteran (Heteroptera): Implications in biological control of mosquito. J. Entomol. Acarol. Res. 2014, 46, 1977. [Google Scholar] [CrossRef]
  31. Diehl, S. Foraging efficiency of three freshwater fishes: Effects of structural complexity and light. Oikos 1988, 53, 207–214. [Google Scholar] [CrossRef]
  32. Hurst, T.P.; Kay, B.H.; Brown, M.D.; Ryan, P.A. Laboratory evaluation of the effect of alternative prey and vegetation on predation of Culex annulirostris immatures by Australian native fish species. J. Am. Mosq. Control Assoc. 2006, 22, 412–417. [Google Scholar] [CrossRef] [PubMed]
  33. Kopp, K.; Wachlevski, M.; Eterovick, P.C. Environmental complexity reduces tadpole predation by water bugs. Can. J. Zool. 2006, 84, 136–140. [Google Scholar] [CrossRef]
  34. Babbitt, K.J.; Jordan, F. Predation on Bufo terrestris tadpoles: Effects of cover and predator identity. Copeia 1996, 1996, 485–488. [Google Scholar] [CrossRef]
  35. Soluk, D.A.; Collins, N.C. Synergistic interactions between fish and stone flies-facilitation and interference among stream predators. Oikos 1988, 52, 94–100. [Google Scholar] [CrossRef]
  36. Soluk, D.A. Multiple predator effects: Predicting combined functional response of stream fish and invertebrate predators. Ecology 1993, 74, 219–225. [Google Scholar] [CrossRef]
  37. Sih, A.; Englund, G.; Wooster, D. Emergent impacts of multiple predators on prey. Trends Ecol. Evol. 1998, 13, 350–355. [Google Scholar] [CrossRef]
  38. Crumrine, P.W.; Crowley, P.H. Partitioning components of risk reduction in a dragonfly-fish intraguild predation system. Ecology 2003, 84, 1588–1597. [Google Scholar] [CrossRef]
  39. Nishi, R.; Venkatesan, P. Predation ingestion rate and its bearing on prey death rate in Anisops bouvieri Kirkaldy. J. Entomol. Res. (New Delhi) 1989, 13, 140–145. [Google Scholar]
  40. Victor, T.J.; Reuben, R. Population dynamics of mosquito immatures and the successsion in abundance of aquatic insects in rice fields in Madurai, South India. Indian J. Malariol. 1999, 36, 19–32. [Google Scholar]
  41. Sunish, I.P.; Reuben, R. Factors influencing the abundance of Japanese encephalitis vectors in rice fields in India–II. Biotic. Med. Vet. Entomol. 2002, 16, 1–9. [Google Scholar] [CrossRef]
  42. Aditya, G.; Bhattacharya, S.; Kundu, N.; Saha, G.K.; Raut, S.K. Predatory efficiency of the water bug Sphaerodema annulatum on mosquito larvae (Culex quinquefasciatus) and its effect on adult emergence. Bioresour. Technol. 2004, 95, 169–172. [Google Scholar] [CrossRef] [PubMed]
  43. Aditya, G.; Bhattacharya, S.; Kundu, N.; Saha, G.K. Frequency dependent prey selection of predacious water-bugs on Armigeris subalbatus immature. J. Vector Borne Dis. 2005, 42, 9–14. [Google Scholar] [PubMed]
  44. Saha, N.; Aditya, G.; Bal, A.; Saha, G.K. A comparative study of predation of three aquatic hemipteran bugs on Culex quinquefasciatus larvae. Limnology 2007, 8, 73–80. [Google Scholar] [CrossRef]
  45. Saha, N.; Aditya, G.; Bal, A.; Saha, G.K. Comparative study of functional response of common Hemipteran bugs of East Calcutta wetlands, India. Int. Rev. Hydrobiol. 2007, 92, 242–257. [Google Scholar] [CrossRef]
  46. Mogi, M.; Memah, V.; Miyagi, I.; Toma, T.; Sembel, D.T. Mosquito(Diptera: Culicidae) and predator abundance in irrigated and rain-fed rice-fields in North-Sulawesi, Indonesia. J. Med. Entomol. 1995, 32, 361–367. [Google Scholar] [CrossRef] [PubMed]
  47. Shaalan, E.A.-S.; Canyon, D.V. Aquatic insect predators and mosquito control. Trop. Biomed. 2009, 26, 223–261. [Google Scholar]
  48. Juliano, S.A. Species interactions among larval mosquitoes: Context dependence across habitat gradients. Ann. Rev. Entomol. 2009, 54, 37–56. [Google Scholar] [CrossRef]
  49. Gilbert, J.J.; Burns, C.W. Some observations on the diet of the Backswimmer Anisops wakefieldi(Hemiptera: Notonectidae). Hydrobiologia 1999, 412, 111–118. [Google Scholar] [CrossRef]
  50. Hampton, S.E. Habitat overlap of enemies: Temporal patterns and the role of spatial complexity. Oecologia 2004, 138, 475–484. [Google Scholar] [CrossRef]
  51. Zar, J.H. Biostatistical Analysis; Pearson Education (Singapore) Pte. Ltd. New Delhi (Indian Branch): New Delhi, India, 1999; 667p. [Google Scholar]
  52. Warfe, D.M.; Barmuta, L.A. Habitat structural complexity mediates food web dynamics in a freshwater macrophyte community. Oecologia 2006, 150, 141–154. [Google Scholar] [CrossRef]
  53. Saha, N.; Aditya, G.; Bal, A.; Saha, G.K. Light and habitat structure influences predation of Culex quinquefasciatus larvae by the water bugs (Hemiptera: Heteroptera). Insect Sci. 2008, 15, 461–469. [Google Scholar]
  54. Saha, N.; Aditya, G.; Saha, G.K. Prey preferences of aquatic insects: Potential imply cations for the regulation of wetland mosquitoes. Med. Vet. Entomol. 2014, 28, 1–9. [Google Scholar] [CrossRef]
  55. Saha, N.; Kundu, M.; Saha, G.K.; Aditya, G. Alternative prey influence the predation of mosquito larvae by three water bug species (Heteroptera: Nepidae). Limnol. Rev. 2020, 20, 173–184. [Google Scholar] [CrossRef]
  56. Fischer, S.; Zanotti, G.; Castro, A.; Quiroga, L.; Vargas, D.V. Effect of habitat complexity on the predation of Buenoa fuscipennis (Heteroptera: Notonectidae) on mosquito imamture stages and alternative prey. J. Vector. Ecol. 2013, 38, 215–223. [Google Scholar] [CrossRef] [PubMed]
  57. Janssen, A.; Sabelis, M.W.; Magalhaes, S.; Montserrat, M.; der Hammen, T.V. Habitat structure affects intraguild predation. Ecology 2007, 88, 2713–2719. [Google Scholar] [CrossRef] [PubMed]
  58. Fulan, J.Â.; Almeida, S.C. Effect of the spatial heterogeneity on the predation of Scinax fuscovarius and Physalaemus cuvieri tadpoles by Odonata larvae. Acta Sci. Biol. Sci. 2010, 32, 121–124. [Google Scholar] [CrossRef]
  59. Swisher, B.J.; Soluk, D.A.; Wahl, D.H. Non-additive predation in littoral habitats: Influences of habitat complexity. Oikos 1998, 81, 30–37. [Google Scholar] [CrossRef]
  60. Hossie, T.J.; Murray, D.L. You can’t run but you can hide: Refuge use in frog tadpoles elicits density-dependent predation by dragonfly larvae. Oecologia 2010, 163, 395–404. [Google Scholar] [CrossRef]
  61. Anderson, T.L.; Semlitcsh, R.D. Top predator and habitat complexity alter an intraguild predation module in pond communities. J. Anim. Ecol. 2016, 85, 548–558. [Google Scholar] [CrossRef]
  62. Eklov, P.; van Kooten, T. Facilitation among piscivorous predators: Effects of prey habitat use. Ecology 2001, 82, 2486–2494. [Google Scholar] [CrossRef]
  63. Grabowsky, J.H.; Hughes, A.R.; Kimbro, D.L. Habitat complexity influences cascading effects of multiple predators. Ecology 2008, 89, 3413–3422. [Google Scholar] [CrossRef] [PubMed]
  64. Griffen, B.D.; Byers, J.E. Partitioning mechanisms of predator interference in different habitats. Oecologia 2006, 146, 608–614. [Google Scholar] [CrossRef] [PubMed]
  65. Dambach, P. The use of aquatic predators for larval control of mosquito disease vectors. Biol. Control 2020, 150, 104357. [Google Scholar] [CrossRef]
Figure 1. The number (mean ± SE) of shared prey mosquito larva and larva of chironomid midges consumed by IG predator D. rusticus and IG prey A. bouvieri in combinations of 2 different predator densities (2 and 4) at 4 different conditions (n = 6 trials per day for 9 consecutive days). (A,E) Prey density, 50; habitat, simple. (B,F) Prey density, 50; habitat, complex. (C,G) Prey density, 200; habitat, simple. (D,H) Prey density, 200; habitat, complex.
Limnolrev 23 00001 g001
Figure 2. The number (mean + SE) of IG prey (A. bouvieri) consumed at 2 different predator densities (2 and 4) by IG predator D. rusticus when shared prey is mosquito larva and larva of chironomid midges for 9 consecutive days, at 4 conditions. (A,E) Prey density, 50; habitat, simple. (B,F) Prey density, 50; habitat, complex. (C,G) Prey density, 200; habitat, simple. (D,H) Prey density, 200; habitat, complex.
Limnolrev 23 00001 g002
Figure 3. Observed/expected (O/E) value in simple (open bar) and complex habitat (shaded bar) for mosquito larvae (A-D) and chironomid larvae (A1-D1) at 4 different combinations of predators and prey. (A,A1) Low predator density (2) + low prey density (50). (B,B1) Low predator density (2) + high prey density (200). (C,C1) High predator density (4) + low prey density (50). (D,D1) High predator density (4) + high prey density (200). S/C value describes the risk to predation index, where S/C > 1 means risk enhancement in simple habitat, and S/C < 1 means risk enhancement in complex habi-tat.
Limnolrev 23 00001 g003
Figure 4. Clearance rate (CR) values in simple (filled bar) and complex habitat (clear bar) at 2 different predator densities (2 and 4 individuals, 2 TP and 4TP) by IG predator D. rusticus in the presence of 2 different densities of shared prey (50 and 200). (A) Mosquito larvae consumed and (B) IG prey A. bouvieri consumed when shared prey is mosquito larvae for 9 consecutive days.
Limnolrev 23 00001 g004aLimnolrev 23 00001 g004b
Figure 5. Clearance rate (CR) values in simple (grey bar) and complex habitat (white bar) at 2 different predator densities (2 and 4) by IG predator D. rusticus in the presence of 2 different densities of shared prey (50 and 200): (A) chironomid larvae consumed and (B) A. bouvieri consumed when shared prey is chironomid larvae for 9 consecutive days.
Limnolrev 23 00001 g005
Table 1. Outline of the experimental design for determining the long-term effect on IGP involving the heteropteran predators and dipteran prey.
ParametersDetailsRemarks
IG predatorDiplonychus rusticusDensity 2 (low) and 4 (high) individuals
IG preyAnisops bouvieriDensity 10 individuals
Shared preyInstar IV larvae of Culex quinquefasciatus and Chironomid midgeDensity of 50 and 200 for each prey species respectively
IG predator: IG prey2:10 and 4:10Low and high predator density
HabitatOpen and complexSimple and complex conditions
DaysConsecutive 9 daysLong term
Replicates6 × 2 prey densities per shared prey type per IG predator density per habitat per day864 replicates
Prey consumptionNoted after 24 h for 9 daysShared prey and IG prey replenished everyday
AnalysisFactorial ANOVA on the predation data and multiplicative risk analysis [17], followed by post hoc multiple comparison tests; use of clearance rate [49,50] as a composite indicator of predation. Multiplicative risk analysis for mosquito and chironomid midgesFor both IG prey and shared prey
Table 2. The results of repeated-measures ANOVA on shared prey killed, using days (nine consecutive days; nine levels) as within-subject factor and prey and predator density (two levels each) and habitat conditions (two levels) as between-subject factors, against mosquito larvae (A) and chironomid larvae (B) as shared prey. The figures in bold indicate significance at p < 0.05 level, and the size effect is represented through the partial η2.
A. Mosquito Larvae as Shared PreyB. Chironomid Larvae as Shared Prey
Within-Subject Effects (Sphericity Assumed)Within-Subject Effects (Sphericity Assumed)
SourceSum of SquaresdfMean SquareFPartial η2SourceSum of SquaresdfMean SquareFPartial η2
Days14,395.4181799.43179.730.82Days5714.968714.3771.350.64
Days * predator density (PRDD)50.3386.290.630.02Days * predator density (PRDD)510.99863.876.380.14
Days * prey density (PRD)2708.758338.5933.820.46Days * prey density (PRD)2653.698331.7133.130.45
Days * habitat (HAB)567.41870.937.080.15Days * habitat (HAB)45.2185.650.560.01
Days * PRDD * PRD20.9982.620.260.01Days * PRDD * PRD322.92840.364.030.09
Days * PRDD * HAB4285.250.520.01Days * PRDD * HAB67.888.470.850.02
Days * PRD * HAB326.08840.764.070.09Days * PRD * HAB13.8881.730.170
Days * PRDD * PRD * HAB11.2581.410.140Days * PRDD * PRD * HAB60.0787.510.750.02
Error (days)3203.7832010.01 Error (days)3204.0432010.01
Within-Subject ContrastsWithin-Subject Contrasts
SourceSum of SquaresdfMean SquareFPartial η2SourceSum of SquaresdfMean SquareFPartial η2
Days14,226.67114226.671268.70.969Days4774.0514774.05377.240.9
Days * predator density (PRDD)16.05116.051.430.035Days * predator density (PRDD)225.571225.5717.820.31
Days * prey density (PRD)2506.9312506.93223.560.848Days * prey density (PRD)2405.3612405.36190.070.83
Days * habitat (HAB)411.781411.7836.720.479Days * habitat (HAB)5.8715.870.460.01
Days * PRDD * PRD1.7511.750.160.004Days * PRDD * PRD150.331150.3311.880.23
Days * PRDD * HAB14.03114.031.250.03Days * PRDD * HAB10.27110.270.810.02
Days * PRD * HAB0.0110.0100Days * PRD * HAB0.2310.230.020
Days * PRDD * PRD * HAB0.0610.060.010Days * PRDD * PRD * HAB0.1410.140.010
Error (days)448.544011.21 Error (days)506.214012.66
Between-Subjects EffectBetween Subjects Effect
SourceSum of SquaresdfMean SquareFPartial η2SourceSum of SquaresdfMean SquareFPartial η2
Predator density (PRDD)901.331901.3351.560.56Predator density (PRDD)978.011978.01140.40.78
Prey density (PRD)69,464.08169464.083973.790.99Prey density (PRD)71353.48171353.4810,243.491
Habitat (HAB)2987.2612987.26170.890.81Habitat (HAB)778.71778.7111.790.74
PRDD * PRD166.261166.269.510.19PRDD * PRD176.331176.3325.310.39
PRDD * HAB24.08124.081.380.03PRDD * HAB78.37178.3711.250.22
PRD * HAB271271.540.04PRD * HAB131.121131.1218.820.32
PRDD * PRD * HAB0.7510.750.04 PRDD * PRD * HAB73.34173.3410.530.21
Error699.22 Error278.63406.97
Multivariate Test (Wilk’s Lambda)Multivariate Test (Wilk’s Lambda)
EffectValueFHypothesis dfError dfPartial η2EffectValueFHypothesis dfError dfPartial η2
Days0.02164.748330.98Days0.0670.778330.94
Days * predator density (PRDD)0.880.568330.12Days * predator density (PRDD)0.367.188330.64
Days * prey density (PRD)0.1134.458330.89Days * prey density (PRD)0.1133.598330.89
Days * habitat (HAB)0.415.978330.59Days * habitat (HAB)0.870.648330.13
Days * PRDD * PRD0.920.378330.08Days * PRDD * PRD0.494.238330.51
Days * PRDD * HAB0.880.558330.12Days * PRDD * HAB0.860.698330.14
Days * PRD * HAB0.435.458330.57Days * PRD * HAB0.960.188330.04
Days * PRDD * PRD * HAB0.950.28330.05Days * PRDD * PRD * HAB0.81.018330.2
* It means interaction.
Table 3. The results of repeated-measures ANOVA on IG prey killed, using days (nine consecutive days; nine levels) as within-subject factor and prey and predator density (two levels each) and habitat conditions (two levels) as between-subject factors, against mosquito larvae (A) and chironomid larvae (B) as shared prey.
A. Mosquito Larvae as Shared PreyB. Chironomid Larvae as Shared Prey
Within-Subject Effects (Sphericity Assumed)Within-Subject Effects (Sphericity Assumed)
SourceSum of SquaresDfMean SquareFPartial η2SourceSum of SquaresdfMean SquareFPartial η2
Days399.83849.9846.020.54Days566870.7573.440.65
Days * predator density (PRDD)2.0580.260.240.01Days * predator density (PRDD)3.5880.450.460.01
Days * prey density (PRD)27.8883.483.210.07Days * prey density (PRD)19.2482.412.50.06
Days * habitat (HAB)0.7580.090.090.002Days * habitat (HAB)9.9981.251.30.03
Days * PRDD * PRD9.3581.171.080.03Days * PRDD * PRD1.7180.210.220.01
Days * PRDD * HAB0.6780.080.080.002Days * PRDD * HAB0.9680.120.120
Days * PRD * HAB1.6380.20.190.005Days * PRD * HAB1.2580.160.160
Days * PRDD * PRD * HAB1.6680.210.190.005Days * PRDD * PRD * HAB1.6780.210.220.01
error (days)347.523201.09 error (days)308.263200.96
Within-Subject ContrastsWithin-Subject Contrasts
SourceSum of SquaresdfMean SquareFPartial η2SourceSum of SquaresdfMean SquareFPartial η2
Days358.421358.42356.440.9Days562.681562.68653.490.94
Days * predator density (PRDD)1.0111.011.010.02Days * predator density (PRDD)2.6312.633.050.07
Days * prey density (PRD)15.61115.6115.520.28Days * prey density (PRD)17.27117.2720.050.33
Days * habitat (HAB)0.0310.030.030Days * habitat (HAB)5.2515.256.10.13
Days * PRDD * PRD2.1112.112.10.05Days * PRDD * PRD0.1310.130.150
Days * PRDD * HAB0.4510.450.450.01Days * PRDD * HAB0.0610.060.070
Days * PRD * HAB0.7310.730.730.02Days * PRD * HAB0.0210.020.020
Days * PRDD * PRD * HAB0.6710.670.670.02Days * PRDD * PRD * HAB0.9810.981.130.03
error (days)40.22401.01 error (days)34.44400.86
Between-Subjects EffectBetween-Subjects Effect
SourceSum of SquaresdfMean SquareFPartial η2SourceSum of SquaresdfMean SquareFPartial η2
Predator density (PRDD)13.37113.374.550.1Predator density (PRDD)18.75118.758.580.18
Prey density (PRD)29.04129.049.890.2Prey density (PRD)11.34111.345.190.11
Habitat (HAB)6.7516.752.30.05Habitat (HAB)11.34111.345.190.11
PRDD * PRD1.5611.560.530.01PRDD * PRD1.1211.120.510.01
PRDD * HAB0.3310.330.110PRDD * HAB1.1211.120.510.01
PRD * HAB0.0410.040.010PRD * HAB2.0812.080.950.02
PRDD * PRD * HAB0.0110.00900PRDD * PRD * HAB0.0810.080.040
Error117.48402.94 Error87.41402.19
Multivariate Test (Wilk’s Lambda)Multivariate Test (Wilk’s Lambda)
EffectValueFHypothesis dfError dfPartial η2EffectValueFHypothesis dfError dfPartial η2
Days0.0847.498330.92Days0.0491.588330.96
Days * predator density (PRDD)0.940.278330.06Days * predator density (PRDD)0.850.738330.15
Days * prey density (PRD)0.612.598330.39Days * prey density (PRD)0.573.098330.43
Days * habitat (HAB)0.980.18330.02Days * habitat (HAB)0.711.678330.29
Days * PRDD * PRD0.830.858330.17Days * PRDD * PRD0.930.298330.07
Days * PRDD * HAB0.980.078330.02Days * PRDD * HAB0.970.128330.03
Days * PRD * HAB0.960.178330.04Days * PRD * HAB0.970.148330.03
Days * PRDD * PRD * HAB0.960.178330.04Days * PRDD * PRD * HAB0.910.48330.09
* It means interaction.
Table 4. The results of t-test carried out to judge the differences between simple and complex habitat conditions (A) and the differences between observed and expected values (B) of the model parameters for each day. All the values were significant at the p < 0.05 level. M, mosquito larvae; C, chironomid larvae; S, simple habitat; C, complex habitat.
A.
Shared PreyPredatory DensityPrey DensityDays
D1D2D3D4D5D6D7D8D9
M2501.60−0.21−4.43−4.18−5.000.04−4.550.07−0.93
2200−11.44−9.58−13.15−6.88−8.82−3.99−18.34−7.07−12.08
450−0.83−0.69−0.95−10.32−4.09−2.92−3.34−15.37−7.53
4200−31.58−20.53−14.63−18.61−20.25−22.08−13.47−47.26−7.36
C2500.770.05−10.37−9.13−0.11−0.47−1.091.851.43
2200−10.76−23.14−14.46−10.51−6.85−14.84−11.49−12.36−7.97
450−0.89−6.29−1.200.620.61−1.25−1.06−3.64−2.13
4200−23.87−9.21−14.34−53.24−10.16−6.97−9.74−13.53−5.38
B.
Shared PreyPredatory DensityPredatory DensityHabitatDays
D1D2D3D4D5D6D7D8D9
M250S−13.96−15.57−12.87−35.79−20.59−19.54−44.37−26.40−90.41
250C−8.89−7.15−8.14−7.51−8.88−12.95−26.76−18.14−23.19
2200S−26.01−44.48−55.88−31.32−37.10−54.00−56.41−68.70−59.83
2200C−17.69−16.27−31.33−36.27−20.48−15.99−46.64−34.87−26.33
450S−18.66−18.99−22.06−37.20−23.25−22.90−22.32−22.99−84.63
450C−8.55−11.84−9.93−9.52−12.31−13.96−55.29−1.85−4.77
4200S−36.55−110.27−127.77−107.96−80.31−72.83−69.03−175.05−95.50
4200C−4.94−6.71−9.81−10.84−18.22−31.80−12.43−65.63−14.27
C250S−13.96−31.59−111.96−40.64−64.05−32.20−48.85−33.89−25.57
250C−30.52−29.80−22.49−30.34−24.43−56.95−35.75−20.26−47.04
2200S−29.75−65.17−33.73−75.55−82.65−46.17−35.72−33.58−57.09
2200C−10.77−23.17−12.71−21.81−13.87−55.00−13.67−14.82−14.43
450S−52.21−48.76−48.85−42.79−25.35−53.83−49.84−55.50−48.59
450C−17.35−31.61−43.71−25.12−25.41−32.98−34.56−38.47−32.07
4200S−58.66−34.62−83.69−96.11−37.61−96.20−92.02−116.45−84.37
4200C−12.31−13.86−26.90−39.60−22.41−21.74−25.93−50.08−25.90
Disclaimer/Publisher’s Note: The statements, opinions and data contained in all publications are solely those of the individual author(s) and contributor(s) and not of MDPI and/or the editor(s). MDPI and/or the editor(s) disclaim responsibility for any injury to people or property resulting from any ideas, methods, instructions or products referred to in the content.

