Article

Comparison of Supercritical Fluid Chromatography Hyphenated to an Ultraviolet Detector and Gas Chromatography Hyphenated to a Flame Ionization Detector for Qualitative and Quantitative Analysis of Citrus Essential Oils

1
Institut Supérieur International Parfum Cosmétique Arômes, Plateforme Scientifique, ISIPCA, 34-36 rue du parc de Clagny, 78000 Versailles, France
2
Laboratoires CLARINS, Pôle Recherche Actifs, 5 rue Ampère, CEDEX, 95300 Cergy-Pontoise, France
3
CNRS, Institut de Chimie des Substances Naturelles (ICSN), UPR 2301, Université Paris-Saclay, Avenue de la Terrasse, 91198 Gif-sur-Yvette, France
4
Chiral Technologies Europe, Parc d’Innovation, 160 Bd. Gonthier d’Andernach, CS 80140, CEDEX, 67404 Illkirch, France
5
Laboratoire de Chimie Moléculaire (LCM) CNRS, Ecole Polytechnique, Institut Polytechnique de Paris, Route de Saclay, 91120 Palaiseau, France
*
Author to whom correspondence should be addressed.
Current address: SISLEY, Pôle Recherche et Évaluation, 32, Avenue des Béthunes—CS30003—SAINT-OUEN L’AUMÔNE, CEDEX, 95067 Cergy-Pontoise, France.
Separations 2022, 9(7), 183; https://doi.org/10.3390/separations9070183
Submission received: 15 May 2022 / Revised: 7 July 2022 / Accepted: 9 July 2022 / Published: 20 July 2022

Abstract

:
A comparison between the classical gas chromatography (GC) technique with supercritical fluid chromatography (SFC) technology was performed using an essential oil of Citrus limon (lemon) as a model, considering its wide use in the cosmetic world. For the qualitative part, the signal annotation was achieved by mass spectrometry using either an electron ionization (EI) or an atmospheric pressure photoionization (APPI) source. For the quantitative part, GC was hyphenated to a flame ionization detector (GC-FID) and SFC to an ultraviolet detector (SFC-UV). The assay of the major component of citrus oil, i.e., limonene, was carried out by SFC-UV. The similar results obtained between GC-FID and SFC-UV allows SFC-UV to be considered as an alternative to GC-FID for Citrus oil characterization. Then, analyses of an essential oil collection from Citrus fruits were achieved to confirm the potential use of SFC-UV for oil classification in the context of quality control of raw materials in cosmetics.

1. Introduction

In a context where consumers are claiming natural and environmentally friendly products, the chemical industry must adapt and move towards greener technologies, whether in manufacturing or analysis. Gas chromatography (GC) coupled with mass spectrometry (MS) is currently the most popular and efficient technique for the analysis of the volatile part of essential oils (EOs), which are of major interest in perfumery [1]. In this study, we evaluated the analytical performance of the SFC-UV on essential oils in order to compare it to this reference method. Essential oils are mainly constituted of terpenoids, including monoterpenes (e.g., α-pinene, β-pinene, and limonene), oxygenated monoterpenes (e.g., neral and geranial), and sesquitepernes (e.g., bisabolene, caryophyllene). These compound classes are highly abundant in Citrus essential oils [2], whose market size was estimated to be USD 6.31 billion in 2018 [3].
EOs of the Citrus genus are contained in the epicarp of the plant, and their composition is of high importance for their olfactory quality. Citrus limon (lemon) is one of the most exploited fruits for EO, with a market valued at USD 1.14 billion in 2021. Lemon EO is known to be lipolytic, antiseptic and cleansing, and nerve calming. It also aids with digestion and regulates circulation. Citrus reticulata (mandarin) EO is known to show calming, relaxing, antispasmodic, circulatory, slightly antiseptic, and anti-fungal effects. Citrus sinensis L. (sweet orange) EO is expected to help calm nervousness, anxiety, and insomnia. Citrus paradisi (grapefruit) EO may balance mood, decrease blood pressure, and relieve stress, and exhibits antibacterial and antimicrobial properties. Finally Citrus bergamia (bergamot) EO may show calming and purifying properties. All these EOs are mainly composed of limonene, up to 90%, and modern analytical approaches are required to distinguish them for batch control, for example. The traditional way to extract Citrus EOs is by cold pressing using the fruit peels. It is one of the most widely used olfactory families in perfumery. Citrus fruits are at the origin of “Eaux de Cologne” [4], including first “Eau de Cologne”, made by Roger & Gallet, dating back to 1806. Of course, Citrus fragrances often include more than one Citrus fruit, as in Hermès’ “L’Eau des Merveilles”, or in Lancôme’s “Ô de Lancôme”, where the top notes combine lemon, petitgrain, bergamot, and mandarin [5,6]. Therefore, EOs of the Citrus genus seem to be suitable as representative models for developing and validating new analytical approaches.
A large number of analytical techniques to characterize the composition of Citrus essential oils were introduced in the literature, including GC-MS [2,7], high performance liquid chromatography coupled to UV detection or mass spectrometry (HPLC-UV and MS) [8], two-dimensional gas chromatography (GCxGC) [9], or spectroscopy such as infrared (IR) [10]. However, the reports of Citrus EO analysis by supercritical fluid chromatography (SFC) are still scarce [11,12], using UV or mass spectrometry detectors and mainly related to non-volatile polar compounds. The objective of this study is thus to compare the analytical performances of a gold-standard technology (used in NF ISO 855), i.e., gas chromatography (GC-FID), with that of packed-column SFC-UV. GC employs helium, a carrier gas derived from drilling, whose extraction has a significant risk of supply disruption [13]. Nitrogen and hydrogen could be used as carrier gases too [14]. Nitrogen is seen as a slow gas, and is often overlooked as an alternative to helium, even if its use would be perfectly valid in a number of GC analyses. However, if the chromatographic resolution is enough, it is possible to run samples at a higher average linear velocity. This means sacrificing theoretical plates number, which in practical terms means broadened peaks. On the other hand, hydrogen is more efficient than helium at higher linear velocities but is flammable, limiting its use in some applications. On the contrary, SFC uses CO2, i.e., a co-product of a gasifier and bio-ethanol production, as a supercritical or sub-critical fluid. This pseudo-state, which is intermediate between liquid and gas, provides interesting physical properties and does not require complex operating conditions (critical pressure at 74 bar and critical temperature at 32 °C). Moreover, CO2 is a co-product of industrial plants, odourless, colourless, inert, and exhibits a low toxicity [15]. SFC instruments first appeared in the 1960s [16] but have only been developed in academic laboratories for research. In the last 10 years, manufacturers have invested in the development of reliable and robust devices, suggesting that this technology will be rapidly adopted in the industrial field, offering alternatives to classical GC and LC instruments [17,18,19].
Although greener and less energy intensive, SFC will only be attractive if its analytical performance is equivalent to, or better than, conventional technologies [20]. Demonstrating this equivalence of results will be the main goal of this study, following our previous work on the analysis of volatile compounds of Jasminum grandiflorum by SFC-MS [21]. As far as we know, a comparison of conventional GC-FID with SFC-UV for essential oil characterization has never been performed and will open the way to the adoption of SFC-UV for routine analysis in the field of cosmetics and agro-industry, including quality control and product falsification.
In 2020, Fujito et al. have demonstrated the ability to separate volatile compounds such as α-pinene, limonene, and citral using a styrene-divinyl benzene (SDVB) polymer-based column in SFC mode [22]. The resolution observed on the chromatograms between pinene (k’ = 2.3), citral (k’ = 3.5), and limonene (k’ = 3.2) was quite low. The two stereoisomers of citral are well-separated but not identified. This last point is crucial when using a popular and low-cost detector with a low specificity such as a UV detector. In this work, improving the separation of these volatile compounds, and identifying the stereoisomers of citral (geranial is trans-isomer and neral is cis-isomer), will be an additional challenge. Qualitative and quantitative data will be introduced and illustrated by the analysis of real matrices from an EO collection.

2. Materials and Methods

2.1. Samples

The essential oils of different species of Citrus genus (Italian lemon essential oil, Italian yellow mandarin essential oil, Brazil orange essential oil, and Florida grapefruit essential oil) were gifts of Albert Vieille (Vallauris, France). Italian bergamot was purchased from Payan Bertrand (Paris, France). All these essential oils were obtained using a cold pressed process. For qualification, all samples were diluted at 1/10 (v/v) in ethanol prior to SFC analysis, and at 2/100 (v/v) in ethanol for GC-MS. Analyses were performed in triplicate. For identification and quantification, R-limonene (reference W263303 and batch MKCH4505) and S-limonene (reference W504505) were purchased from Sigma-Aldrich (Merck, Whitehouse Station, NJ, USA). For identification, α-pinene W290203, p-cymene C121452, sabinene W530597, and caryophyllene W225207 were bought from Sigma-Aldrich (Merck, Whitehouse Station, NJ, USA), and β-pinene, γ-terpinene were acquired from PRODASYNTH (Grasse, France). Natural citral SCITR0001 was obtained from MPE (Trappes, France). Bisabolene 2751503 was bought at Givaudan (Paris, France).

2.2. GC-MS Analysis

The chemical composition of Citrus limon essential oil was determined by GC-MS analysis. Liquid injection was performed with a CTC autosampler installed on a GC 6890 (Agilent Technologies, Santa Clara, CA, USA) coupled to a simple quadrupole mass spectrometer 5973N (Agilent Technologies, Santa Clara, CA, USA). The injection volume was set at 1 µL using a split ratio of 100:1. The following parameters were used for GC-MS analyses: injector temperature 230 °C, column SUPELCOWAX® 10 (30 m × 0.25 mm, 0.25 µm film thickness) from Supelco (Merck, Kenilworth, NJ, USA); temperature from 75 °C to 100 °C at 5°C/min then from 100 °C to 220 °C at 6 °C/min; helium as carrier gas at a flow rate of 1 mL/min. Electron ionization (EI) mass spectra were recorded at 70 eV in the positive ion mode. The transfer line and the ion source were set at 250 °C. Mass spectra were scanned in the range m/z 30–400. Compound identification was carried out by comparison of experimental EI mass spectra and libraries (HPCH2205 (Adams, 2007), own ISIPCA library, and NIST11 Mass spectral library (2011)). Validation criteria for molecule identification were a spectral match factor of at least 80%, and RI in ascending order according to the values of the literature.

2.3. GC-FID Analysis

Liquid injection was performed with an AOC-20i autosampler installed on a GC-2010 (Shimadzu, Kyoto, Japan). Detection was carried out using a flame ionization detector (FID). The injection volume was set at 0.1 µL using a split ratio of 100:1. The following parameters were used for analyses: injector temperature 230 °C; column SUPELCOWAX® 10 (30 m × 0.25 mm, 0.25 µm film thickness); temperature from 75 °C to 100 °C at 5 °C/min then from 100 °C to 220 °C at 6 °C/min; helium as carrier gas at a flow rate of 1 mL/min. FID temperature was set at 260 °C.

2.4. SFC-UV Analysis

SFC-UV experiments were performed on a 1260 Infinity Analytical System (Agilent Technologies, Santa Clara, CA, USA) consisting of a SFC binary pump, a degasser, a SFC autosampler with a 5 μL loop, an Aurora SFC Fusion™ A5 module, and a column oven compartment. Detection was performed using a diode array detector (DAD) at a fixed wavelength of 220 nm. Instrument control and data collection were carried out using Mass Hunter Workstation software (B.08.00, Agilent Technologies, Santa Clara, CA, USA).

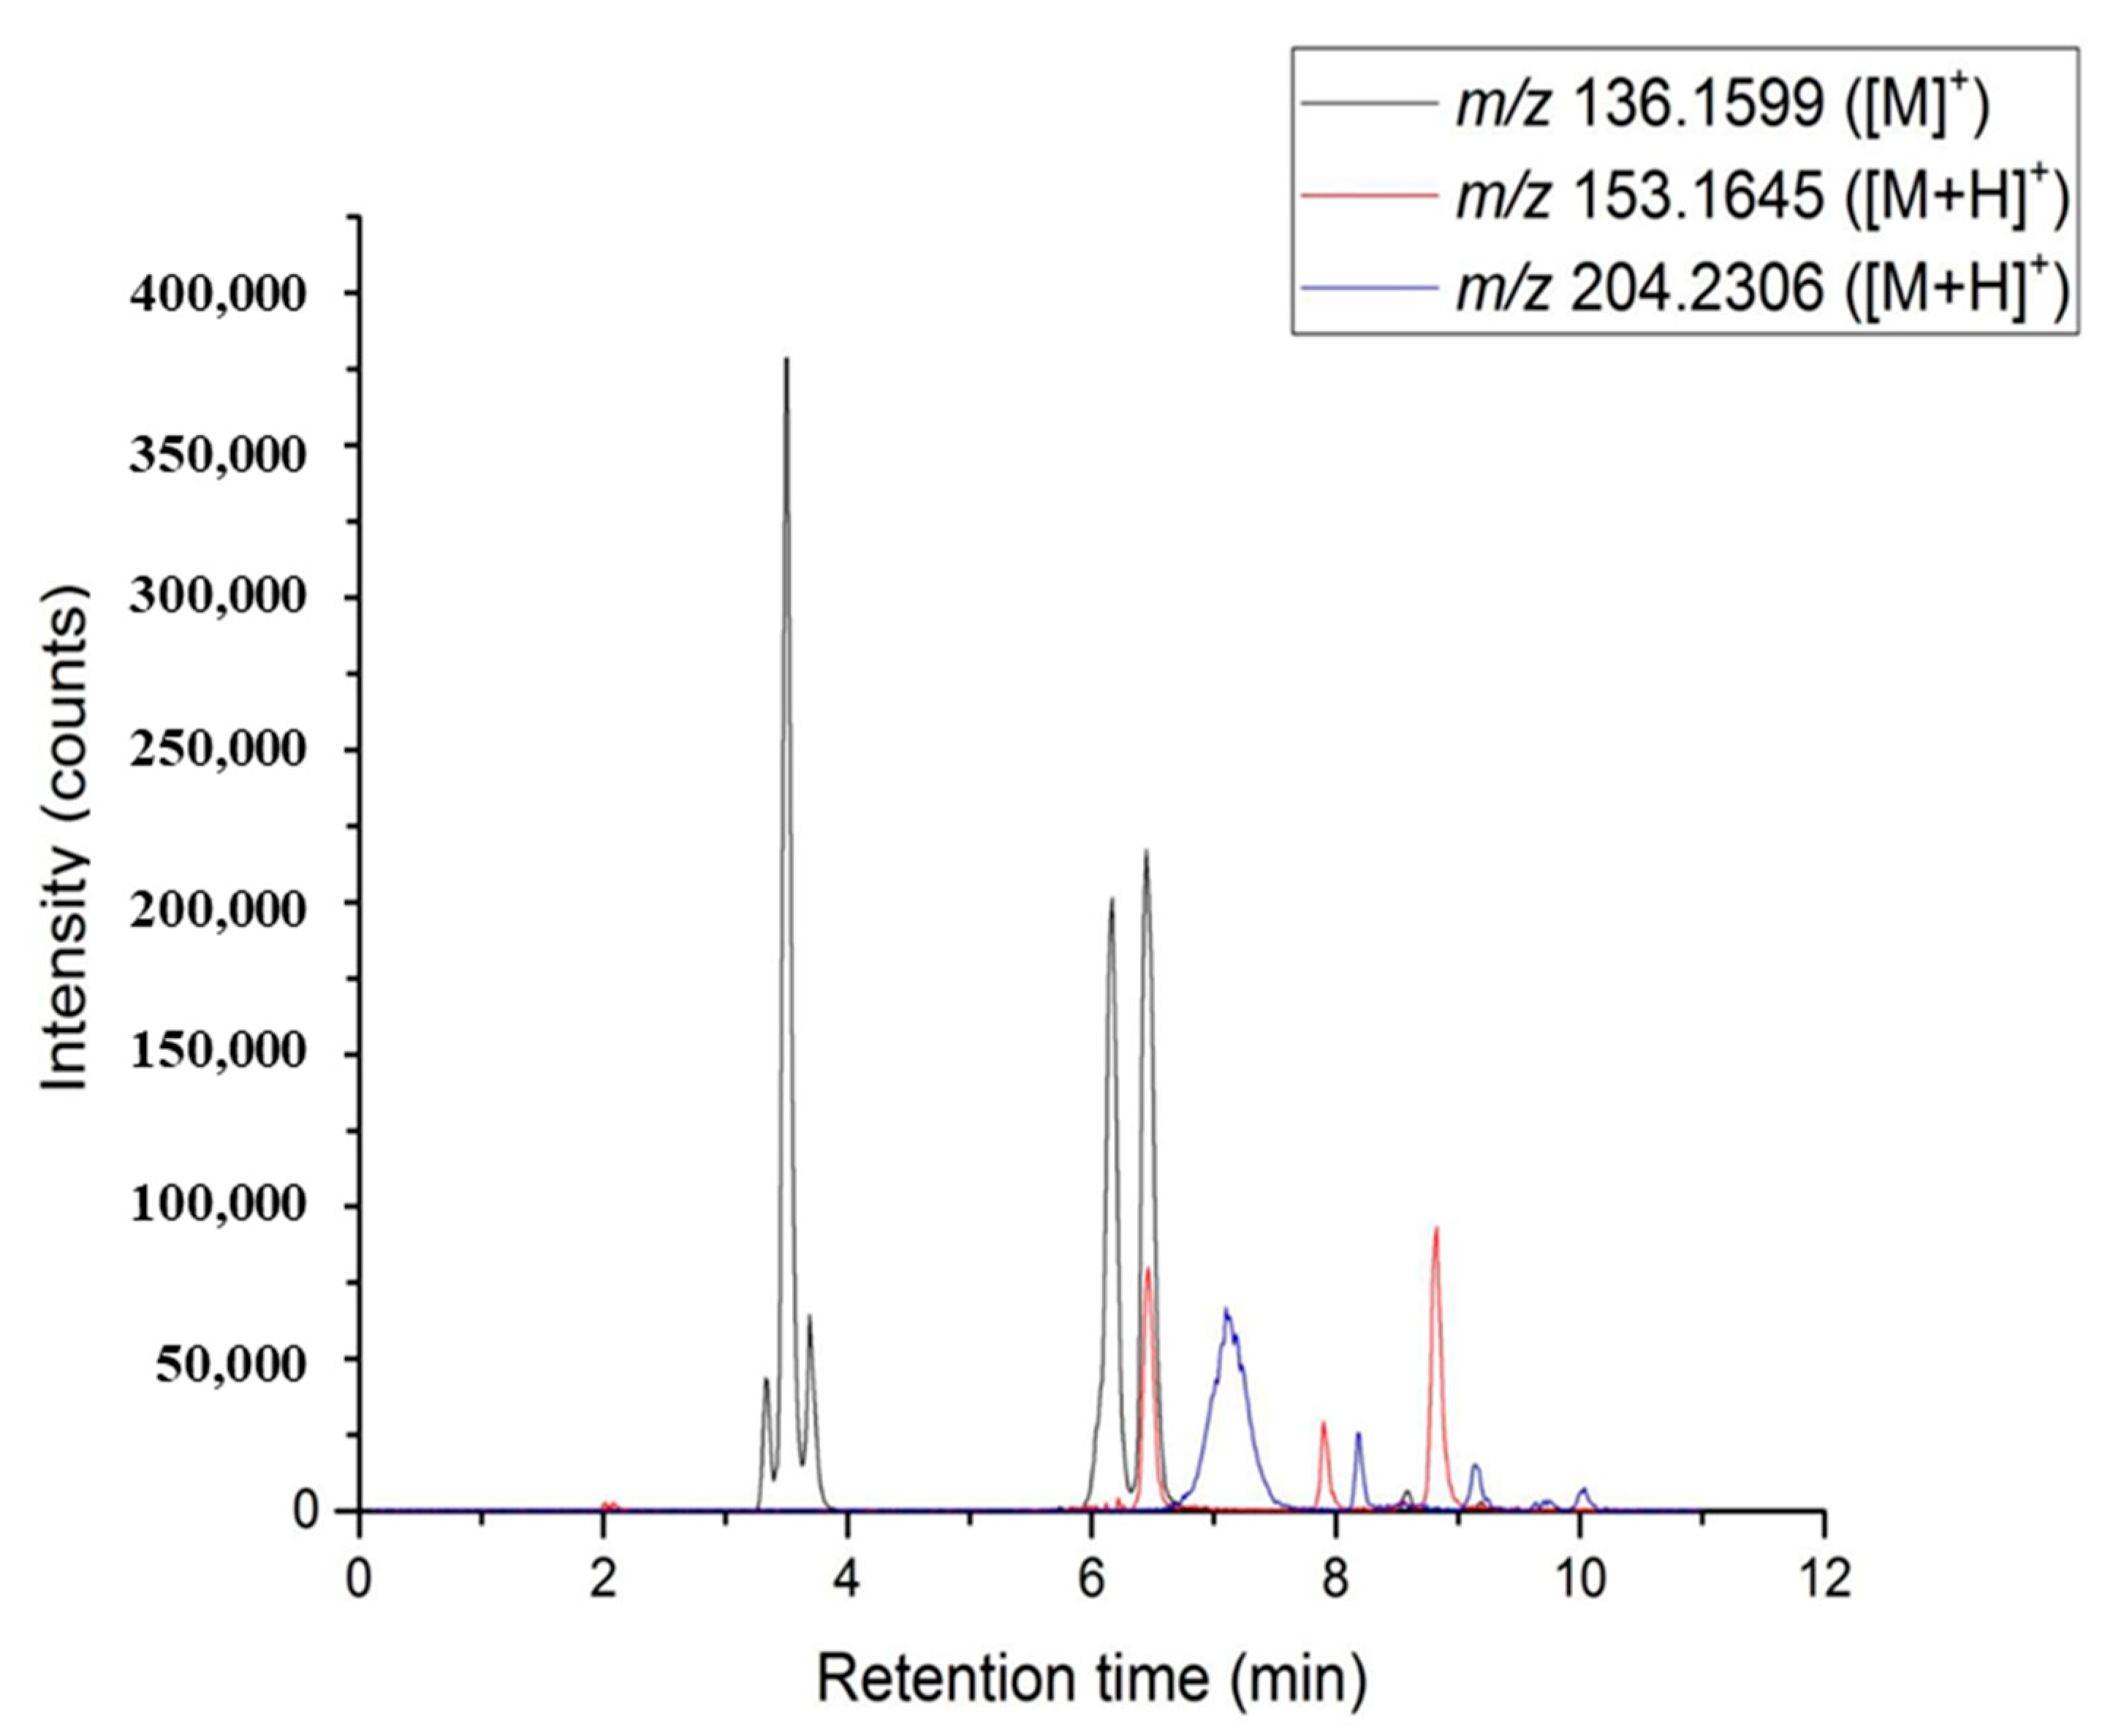
2.5. SFC-QTOF Analysis

SFC-High Resolution MS experiments were performed by coupling the SFC instrument to a hybrid quadrupole time-of-flight (QTOF) mass spectrometer (Q-TOF 6540 series, Agilent Technologies, USA) hyphenated with an Atmospheric Pressure Photoionization (APPI) source. Acquisitions were done with a mass resolution better than 20,000 at m/z 922. The final operating source conditions for MS scan in APPI mode were as follows: the fragmentor voltage at 175 V, the capillary at 2000 V for positive mode, the skimmer at 65 V, nitrogen was used as the drying (300 °C, 8 L/min) and nebulizing gas (35 psi). Before analysis internal calibration was carried out using APPI tuning mix (Agilent Technologies, USA). The lock masses used for analysis were at m/z 121.0508 (purine) and m/z 922.0097 (Hexakis (1H, 1H, 3H-perfluoropropoxy) phosphazene). Instrument control and data collection were carried out using MassHunter Workstation software (B06.01, Agilent Technologies, USA).

2.6. Final SFC Chromatographic Conditions

Two columns in series were used for chromatography, i.e., a Hypercarb® (150 mm × 4.6 mm, 5 µm, Thermo Scientific, Waltham, MA, USA) and a Poly-(butylene terephthalate) DCpack PBT (150 mm × 4.6 mm,5 µm, DAICEL Corporation, Osaka, Japan). The mobile phase consisting of CO2 (A) and methanol (B) was introduced at a flow rate of 1.5 mL/min according to the following gradient: 0.0–3.0 min (0% B), 3.0–16.0 min (0–10% B), 16.0–17.0 min (10–0% B) and 17.0–19.0 min (0% B). The column temperature was kept at 60 °C and the back pressure was fixed at 90 bar.

2.7. Calibration Curves

The calibration curves, as well as the linear regression, were calculated with the ORIGIN 2015 software (Northampton, MA, USA).

3. Results and Discussion

3.1. Qualitative Analysis

3.1.1. Gas Chromatography

Given the variability in chemical composition of essential oils depending on the season, the origin and the extraction method, a lemon essential oil from Italy obtained by cold pressing was analyzed by GC as a reference method for separation of volatile compounds. A GC-MS analysis (Figure S1) was carried out in order to identify the major compounds followed by a GC-FID analysis for a semi-quantitative approach (Figure S2). GC-MS chromatogram of the peel oil extract of Citrus limon (L.) displayed 19 identified peaks (Table 1) according to their MS spectrum and the retention index. The results, including the orders of elution as well as the relative peak areas, are in accordance with the NF ISO 855 standard [23] where eleven compounds guarantee the quality of this essential oil, its origin and method of production. For example, relative concentrations of the major compounds limonene 67% (60–68%), γ-terpinene 9.5% (8–12%), and β-pinene 15.6% (10–16.5%) are all in the ranges related to the oil’s Italian origin [23].

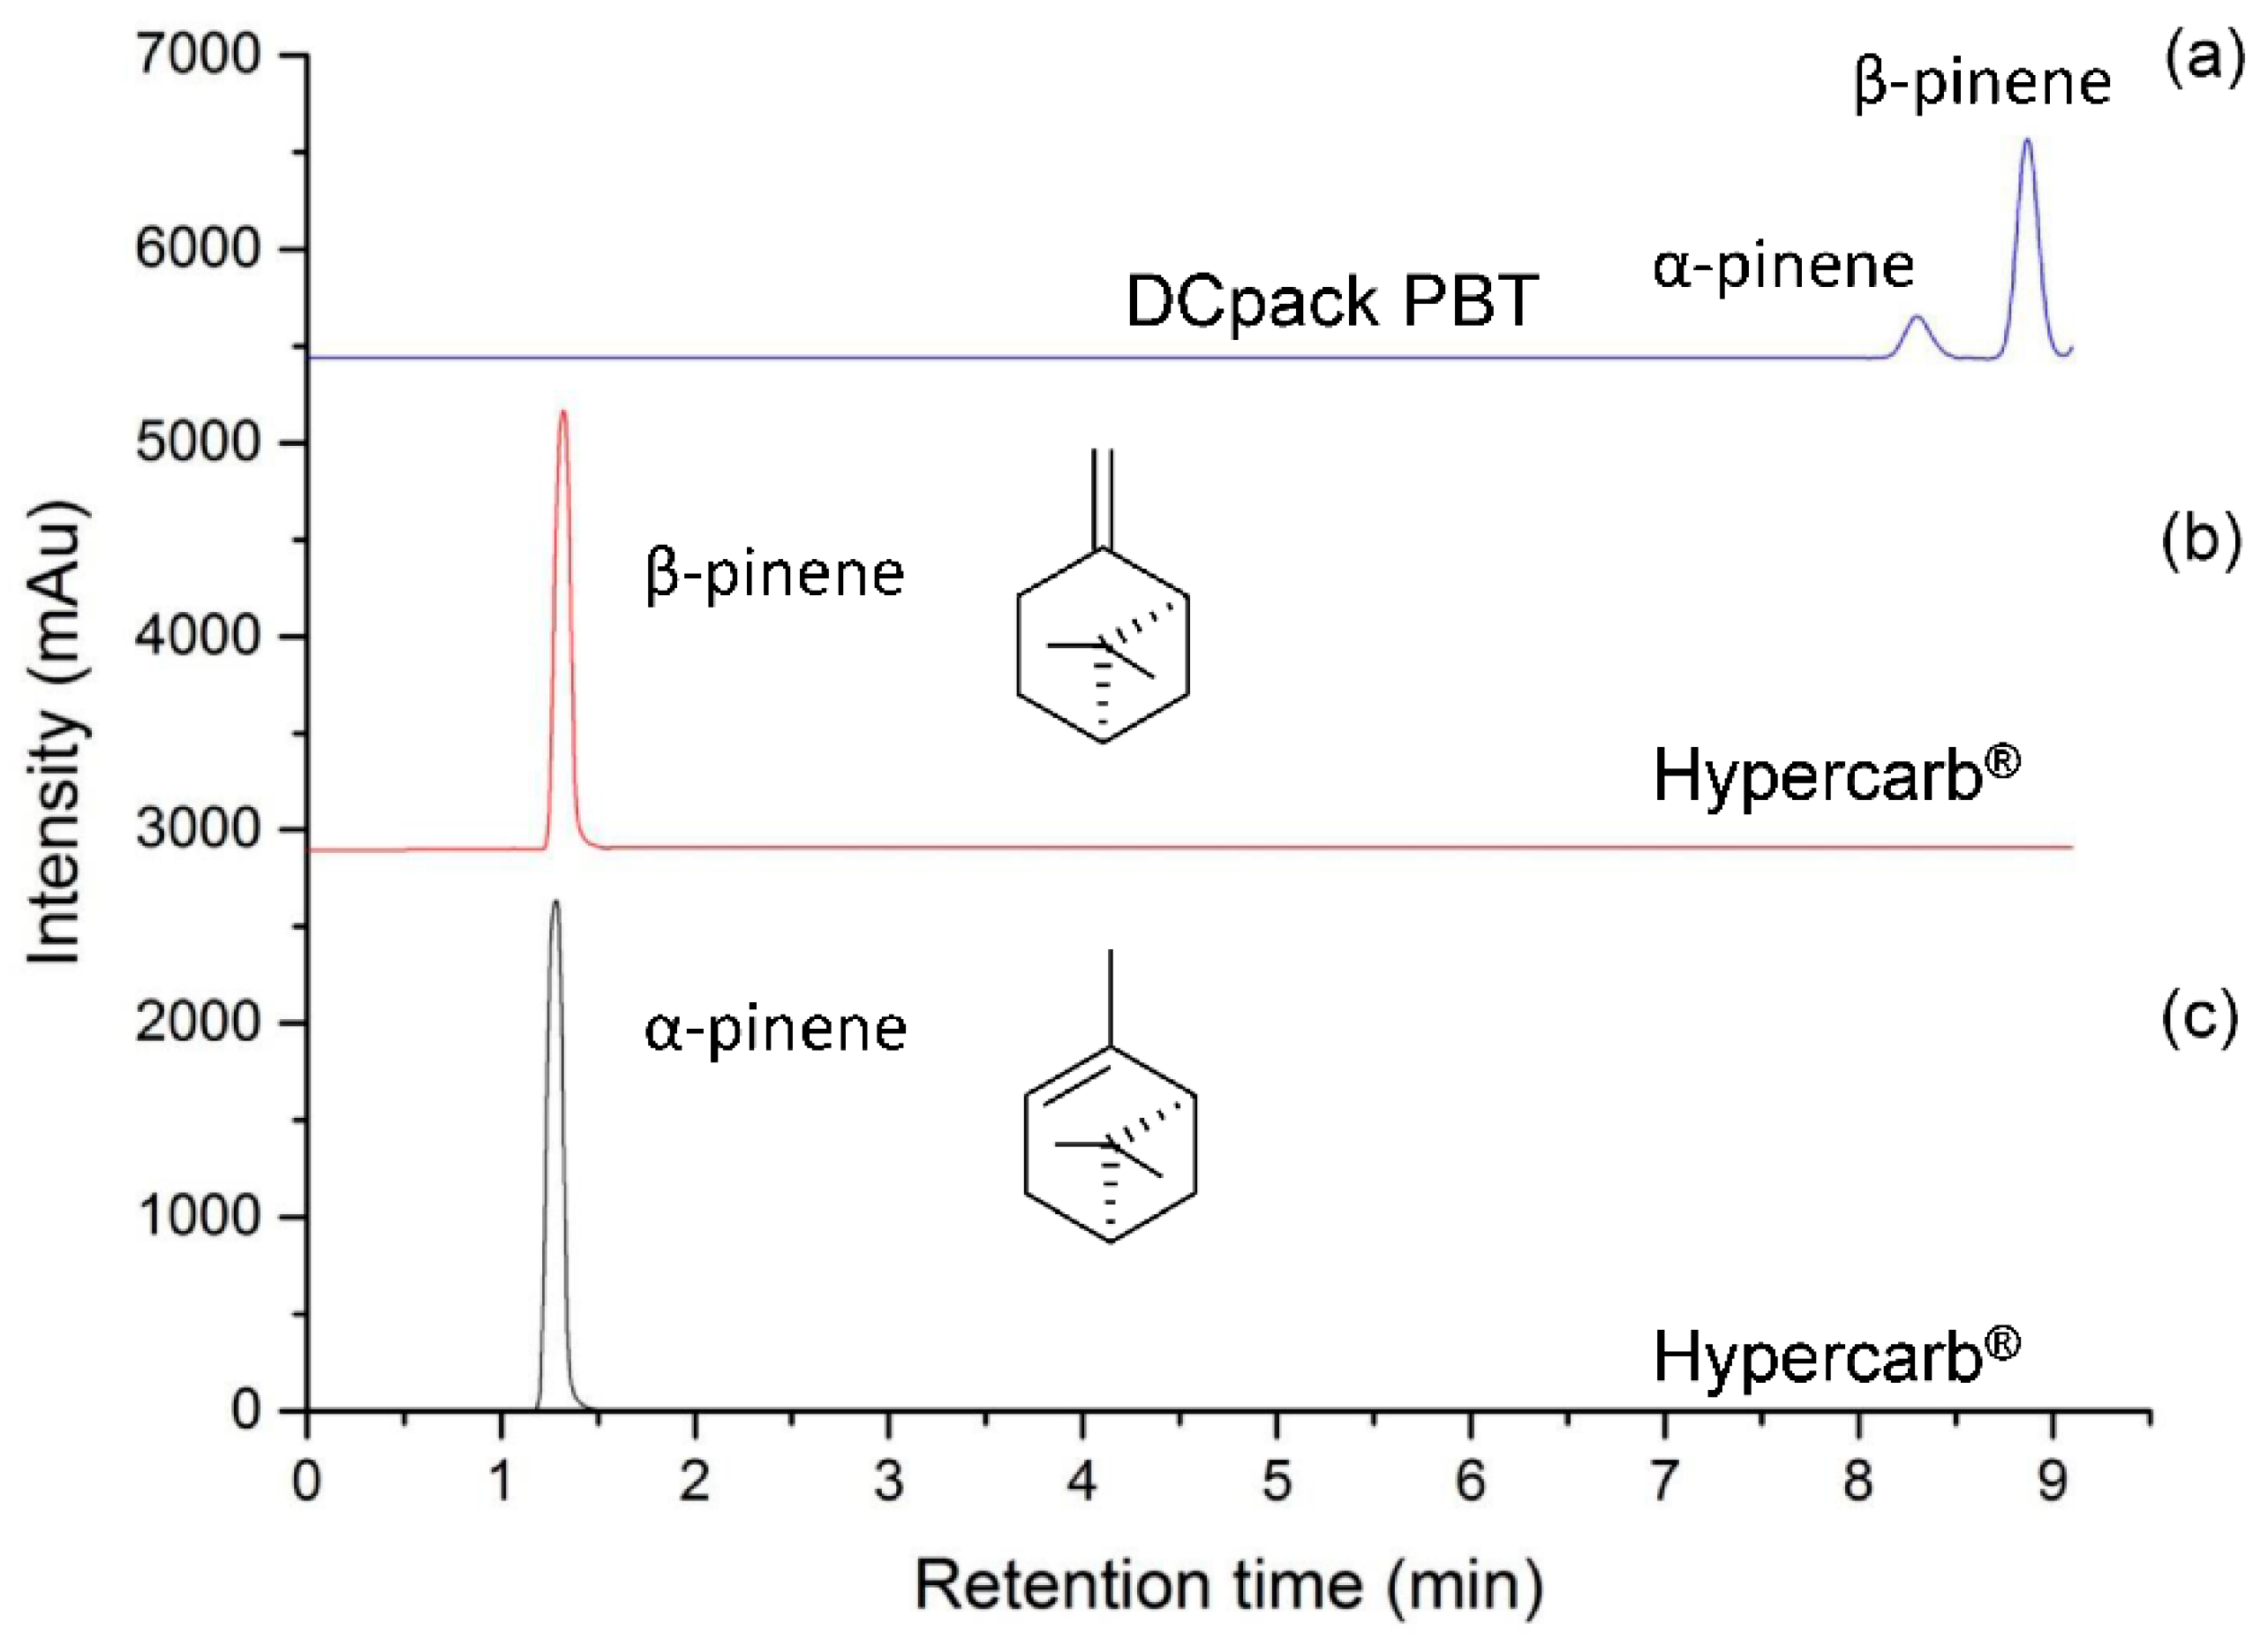
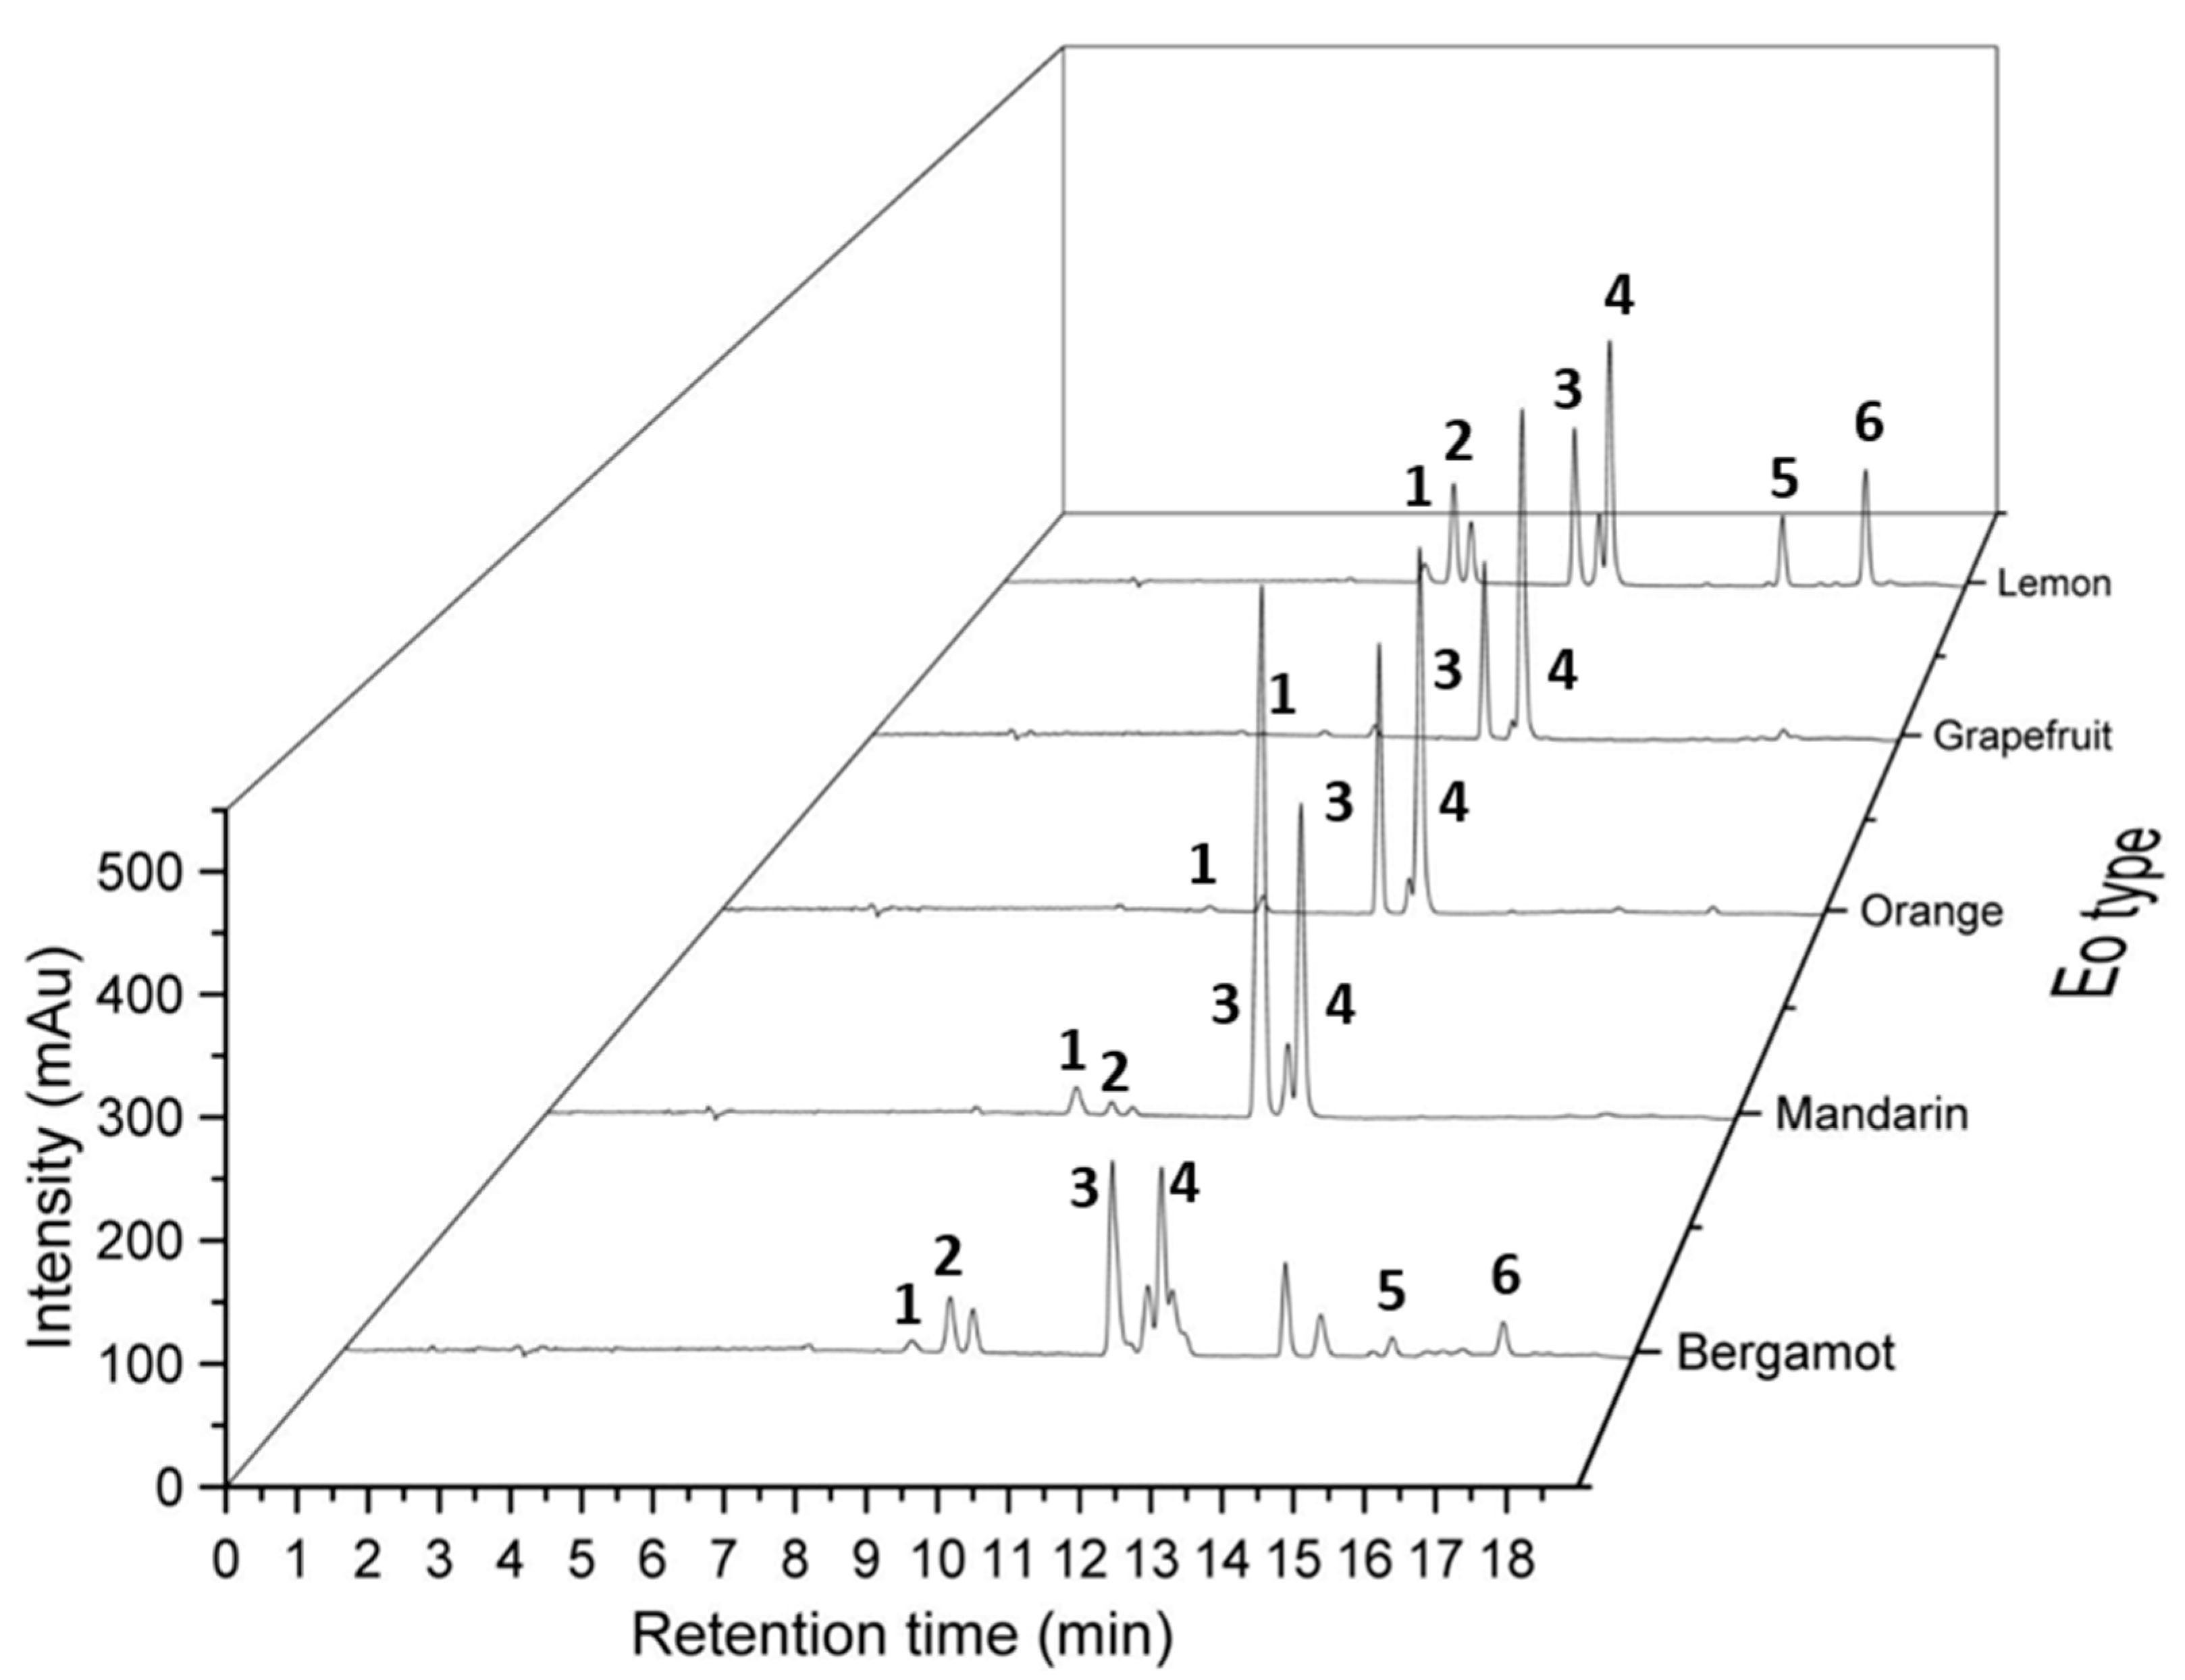
3.1.2. Supercritical Fluid Chromatography

Concerning the development of the analytical method by SFC-MS, the HypercarbTM stationary phase was first selected according to its potential to separate up to 22 chemical compounds structurally closed to the ones present in the Citrus essential oils, including terpenes from Jasminum grandiflorum absolute [21]. Nevertheless, this method did not show good efficiency in separating positional isomers such as α- and β-pinenes present in lemon essential oil, associated with fresh camphor, sweet pine, earthy, woody, and dry woody resinous pine hay green odors, respectively. According to the fact that a first screening with 11 orthogonal stationary phases [25] was previously performed without reaching that goal [26], a stationary phase newly developed by Daicel and compatible with supercritical CO2 was tested. This particular material is based on polybutylene terephthalate (PBT) coated on 5 µm or 3 µm silica particles and has already shown good performance for the separation of structural or positional isomers including cannabinoids, polyaromatic hydrocarbons (PAHs), and terphenyl isomers [26]. According to the structure of this polymeric stationary phase, interactions between phtalate and the double bound of pinene is expected through dipole-dipole and Pi-double bound interactions. Therefore, depending on the chemical environment of the double bound and its steric hindrance, α- and β-pinenes are expected to be separated on PBT stationary phase. On-line coupling of Hypercarb® and PBT columns led to the separation of positional isomers of pinenes when using a generic CO2/methanol gradient (Figure 1).
The chromatographic profile of lemon essential oil previously analyzed by GC-MS and GC-FID exhibits twelve peaks using the newly developed SFC-UV method (Table 2). Qualitatively, the major compounds of lemon essential oil were all detected. Nevertheless, the relative areas are significantly different from the ones obtained by GC-FID because each chemical compound exhibits a different molar attenuation coefficient when performing UV detection at a specific wavelength. The retention factors obtained using our SFC-UV method demonstrate a better separation of α-pinene, limonene, and citral compared to the work of Fujito et al. [22]. In fact, a k’ value of 2.3 compared to 1.8 for the previous work was obtained for α-pinene, a k’ value of 3.2 against 3.0 for limonene, and a value of 3.5 against 4.1 for citral.
Standards such as limonene, α-pinene, β-pinene, sabinene, p-cymene, γ-terpinene, citral (neral/geranial) stereoisomers, bisabolene, and caryophyllene were injected to determine their respective retention times and to allow chromatogram annotation. In order to improve the annotation confidence, SFC was coupled to a high-resolution mass spectrometer for the determination of molecular formula. An atmospheric pressure photoionization source (APPI) was chosen as it is well suited for the ionization of apolar compounds [27,28,29,30]. By extracting an ion chromatogram (Figure 2) at theoretical m/z values for radical cation or protonated limonene, pinenes, and citral stereoisomers, it is possible to correlate ion and UV signals to validate the presence of the different chemical families. Signals at m/z 136.1599, corresponding to radical cation [M]• + of monoterpenes, allowed us to confirm the presence of α- and β-pinenes and limonene. Oxygenated monoterpenes were detected at m/z 153.1645 ([M + H]+), confirming the presence of two peaks for citral, i.e., neral and geranial. It must be noted that some minor oxygenated monoterpenes are co-eluted with limonene. These signals can be related to the natural aging of the essential oil, but also to the fast oxidation process of these fragile and reactive compounds in the heated ion source at atmospheric pressure. Finally, sesquiterpenes were detected at m/z 204.2306 ([M]•+) leading to the detection of three distinct peaks. Two of them were identified as bisabolene and caryophyllene after the standard injection but the three others were not identified yet.

3.2. Quantitative Analysis

Taking into account the peak areas in SFC-UV, the relative content of limonene (27.54 ± 3.75%) is significantly different from the one obtained by GC-FID (66.72 ± 0.13%). This major discrepancy is directly related to the response factors of the molecules towards the different detectors. Indeed, for FID measurements, a correction using predictive relative response factors for the rapid quantification of volatile compounds was applied [31] whereas extinction coefficients used in SFC-UV need to take into account the conversion of absorbance to concentration (Beer–Lambert law). For that purpose, the extinction coefficient of the major compound, i.e., limonene, was calculated from calibration curves. These results are given in Table 3.
Neither SFC nor GC allow us to separate the enantiomers of limonene under the conditions of the study. Moreover, the literature indicated that the enantiomeric excess of R-limonene is between 97.1 and 97.4%. [32] This is why we have chosen to perform the calibration curves with this isomer.
Calibration curves were calculated under optimized GC-FID (Figure S3) and SFC-UV (Figure S4) chromatographic conditions to quantify the limonene content. Limits of detection (LOD) were calculated based on the standard deviation of the response (Sa) of the calibration curve, intercept value (a) and the slope of the calibration curve (b) according to the formula: LOD = (a + 3 Sa)/b. The standard deviation of the response was determined based on the standard deviation of y-intercepts of regression lines. For the limits of quantification (LOQ), the formula used was: LOQ = (a + 10 Sa)/b (Table 3). Good linearity was obtained for both methods as confirmed by the determination coefficient R2, better than 0.994.
Determination of the limonene concentrations using the calibration curves was performed using both chromatographic methods. The final concentration obtained by SFC-UV was 68.19 ± 1.57 g/100 g, in good agreement with that obtained by GC-FID 64.40 ± 2.99 g/100 g. Coefficients of variation (CV) values were below 5%, demonstrating a good intraday repeatability of both methods.
To evaluate the newly developed method for exploring the chemical diversity of an essential oil collection, four other essential oils from the Citrus genus, i.e., yellow mandarin (Citrus reticulata), orange (Citrus sinensis (L.)), bergamot (Citrus bergamia) and grapefruit (Citrus × paradisi), were analyzed by SFC-UV. Chromatograms of the investigated samples (Figure 3) showed that profiles are significantly different, allowing a fast quality control to validate the composition, for example. After creation of a specific database, quality control of different batches could thus be performed in an efficient manner and with a limited quantity of material (few microliters of pure essential oils).

4. Conclusions

In this work we were able to compare the analytical performances of SFC-UV and GC-FID. The assay of the major component of lemon oil, limonene, was performed. The results obtained are close, indeed in SFC-UV one obtains 68.19 ± 1.57 g/100 g, which is completely consistent with what is obtained in GC-FID: 64.40 ± 2.99 g/100 g. The GC-FID presents nevertheless the advantage of being able to carry out a semi-quantification related to the use of the FID detector. The use of the UV detector in SFC would require the calculation of the molar absorption coefficients in the elution solvent. This has not been carried out at present but may be considered in the future.
In terms of the detection limit, the two methods are close. For the SFC-UV the value obtained is 0.020 g/100 g and for the GC-FID the value is 0.029 g/100 g. Concerning the limits of quantification, the SFC-UV is slightly better with a value of 0.055 g/100 g against 0.108 g/100 g for the GC-FID. This advantage of SFC-UV over GC-MS could be of interest when dealing with trace analysis in product adulterations.
Moreover, the capacity of SFC to separate citral isomers, i.e., geranial (strong lemon odor) and neral (sweet lemon odor), showing slightly different organoleptic properties compared to conventional GC is a major advantage for applications in cosmetics.
We demonstrated that SFC-UV can be an interesting alternative to GC-FID for the characterization of essential oils and their reliable classification. Even if the environmental impact of helium is not proven, it is a non-renewable resource, and its natural reserves are becoming increasingly scarce. This leads to the search for alternative carrier gases such as nitrogen or hydrogen. CO2 represents a complementary possibility to this search for a substitute. For all these reasons, the SFC-UV (-MS) can be recommended for quality control departments in the perfume and flavor industry and other industrial fields.

Supplementary Materials

The following supporting information can be downloaded at: https://www.mdpi.com/article/10.3390/separations9070183/s1, Figure S1: Chromatogram and peak identification obtained by GC-MS using column SUPELCOWAX® 10 (30 m × 0.25 mm, 0.25 mm film thickness); temperature from 75 °C to 100 °C at 5 °C/min then from 100 °C to 220 °C at 6 °C/min; helium as carrier gas at a flow rate of 1 mL/ min. FID temperature was set at 260 °C. (1) α-pinene, (2) camphene, (3) β-pinene, (4) sabinene, (5) myrcene, (6) limonene, (7) β-phellandrene, (8) γterpinene, (9) p-cymene, (10) terpinolene, (11) citronellal, (12) linalol, (13) α-E-bergamotene, (14) E-caryophyllene, (15) neral, (16) α-terpineol, (17) β-bisabolene, (18) geranial, (19) geranyl acetate.; Figure S2: Chromatogram and peak identification obtained by GC-FID using column SUPELCOWAX® 10 (30 m × 0.25 mm, 0.25 mm film thickness); temperature from 75 °C to 100 °C at 5 °C/min then from 100 °C to 220 °C at 6 °C/min; helium as carrier gas at a flow rate of 1 mL/ min. FID temperature was set at 260 °C. (1) α-pinene, (2) β-pinene, (3) myrcene, (4) limonene, (5) γterpinene, (6) p-cymene, (7) terpinolene, (8) linalol, (9) α-E-bergamotene, (10) E-caryophyllene, (11) neral, (12) α-terpineol, (13) β-bisabolene, (14) geranial, (15) geranyl acetate.; Figure S3: GC-FID R-limonene calibration curve obtained using Origin software.; Table S1: Raw data used to obtain the GC-FID calibration curve. Standard concentration used between 4.85 and 0.15 g/100 g of limonene. Injections were performed in triplicate. Chromatographic conditions: injection volume was set at 0.1 µL using a split ratio of 100:1. The following parameters were used for analyses: injector temperature 230 °C, column SUPELCOWAX® 10 (30 m × 0.25 mm, 0.25 µm film thickness); temperature from 75 °C to 100 °C at 5 °C/min then from 100 °C to 220 °C at 6 °C/min; helium as carrier gas at a flow rate of 1 mL/ min. FID temperature was set at 260 °C.; Figure S4: SFC-UV R-limonene calibration curve obtained using Origin software.; Table S2: Raw data used to obtain the SFC-UV calibration curve. Standard concentration used between 4.85 and 0.15 g/100 g of limonene. Injections were performed in triplicate. Chromatographic conditions: Two columns in series were used for chromatography, i.e., a Hypercarb® (150 mm × 4.6 mm, 5 µm, Thermo Scientific, Waltham, Massachusetts, USA) and a Poly-(butylene terephthalate) DCpack PBT (150 mm × 4.6 mm, 5 µm, DAICEL Corporation, Osaka, Japan). The mobile phase consisting of CO2 (A) and methanol (B) was introduced at a flow rate of 1.5 mL/min according to the following gradient: 0.0–3.0 min (0% B), 3.0–16.0 min (0–10% B), 16.0–17.0 min (10–0% B) and 17.0–19.0 min (0% B). The column temperature was kept at 60 °C and the back pressure was fixed at 90 bar.

Author Contributions

Conceptualization, C.S. and D.T.; methodology, C.S., E.D., P.F., N.V. and D.T.; software, C.S.; validation, C.S. and D.T.; formal analysis, C.S.; investigation, C.S.; resources, C.S., E.D., P.F. and N.V.; data curation, C.S. and D.T.; writing—original draft preparation, C.S., E.D., P.F., N.V. and D.T.; writing—review and editing, C.S., E.D., P.F., N.V. and D.T.; visualization, C.S.; supervision, D.T.; project administration, E.D., N.V. and D.T.; funding acquisition, E.D., N.V. and D.T. All authors have read and agreed to the published version of the manuscript.

Funding

This research was funded by BPI France and Région Ile de France for their financial support to the LIPOCOSM2 project through the French FUI25 grant. This work was supported by the Agence Nationale de la Recherche (Grant ANR-16-CE29-0002-01 CAP-SFC-MS).

Data Availability Statement

Data are available through contact with the corresponding author.

Acknowledgments

The authors would like to express their gratefulness to Stéphane Dubant and Philippe Firmin from Agilent Technologies for supporting the development of our analytical equipment.

Conflicts of Interest

The authors declare no conflict to interest.

References

  1. Marriott, P.J.; Shellie, R.; Cornwell, C. Gas chromatographic technologies for the analysis of essential oils. J. Chromatogr. A 2001, 936, 1–22. [Google Scholar] [CrossRef]
  2. Kaskoos, R.A. Essential Oil Analysis by GC-MS and Analgesic Activity of Lippia citriodora and Citrus limon. J. Essent. Oil Bear Pl 2019, 22, 273–281. [Google Scholar] [CrossRef]
  3. Citrus Oil Market Size, Share & Trends Analysis Report by Product (Orange Oil, Lemon Oil), By Application (Personal Care, Food & Beverages, Aromatherapy), By Region, And Segment Forecasts, 2019–2025. Available online: https://www.grandviewresearch.com/industry-analysis/citrus-oil-market (accessed on 29 July 2020).
  4. Calabrese, F. Origin and history. In Citrus: The genus Citrus, 1st ed.; Dugo, G., Di Giacomo, A., Eds.; Taylor & Francis: London, UK, 2002; pp. 1–15. [Google Scholar]
  5. Composition Eau de toilette Eau des Merveilles Hermès. Available online: https://www.olfastory.com/parfum/eau-des-merveilles/composition/ (accessed on 29 July 2020).
  6. Composition Eau de toilette O de Lancôme Lancôme. Available online: https://www.olfastory.com/parfum/o-de-lancome/composition/ (accessed on 29 July 2020).
  7. Shiota, H. Volatile Components in the Peel Oil from Fingered Citron (Citrus medica L. var. sarcodactylis Swingle). Flavour Fragr. J. 1990, 5, 33–37. [Google Scholar] [CrossRef]
  8. Benincasa, M.; Buiarelli, F.; Cartoni, G.P.; Coccioli, F. Analysis of Lemon and Bergamot Essential Oils by HPLC with Microbore Columns. Chromatographia 1990, 30, 5–6. [Google Scholar] [CrossRef]
  9. Mondello, L.; Casilli, A.; Tranchida, P.Q.; Dugo, P.; Dugo, G. Comprehensive two-dimensional GC for the analysis of Citrus essential oils. Flavour Fragr. J. 2005, 20, 136–140. [Google Scholar] [CrossRef]
  10. Boughendjioua, H.; Djeddi, S. Fourier Transformed Infrared Spectroscopy Analysis of Constituents of Lemon Essential Oils from Algeria. Am. J. Opt. Photon. 2017, 5, 30–35. [Google Scholar] [CrossRef] [Green Version]
  11. Zoccali, M.; Arigò, A.; Russo, M.; Salafia, F.; Dugo, P.; Mondello, L. Characterization of Limonoids in Citrus Essential Oils by Means of Supercritical Fluid Chromatography Tandem Mass Spectrometry. Food Anal. Methods 2018, 11, 3257–3266. [Google Scholar] [CrossRef]
  12. Desmortreux, C.; Rothaupt, M.; West, C.; Lesellier, E. Improved separation of furocoumarins of essential oils by supercritical fluid chromatography. J. Chromatogr. A 2009, 1216, 7088–7095. [Google Scholar] [CrossRef]
  13. Mehrpooya, M.; Ghollasi Mood, N.; Ansarinasab, H.; Sulaiman Alsagri, A.; Mehdipourrad, M. A novel sensitivity analysis of a new integrated helium extraction process through the interaction of costs and environmental impacts. Appl. Therm. Eng. 2019, 159, 113787. [Google Scholar] [CrossRef]
  14. Bakar, N.; Abu-Siada, A.; Islam, S. A review of dissolved gas analysis measurement and interpretation techniques. IEEE Electr. Insul. Mag. 2014, 30, 39–49. [Google Scholar] [CrossRef]
  15. Supercritical CO2: A green solvent. Available online: https://www.chemengonline.com/supercritical-co2-a-green-solvent/ (accessed on 9 November 2020).
  16. McCann, J. Analysis of Gasoline and Other Light Distillate Fuels. In Manual on Hydrocarbon Analysis, 6th ed.; ASTM International: West Conshohocken, PA, USA, 1998; pp. 18–21. [Google Scholar]
  17. He, P.X.; Zhang, Y.; Zhou, Y.; Li, G.H.; Zhang, J.W.; Feng, X.S. Supercritical fluid chromatography–a technical overview and its applications in medicinal plant analysis: An update covering 2012–2018. Analyst 2019, 144, 5324–5352. [Google Scholar] [CrossRef]
  18. Lemasson, E.; Bertin, S.; West, C. Use and practice of achiral and chiral supercritical fluid chromatography in pharmaceutical analysis and purification. J. Sep. Sci. 2016, 39, 212–233. [Google Scholar] [CrossRef]
  19. Da Silva, C.G.A.; Collins, C.H. Super/subcritical fluid chromatography with packed columns: State of the art and applications. Quim. Nova 2014, 37, 1047–1057. [Google Scholar] [CrossRef]
  20. Steuer, W.; Grant, I.; Erni, F. Comparison of high- performance liquid chromatography, supercritical fluid chromatography and capillary zone electrophoresis in drug analysis. J. Chromatogr. 1990, 507, 125–140. [Google Scholar] [CrossRef]
  21. Santerre, C.; Vallet, N.; Touboul, D. Fingerprints of flower absolutes using supercritical fluid chromatography hyphenated with high resolution mass spectrometry. J. Chromatogr. B 2018, 1092, 1–6. [Google Scholar] [CrossRef]
  22. Fujito, Y.; Hayakawa, Y.; Bamba, T. Development of a novel comprehensive analytical method for volatile compounds using supercritical fluid chromatography/mass spectrometry with a highly cross-linked styrene divinylbenzene polymer-based column. J. Chromatogr. A 2020, 1626, 461363. [Google Scholar] [CrossRef]
  23. Oil of Lemon (Citrus limon (L.) Burm. F.), Obtained by Expression, 2nd ed.; International Organization for Standardization: Geneva, Switzerland, 2003.
  24. Cicchetti, E.; Merle, P.; Chaintreau, A. Quantitation in gas chromatography: Usual practices and performances of a response factor database. Flavour Fragr. J. 2008, 23, 450–459. [Google Scholar] [CrossRef]
  25. West, C.; Lesellier, E. A unified classification of stationary phases for packed column supercritical fluid chromatography. J. Chromatogr. A. 2008, 1191, 21–39. [Google Scholar] [CrossRef]
  26. Nagai, K.; Shibata, T.; Shinkura, S.; Ohnishi, A. Poly(butylene terephthalate) based novel achiral stationary phase investigated under supercritical fluid chromatography conditions. J. Chromatogr. A 2018, 1549, 85–92. [Google Scholar] [CrossRef]
  27. Zhurov, K.O.; Menin, L.; Di Franco, T.; Tsybin, Y.O. A Functional Group Approach for Prediction of APPI Response of Organic Synthetic Targets. J. Am. Soc. Mass Spectrom. 2015, 26, 1221–1232. [Google Scholar] [CrossRef] [Green Version]
  28. Imbert, L.; Gaudin, M.; Libong, D.; Touboul, D.; Abreu, S.; Loiseau, P.M.; Laprévote, O.; Chaminade, P. Comparison of electrospray ionization, atmospheric pressure chemical ionization and atmospheric pressure photoionization for a lipidomic analysis of Leishmania donovani. J. Chromatogr. A 2012, 1242, 75–83. [Google Scholar] [CrossRef] [PubMed]
  29. Méjean, M.; Brunelle, A.; Touboul, D. Quantification of tocopherols and tocotrienols in soybean oil by supercritical-fluid chromatography coupled to high-resolution mass spectrometry. Anal. Bioanal. Chem. 2015, 407, 5133–5142. [Google Scholar] [CrossRef]
  30. Hebra, T.; Eparvier, V.; Touboul, D. Atmospheric pressure photoionization versus electrospray for the dereplication of highly conjugated natural products using molecular networks. J. Chromatogr. A 2020, 1630, 461533. [Google Scholar] [CrossRef]
  31. Cachet, T.; Brevard, H.; Chaintreau, A.; Demyttenaere, J.; French, L.; Gassenmeier, K.; Joulain, D.; Koenig, T.; Leijs, H.; Liddle, P.; et al. IOFI recommended practice for the use of predicted relative-response factors for the rapid quantification of volatile flavouring compounds by GC-FID. Flavour Fragr. J. 2016, 31, 191–194. [Google Scholar] [CrossRef] [Green Version]
  32. Blanch, G.P. Determination of the Enantiomeric Composition of Limonene and Limonene-1,2-epoxide in Lemon Peel by Multidimensional Gas Chromatography with Flame-lonization Detection and Selected Ion Monitoring Mass Spectrometry. J. Chromatogr. Sci. 1998, 36, 37–43. [Google Scholar] [CrossRef] [Green Version]
Figure 1. Comparison of α-pinene and β-pinene separation using CO2 (A) and methanol (B) mobile phase, flow rate of 1.5 mL/min, gradient mode: 0.0–3.0 min (0% B), 3.0–16.0 min (0–10% B), 16.0–17.0 min (10–0% B) and 17.0–19.0 min (0% B): (a) Two columns in series a Hypercarb® (150 mm × 4.6 mm, 5 µm) and a Poly-(butylene terephthalate) DCpack PBT(150 mm × 4.6 mm, 5 µm), DAICEL Corporation (Osaka, Japan). (b,c) standards of α-pinene and β-pinene only using a Hypercarb® (150 mm × 4.6 mm, 5 µm).
Separations 09 00183 g001
Figure 2. Overlay of EIC chromatograms: (black line) m/z 136.1599 for monoterpenes, (red line) m/z 153.1645 for oxygenated monoterpenes, (blue line) m/z 204.2306 for sesquiterpenes.
Separations 09 00183 g002
Figure 3. Comparison of chromatographic profiles of bergamot, mandarin, orange, grapefruit and lemon essential oils obtained by SFC-UV. Chromatographic conditions: CO2 (A) and methanol (B) mobile phase, flow rate of 1.5 mL/min, gradient mode: 0.0–3.0 min (0% B), 3.0–16.0 min (0–10% B), 16.0–17.0 min (10–0% B) and 17.0–19.0 min (0% B): (grey line). Two columns in series: Hypercarb® (150 mm × 4.6 mm, 5 µm) and Poly-(butylene terephthalate) DCpack PBT(150 mm × 4.6 mm, 5 µm). Identified peaks (1) α-pinene, (2) β-pinene, (3) γ-terpinene, (4) limonene, (5, 6) citral.
Separations 09 00183 g003
Table 1. Chemical compositions (area %) of lemon essential oil using GC-FID data, relative measure of the dispersion of data around the mean (CV%) calculated using ratio of the standard deviation to the mean, predictive response factors for gas chromatography with flame ionization detection RRF (relative response factor), corrected FID area percentage using RRF [24].
Retention Time (min)CompoundRetention IndexFID Average Area%Standard DeviationCV%RRFFID Average Area% Corrected Using RRF
3.82α-Pinene 10322.260.0391.710.7652.25
4.19Camphene1075NDNA 0.7650.00
4.60β-Pinene 111615.590.2421.550.76515.51
4.70Sabinene1123NDNA 0.7650.00
5.08Myrcene11451.070.0454.240.7651.07
/UnidentifiedNot applicable0.090.02427.3210.11
5.69Limonene117867.060.1370.200.76566.72
5.84β-phellandrene12090.050.00510.160.7650.05
6.34γ-terpinene12389.460.0260.270.7659.41
6.77p-cymene12610.310.0072.350.6980.28
6.94Terpinolene 12760.360.0041.070.7650.36
10.50Citronellal14880.050.0012.850.8690.06
/UnidentifiedNot applicable0.030.02791.1610.04
11.63Linalol15370.150.02013.100.8870.17
12.44α-E-bergamotene15840.320.03812.040.7510.31
12.81E-caryophyllene15940.200.03014.930.7510.200
14.43Neral16670.490.0061.290.8870.56
14.59α-terpineol16880.200.0010.690.8690.22
/UnidentifiedNot applicable0.370.0338.7410.49
15.05β-bisabolene17140.520.05610.820.7510.51
15.33Geranial17151.060.0656.090.8871.23
/UnidentifiedNot applicable0.060.0035.8410.08
15.58Geranyl acetate17110.300.0072.480.9570.38
Table 2. Chemical compositions (area %) of lemon essential oil using SFC-UV data. Two columns in series were used for chromatography, i.e., a Hypercarb® (150 mm × 4.6 mm × 5 µm, Thermo Scientific, Waltham, Massachusetts, USA) and a Poly-(butylene terephthalate) DCpack PBT (150 mm × 4.6 mm × 5 µm, DAICEL Corporation, Osaka, Japan). UV Detection was performed at a fixed wavelength of 220 nm.
RT (min)CompoundAbsolute AreaRetention Factor k’
6.89α−pinene (C10H16)239.151.8
7.46β−pinene (C10H16)834.152.0
7.84sabinene (C10H16)500.302.1
10.49γ-terpinene (C10H16)1944.302.8
10.98Unidentified452.51/
11.18limonene (C10H16)1884.733.0
11.41Unidentified79.89/
14.66neral (C10H16O)609.484.1
15.48bisabolene (C15H24)24.024.4
15.87caryophyllene (C15H24)33.084.5
16.38geranial (C10H16O)1029.024.7
16.98C15H2432.204.8
Table 3. Regression line equation, correlation coefficients (R2), and limits of detection (LOD) and of quantification (LOQ) for limonene. Concentration range for was between 4.85 and 0.15 g/100 g for both GC-FID and SFC-UV.
MethodRegression Line EquationR2LOD (%)LOQ (%)
GC-FIDy = 2276794x − 105040.9940.0290.108
SFC-UVy = 329.76x − 6.650.9980.0200.055
Publisher’s Note: MDPI stays neutral with regard to jurisdictional claims in published maps and institutional affiliations.

