Article

Inter-Comparisons of Major Ions and Organic Matter Using Aerodyne Aerosol Mass Spectrometer, Ion Chromatography and Sunset Lab Carbon Analyzer in Aged Aerosols from Okinawa in the Western North Pacific Rim

1
Institute of Low Temperature Science, Hokkaido University, N19 W8, Kita-ku, Sapporo 060-0819, Japan
2
Chubu Institute for Advanced Studies, Chubu University, 1200 Matsumoto-cho, Kasugai 487-0027, Japan
3
Graduate School of Environmental Science, Hokkaido University, N11 W5, Kita-ku, Sapporo 060-0810, Japan
4
Regional Environment Conservation Division (RECD), National Institute for Environmental Studies (NIES), Tsukuba 305-8506, Japan
*
Author to whom correspondence should be addressed.
Separations 2022, 9(12), 430; https://doi.org/10.3390/separations9120430
Submission received: 3 October 2022 / Revised: 4 December 2022 / Accepted: 7 December 2022 / Published: 11 December 2022
(This article belongs to the Special Issue Extraction and Analysis of Emerging Environmental Pollutants)

Abstract

:
Inorganic components were measured in the aged ambient aerosols from Cape Hedo, Okinawa, an outflow region of East Asia, using online quadrupole Aerodyne aerosol mass spectrometer (Q-AMS) and offline ion chromatography (IC) and Sunset Lab carbon analyzer. Here, we performed an inter-comparison study on nitrate (NO3), ammonium (NH4+) and sulfate (SO42−) that were measured by IC and AMS. Sulfate and ammonium showed a good agreement between two instruments. However, abundances of NO3 by AMS are on average twice overestimated compared to nitrate obtained by IC. We also found that a significant amount of organic nitrogen (ON) was detected in the filter samples from Okinawa. The online measurement (Q-AMS) data and offline filter based-NO3 data need to be carefully evaluated when ON is abundantly present in aerosols. The OM/OC ratios derived from AMS are consistent with the bulk OMAMS/OCSunset ratios (2.1). This study demonstrates that the OM/OC of 2.1 is the reasonable criteria for more aged aerosols.

1. Introduction

The importance of atmospheric aerosols has been widely documented in various fields and laboratory studies [1,2,3]. Atmospheric aerosols have significant impacts not only on local and regional air pollution, but also on the global climate. Recent measurement techniques have greatly improved to understand aerosols’ chemical and physical parameters [4,5,6]. In particular, Aerodyne Research has developed a mass spectrometric analyzer for aerosol’s real-time measurements, which is referred to as the Aerosol Mass Spectrometer (AMS) [7,8,9]. The AMS provides a size-resolved chemical composition of non-refractory submicron aerosols, with an integration time of the order of seconds/minutes [10,11,12]. Several studies evaluate the performance of the AMS based on intercomparison with other aerosol measurements. AMS is an advanced aerosol composition measurement technology that was widely used, but it needs to be calibrated or compared with standard instruments before use in different environments (e.g., urban or remote) [8,9,13,14,15,16,17].
Inorganic and organic nitrogen compounds are present abundantly in the atmosphere and contribute to the total atmospheric nitrogen budget [18,19,20,21,22]. The nitrogen deposition in aerosols mainly emphasizes only the inorganic fraction (i.e., NH4+ and NO3) [23]. Recently, more studies on organic nitrogen (ON) can constitute a significant fraction of total (inorganic + organic) nitrogen in ambient aerosols [24,25,26,27].
We conducted aerosol measurements in Cape Hedo, Okinawa using an AMS to compare the online measurements to other offline measurements such as Sunset Lab carbon analyzer for organic carbon (OC) and elemental carbon (EC) and ion chromatography (IC) for major cations and anions. The ion and OC/EC data are used for the inter-comparison with AMS-derived organic matter (OM). The principal purpose of this paper is to evaluate an agreement and disagreement between AMS data and major ions and organic carbon (OC).

2. Samples and Analytical Procedure

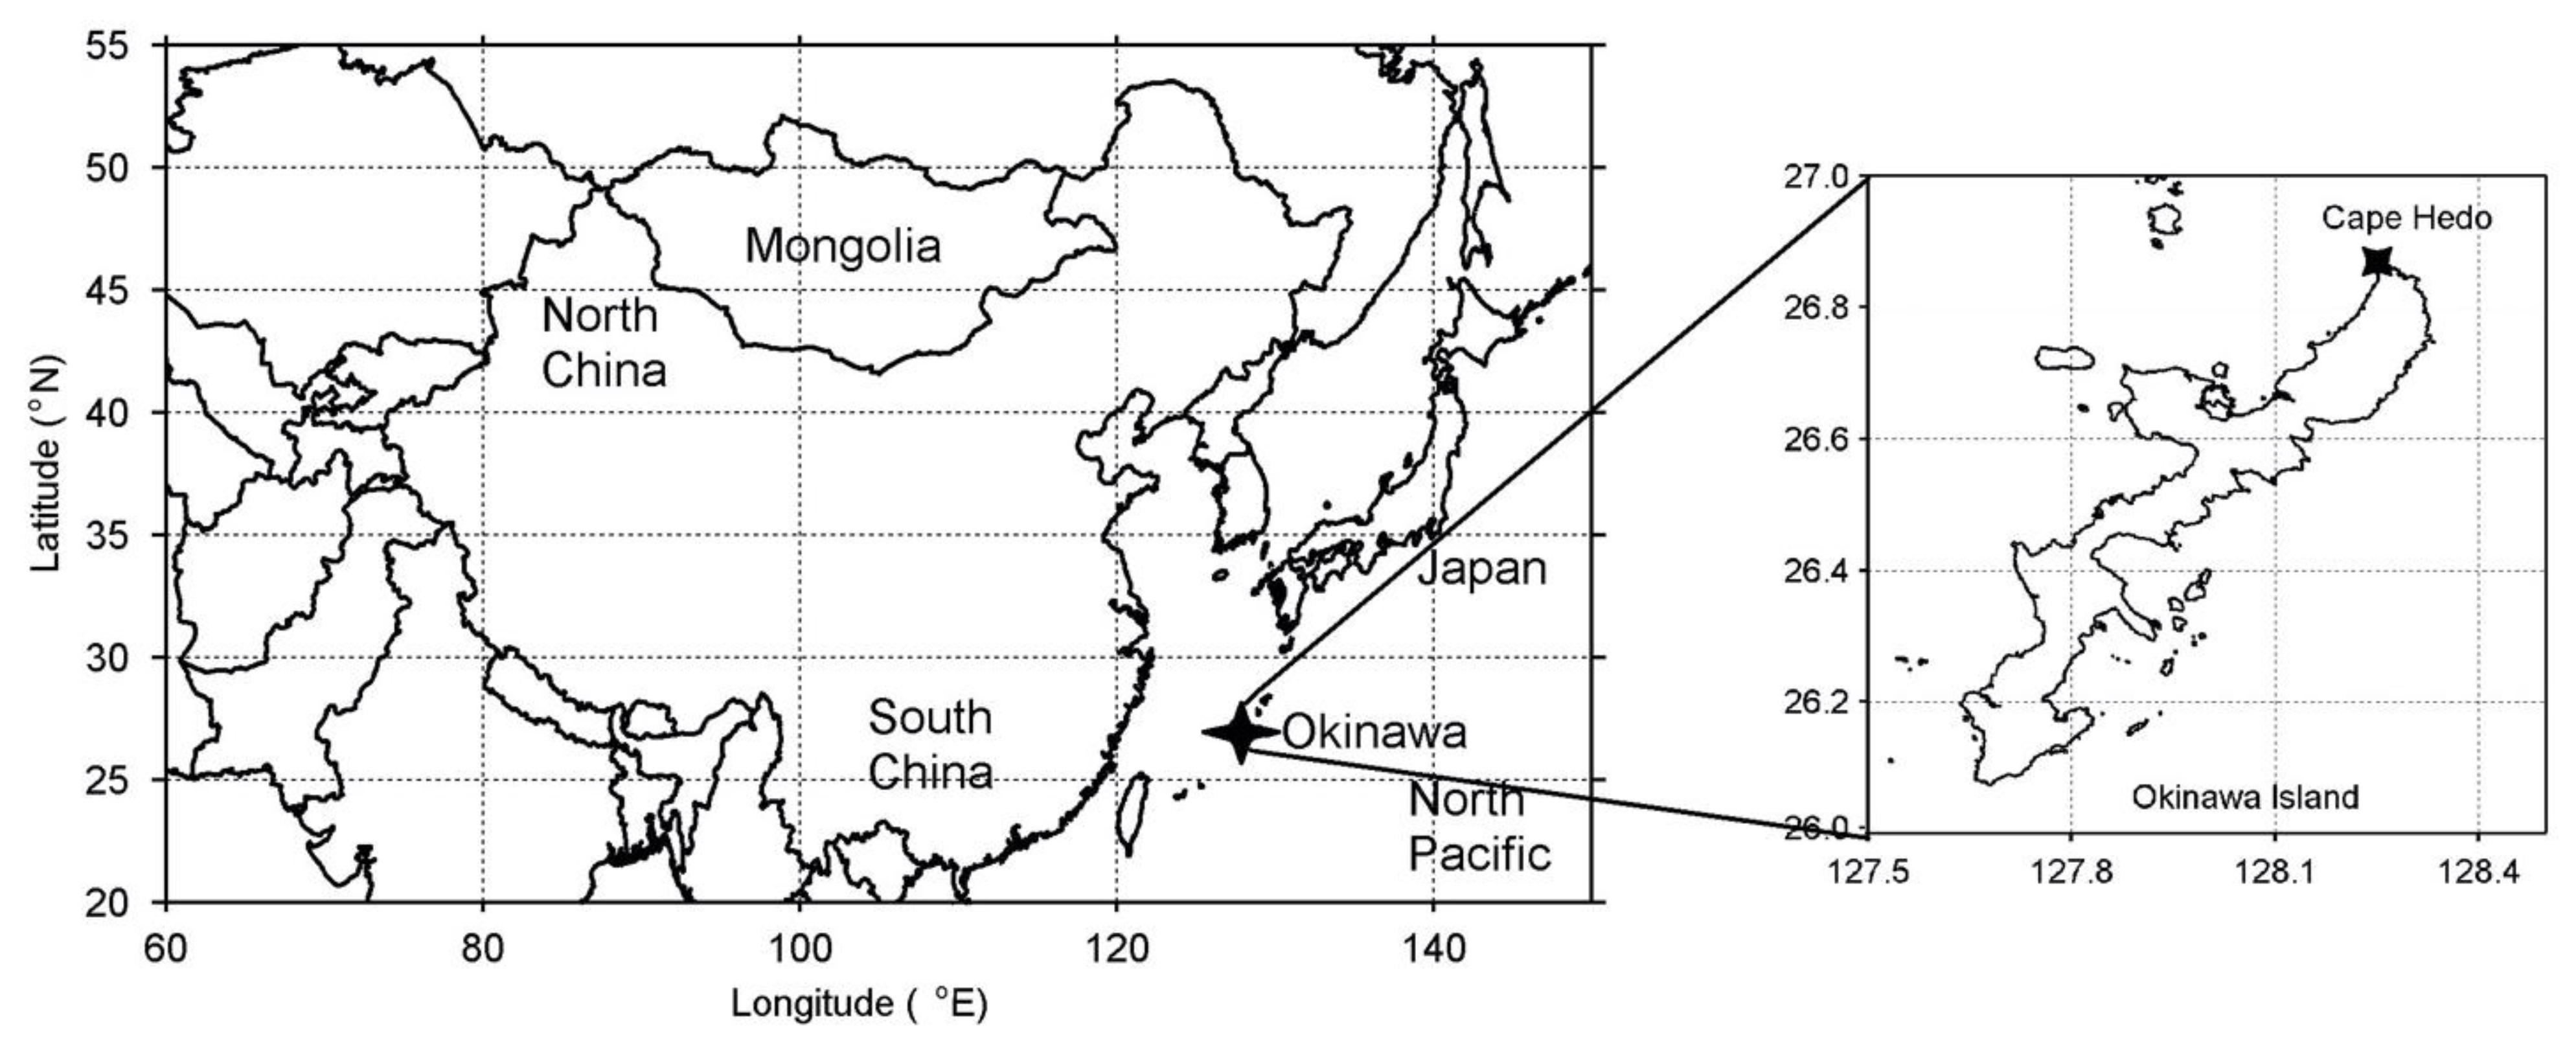
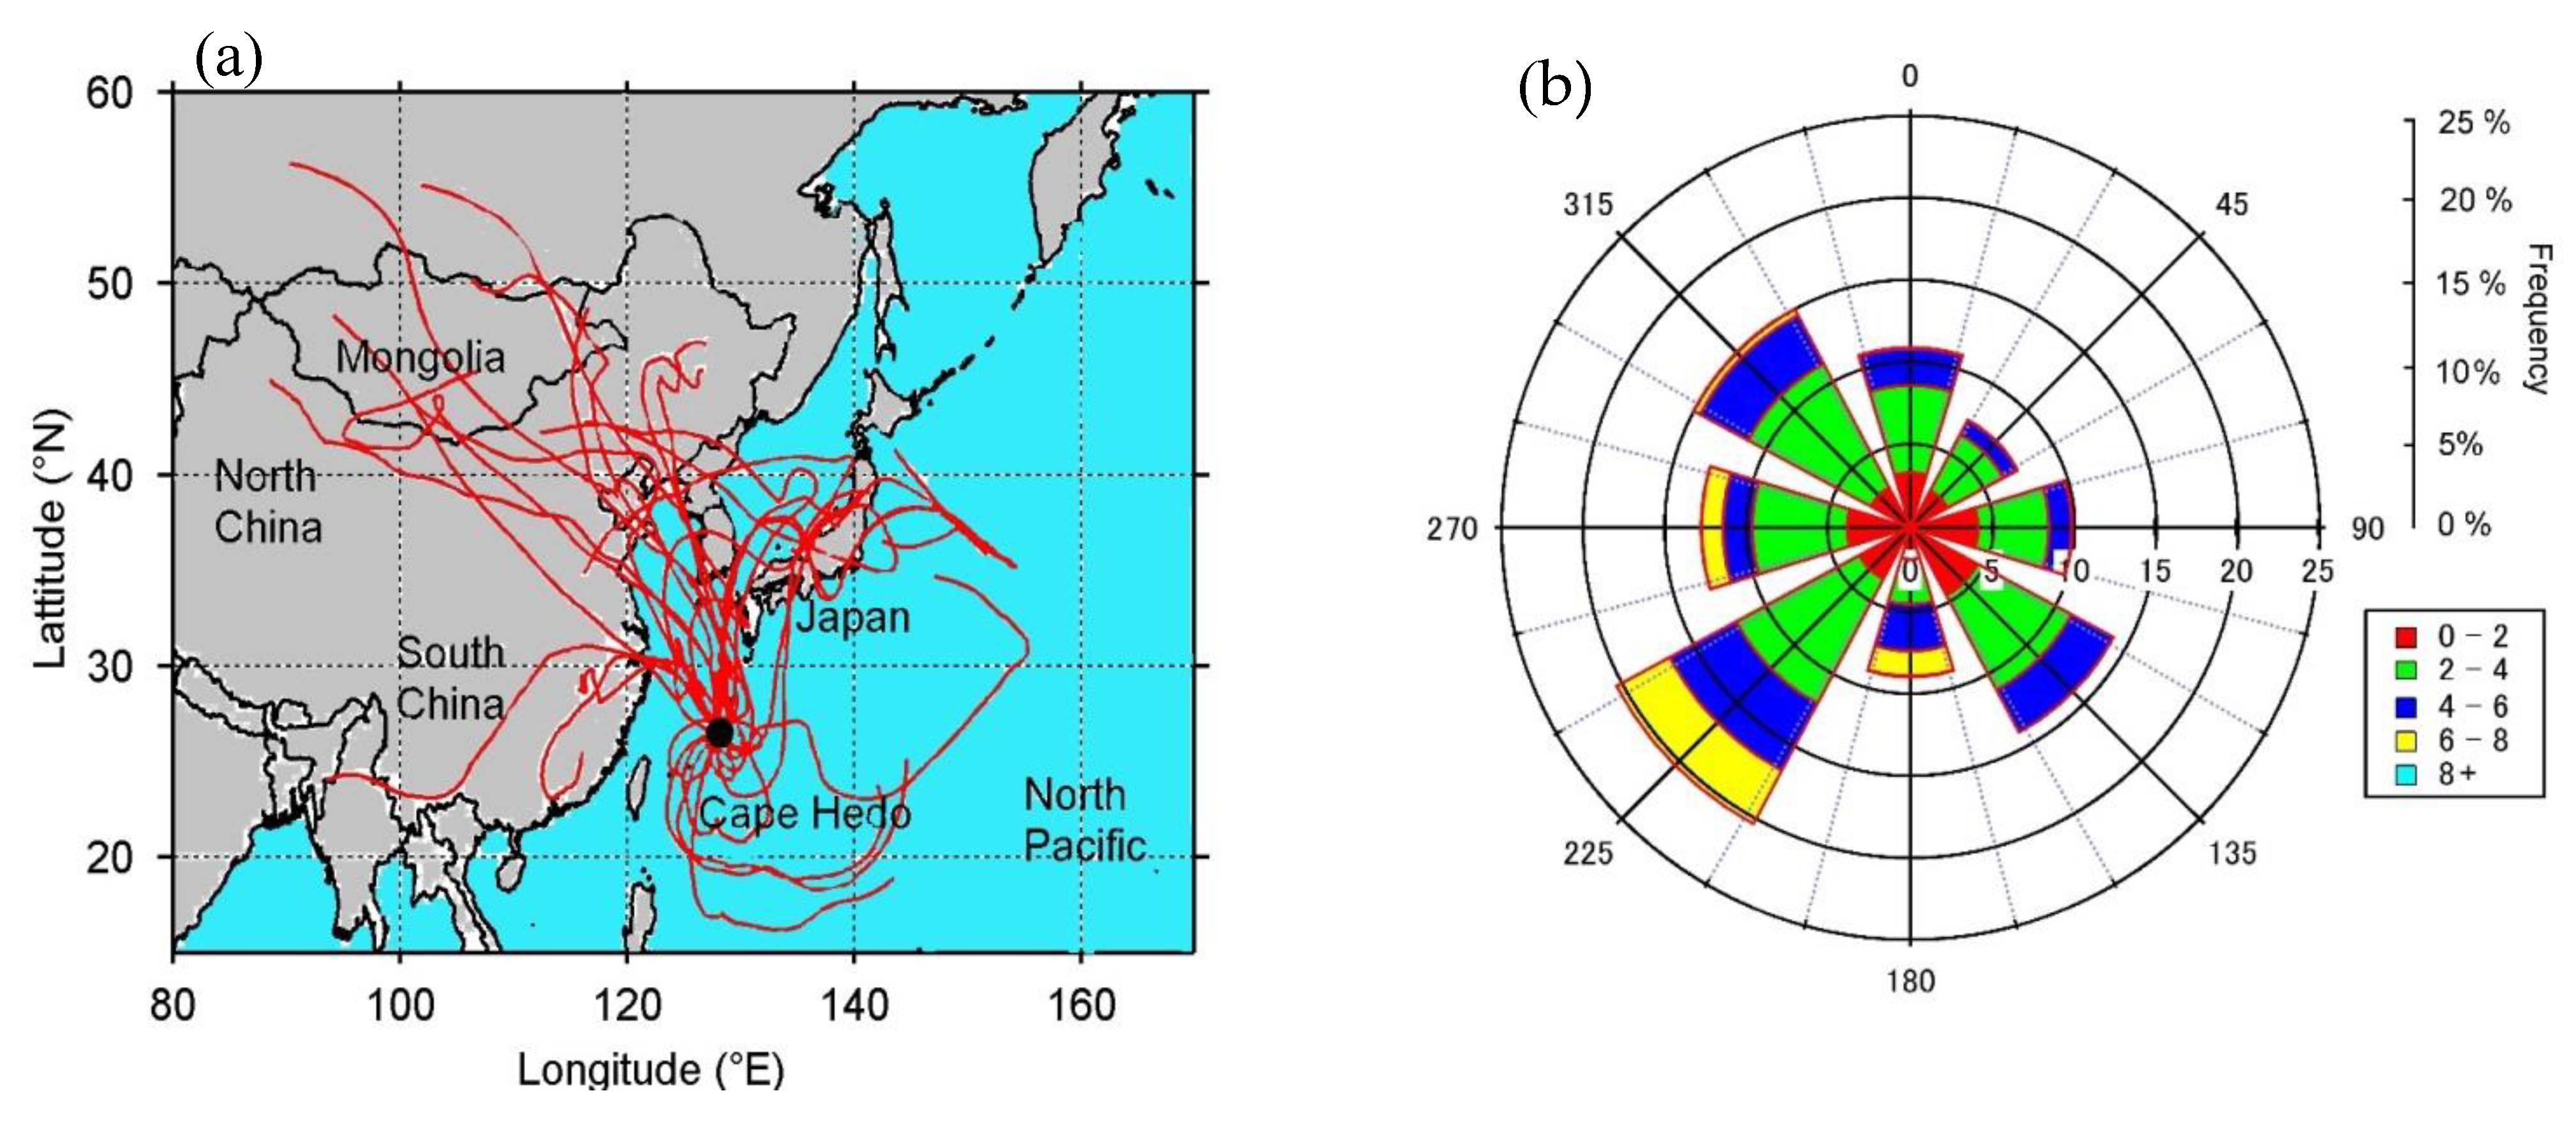
2.1. Site Description and Aerosol Sampling

Aerosol samples (PM1.0, n = 28) were collected from 17 March 2008 to 13 April 2008 using low volume air sampler (URG-2000-30EHB; URG Corp) at a flow rate of 16.7 L/min. and pre-combusted (450 °C, 4 h) quartz fiber filters (Pallflex 2500QAT, 47 mm in diameter) at the roof top of Cape Hedo Atmosphere and Aerosol Monitoring Station (CHAAMS, 26°9′ N, 128°2’ E) [28,29]. Cape Hedo is located on the northwest coast of Okinawa Island, Japan, an outflow region of East Asia (Figure 1). Each sample was collected for 24 h. Blank filters (n = 4) were collected every week. Each sample was collected for 24 h. The filter samples were stored in a preheated glass vial (50 mL) with a Teflon-lined screw cap in darkness at −20 °C until the analysis. At the same time, we operated the Aerodyne quadrupole aerosol mass spectrometer (AMS) for the real time measurements [29]. Figure 2a,b show the back trajectory analysis and wind speed.

2.2. Offline Chemical Analysis

Filter samples (PM1.0) were analyzed for OC and elemental carbon (EC) using a Sunset Laboratory carbon (OC/EC) analyzer following Integragency Monitoring Protected Visual Environments (IMPROVE) thermal/optical evolution protocol [28]. Major ions (NO3, SO42− and NH4+) were determined by ion chromatography (IC, 761 Compact IC, Metrohm, Switzerland). The detection limits for anions and cations were ca. 0.1 ng m−3. SO42− (0.003 ng m−3) is detected in the field blanks whereas NO3 and NH4+ are not detected in the blanks. The analytical errors in the replicate analysis of authentic standards were within 5% for major ions, OC and EC. The detection limits of OC and EC are 0.2 μg/cm2. EC was not detected in the field blanks.
The concentration of total nitrogen (TN) was measured using an elemental analyzer (EA) (Carlo Ebra, EA 1500). A small filter disc with the known area (3.14 cm2) was placed in a tin cup and combusted at 1400 °C in an oxidation column of EA system. All the nitrogen species are converted to NO and then reduced to N2 in a reduction column. The reduced N2 was measured with a thermal conductivity detector after the purification using a packed GC column to isolate N2 from CO2 [30,31,32]. The analytical error for duplicate analysis is less than 10%. Organic nitrogen (ON) can be calculated using the following equation [32].
ON = TN (EA) − IN (IC)
where IN means inorganic nitrogen obtained by the summation of nitrogen contents of NH4+ and NO3 measured by IC. Measurements of OC, TN and major ions were completed in 2009.

2.3. Online Aerodyne AMS Measurements

At the Cape Hedo station in Okinawa Island, the Aerodyne quadrupole AMS was operated with a time resolution of 10 min [29]. In AMS, aerosols are separated from gaseous species by an aerodynamic lens and vaporized at 600 °C on a vaporizer. Vaporized molecules are ionized by the standard electron impact ionization at 70 eV. The positive ions are analyzed in a quadrupole mass spectrometer by providing the mass spectra of aerosol components. The size cut of the aerodynamic lens is approximately PM1.0 [14].
The AMS data are averaged for the integration time of filter samples, i.e., 24 h. AMS quantified data were converted to organic aerosol masses using the following equations [14]
M m / z = 1 C E o r g ¯   1 R I E o r g ¯   M W N O 3 I E N O 3   10 12 Q N A S m / z
  OA = m / z M m / z ( m / z = 1 300 )
where CE ¯ org and RIE ¯ org denote the average particle collection efficiency and relative ionization efficiency (RIE) for organics, respectively. MWNO3 (62 g mol−1) indicates the molecular weight of nitrate, whereas IENO3 indicates ionization efficiency of ammonium nitrate. Q denotes a sample flow rate in cm3s−1, and NA represents Avogadro’s number. Sm/z (Hz) is the signal of count rate at the m/z originating from organic compounds and obtained by subtracting the signals from the ambient gas molecules, inorganic species and instrumental artifacts. On the other hand, IENO3 represents the determined monodispersed ammonium nitrate particles from the calibration unit. The uncertainty in determining IENO3 was estimated to be 14% [16]. The uncertainty in the RIE values for major inorganic compounds (sulfate, nitrate, chloride and ammonium) is considered to be small because the mass spectra of these compounds are well defined. The RIE ¯ org is 1.4, and the CE value is assumed to be 1 for inorganics [29].
The molar ratio of ammonium to sulfate is generally less than 2, and sometimes less than 1. SO42− is present as a mixture of (NH4)2SO4 (molar ratio = 2) and NH4HSO4 (molar ratio = 1) and H2SO4 (molar ratio = 0). In this study, the average molar ratio of NH4+ to SO42− is 1.14. Thus, the major chemical state is NH4HSO4. Deliquescence point of NH4HSO4 is 40% relative humidity (RH) at 25 °C [29]. In Okinawa, RH of ambient air was in between 40 and 87% and RH at the inlet of Q-AMS was between 17.2% and 69.1%. Thus, we consider that NH4HSO4 is present as liquid phase and that CE for liquid phase aerosols is 1 [8]. Therefore, aerosols that are measured in Okinawa during the study period mainly exist as liquid phase and thus CE = 1 is suitable. CE = 1 is used for all the species.

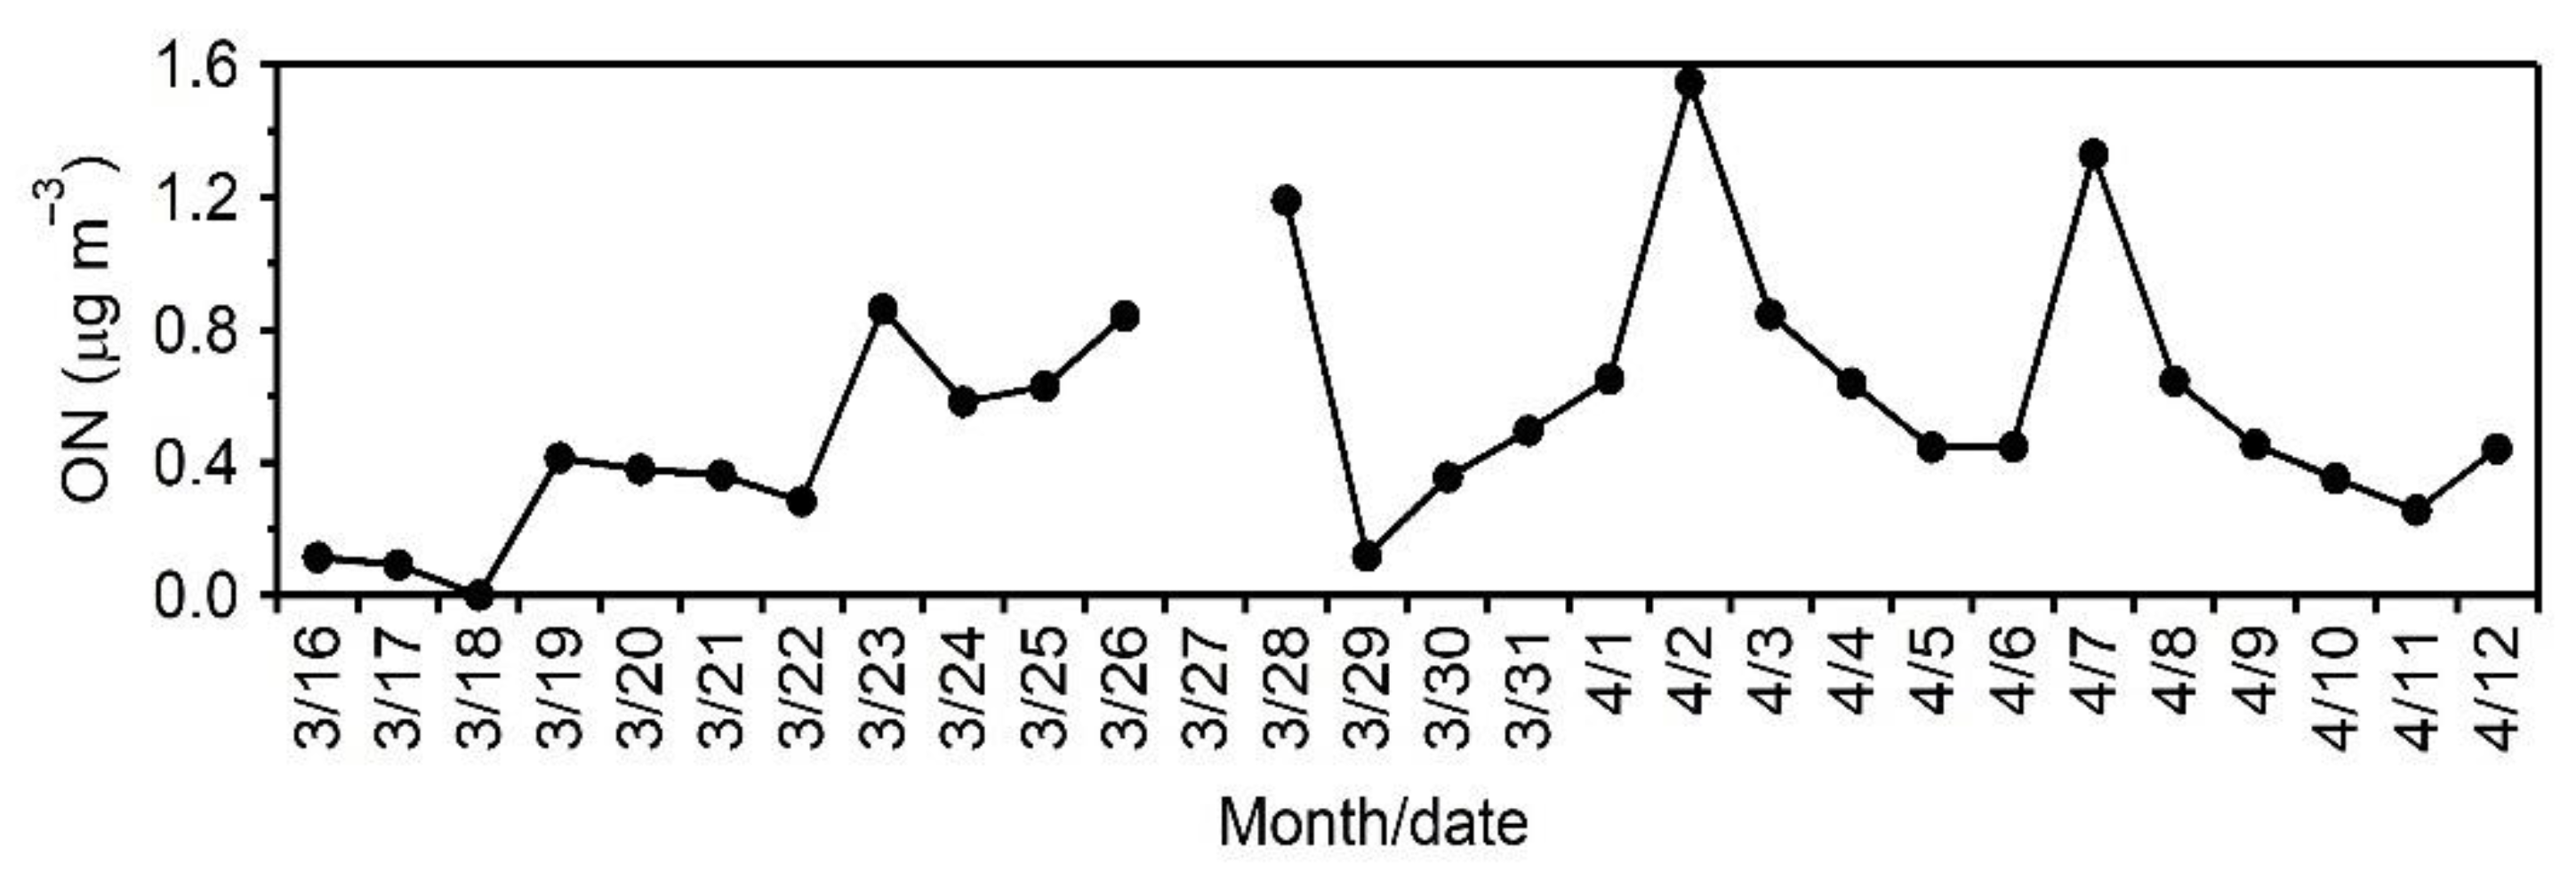
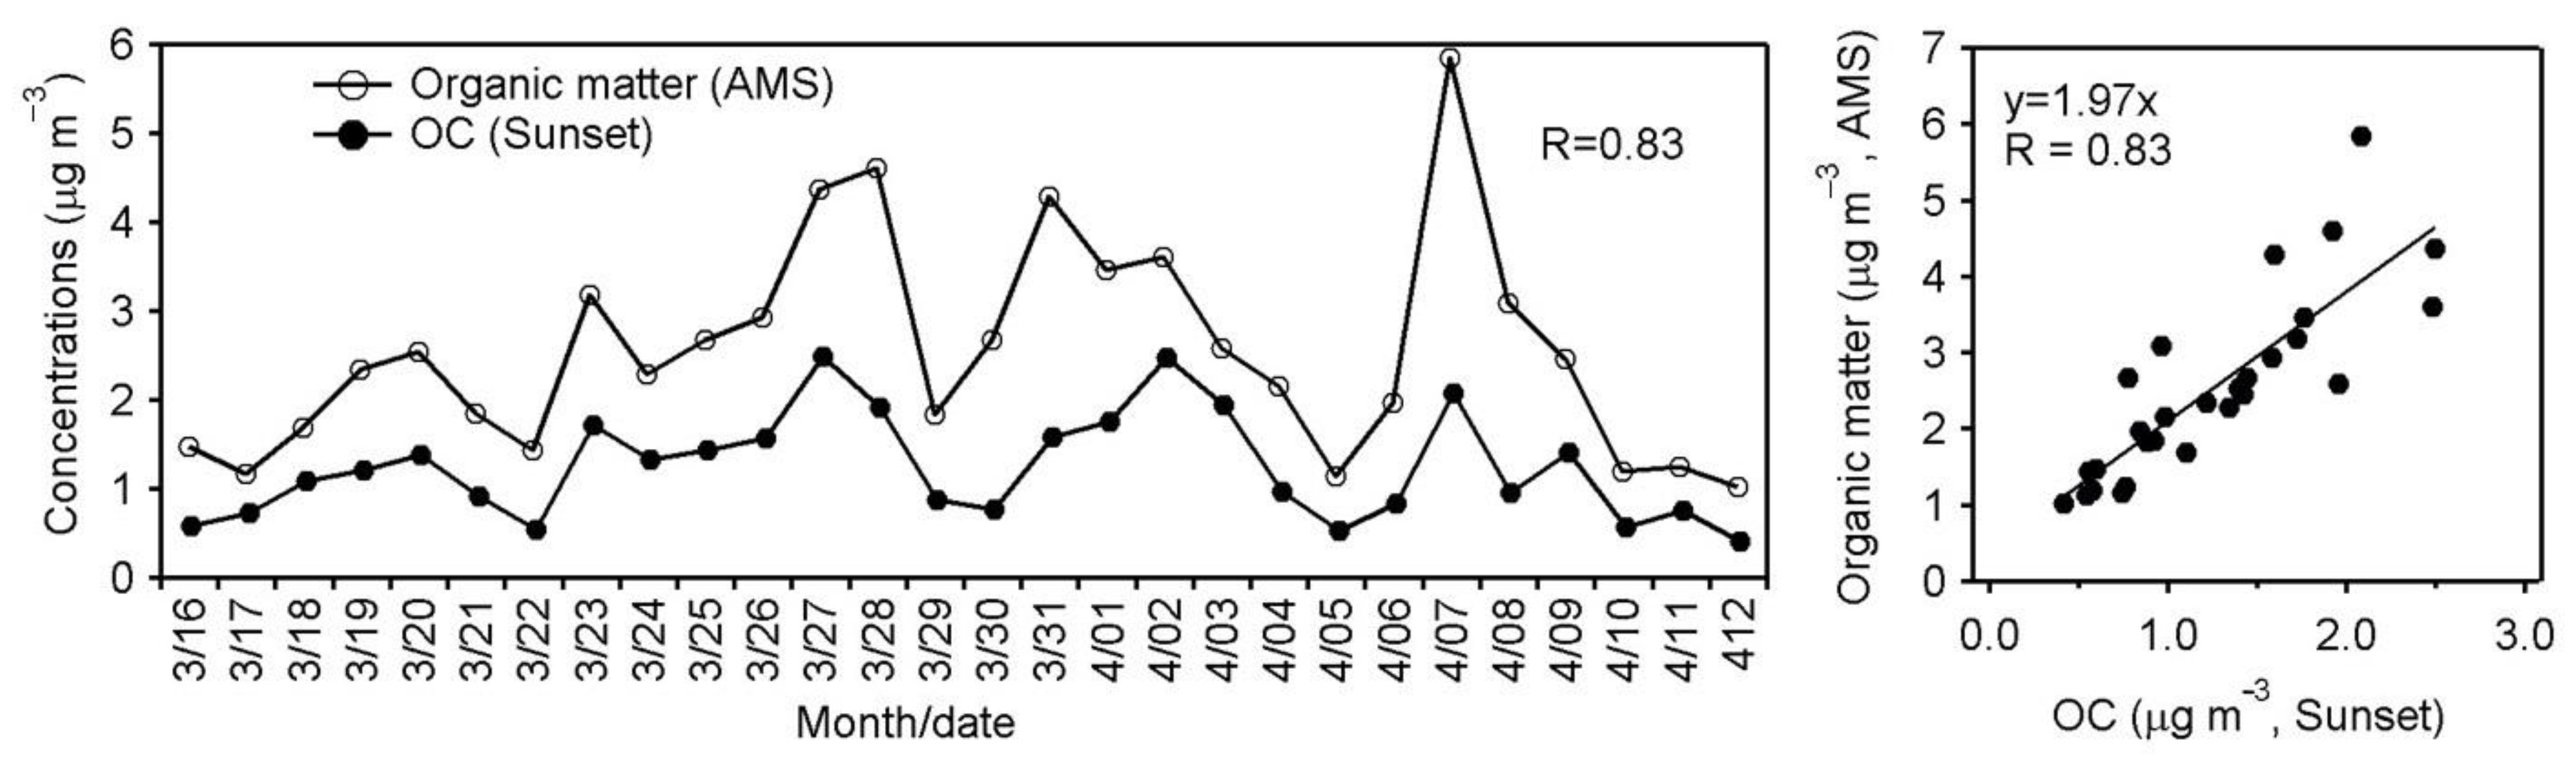
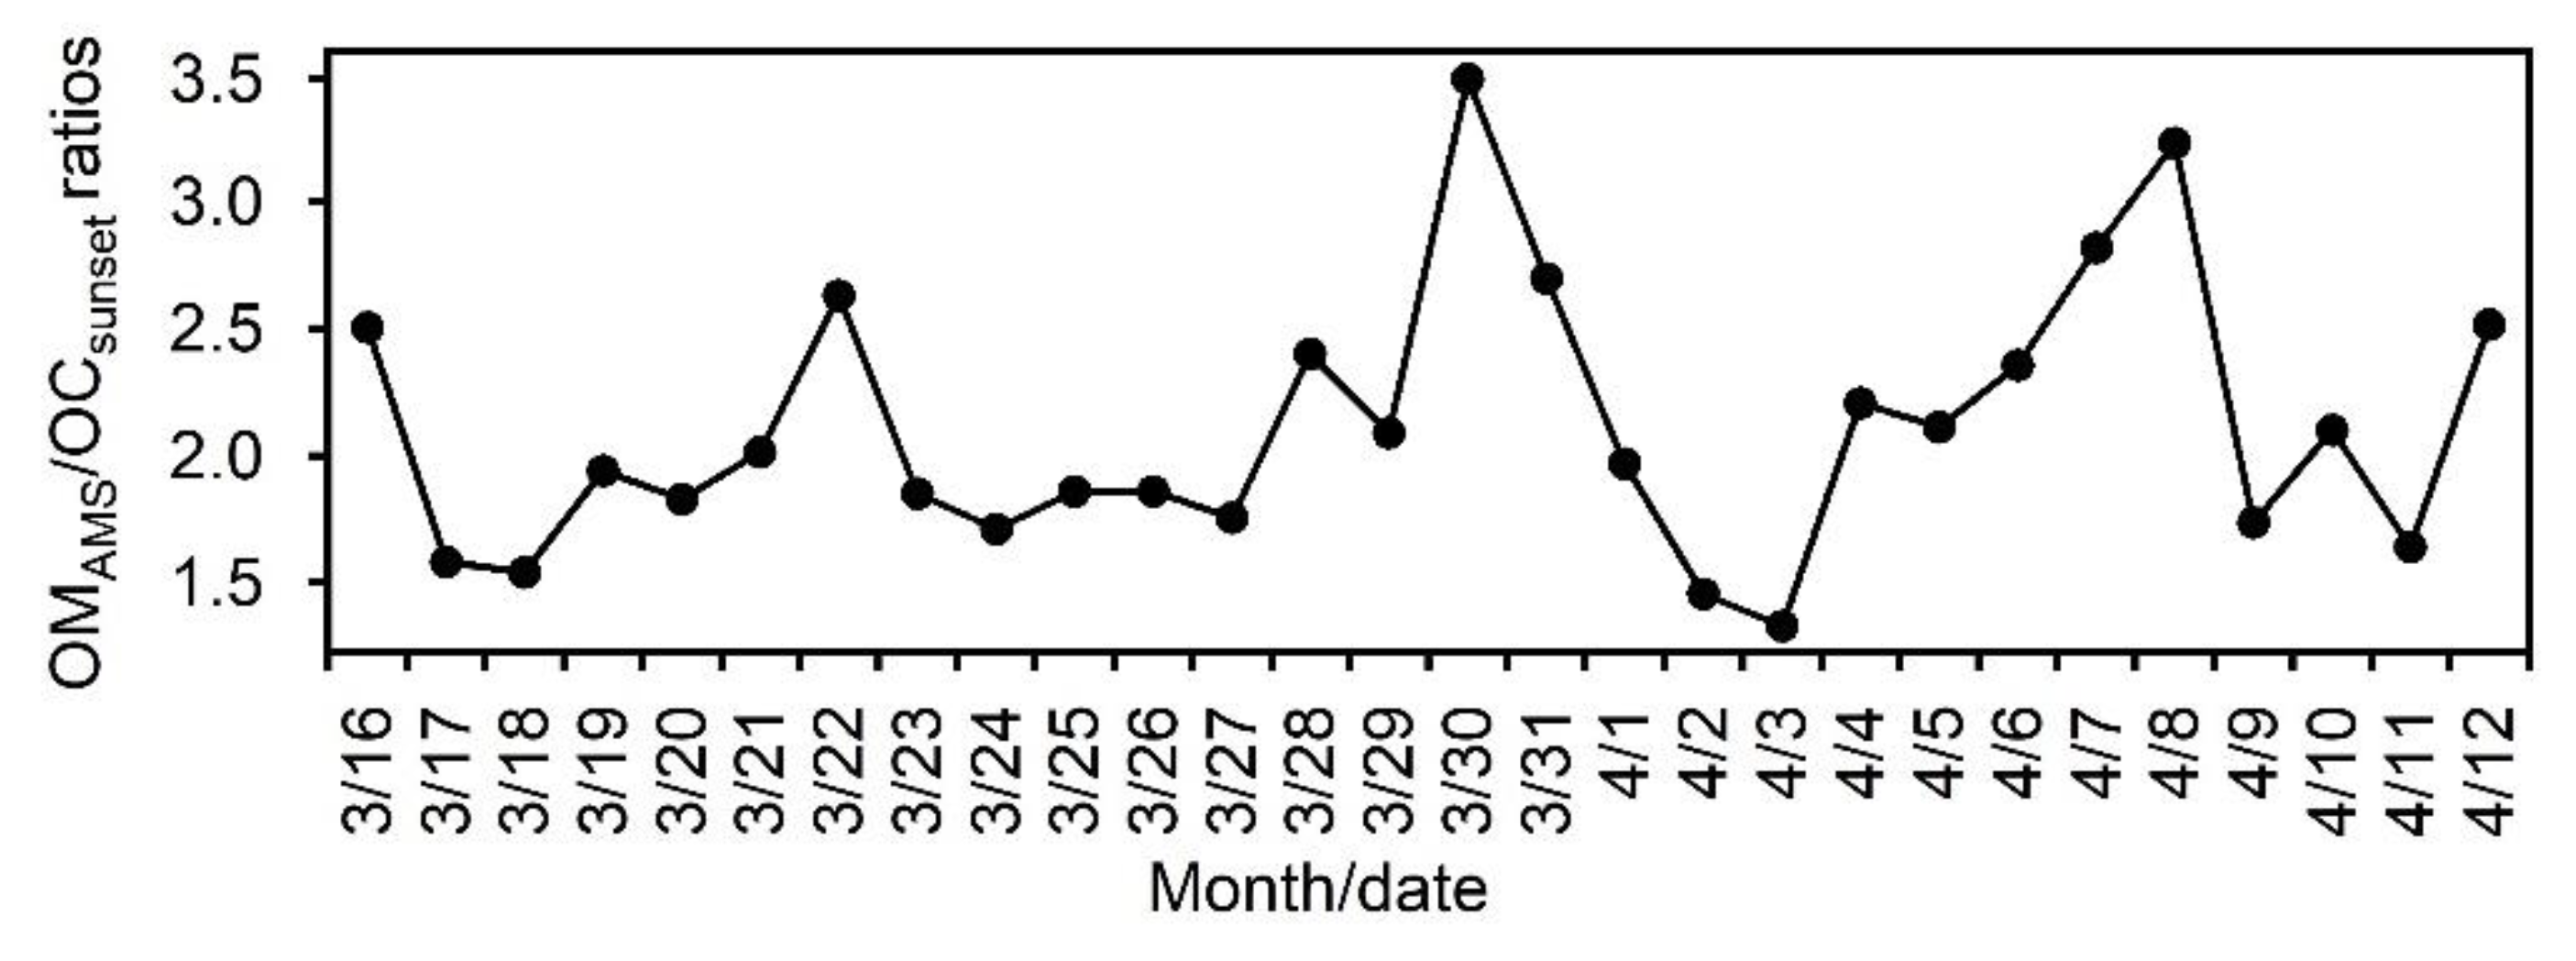
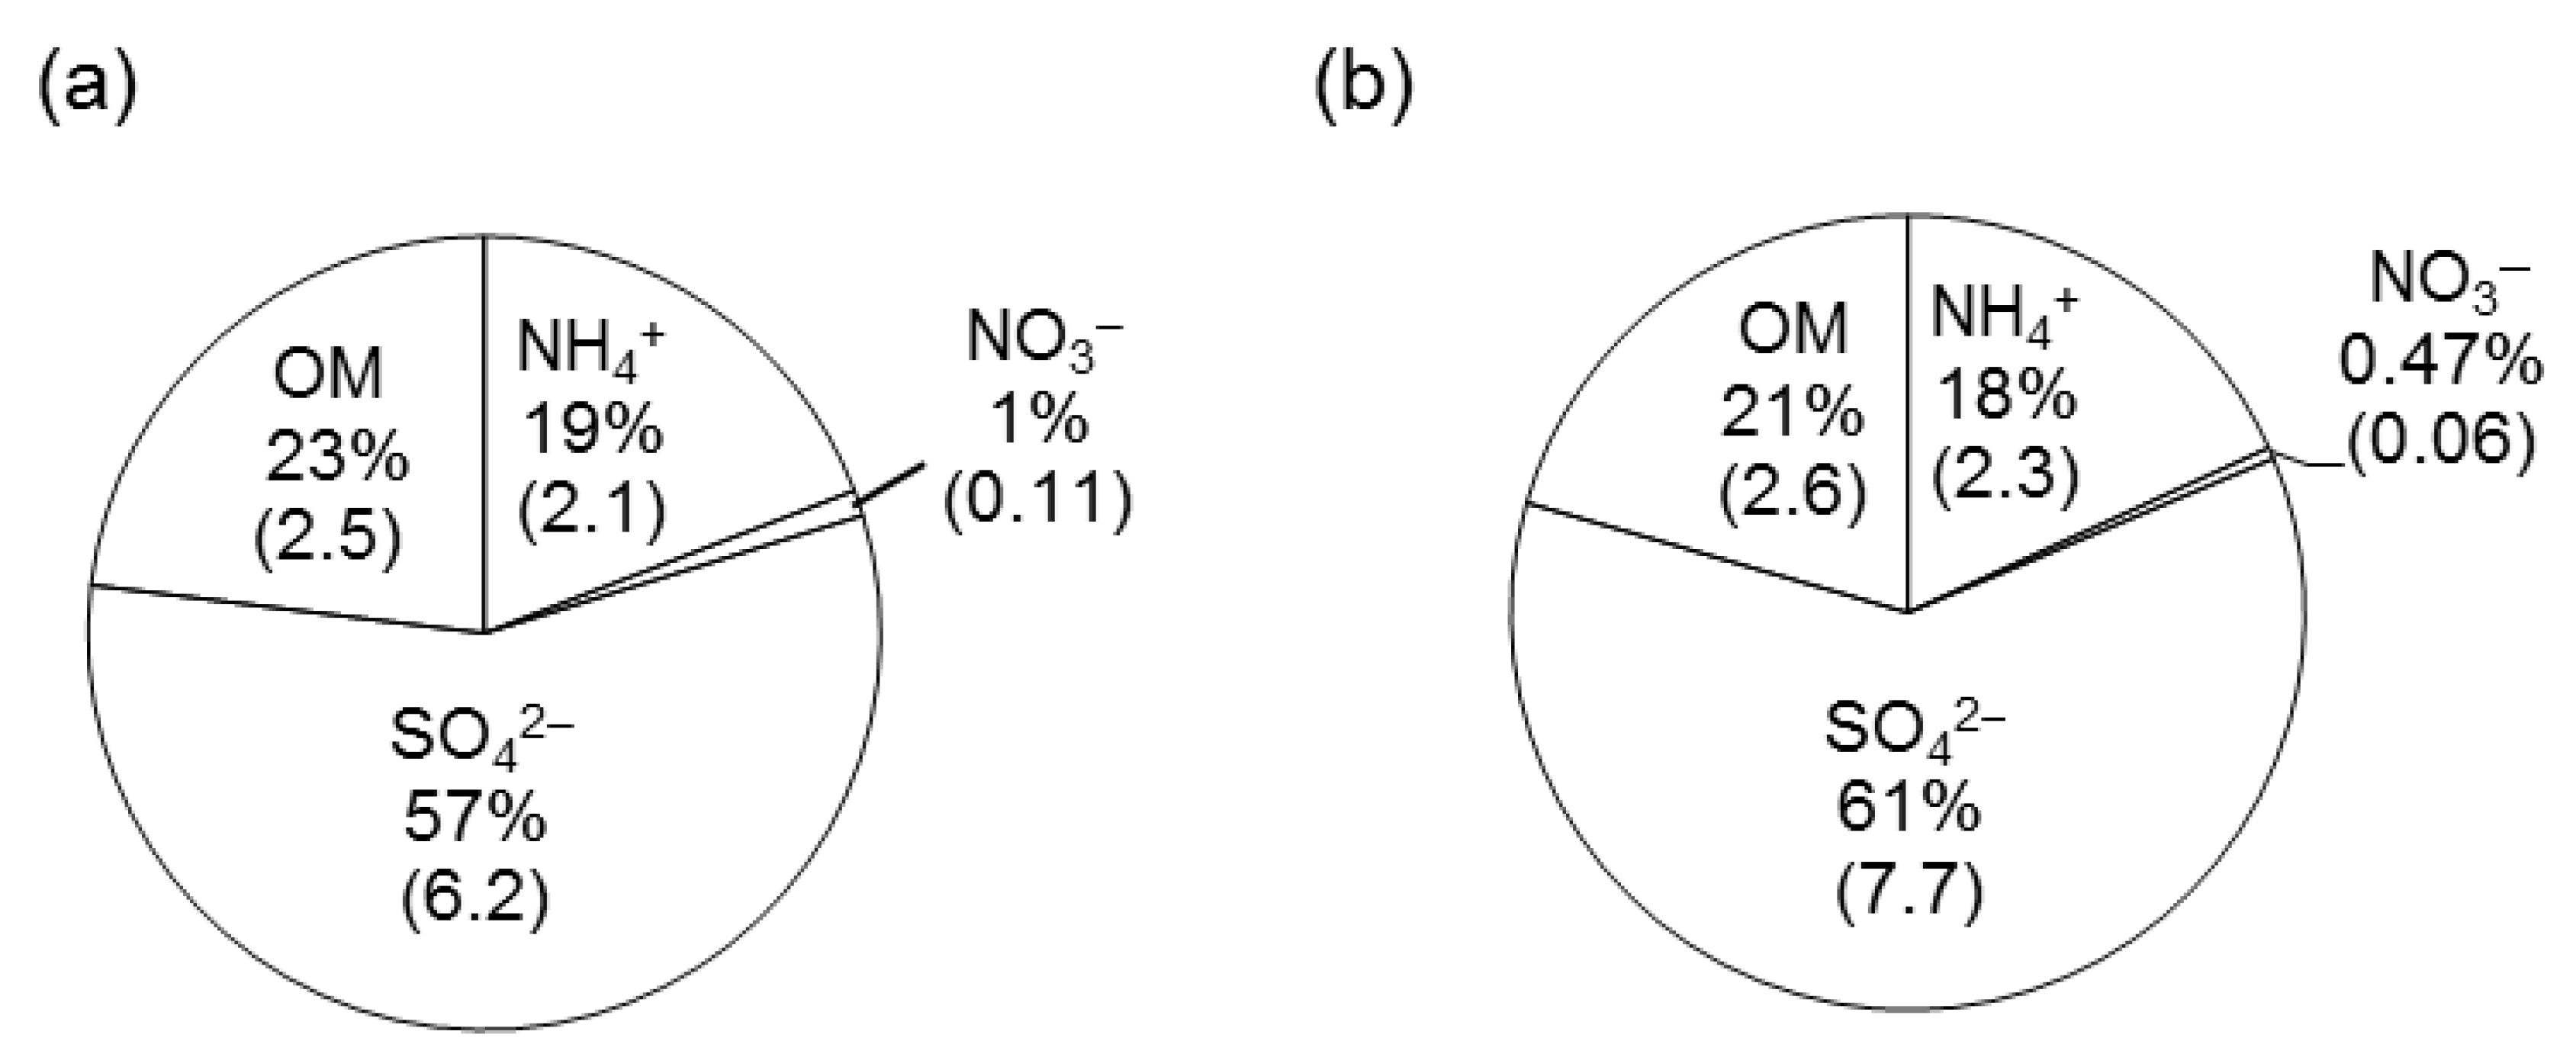
3. Results and Discussion

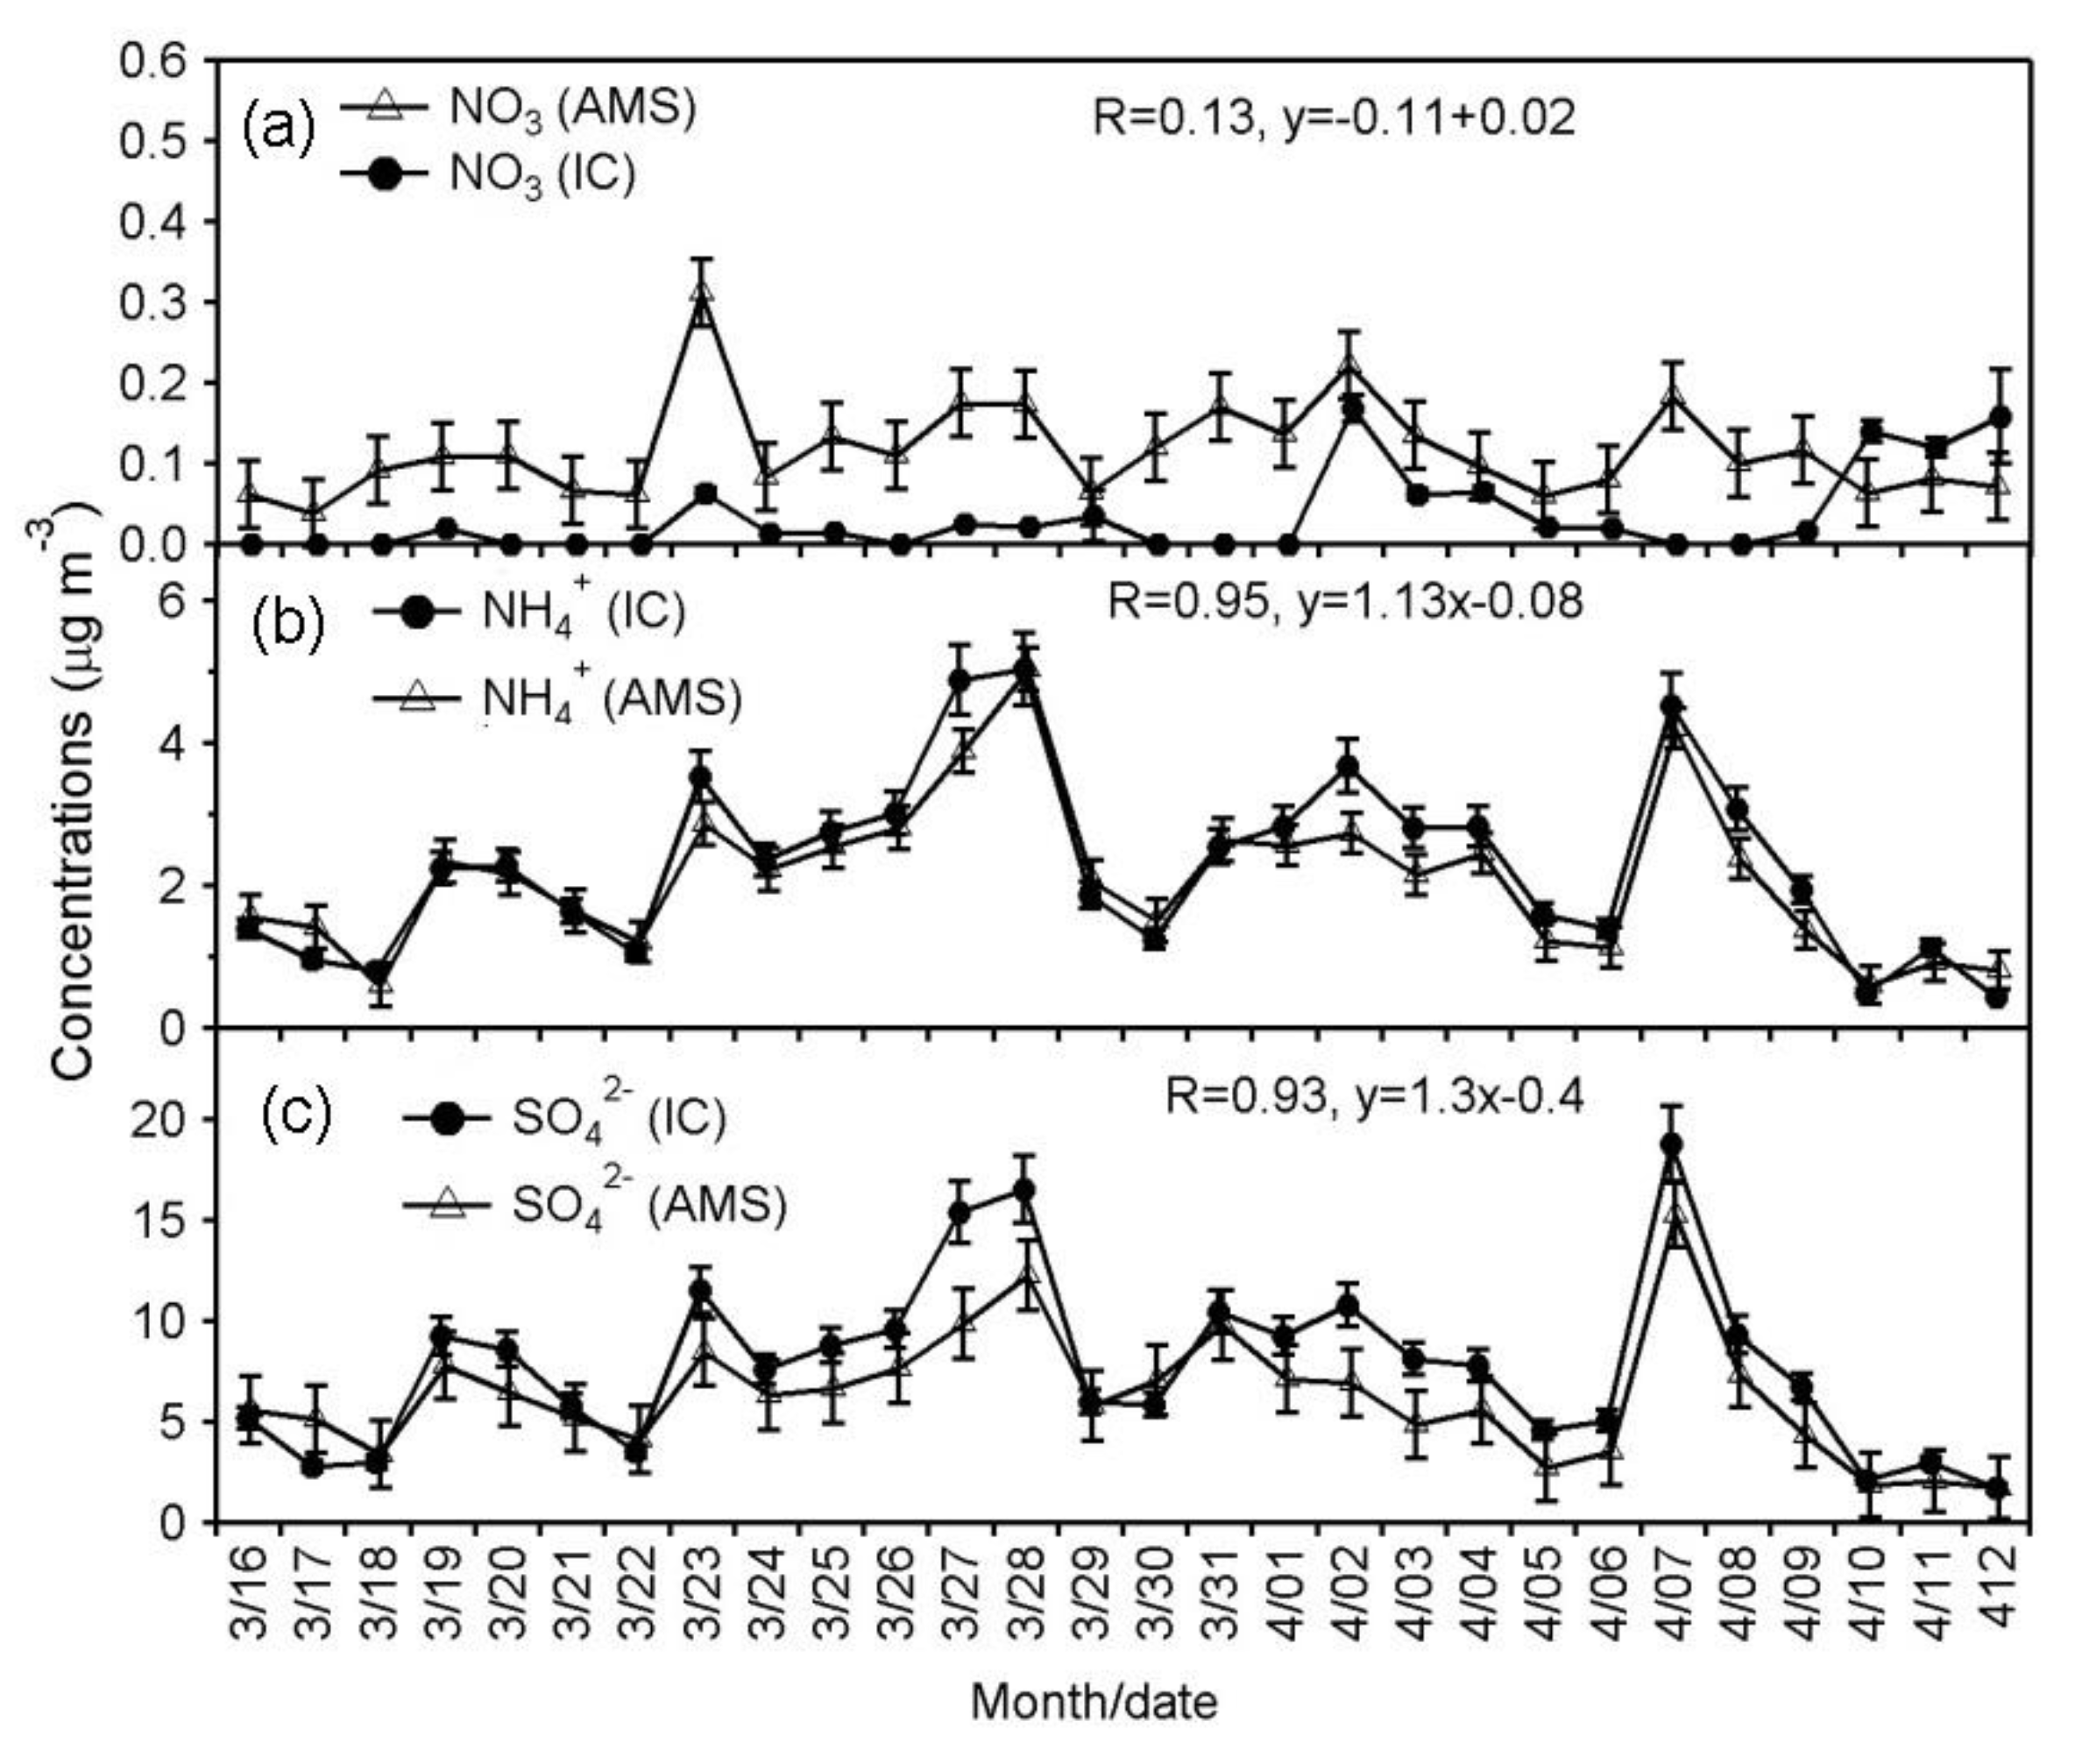
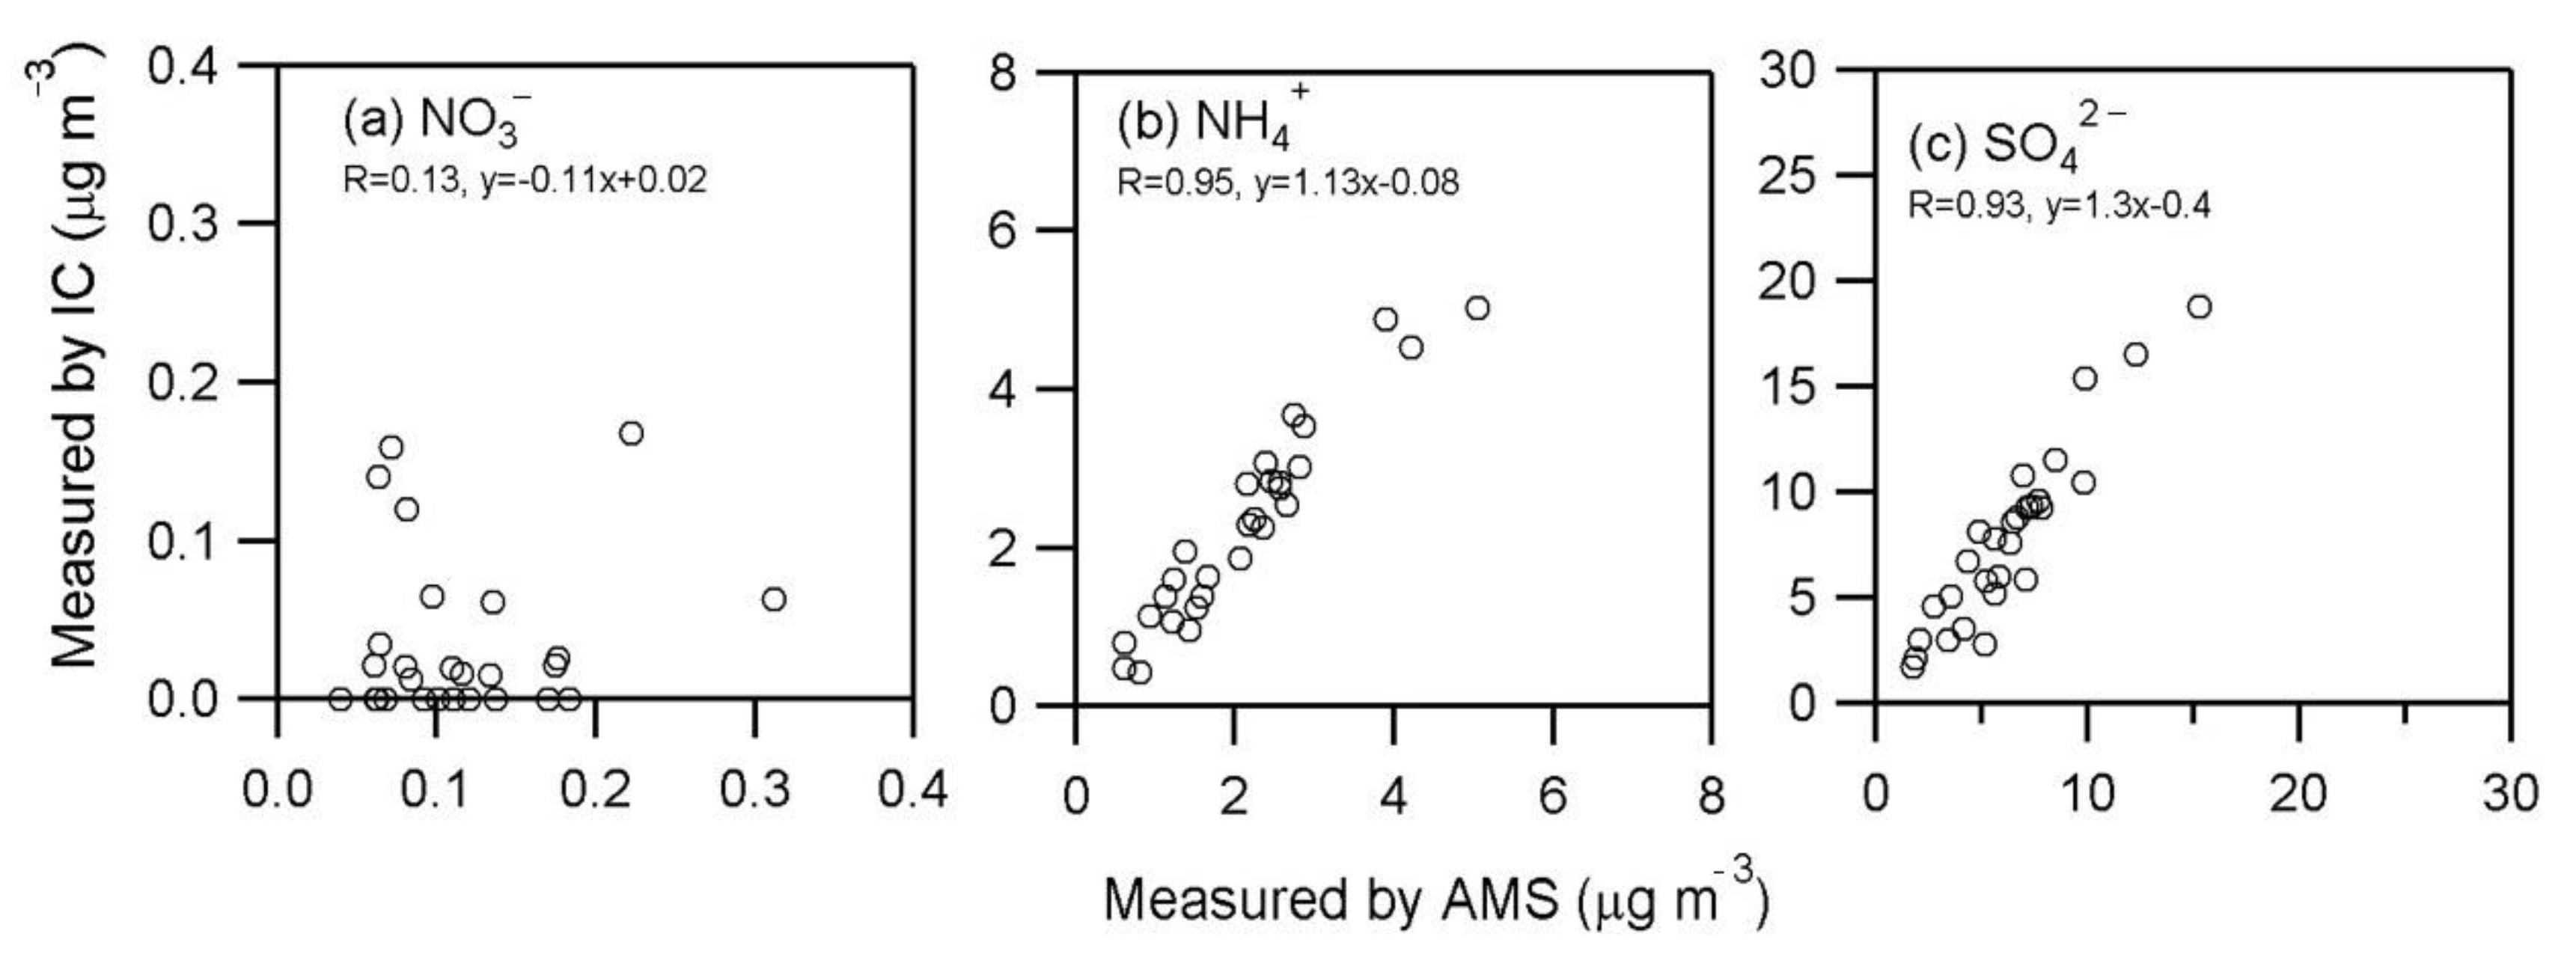
3.1. Comparison of Ions Obtained from Aerodyne AMS and Ion Chromatograph

Table 1 shows the data obtained from AMS, IC and Sunset Lab carbon analyzer. SO42- and NH4+ are mainly formed in the atmosphere via secondary processes [33,34]. The concentrations of SO42−IC and NH4+IC, which were both measured by IC, ranged from 1.7 to 18 μg m−3 (av. 7.7 ± 4.2 μg m−3) and 0.43 to 5.0 μg m−3 (2.3 ± 1.2 μg m−3), respectively, whereas those of SO42−AMS and NH4+AMS ranged from 1.7 to 15 μg m−3 (6.2 ± 3.0 μg m−3) and 0.60 to 5.0 μg m−3 (2.1 ± 1.0 μg m−3), respectively. Figure 3 presents temporal variations of SO42− and NH4+ measured by two methods. Figure 4 shows the scatter plots of NO3, NH4+ and SO42− between two instruments. As shown in Figure 4, the Pearson’s “r” values are 0.93 for SO42− and 0.95 for NH4+ (Press et al., 1992). However, we observed some difference in the concentrations of sulfate between AMS and IC: those by AMS are slightly lower than those by IC (Figure 5). The differences in NH4+ concentrations between two methods are smaller than those of SO42−. The F-test can be used for determining whether the variances of two samples (or groups) differ from each other. We performed statistical F-test using IBM SPSS statistics 25 software to compare between the two measurements.
We further performed an F test for two variances to identify whether difference is significant or not. F-test (one tail) is a statistical analysis used to evaluate the hypothesis test with the help of variance of two datasets or population. By the calculation, we can decipher whether the null hypothesis (H0) for the given data set is true or not. The standard p value is 0.05 (95% probability). If F > FCritical, then we will reject the null hypothesis, which means that the selected data sets are not equal. For F test (one tail), our null hypothesis is “both instruments measure the same thing.” For NH4+ (AMS) and NH4+ (IC), and SO42− (AMS) and SO42− (IC), F is <FCritical and p-value is less than or equal to 0.05. Hence, we accept our null hypothesis. Thus, there is no difference between the two measurements (see Table 2 and Table 3). Good correlations of NH4+ and SO42− between two instruments together with F-test demonstrate that the concentrations measured by two instruments are similar or equal.
In contrast, the correlation coefficient of nitrate (NO3) between the two instruments is weaker (r = 0.31) than NH4+ (0.95) and SO42− (0.93). Being different from the cases of SO42− and NH4+, we found that the average concentration of NO3AMS is twice that of NO3IC. Such a difference could not be explained by the analytical errors of the two methods. The thermal alteration of organic nitrogen (ON) in the ionization chamber of AMS may produce nitrate [35]; therefore, these differences between NO3AMS and NO3IC may suggest that ON is abundantly present in aerosols (PM1.0) from Okinawa, an outflow region of Chinese pollutants. In fact, we found a significant amount of ON in the Okinawa aerosols (Figure 5). Our previous studies also showed a substantial amount of ON in the TSP aerosols from Cape Hedo, Okinawa [32] and in the alpine snow samples collected from Mt. Tateyama, central Japan [36]. Significant amounts of ON have been reported in Chinese aerosols [37]. However, we cannot exclude the possible evaporative loss of NO3 from the filters during sampling, which may cause a potential underestimate of NO3IC.
We found strong correlation (r = 0.72) and similar temporal trends between ON and NO3AMS. Strong correlation and similar temporal trends suggest that NO3AMS has significant contribution from ON. We found very good correlation (r = 0.62) between NO3 AMS and ON + NO3IC. There are several studies that showed coal combustion, biomass burning and anthropogenic activities produced nitrophenols and amino nitrogen-containing organic compounds and contribute to ON [38,39,40,41]. Large amounts of nitrophenols, aminophenols and amino nitrogen-containing compounds are present in East Asia and are transported to Okinawa via long range atmospheric transport [42]. Recently, Li et al. [42] reported the significant amount of proteinaceous organic matter in Okinawa aerosol. High concentrations of NO3AMS and OM were observed on March 23, April 2 and Apri 7. During March 17 and 18, and April 6 and 9, air masses arrived from the Pacific Ocean over the study area. Except for these dates, air masses arrived from East Asia, Russia, Mongolia and north China (Figure 2a) [28]. The concentration of NO3 is higher in TSP samples and that of ON is higher in PM1 samples during spring in Okinawa.

3.2. OMAMS versus OCSunset

It is very difficult to understand organic matter (OM) concentrations using National Institute for Occupational Safety and Health (NIOSH) thermal optical transmittance (TOT) and Interagency Monitoring of Protected Visual Environment (IMPROVE) thermal optical reflectance (TOR) protocols. These programs measure OC, but not OM. OM can be estimated using OC concentration. The OM/OC ratio can vary widely depending on sources, locations, atmospheric aging and meteorology [43,44]. The presence of aliphatic hydrocarbons in particulate matter showed a lower OM/OC ratio [43,45]. Secondary formation of atmospheric aerosols contains more oxygenated organics and, thus, has a higher OM/OC ratio [46]. An OM/OC ratio is critical to obtain mass closure between gravimetric PM measurements and colocated measurements of PM constituents which can be reflect the role of OM in regional and local air quality management plans and to improve model predictions of OM [47]. The OM/OC ratio also helps to estimate atmospheric aging and chemical processing in the atmosphere [48].
After the recent development of high-resolution aerosol mass spectrometer (HR-AMS), the OM/OC ratio in ambient air has been measured in real-time and measurements of the elemental composition of nonrefractory PM1 aerosol are reported using HR-AMS elsewhere [49,50,51]. Hence, the hydrogen-to-carbon (H/C), oxygen-to-carbon (O/C) and nitrogen-to-carbon (N/C) ratios of OM can be directly measured in the ambient aerosols. OM/OC ratios have also been determined for a number of specific sources such as vehicular emissions. Chirico et al. [52] found that the OM/OC ratio from vehicular emissions can vary between 1.26 and 1.40. Reff et al. [53] estimated OM/OC ratios to be about 1.25 for vehicle exhaust. Kleindienst et al. [54] showed OM/OC ratios of 1.4 to 2.7 in laboratory-generated secondary organic aerosol (SOA).
We compared OMAMS and organic carbon (OC) data obtained from the campaign, where OMAMS represents the concentration of organic matter measured by AMS, whereas OC was measured by Sunset Laboratory carbon analyzer. As shown in Figure 6, temporal variations of OMAMS and OCSunset are similar. A strong correlation (0.83) is found between OMAMS and OCSunset (Figure 6). The mass concentrations of OMAMS ranged from 1.0 to 5.9 μg m−3 (av. 2.5 ± 1.2 μg m−3), whereas those of OC ranged from 0.41 to 2.5 μg m−3 (1.2 ± 0.59 μg m−3). OMAMS is 1.6–3.6 times more abundant than OC, which is expected because organics contain several elements (H, O, N, S, etc.) other than C. Turpin and Lim. [43] estimated the OM/OC ratio to be 1.6 ± 0.2 for fresh urban aerosols and to be 2.1 ± 0.2 for aged aerosols. Okinawa aerosols are significantly aged during long-range atmospheric transport from East Asia [27,28,32,55,56].
Based on the two measurements, we calculated the average OMAMS/OC ratio to be 2.1 ± 0.5. Hence, OM/OC ratios (2.1) from this study are consistent with previous studies for aged aerosols [43,57,58]. Further, we found that, based upon the estimated elemental composition measured by AMS, the organic mass to organic carbon (OMAMS/OCAMS) ratio was 2.1, being consistent with more aged aerosols ([24], and reference therein). The elemental estimation of OM:OC ratios from AMS is similar to the bulk OMAMS/OCSunset ratios (2.1). For the elemental estimation, we only included C, H and O atoms.
Figure 7 shows the temporal variation of OMAMS/OCsunset ratios. The higher ratios were obtained in March 31 (3.5) and April 8 (3.3). We checked the air mass trajectory to identify the source regions. We found that air masses of March 31 and April 8 came from South Asia and oceanic regions. Trimonen et al. [41] reported OM/OC ratios of 1.5 to 2.1 for oxygenated aerosols. OM to OC ratios were reported to be 1.3–1.5 for primary OA and 1.8–2.2 for secondary OA [48]. Aiken et al. [48] showed a high OM/OC ratio (2.5) for aged, oxygenated OA. The high variability of OM/OC in our study as compared to previous studies suggests that OA are often photochemically more aged in the western North Pacific Rim. A very high OMAMS/OC ratio (3.8) was reported in Cape Hedo, Okinawa, in December 2010 [56]. However, the average OM/OC ratio (2.1 ± 0.5) obtained in our study is consistent with the ratio (2.1 ± 0.2) reported for aged aerosols [38].
The presence of aliphatic hydrocarbons tends to lower OM/OC ratios [43,45] while particulate matter dominated by secondary formation is typically more oxygenated and, thus, has a higher OM/OC ratio [46]. OM/OC ratios were relatively low from 17 March to 27, and were relatively high from 28 March to 8 April. The higher ratios indicate more oxygenated aerosols generated during long range transport, whereas lower ratios may be associated with the presence of aliphatic hydrocarbon or less photochemical processing. Higher OM/OC ratios were observed during 16 March (2.5), 22 March (2.6), 28 March (2.4), 30 March (3.4), and April 12 (2.5), whereas lower ratios were obtained on 2 April (1.4) and 3 (1.3). During 16 March, air mass originated from the Pacific Ocean and travelled over the coastal regions before arriving in Okinawa, while air masses of 22 March, 28 March, 30 March and 12 April originated from East Asia via long-range atmospheric transport. During 2 and 3 April when lower ratios were observed, air masses were delivered from North China without severe photochemical aging.
Figure 8 shows relative abundances (%) of organic matter (OM), SO42−, NH4+ and NO3 measured by AMS, carbon analyzer or IC. The average abundance of OMAMS (23%) is close to the calculated OM (2.1*OC) (21%). Similarly, the average abundances of SO42− are 19% (AMS) and 18% (IC). Further, those of NH4+ are 19% and 18%, respectively. In contrast, relative abundance of NO3 by AMS is almost twice that by IC. The higher relative abundance by AMS is due to the presence of organic nitrogen (ON) as discussed above. The ratio of m/z 30 (NO+)/m/z 46 (NO2+) obtained for authentic NH4NO3 is 1.2 [59]. We also observed similar values using the AMS instrument. Calibration of AMS was performed on 16 March 2008 at the Cape Hedo site just before the campaign. The ratio of 1.2 by AMS for authentic NH4NO3 is less than half of the value of 3.3 obtained by AMS for ambient aerosols from Cape Hedo, Okinawa. The higher ratio in Okinawa aerosols further supports the production of m/z 30 due to the presence of organic nitrogen [59].

4. Conclusions

We compared the abundances of ions (SO42−, NH4+ and NO3) obtained by an ion chromatograph (IC) and by Aerodyne aerosol mass spectrometer (AMS) for the ambient aerosols (PM1.0) from Cape Hedo, Okinawa Island: an outflow region from the Asian Continent. The abundances of SO42− and NH4+ showed good correlations between IC and AMS measurements. In contrast, we found higher concentration of NO3 estimated by AMS than by IC. This finding suggests that abundant presence of organic nitrogen may produce nitrate during the heating and ionization in an AMS instrument. More research is needed for real time measurement (AMS) and filter-based measurement of nitrate, which requires a careful evaluation when organic nitrogen exists abundantly in the ambient aerosols. The elemental estimation of OM:OC ratios from AMS is the same as the bulk OMAMS/OCSunset ratio (2.1), suggesting a good agreement between AMS and the Sunset carbon analyzer.

Author Contributions

Conceptualization, K.K.; methodology, A.T., K.T.; software, A.T and B.K; validation, A.T., K.T. and B.K.; formal analysis, A.T and K.T.; investigation, B.K.; resources, K.K.; data curation, A.T and K.T.; writing—original draft preparation, B.K.; writing—review and editing, K.K and A.T.; visualization, B.K.; supervision, K.K.; project administration, K.K.; funding acquisition, K.K. All authors have read and agreed to the published version of the manuscript.

Funding

Funded by the Environment Research and Technology Development Fund (B-0903, 2-1403) from the Ministry of the Environment, Japan.

Data Availability Statement

Data will be available upon the request.

Acknowledgments

This study was in part supported by the Japan Society for the Promotion of Science (JSPS) (Grant-in-Aid Nos. 1920405 and 24221001), and the JSPS Joint Research Program implemented in association with DFG (JRPs-LEAD with DFG: JPJSJRP 20181601). We thank K. Okuzawa, Y. Kitamori, S. G. Aggarwal, and M. Mochida for their help in aerosol sampling at Cape Hedo. We also thank the NOAA Air Resources Laboratory (ARL) for the provision of the HYSPLIT transport model and READY website (http://www.arl.noaa.gov/ready.php, accessed on 22 October 2021) used in this study. The authors appreciate the English editing by Phil Meyers of the University of Michigan.

Conflicts of Interest

The authors declare no conflict of interest.

References

  1. Kawamura, K.; Ikushima, K. Seasonal changes in the distribution of dicarboxylic acids in the urban atmosphere. Environ. Sci. Technol. 1993, 27, 2227–2235. [Google Scholar] [CrossRef]
  2. Nakayama, T.; Matsumi, Y.; Sato, K.; Imamura, T.; Yamazaki, A.; Uchiyama, A. Laboratory studies on optical properties of secondary organic aerosols generated during the photooxidation of toluene and the ozonolysis of α-pinene. J. Geophys. Res. Atmos. 2010, 115. [Google Scholar] [CrossRef]
  3. Pavuluri, C.M.; Kawamura, K.; Swaminathan, T. Water-soluble organic carbon, dicarboxylic acids, ketoacids, and α-dicarbonyls in the tropical Indian aerosols. J. Geophys. Res. Atmos. 2010, 115. [Google Scholar] [CrossRef] [Green Version]
  4. Li, Y.J.; Yeung, J.W.T.; Leung, T.P.I.; Lau, A.P.S.; Chan, C.K. Characterization of Organic Particles from Incense Burning Using an Aerodyne High-Resolution Time-of-Flight Aerosol Mass Spectrometer. Aerosol Sci. Technol. 2012, 46, 654–665. [Google Scholar] [CrossRef]
  5. Williams, L.R.; Gonzalez, L.A.; Peck, J.; Trimborn, D.; McInnis, J.; Farrar, M.R.; Moore, K.D.; Jayne, J.T.; Robinson, W.A.; Lewis, D.K.; et al. Characterization of an aerodynamic lens for transmitting particles greater than 1 micrometer in diameter into the Aerodyne aerosol mass spectrometer. Atmos. Meas. Tech. 2013, 3, 3271–3280. [Google Scholar] [CrossRef] [Green Version]
  6. Peck, J.; Gonzalez, L.A.; Williams, L.R.; Xu, W.; Croteau, P.L.; Timko, M.T.; Jayne, J.T.; Worsnop, D.R.; Miake-Lye, R.C.; Smith, K.A. Development of an aerosol mass spectrometer lens system for PM2.5. Aerosol Sci. Technol. 2016, 50, 781–789. [Google Scholar] [CrossRef]
  7. Jayne, J.T.; Leard, D.C.; Zhang, X.; Davidovits, P.; Smith, K.A.; Kolb, C.E.; Worsnop, D.R. Development of an Aerosol Mass Spectrometer for Size and Composition Analysis of Submicron Particles. Aerosol Sci. Technol. 2000, 33, 49–70. [Google Scholar] [CrossRef] [Green Version]
  8. Allan, J.D.; Delia, A.E.; Coe, H.; Bower, K.N.; Alfarra, M.R.; Jimenez, J.L.; Middlebrook, A.M.; Drewnick, F.; Onasch, T.B.; Canagaratna, M.R.; et al. A generalised method for the extraction of chemically resolved mass spectra from Aerodyne aerosol mass spectrometer data (Technical Note). J. Aerosol Sci. 2004, 35, 909–922. [Google Scholar] [CrossRef]
  9. Middlebrook, A.M.; Murphy, D.M.; Lee, S.-H.; Thomson, D.S.; Prather, K.A.; Wenzel, R.J.; Liu, D.-Y.; Phares, D.J.; Rhoads, K.P.; Wexler, A.S.; et al. A Comparison of Particle Mass Spectrometers During the 1999 Atlanta Supersite Project. J. Geophys. Res. Atmos. 2003, 108. [Google Scholar] [CrossRef]
  10. Zhang, X.; Smith, K.A.; Worsnop, D.R.; Jimenez, J.; Jayne, J.T.; Kolb, C.E. A Numerical Characterization of Particle Beam Collimation by an Aerodynamic Lens-Nozzle System: Part I. An Individual Lens or Nozzle. Aerosol Sci. Technol. 2002, 36, 617–631. [Google Scholar] [CrossRef]
  11. Ovadnevaite, J.; O’Dowd, C.; Dall’Osto, M.; Ceburnis, D.; Worsnop, D.R.; Berresheim, H. Detecting High Contributions of Primary Organic Matter to Marine Aerosol: A Case Study. Geophys. Res. Lett. 2011, 38. [Google Scholar] [CrossRef]
  12. Takegawa, N.; Miyakawa, T.; Kawamura, K.; Kondo, Y. Contribution of selected dicarboxylic and ω-oxocarboxylic acids in ambient aerosol to the m/z 44 signal of an Aerodyne aerosol mass spectrometer. Aerosol Sci. Technol. 2007, 41, 418–437. [Google Scholar] [CrossRef] [Green Version]
  13. Drewnick, F.; Schwab, J.J.; Hogrefe, O.; Peters, S.; Husain, L.; Diamond, D.; Weber, R.; Demerjian, K.L. Intercomparison and Evaluation of Four Semi-continuous PM2.5 Sulfate Instruments. Atmos. Environ. 2003, 37, 3335–3350. [Google Scholar] [CrossRef]
  14. Jimenez, J.L.; Jayne, J.T.; Shi, Q.; Kolb, C.E.; Worsnop, D.R.; Yourshaw, I.; Seinfeld, J.H.; Flagan, R.C.; Zhang, X.; Smith, K.A.; et al. Ambient aerosol sampling using the Aerodyne aerosol mass spectrometer. J. Geophys. Res. Atmos. 2003, 108. [Google Scholar] [CrossRef] [Green Version]
  15. Schneider, J.; Borrmann, S.; Wollny, A.G.; Bläsner, M.; Mihalopoulos, N.; Oikonomou, K.; Sciare, J.; Teller, A.; Levin, Z.; Worsnop, D.R. Online Mass Spectrometric Aerosol Measurements During the MINOS Campaign (Crete, August 2001). Atmos. Chem. Phys. 2004, 4, 65–80. [Google Scholar] [CrossRef] [Green Version]
  16. Takegawa, N.; Miyazaki, Y.; Kondo, Y.; Komazaki, Y.; Miyakawa, T.; Jimenez, J.L.; Jayne, J.T.; Worsnop, D.R.; Allan, J.D.; Weber, R.J. Characterization of an Aerodyne Aerosol Mass Spectrometer (AMS): Intercomparison with other aerosol instruments. Aerosol Sci. Technol. 2005, 39, 760–770. [Google Scholar] [CrossRef]
  17. Zhang, Q.; Worsnop, D.R.; Canagaratna, M.R.; Jimenez, J.L. Hydrocarbon-like and Oxygenated Organic Aerosols in Pittsburgh: Insights into Sources and Processes of Organic Aerosols. Atmos. Chem. Phys. 2005, 5, 3289–3311. [Google Scholar] [CrossRef] [Green Version]
  18. Garstang, M.; Ellery, W.N.; McCarthy, T.S.; Scholes, M.C.; Scholes, R.J.; Swap, R.J.; Tyson, P.D. The contribution of aerosol- and water-borne nutrients to the functioning of the Okavango Delta ecosystem, Botswana. South Afr. J. Sci. 1998, 94, 223–229. [Google Scholar]
  19. Seinfeld, J.; Pandis, S.N. Atmospheric Chemistry and Physics: From Air Pollution to Climate Change, 2nd ed.; John Wiley & Sons, Inc.: Hoboken, NJ, USA, 1998. [Google Scholar]
  20. Wittig, A.E.; Anderson, N.; Khlystov, A.; Pandis, S.N.; Davidson, C.; Robinson, A.L. Pittsburgh air 16 quality study overview. Atmos. Environ. 2004, 38, 3107–3125. [Google Scholar] [CrossRef]
  21. Pan, Y.P.; Wang, Y.S.; Tang, G.Q.; Wu, D. Wet and dry deposition of atmospheric nitrogen at ten sites in Northern China. Atmos. Chem. Phys. 2012, 12, 6515–6535. [Google Scholar] [CrossRef] [Green Version]
  22. Liu, X.; Xu, W.; Pan, Y.; Du, E. Liu et al. suspect that Zhu et al. (2015) may have underestimated dissolved organic nitrogen (N) but overestimated total particulate N in wet deposition in China. Sci. Total Environ. 2015, 520, 300–301. [Google Scholar] [CrossRef] [PubMed]
  23. Yeatman, S.G.; Spokes, L.J.; Dennis, P.F.; Jickells, T.D. Comparisons of aerosol nitrogen isotopic composition at two pollutedcoastal sites. Atmos. Environ. 2001, 35, 1307–1320. [Google Scholar] [CrossRef]
  24. Zhang, Q.; Anastasio, C.; Jimenez-Cruz, M. Water-soluble organic nitrogen in atmospheric fine particles (PM2.5) from northern California. J. Geophys. Res. Atmos. 2002, 107. [Google Scholar] [CrossRef] [Green Version]
  25. Mace, K.A.; Duce, R.A.; Tindale, N.W. Organic nitrogen in rain and aerosol at Cape Grim, Tasmania, Australia. J. Geophys. Res. Atmos. 2003, 108. [Google Scholar] [CrossRef] [Green Version]
  26. Duan, F.; Liu, X.; He, K.; Dong, S. Measurements and characteristics of nitrogen-containing compounds in atmospheric particulate matter in Beijing, China. Bull. Environ. Contam. Toxicol. 2009, 82, 332–337. [Google Scholar] [CrossRef] [PubMed]
  27. Kunwar, B.; Kawamura, K. One-year observations of carbonaceous and nitrogenous components and major ions in the aerosols from subtropical Okinawa Island, an outflow region of Asian dusts. Atmos. Chem. Phys. 2014, 14, 1819–1836. [Google Scholar] [CrossRef] [Green Version]
  28. Kunwar, B.; Torii, K.; Zhu, C.; Fu, P.; Kawamura, K. Springtime variations of organic and inorganic constituents in submicron aerosols (PM1.0) from Cape Hedo, Okinawa. Atmos. Environ. 2016, 130, 84–94. [Google Scholar] [CrossRef]
  29. Takami, A.; Miyoshi, T.; Shimono, A.; Kaneyasu, N.; Kato, S.; Kajii, Y.; Hatakeyama, S. Transport of anthropogenic aerosols from Asia and subsequent chemical transformation. J. Geophys. Res. Atmos. 2007, 112. [Google Scholar] [CrossRef]
  30. Pavuluri, C.M.; Kawamura, K.; Aggarwal, S.G.; Swaminathan, T. Characteristics, seasonality and sources of carbonaceous and ionic components in the tropical aerosols from Indian region. Atmos. Chem. Phys. 2011, 11, 8215–8230. [Google Scholar] [CrossRef] [Green Version]
  31. Kawamura, K.; Watanabe, T. Determination of stable carbon isotopic compositions of low molecular weight dicarboxylic acids and ketocarboxylic acids in atmospheric aerosol and snow samples. Anal. Chem. 2004, 76, 5762–5768. [Google Scholar] [CrossRef]
  32. Kunwar, B.; Kawamura, K.; Zhu, C. Stable carbon and nitrogen isotopic compositions of ambient aerosols collected from Okinawa Island in the western North Pacific Rim, an outflow region of Asian dusts and pollutants. Atmos. Environ. 2016, 131, 243–253. [Google Scholar] [CrossRef]
  33. Stephanou, E.G.; Stratigakis, N. Oxocarboxylic and α,ω-dicarboxylic acids: Photooxidation products of biogenic unsaturated fatty acids present in urban aerosols. Environ. Sci. Technol. 1993, 27, 1403–1407. [Google Scholar] [CrossRef]
  34. Kundu, S.; Kawamura, K.; Andreae, T.W.; Hoffer, A.; Andreae, M.O. Molecular distributions of dicarboxylic acids, ketocarboxylic acids and dicarbonyls in biomass burning aerosols: Implications for photochemical production and degradation in smoke layers. Atmos. Chem. Phys. 2010, 10, 2209–2225. [Google Scholar] [CrossRef] [Green Version]
  35. Farmer, D.K.; Matsunaga, A.; Docherty, K.S.; Surratt, J.D.; Seinfeld, J.H.; Ziemann, P.J.; Jimenez, J.L. Response of an aerosol mass spectrometer to organonitrates and organosulfates and implications for atmospheric chemistry. Proc. Natl. Acad. Sci. USA 2010, 107, 6670–6675. [Google Scholar] [CrossRef] [PubMed] [Green Version]
  36. Mochizuki, T.; Kawamura, K.; Aoki, K. Water-Soluble Organic Nitrogen in High Mountain Snow Samples from Central Japan. Aerosol Air Qual. Res. 2016, 16, 632–639. [Google Scholar] [CrossRef] [Green Version]
  37. Wang, G.; Kawamura, K.; Umemoto, N.; Xie, M.; Hu, S.; Wang, Z. Water-soluble organic compounds in PM2.5 and size-segregated aerosols over Mount Tai in North China Plain. J. Geophys. Res. Atmos. 2009, 114. [Google Scholar] [CrossRef] [Green Version]
  38. Laskin, A.; Smith, J.S.; Laskin, J. Molecular Characterization of Nitrogen-Containing Organic Compounds in Biomass Burning Aerosols Using High-Resolution Mass Spectrometry. Environ. Sci. Technol. 2009, 43, 3764–3771. [Google Scholar] [CrossRef] [PubMed]
  39. Liang, Y.; Wang, X.; Dong, S.; Liu, Z.; Mu, J.; Lu, C.; Zhang, J.; Li, M.; Xue, L.; Wang, W. Size distributions of nitrated phenols in winter at a coastal site in north China and the impacts from primary sources and secondary formation. Chemosphere 2020, 250, 126256. [Google Scholar] [CrossRef]
  40. Li, M.; Wang, X.; Lu, C.; Li, R.; Zhang, J.; Dong, S.; Yang, L.; Xue, L.; Chen, J.; Wang, W. Nitrated phenols and the phenolic precursors in the atmosphere in urban Jinan, China. Sci. Total Environ. 2020, 714, 136760. [Google Scholar] [CrossRef]
  41. Lu, C.; Wang, X.; Li, R.; Gu, R.; Zhang, Y.; Li, W.; Gao, R.; Chen, B.; Xue, L.; Wang, W. Emissions of fine particulate nitrated phenols from residential coal combustion in China. Atmos. Environ. 2019, 203, 10–17. [Google Scholar] [CrossRef]
  42. Li, X.; Zhang, Y.; Shi, L.; Kawamura, K.; Kunwar, B.; Takami, A.; Arakaki, T.; Lai, S. Aerosol proteinaceous matter in coastal Okinawa, Japan: Influence of long-range transport and photochemical degradation. Environ. Sci. Technol. 2022, 56, 5256–5265. [Google Scholar] [CrossRef] [PubMed]
  43. Turpin, B.J.; Lim, H.-J. Species contributions to PM2.5 mass concentrations: Revisiting common assumptions for estimating organic mass. Aerosol Sci. Technol. 2001, 35, 602–610. [Google Scholar] [CrossRef]
  44. Simon, H.; Bhave, P.V.; Swall, J.L.; Frank, N.H.; Malm, W.C. Determining the spatial and seasonal variability in OM/OC ratios across the US using multiple regression. Atmos. Chem. Phys. 2011, 11, 2933–2949. [Google Scholar] [CrossRef] [Green Version]
  45. Maria, S.F.; Russell, L.M.; Turpin, B.J.; Porcja, R.J.; Campos, T.L.; Weber, R.J.; Huebert, B.J. Source signatures of carbon monoxide and organic functional groups in Asian Pacific Regional Aerosol Characterization Experiment (ACE-Asia) submicron aerosol types. J. Geophys. Res. Atmos. 2003, 108. [Google Scholar] [CrossRef] [Green Version]
  46. Aiken, A.C.; DeCarlo, P.F.; Kroll, J.H.; Worsnop, D.R.; Huffman, J.A.; Docherty, K.S.; Ulbrich, I.M.; Mohr, C.; Kimmel, J.R.; Sueper, D.; et al. O/C and OM/OC ratios of primary, secondary, and ambient organic aerosols with high-resolution time-of-flight aerosol mass spectrometry. Environ. Sci. Technol. 2008, 42, 4478–4485. [Google Scholar] [CrossRef] [PubMed]
  47. Polidori, A.; Turpin, B.J.; Davidson, C.I.; Rodenburg, L.A.; Maimone, F. Organic PM2.5: Fractionation by polarity, FTIR spectroscopy, and OM/OC ratio for the Pittsburgh aerosol. Aerosol Sci. Technol. 2008, 42, 233–246. [Google Scholar] [CrossRef]
  48. Aiken, A.C.; Salcedo, D.; Cubison, M.J.; Huffman, J.A.; DeCarlo, P.F.; Ulbrich, I.M.; Docherty, K.S.; Sueper, D.; Kimmel, J.R.; Worsnop, D.R.; et al. Mexico City aerosol analysis during MILAGRO using high resolution aerosol mass spectrometry at the urban supersite (T0)—Part 1: Fine particle composition and organic source apportionment. Atmos. Chem. Phys. 2009, 9, 6633–6653. [Google Scholar] [CrossRef] [Green Version]
  49. DeCarlo, P.F.; Kimmel, J.R.; Trimborn, A.; Northway, M.J.; Jayne, J.T.; Aiken, A.C.; Gonin, M.; Fuhrer, K.; Horvath, T.; Docherty, K.S.; et al. Field-deployable, high-resolution, time-of-flight aerosol mass spectrometer. Anal. Chem. 2006, 78, 8281–8289. [Google Scholar] [CrossRef]
  50. Xu, J.; Zhang, Q.; Shi, J.; Ge, X.; Xie, C.; Wang, J.; Kang, S.; Zhang, R.; Wang, Y. Chemical characteristics of submicron particles at the central Tibetan Plateau: Insights from aerosol mass spectrometry. Atmos. Chem. Phys. 2018, 18, 427–443. [Google Scholar] [CrossRef] [Green Version]
  51. Brown, S.G.; Lee, T.; Roberts, P.T.; Collett, J.L., Jr. Variations in the OM/OC ratio of urban organic aerosol next to a major roadway. J. Air Waste Manag. Assoc. 2013, 63, 1422–1433. [Google Scholar] [CrossRef] [PubMed] [Green Version]
  52. Chirico, R.; DeCarlo, P.F.; Heringa, M.F.; Tritscher, T.; Richter, R.; Prévôt, A.S.H.; Dommen, J.; Weingartner, E.; Wehrle, G.; Gysel, M.; et al. Impact of aftertreatment devices on primary emissions and secondary organic aerosol formation potential from in-use diesel vehicles: Results from smog chamber experiments. Atmos. Chem. Phys. 2010, 10, 11545–11563. [Google Scholar] [CrossRef]
  53. Reff, A.; Bhave, P.V.; Simon, H.; Pace, T.G.; Pouliot, G.A.; Mobley, J.D.; Houyoux, M. Emissions inventory of PM2.5 trace elements across the United States. Environ. Sci. Technol. 2009, 43, 5790–5796. [Google Scholar] [CrossRef] [PubMed]
  54. Kleindienst, T.E.; Jaoui, M.; Lewandowski, M.; Offenberg, J.H.; Lewis, C.W.; Bhave, P.V.; Edney, E.O. Estimates of the contributions of biogenic and anthropogenic hydrocarbons to secondary organic aerosol at a southeastern US location. Atmos. Environ. 2007, 41, 8288–8300. [Google Scholar] [CrossRef]
  55. Deshmukh, D.K.; Kawamura, K.; Lazaar, M.; Kunwar, B.; Boreddy, S.K.R. Dicarboxylic acids, oxoacids, benzoic acid, α-dicarbonyls, WSOC, OC, and ions in spring aerosols from Okinawa Island in the western North Pacific Rim: Size distributions and formation processes. Atmos. Chem. Phys. 2016, 16, 5263–5282. [Google Scholar] [CrossRef] [Green Version]
  56. Kunwar, B.; Torii, K.; Kawamura, K. Springtime influences of Asian outflow and photochemistry on the distributions of diacids, oxoacids and α-dicarbonyls in the aerosols from the western North Pacific rim. Tellus B: Chem. Phys. Meteorol. 2017, 69, 1369341. [Google Scholar] [CrossRef] [Green Version]
  57. Timonen, H.; Carbone, S.; Aurela, M.; Saarnio, K.; Saarikoski, S.; Ng, N.L.; Canagaratna, M.R.; Kulmala, M.; Kerminen, V.-M.; Worsnop, D.R.; et al. Characteristics, sources and water-solubility of ambient submicron organic aerosol in springtime in Helsinki, Finland. J. Aerosol Sci. 2013, 56, 61–77. [Google Scholar] [CrossRef]
  58. Canagaratna, M.R.; Jimenez, J.L.; Kroll, J.H.; Chen, Q.; Kessler, S.H.; Massoli, P.; Ruiz, L.H.; Fortner, E.; Williams, L.R.; Wilson, K.R.; et al. Elemental ratio measurements of organic compounds using Aerosol mass spectrometry: Characterization, improved calibration, and implications. Atmos. Chem. Phys. 2015, 15, 253–272. [Google Scholar] [CrossRef] [Green Version]
  59. Sato, K.; Takami, A.; Isozaki, T.; Hikida, T.; Shimono, A.; Imamura, T. Mass spectrometric study of secondary organic aerosol formed from the photo-oxidation of aromatic hydrocarbons. Atmos. Environ. 2010, 44, 1080–1087. [Google Scholar] [CrossRef]
Figure 1. Sampling location, Cape Hedo, Okinawa Island.
Separations 09 00430 g001
Figure 2. (a) Five-day back trajectory analysis using Hybrid Single-Particle Lagrangian Integrated Trajectory (HYSPLIT4) model (Draxler and Hess, 2003). (b) Wind direction recorded in Okinawa during study period. Color code labels in rose plot (0–2, 2–4, etc.) indicate the recorded wind speed in m/s. The meteorological data were obtained from the Japan Meteorological Agency.
Separations 09 00430 g002
Figure 3. Temporal variations of (a) NO3, (b) NH4+ and (c) SO42− measured by two instruments (IC and AMS) in aerosols collected from Cape Hedo, Okinawa.
Separations 09 00430 g003
Figure 4. Scatterplots of (a) NO3, (b) NH4+ and (c) SO42− measured by two instruments (IC and AMS) in aerosols collected from Cape Hedo, Okinawa.
Separations 09 00430 g004
Figure 5. Temporal variations of organic nitrogen (ON) in aerosols collected from Cape Hedo, Okinawa.
Separations 09 00430 g005
Figure 6. Temporal variations of organic matter (OM) measured by AMS and organic carbon (OC) measured by Sunset Laboratory carbon analyzer (left panel) and correlation plots (right panel) between OC and organic matter measured by two instruments (Sunset and AMS) in aerosols collected from Cape Hedo, Okinawa.
Separations 09 00430 g006
Figure 7. Temporal variations of mass concentration ratios of organic matter (OMAMS) to organic carbon (OCSunset).
Separations 09 00430 g007
Figure 8. Relative abundances of organic matter (OM), SO42−, NH4+ and NO3 measured by (a) Aerodyne aerosol mass spectrometer (AMS), and (b) ion chromatography and Sunset Laboratory carbon analyzer. OM was calculated by 2.1*OC. The number in bracket means absolute amount in μg m−3.
Separations 09 00430 g008
Table 1. Concentrations of organic and inorganic species measured by different methods during the same study period.
SpeciesAv ± SDRange (Min-Max)
(μg m−3)
Total organics by AMS2.5 ± 1.21.0–5.9
OC by Sunset Lab1.2 ± 0.590.41–2.5
EC by Sunset Lab0.36 ± 0.230.41–2.5
SO42− byAMS6.2 ± 3.01.7–15
NO3 byAMS0.11 ± 0.050.03–0.31
NH4+ byAMS2.1 ± 1.00.6–5.0
TN by elemental analyzer2.2 ± 1.20.5–5.1
SO42− by IC7.7 ± 4.21.7–19
NO3 by IC0.06–0.13ND-0.58
NH4+ by IC2.3 ± 1.20.43–5.0
Table 2. Result of F-test between NH4+(AMS) and NH4+(IC).
NH4+AMSNH4+IC
Mean6.27
Variance9.418
Observations2828
df2727
F0.5
P(F≤ f) one-tail0.04
F Critical one-tail0.5
Note: F < Fcrit and p value is less than or equal to 0.05. Therefore, there is no significant difference between two measurements.
Table 3. Result of F- test between SO42−(AMS) and SO42−(IC).
SO42−AMSSO42−IC
Mean7.86
Variance1810
Observations2727
df2626
F1.9
P(F≤ f) one-tail0.05
F Critical one-tail1.9
Note: F < Fcrit, p value is less than or equal to 0.05. Therefore, there is no significant difference between two measurements.
Publisher’s Note: MDPI stays neutral with regard to jurisdictional claims in published maps and institutional affiliations.

