Article

Mesoporous Activated Carbon from Bamboo Waste via Microwave-Assisted K2CO3 Activation: Adsorption Optimization and Mechanism for Methylene Blue Dye

by
Khaizuran Fyrdaus Azlan Zahari
1,
Uttam Kumar Sahu
2,
Tumirah Khadiran
3,
Siti Norasmah Surip
1,4,
Zeid A. ALOthman
5 and
Ali H. Jawad
1,*
1
Faculty of Applied Sciences, Universiti Teknologi MARA, Shah Alam 40450, Selangor, Malaysia
2
Department of Basic Science & Humanities, Gandhi Institute of Engineering and Technology University, Gunupur 765022, India
3
Forest Products Division, Forest Research Institute Malaysia (FRIM), Kepong 52109, Selangor, Malaysia
4
School of Computing, Engineering and Mathematical Sciences, La Trobe University, Bendigo, VIC 3552, Australia
5
Chemistry Department, College of Science, King Saud University, Riyadh 11451, Saudi Arabia
*
Author to whom correspondence should be addressed.
Separations 2022, 9(12), 390; https://doi.org/10.3390/separations9120390
Submission received: 19 October 2022 / Revised: 12 November 2022 / Accepted: 16 November 2022 / Published: 23 November 2022
(This article belongs to the Special Issue Applications of Porous Materials in Adsorption)

Abstract

:
Bamboo waste (BW) was activated with a K2CO3 precursor in a microwave process for the adsorption of MB dye from an aqueous solution. The prepared bamboo-waste-activated carbon (BWAC) was analyzed by instrumental techniques such as FTIR, SEM, and BET analysis. The surface of the BWAC was mesoporous with a surface area of 107.148 m2/g. The MB dye removal was optimized with the three variables of adsorbent dose, pH, and contact time using the Box–Behnken design (BBD) model. Up to 87% of MB was removed in the optimized conditions of adsorbent dose of 0.08 g/100 mL, pH of 7.62, time of 8 min, and concentration of 50 mg/L. Here, the most effective parameter for MB removal was found to be adsorbent dose with an F-value of 121.70, while time and pH showed a smaller effect. The maximum adsorption capacity of BWAC in the optimized conditions was found to be 85.6 mg/g. The adsorption of MB on BWAC’s surface was through chemisorption and a spontaneous process. The adsorption mechanism study showed that three types of interactions are responsible for the removal of MB dye from aqueous solutions by BWAC, i.e., electrostatic interactions, H-bonding, and pi–pi interactions. Hence, BWAC can be considered a highly efficient adsorbent for MB removal from wastewater.

Graphical Abstract

1. Introduction

The human population and rapid industrialization are the two key factors for water pollution, which becomes a major problem as the freshwater levels decrease day by day. Different types of pollutants such as heavy metals, dyes, pesticides, and organic compounds are directly discharged from industries, resulting in the water becoming unusable [1,2]. Compared to all these pollutants, the presence of dyes in the drinking water environments causes serious problems for animals and plant life, becoming a global issue. Dye-contaminated water is mostly discharged from the cosmetics, textiles, printing, and paper and dyeing industries, and every year, 7 × 10⁵ metric tons of dye enters the natural water systems from these industrial sources [3]. Both the ecological system and human health are adversely affected as these man-made dyes are highly toxic, non-biodegradable, and carcinogenic in nature. Cationic organic dyes such as methylene blue (MB) (a heterocyclic compound) have properties of high organic matter, non-degradable nature, and higher chromaticity that can cause harm to the ecosystem, including the ultimate disturbance in photosynthesis by diminution of dissolved oxygen and creating toxicity, which ultimately affects human beings [4,5]. The use of these MB dye-contaminated water resources in any way for lengthier times can cause carcinogenic, mutagenic, and micro-toxic effects in human beings and aquatic animals [6]. Hence, it is necessary to remove MB dye from wastewater using desirable cost-effective techniques for economic and practical application.
Therefore, scientists are trying to develop more efficient and bearable techniques for MB dye removal from water. The workable techniques available in the literature are membrane filtration [7], ion exchange [8], adsorption [9], reverse osmosis [10], and chemical precipitation processes [11]. However, most of these techniques show low performance with high operational cost; therefore, in many MB dye removal research studies, adsorption processes are applied and found to yield good results. In this technique, the operational cost is very low, removal is efficient, the process runs without electrical energy, there is no toxic by-product formation, and it is environmentally friendly [12]. In the adsorption process, adsorbent selection plays a crucial role, and it should not only be efficient but also easily available everywhere at low cost so that it can be applied in rural areas. Hence, for MB dye removal, adsorbents such as metal oxide nanoparticles [13], bimetal oxide [14], graphene [15], chitosan [16], and activated carbon [17] have been frequently used with good results. Compared to other materials, activated carbon has a high surface area, mesoporous structure, reusability, and good surface reactivity and is highly stable under acidic and basic conditions [18]. However, the available commercial activated carbon has a high cost, which limits its sequential application; therefore, agricultural wastes are used for activated carbon preparation, which is also the solution to the economic problem [19]. Agricultural by-products such as rice husk, tea waste, and coconut leaf have been applied for activated carbon preparation with a successful application for MB dye removal from wastewater.
The activated carbon prepared from the bio-waste sources is generally proceeded with chemical activation with an activating agent such as KOH, ZnCl2, H3PO4, NaOH, K2CO3, and HNO3 in an inert atmosphere at high temperature [20]. Compared to others, the activated carbon that is prepared with K2CO3 as an activating agent has a high surface area, a greater number of oxygen-carrier functional groups formed and is eco-friendly in nature [21]. Therefore, more consideration is given to produce activated carbon using K2CO3 for multipurpose applications such as pesticides removal [22], decolorization of dyes [23], and CO2 capacitors [24].
Bamboo is a natural plant biomass that is under the Bambusoidae subfamily and Poaceae family. It is mainly grass and requires a very short time (a few months) for complete growth, so it is one of the fastest-growing plants found in nature [25]. Nearly 1500 bamboo species are grown in Asian counties such as Malaysia, Vietnam, India, Thailand, China, and Indonesia [26]. In Malaysia, bamboo is highly used in construction sites as it is easily available, low-cost, and very strong [27]. Hence, bamboo can be used as a raw material for activated carbon preparation, which will be a good step toward the recycling of bamboo waste and its reusability for MB dye removal.
Thus, the focus of this research work is to convert the bamboo waste (BW) into porous activated carbon to be a potential adsorbent for the removal of toxic cationic dye such as methylene blue (MB). In fact, the adsorption is controlled by different process parameters such as pH, adsorbate concentration, adsorbent dose, time, and temperature, and one-to-one analysis of these parameters would take a longer time with the loss of energy and resources. To solve these problems, adsorption studies are conducted according to the experimental designs, which give accurate output data and less consumption of valuable resources such as energy. Hence, the Box–Behnken Design (BBD), a theoretical model of the response surface methodology (RSM), has been used for wastewater treatment including toxic heavy metals [28], pharmaceutical waste [29], organic compounds [30], and dye removal [31] with the best removal results. In this study, bamboo-waste-activated carbon (BWAC) was prepared in the microwave synthesis process and used for MB removal using the Box–Behnken Design method. The properties of BWAC were analyzed with BET, FTIR, and FESEM studies. The adsorption kinetics, isotherms, thermodynamics, and mechanism for MB removal on the BWAC surface were also determined in this research study.

2. Materials and Methods

2.1. Materials

The chemicals used in this study were all analytical grade and could be used without any extra purification. Potassium carbonate (K2CO3), methylene blue (MB), and other reagents were bought from R & M Chemicals, Malaysia. Bamboo waste (BW) was supplied from the Forest Products Division, Forest Research Institute Malaysia (FRIM), 52109 Kepong, Selangor, Malaysia. The BW was repeatedly washed with deionized water several times, sundried for two days, then oven-heated for 24 h at 100 °C [32]. After that, the material was finely ground into a fine powder of size 1–2 mm.

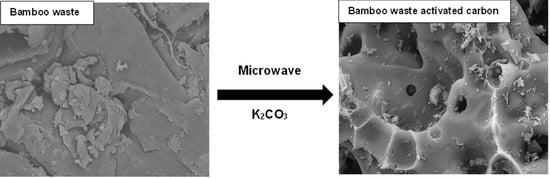
2.2. Preparation of Adsorbent

BW microwave activation was performed in a SAMSUNG solo 20 L microwave oven. Here, 1 g of BW powder was first treated with 2 g of K2CO3 solid powder (impregnation ratio 1:2) for 24 h at 110 °C. Then, the microwave activation was carried out in a quartz chamber sealed on both sides while N2 gas flowed continuously through it at microwave irradiation power of 800 W for 15 min. After activation, the activated carbon from BW was rinsed several times with distilled water until neutral pH and then dried in an oven for 24 h at 100 °C. Finally, the formed material was labeled as bamboo-waste-activated carbon (BWAC) and stored in an air-tight container.

2.3. Characterization Techniques

The functional groups on the surface of BW and BWAC were analyzed by a FT-IR spectrophotometer (PerkinElmer, Spectrum RX I, Waltham, MA, USA) by using a KBr disc in the range of 4000 to 400 cm−1 with 60 scans per screening. The external surface morphology and elemental composition of the BWAC before and after MB dye adsorption were identified by scanning electron microscopy with energy-dispersive X-ray spectrometry by a Zeiss Supra 40 VP model, Jena, Germany. A Micromeritics ASAP 2060 BET instrument (Norcross, GA, USA) was used for the surface area and other porous analyses of BWAC. The point of zero charge (pHpzc) of BWAC was calculated based on a previously reported method [33]. The concentration of MB dye was measured using a spectrophotometer (HACH DR 3900) (Berlin, Germany) at 661 nm.

2.4. Design of Experiments

Design expert version 13 software (Stat-Ease, Inc, Minneapolis, MN, USA) was used for the data analysis of this study. The Box–Behnken Design (BBD) was statistically applied for process parameter optimization to remove the maximum amount of MB dye from aqueous solutions using BWAC within the ranges of experimental factors. Here, the independent variables were pH (A), adsorbent dose (B), and time (C), whereas the removal of MB dye (Y) was the dependent variable. The levels and ranges of experimental independent variables are summarized in Table 1. A response surface quadratic second-order polynomial regression equation (Equation (1)) was applied to measure the interactions of independent variables of adsorbent dose, pH, and time with MB removal (%).
Y = β 0 + β i Χ i + β ii Χ i 2 + β ij Χ i Χ j
where ε represents the error in the model; Y (%) shows the output response of the removal of MB; β0, βi, and βij are the coefficients constant, linear parameter constant, and first-order coefficient constant of Xi and Xj, respectively.
The batch experiments were conducted in a 250 mL conical flask, where 100 mL of 100 mg/L initial-concentration MB dye solutions were taken and the required amount of adsorbent was added to it while constantly agitating inside a thermostat water bath shaker stirred for 30 min. The required pH of the solutions was achieved using 0.1 M NaOH and 0.1 M HCl solutions. After MB dye adsorption, the adsorbent was separated from the solution using a nylon syringe filter (0.45 µm). Then, the residual MB concentration was analyzed with the spectrophotometer (HACH DR 3900) at a wavelength of 661 nm. The percentage of MB removal and uptake capacity of BWAC were calculated using Equations (2) and (3), respectively.
R % = C ο   C e C ο   × 100
q e   = ( C ο C e ) V W
where Co and Ce = initial and equilibrium concentrations (mg/L), respectively; W = adsorbent weight (g); V = solution volume (L); R = removal percentage (%); lastly, qe = uptake capacity (mg/g).

3. Results and Discussion

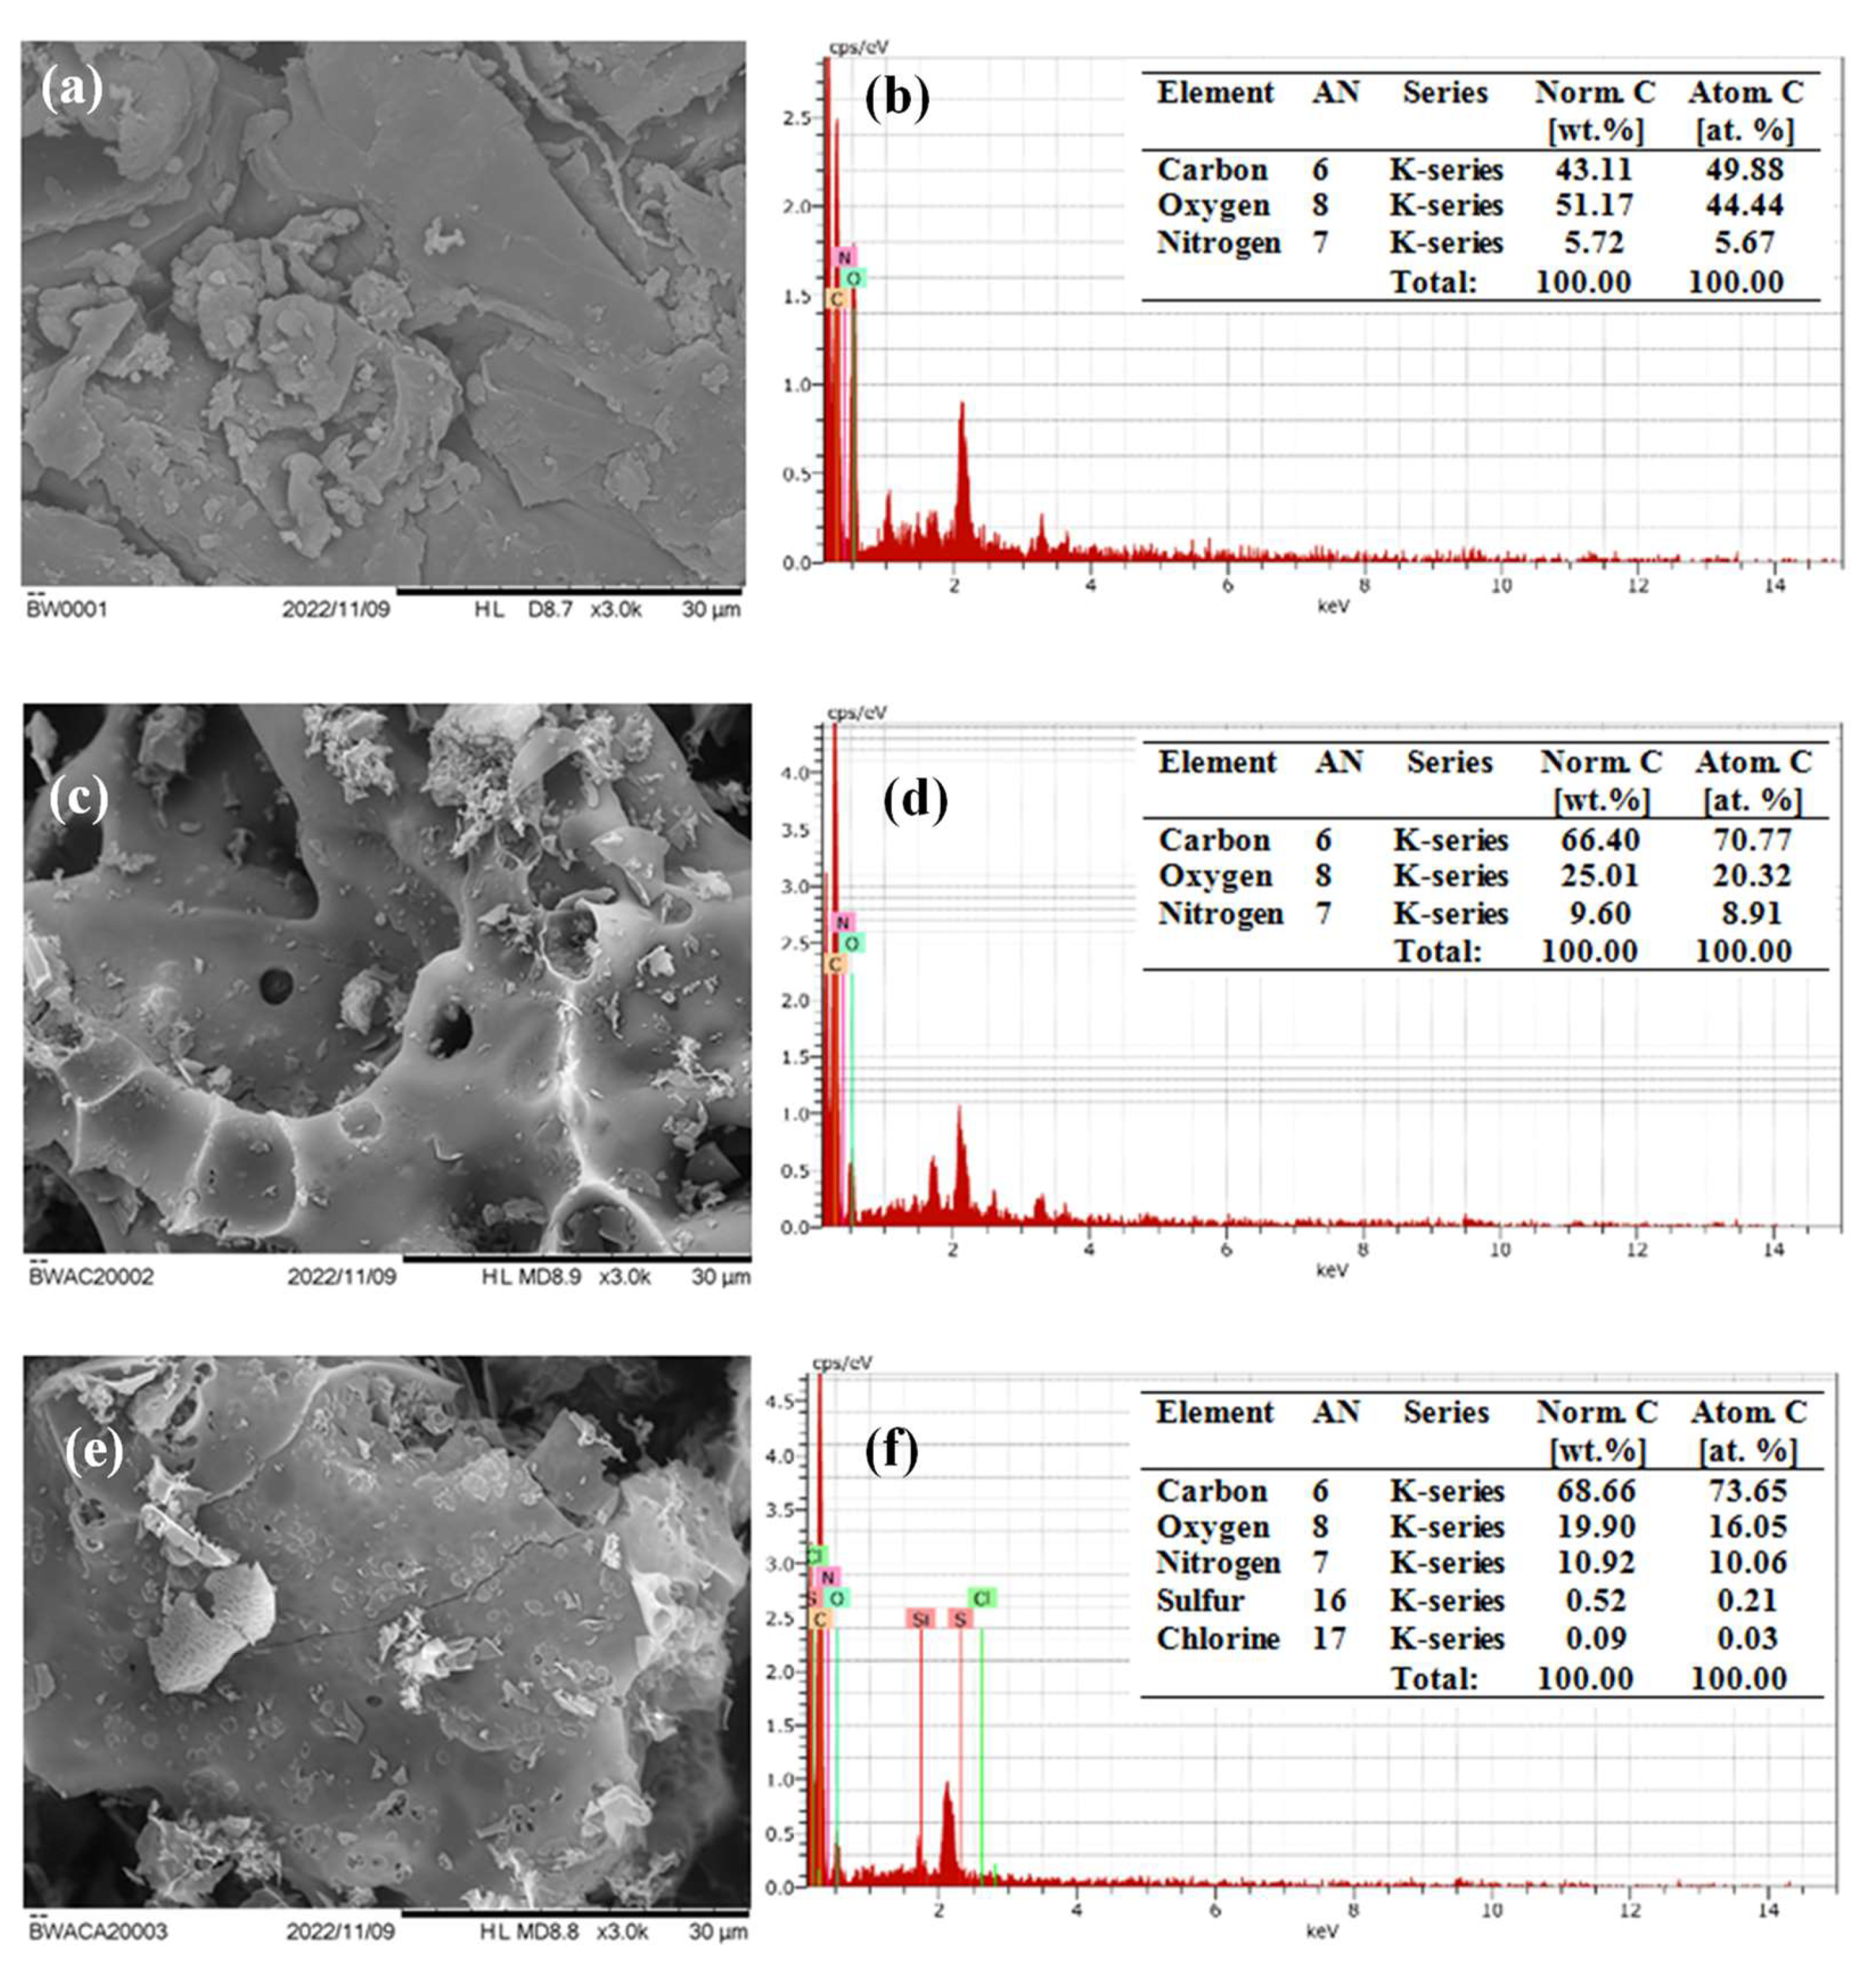
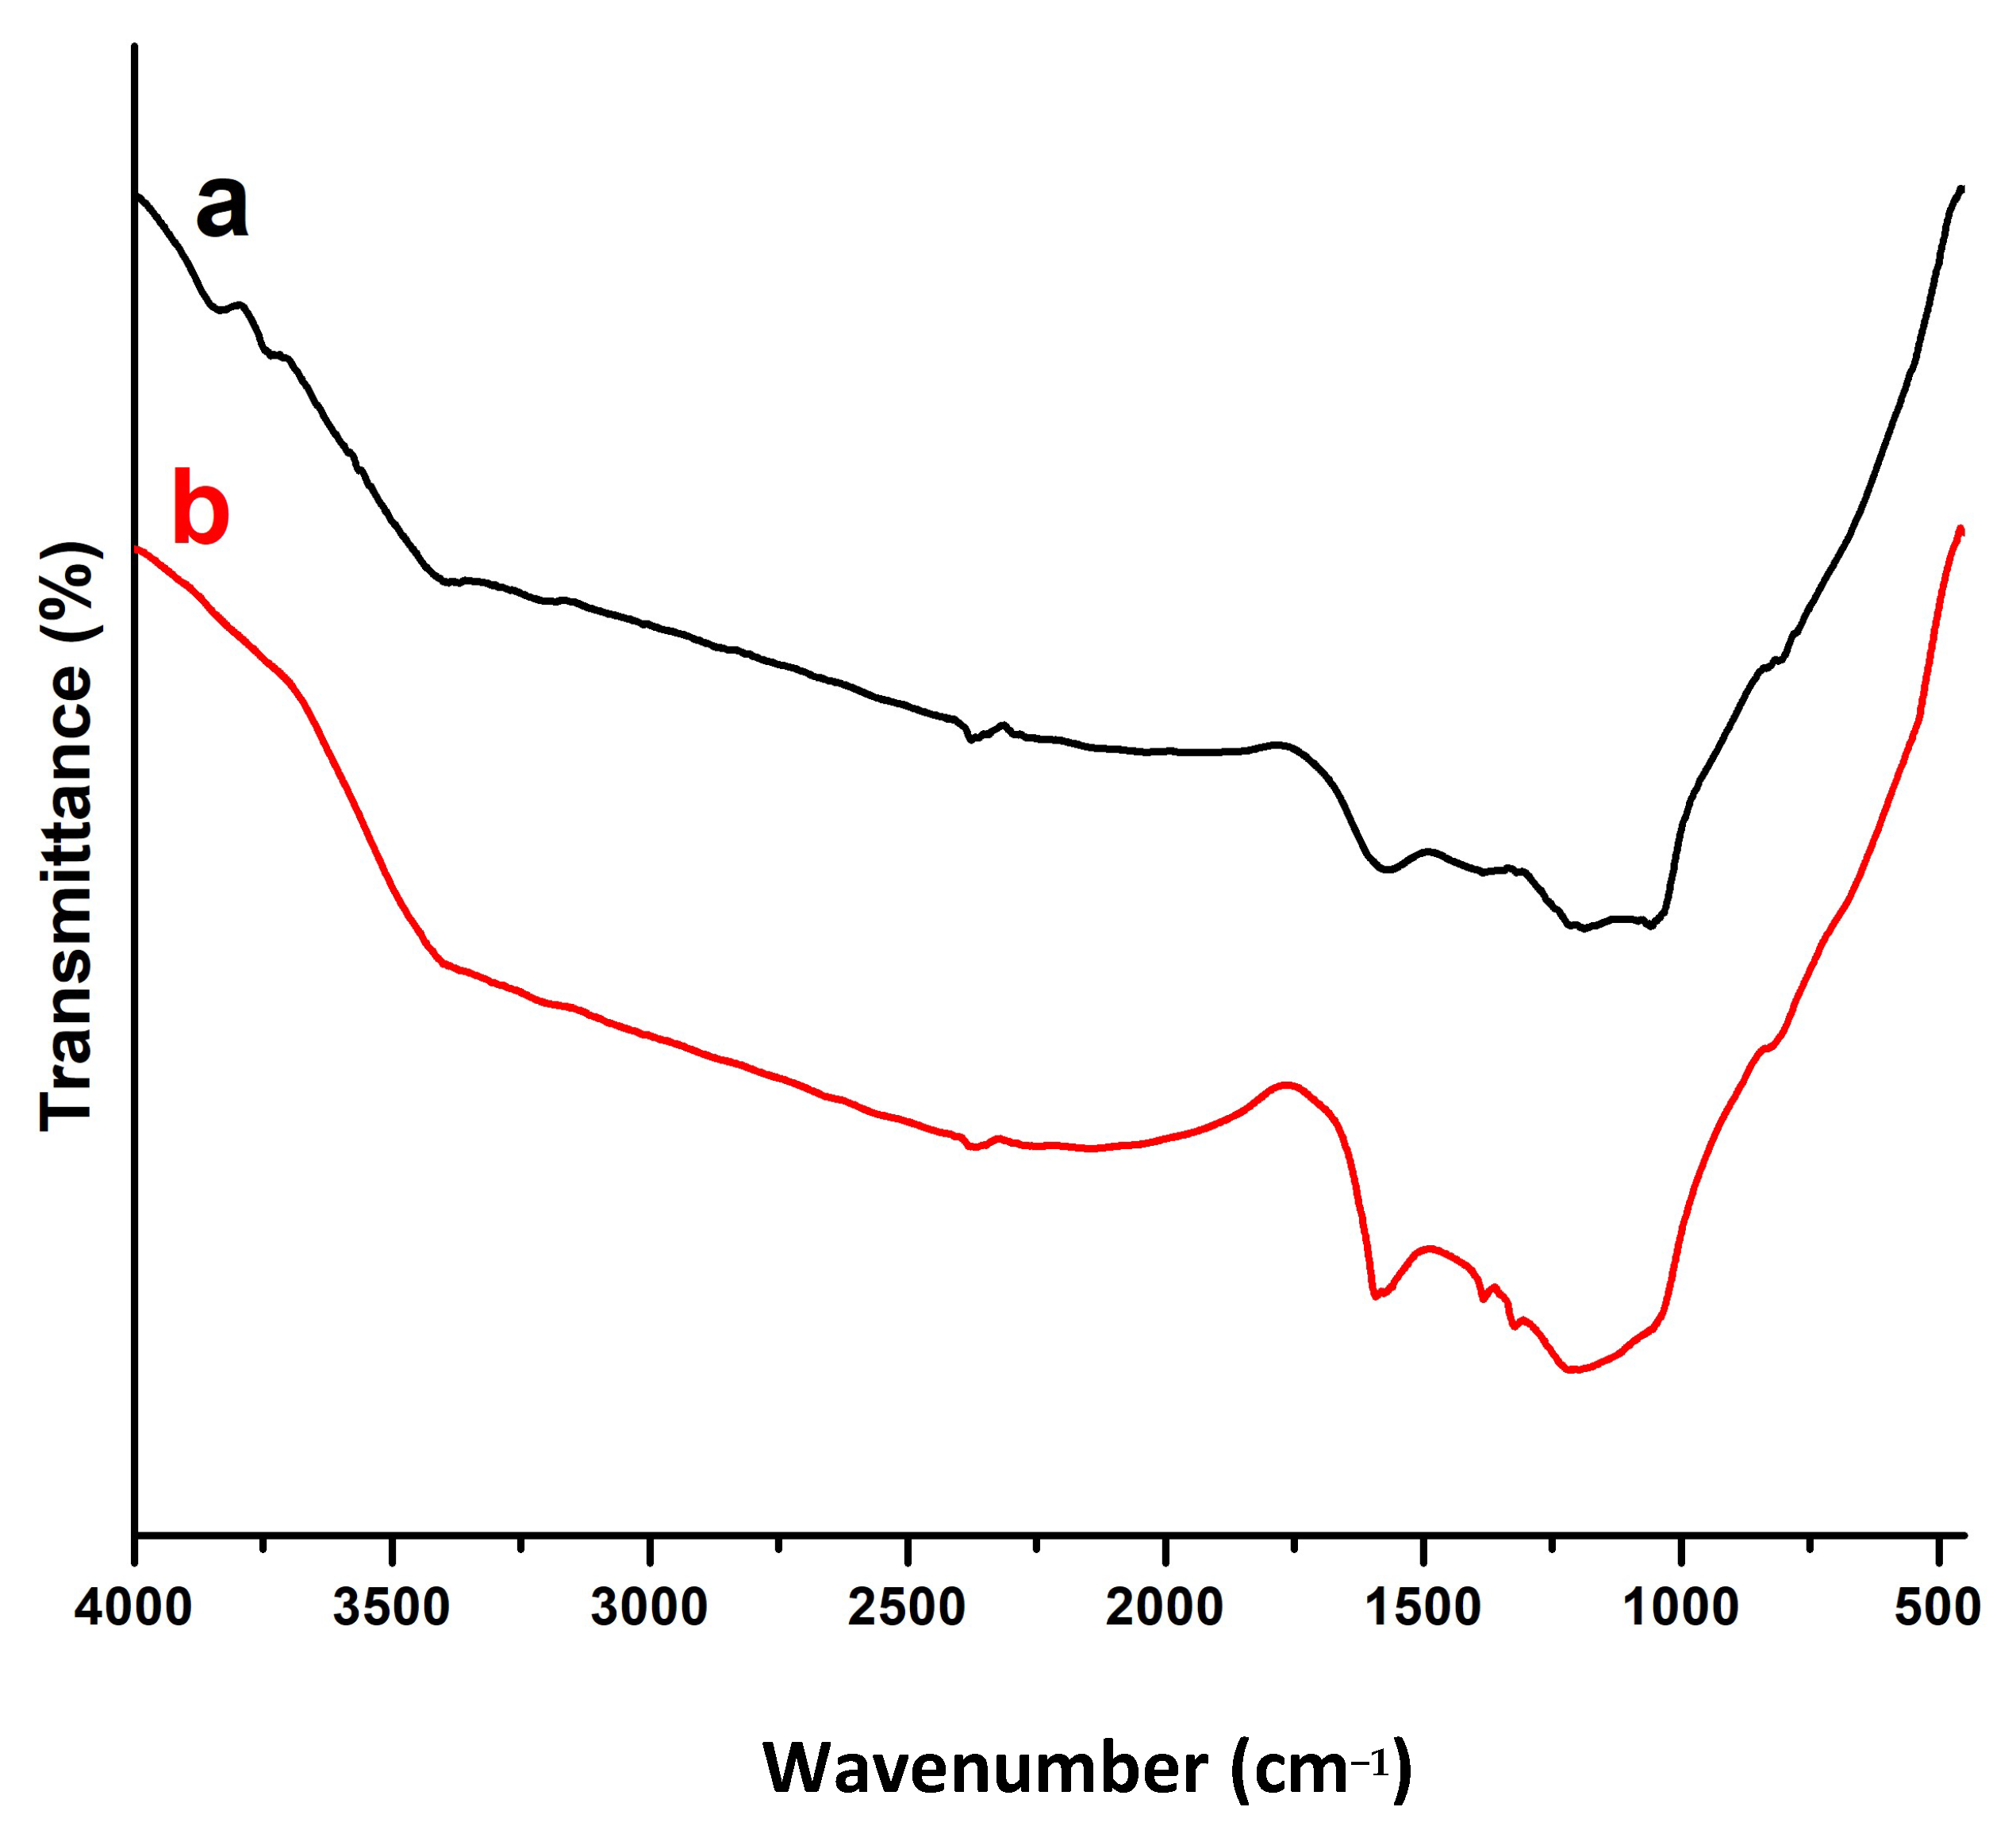
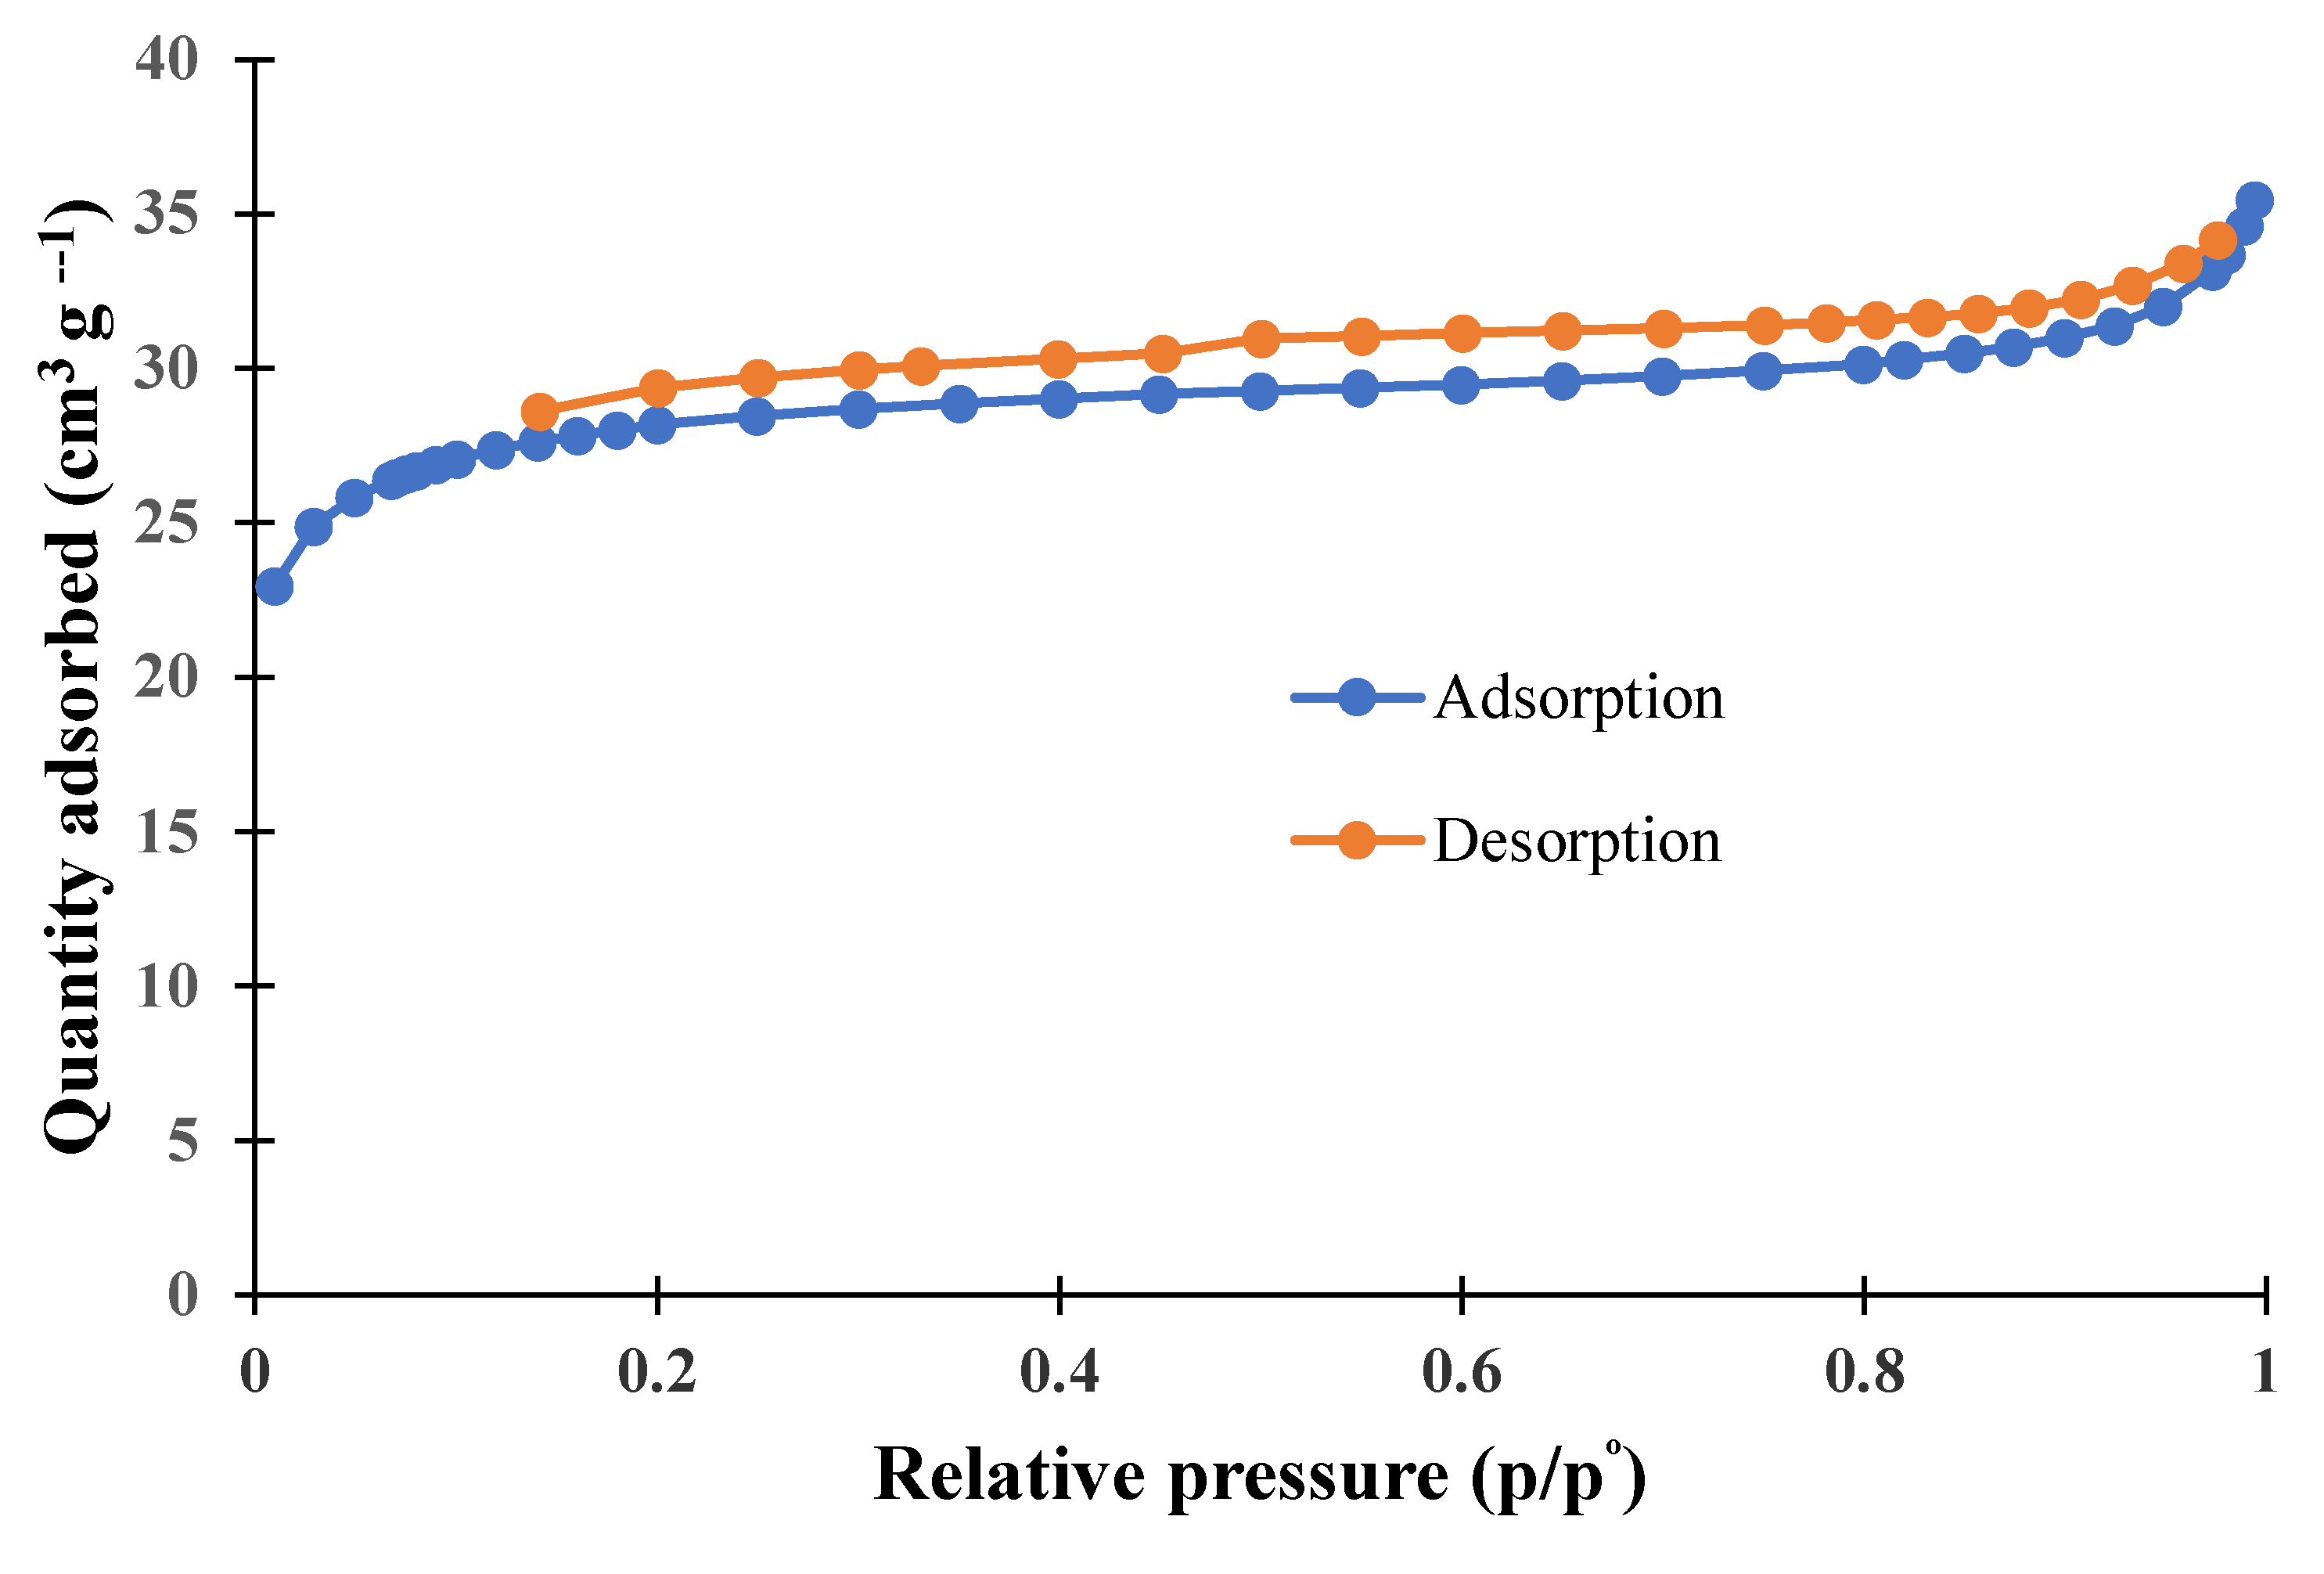
3.1. Characterization of Adsorbent

The SEM with EDX images of BW and BWAC (before and after adsorption) is presented in Figure 1. From Figure 1a, it was observed that the raw BW had a plane or smooth surface having no cavities and pores. The corresponding EDX image is presented in Figure 1b and it could be seen that the elements C, O, and N were present in the BW surface with elemental ratios (in wt.%) of 43.11, 51.17, and 5.72, respectively. Consequently, after activation of BW with K2CO3, significant changes were observed, and from Figure 1c, a flake-type activated carbon was formed with numerous irregular pores with a mesoporous structure, which will be in high demand for MB dye adsorption. The corresponding EDX data (Figure 1d) indicated the presence of C, O, and N in the ratio (in wt.%) of 66.40, 25.01, and 9.60, respectively. After MB dye adsorption, the surface of BWAC was drastically changed, as seen in Figure 1e. BWAC’s surface became a more compact and less porous surface due to the deposition of MB dye molecules on the BWAC surface. This observation was reconfirmed by EDX analysis (Figure 1e). The EDX analysis (Figure 1e) showed the elemental content of BWAC after MB adsorption as follows: C, O, N, S, and Cl with elemental ratios of (in wt.%) 68.66, 19.90, 10.92, 0.52, and 0.09, respectively. In fact, the obvious increment in carbon (C) content and detection of new elements such as sulfur (S) and chloride (Cl) indicating that the MB dye molecules were deposited in BWAC’s surface caused an alteration to the surface morphology of BWAC and elemental content.
The information about the interaction of BWAC’s surface functional groups with MB dyes is given in Figure 2. Before MB dye adsorption, the broad peak observed at 3400 cm−1 represents the –OH groups’ stretching vibrations [27]. The bend at 1203 cm−1 corresponds to C-O stretching vibrations of the carbonyl groups [34,35,36]. Lastly, one more peak was seen at 1571 cm−1, and this bend corresponds to the C=C vibrations of the aromatic benzene ring of lignin [37]. After adsorption of MB on BWAC, the positions of the bends at 3396 cm−1, 1212 cm−1, and 1573 cm−1 were slightly shifted, which specified that –OH groups on the carboxylic group and C-O groups of the carbonyl group and aromatic benzene ring present on BWAC are responsible for MB dye adsorption.
The BET analysis was conducted for the analysis of surface properties, and the obtained N2 adsorption–desorption isotherm plot of BWAC is presented in Figure 3. Furthermore, the originated surface properties from BET analysis are presented in Table 2. Figure 3 illustrates a beautiful sigmoidal curve originating in between the relative pressure of 0.2 to 1, which suggests a type IV isotherm for BWAC, revealing that the BWAC’s surface is mesoporous [38]. This suggested that K2CO3 activation resulted in the formation of a mesoporous material and, furthermore, the surface area of BWAC was 107.148 m2/g with a pore volume of 0.049 cm3/g and pore size of 2.91 nm. This high surface area provided a higher number of active pores or binding sites for MB adsorption. The expected dimensions of MB dye molecules are nearly equal to 0.7 × 1.7 nm [39] and, hence, within the pores of BWAC; MB dyes can be easily accommodated and adsorbed.

3.2. Optimization Study

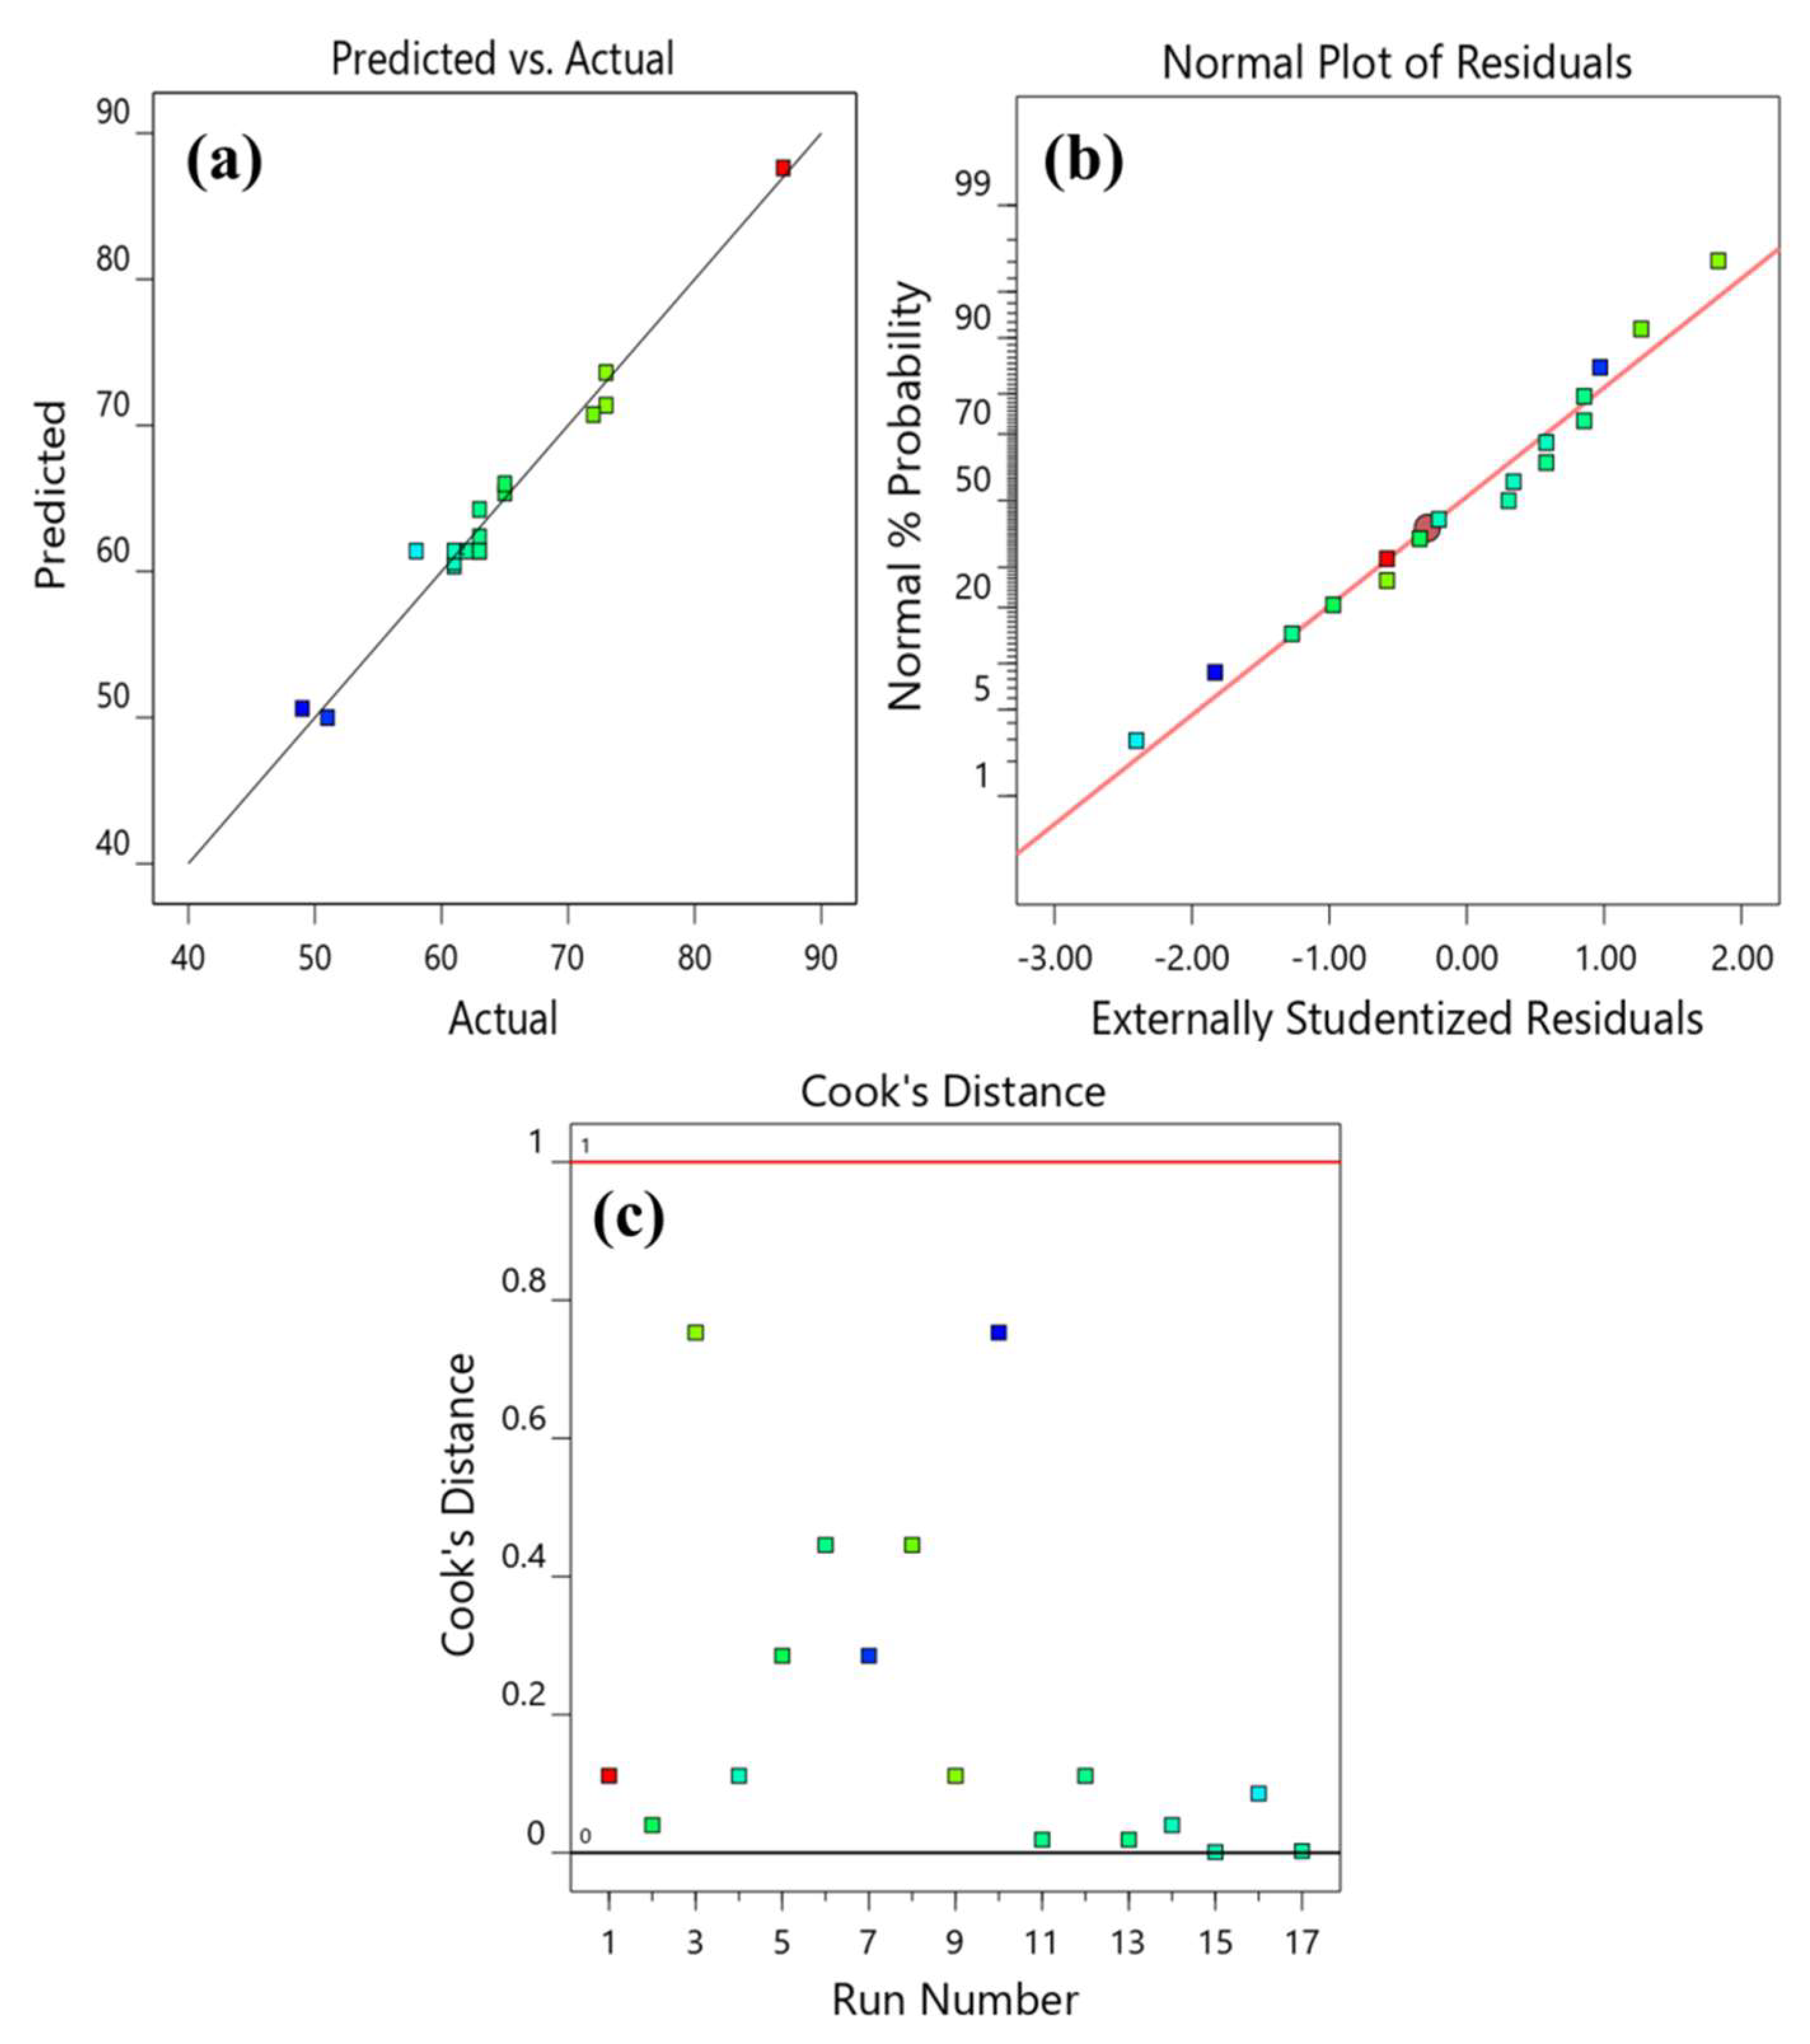
3.2.1. Regression Model Improvement

Calculated batch results of MB dye removal by BWAC from aqueous solutions, which were obtained from the 17 experimental runs conducted in different conditions, are presented in Table 3. The model recommended a quadratic model for MB removal and the obtained range of MB removal percentages was from 49% to 87%. The model was also explained by a second-order polynomial equation, which correlates the coded factors of independent variables with the response for MB removal, given in Equation (4):
Y = + 34.78 + 18.18 A + 14.00 B + 14.73 C + 10.47 AB + 9.03 AC + 7.88 BC + 2.35 A 2 + 5.50 B 2 + 5.10 C 2
where the positive and negative signs indicate the synergetic and anti-synergetic effects of MB dye removal by BWAC, respectively. The R2 (correlation coefficient) and Adj. R2 (Adjacent correlation coefficient) values could better explain the model accuracy. Higher values for R2 (approaching to one) would indicate the high accuracy and reliability of the model as well as its quality. Furthermore, Adj. R2 can better explain the model accuracy as insignificant data are eliminated during the calculation process [40]. The model obtained through the experimental design shown in Equation (4) shows high accuracy with a high R2 value nearing one, i.e., 0.98 indicating that 98% of the data can be explained by the model and only 2% of the data cannot be explained by the model, due to pure error.
Figure 4a,b show the actual versus predicted MB dye removal and normal probability of MB removal, respectively. Here, it can be observed that all the points were present near the diagonal line, suggesting that the batch adsorption data of MB removal fitted well with the model response. This confirmed that the model formulated for MB dye adsorption by BWAC is highly momentous. Figure 4c shows the Cook’s distance of MB removal, and it can be seen that all the 17 points are present below 1, which further proves the statistical significance of the model [17]. These observations confirmed that the present developed model is adequately significant.

3.2.2. Analysis of Variance (ANOVA)

The ANOVA data for MB removal from aqueous solutions by BWAC are presented in Table 4. The ANOVA data are generally based on probability (p) and F-value, and p-values of lower than 0.05 indicate that the model is a statistically efficient, accurate, and significant one, where the findings are not random [41,42,43,44]. Here, the p-value of the model was less than 0.0001 with an F-value of 31.49, which confirms that the model was significant. Other terms such as the lack-of-fit test and coefficient of variation (CV) were also taken into consideration for model accuracy check. If the lack of fit test is non-significant and CV values are less than 10%, then the model results are good and accurate [42,45]. Here, the lack-of-fit test was non-significant with a CV of 3%, further confirming the significance of the model. In this design model, the effect of adsorbent dose showed a higher effect on MB removal as it had a high F-value of 121.70, followed by contact time with an F-value of 60.17. The solution pH had very little effect on MB removal with an F-value of 10.73. Except for the square of pH, all other model terms were significant, so the model had very high R2 and Adj. R2 values.

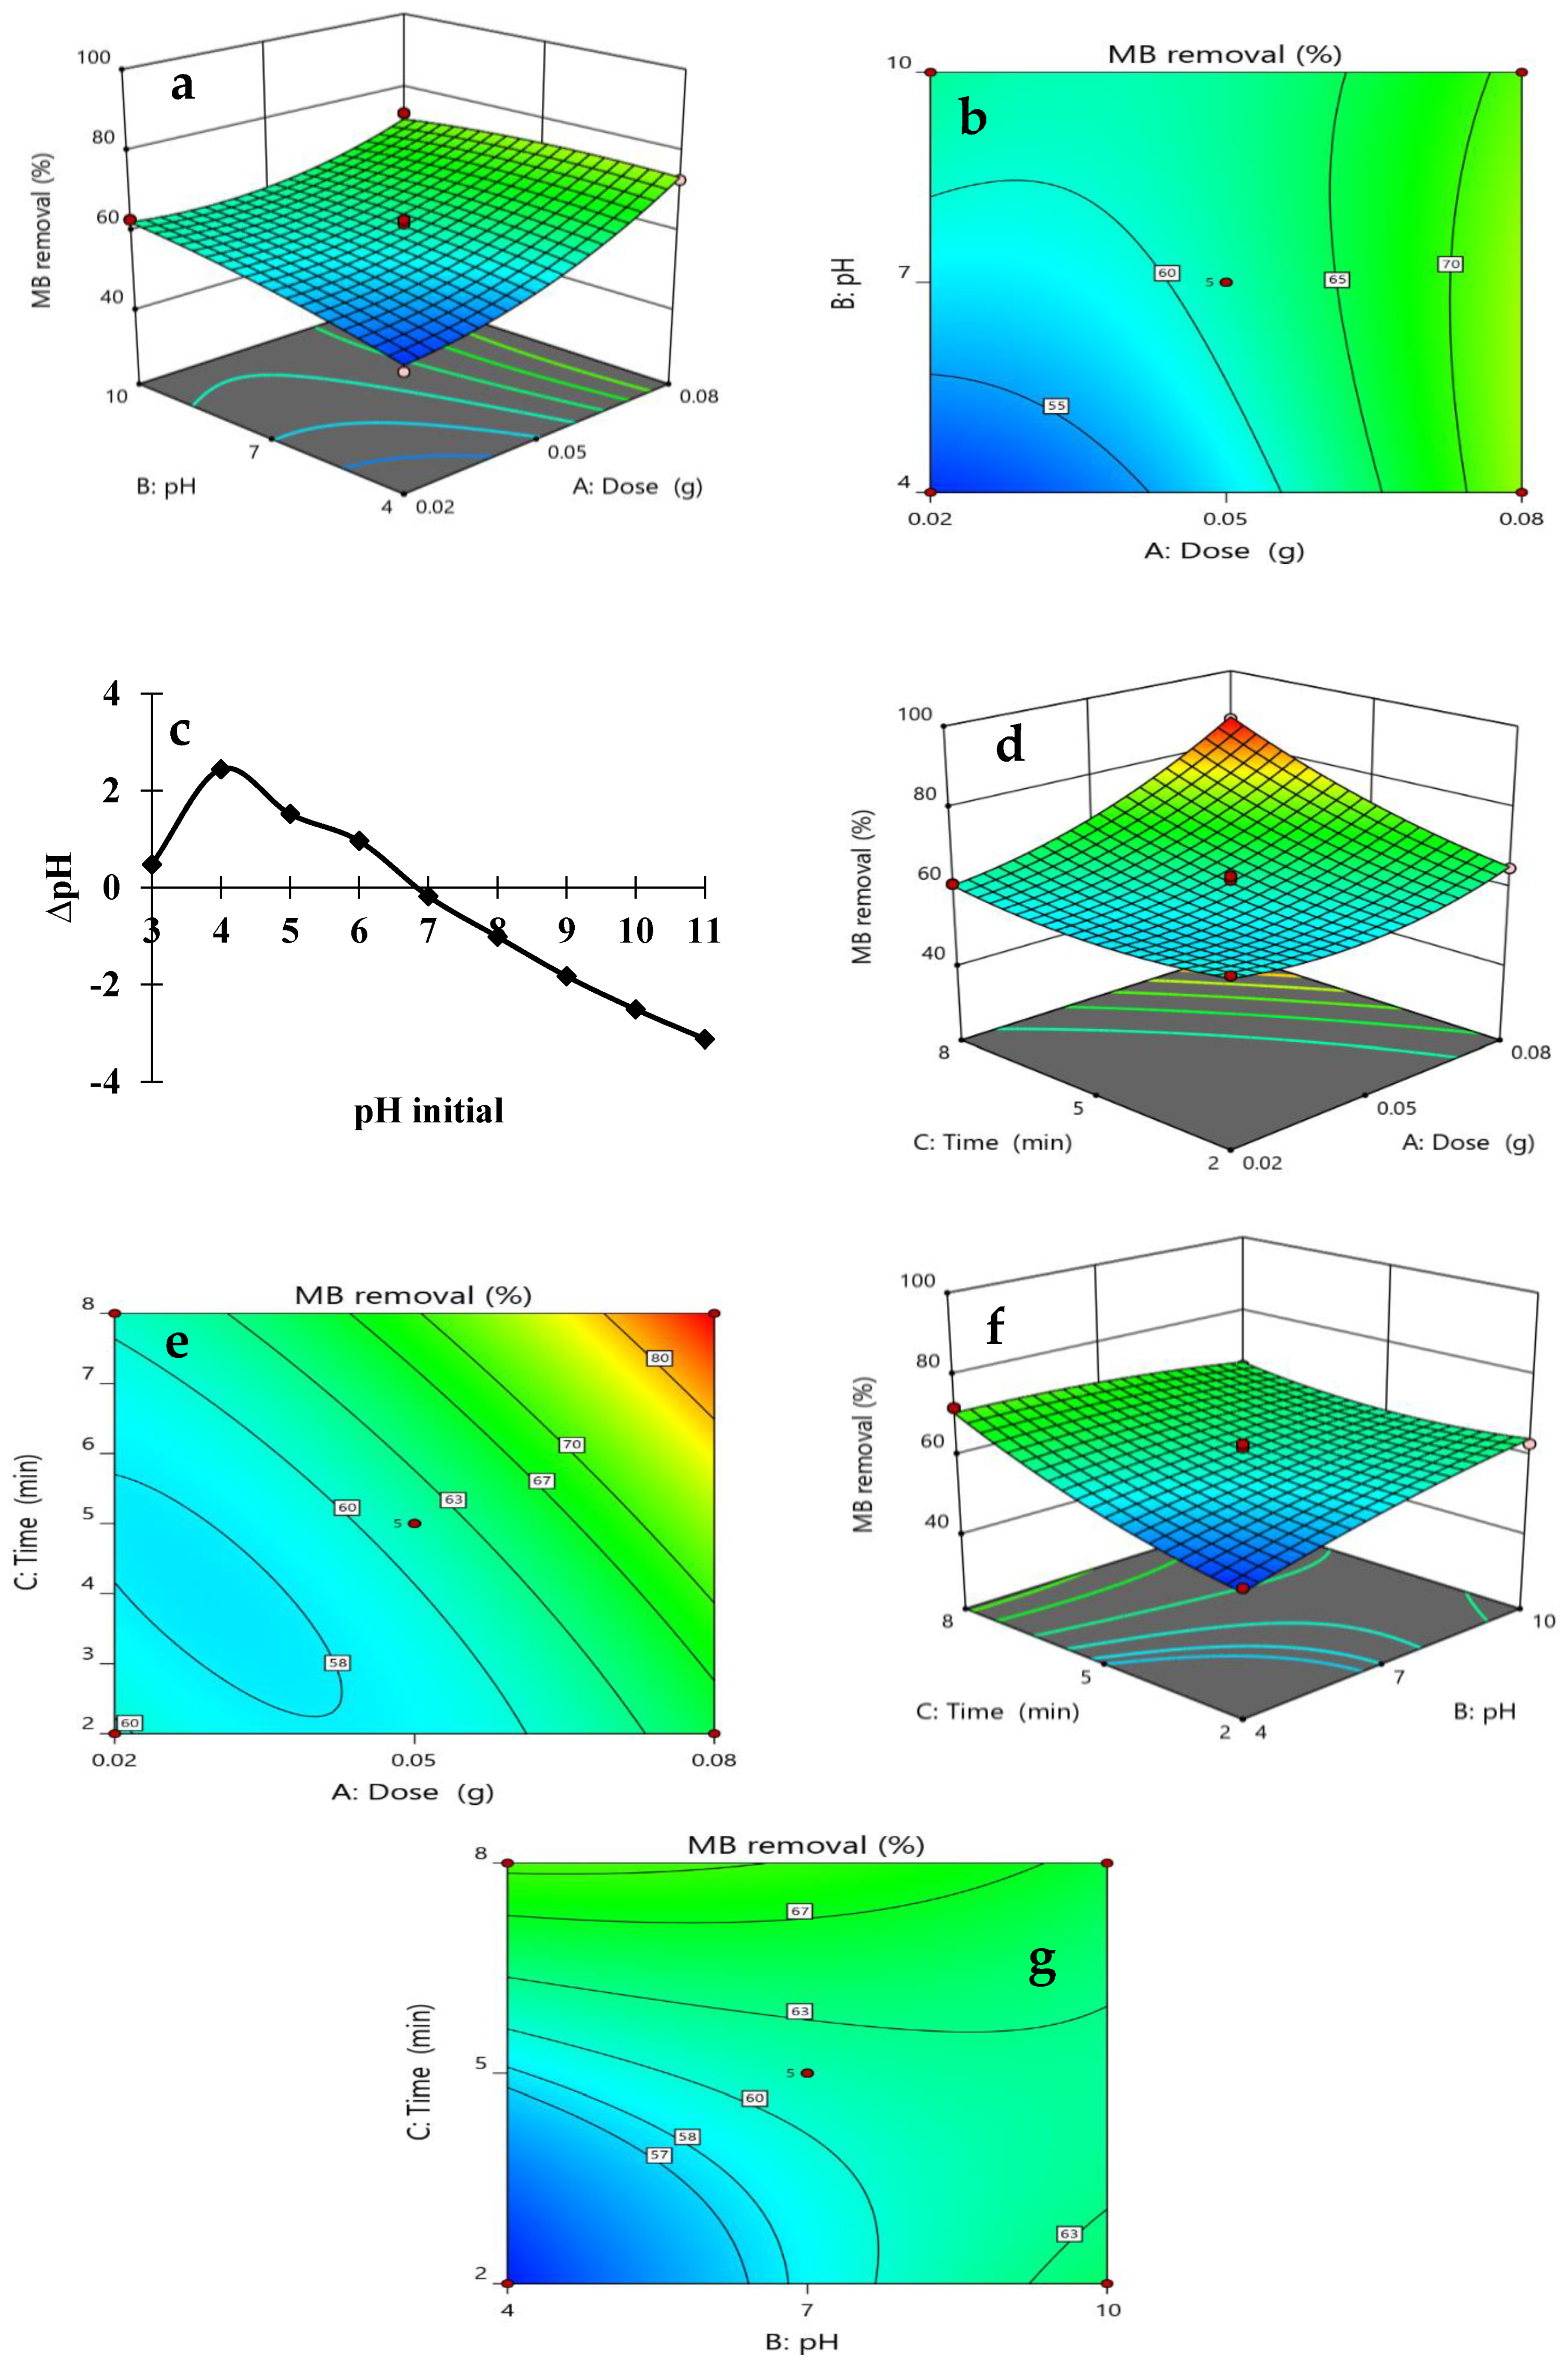
3.2.3. Interactive Effects on MB Removal

The 3D and contour plots were used for better explanation of MB dye removal where the combined effects of two independent parameters were studied while the third parameter was kept constant. Figure 5a,b present the interactive effect of BWAC dose and pH while the time was kept constant at 5 min. The interaction was significant with an F-value of 11.65. Here, it was observed that with greater values of BWAC dose from 0.02 g to 0.08 g, the MB removal drastically increased from 55% to 70%, respectively. A higher amount of dose provides more binding sites for MB dye molecules and increases the removal capacity [43]. On the other hand, the same observation was seen for pH, and it was seen that with an alteration in pH from 4 to 10, MB dye removal improved from 40% to 60%, respectively. Figure 5c shows that the point of zero charge (pHpzc) for BWAC was at the pH value of 6.9; hence, below this pH, the surface of BWAC had a positive charge and, above this pH, it had a negative charge. As MB dye is a cationic dye and at higher pH, BWAC’s surface becomes negatively charged, electrostatic attraction can occur between them, which leads to a higher adsorption of MB dye by BWAC. The same conclusion was reached for MB dye removal by watermelon-rind-activated carbon in a previous study [17]. Figure 5d,e explain the combined effect of BWAC dose and time, while the pH was kept constant at 7. The respective p-value was found to be 0.0010 with an F-value of 28.76. With the change in time from 2 to 8 min, the removal rate improved from 60% to 77% respectively. At the beginning of the adsorption process, the dye molecules were attached to the surface of the adsorbent, and with the increase in time, they would diffuse into the pores of the activated carbon. Therefore, the removal rate became higher with the increase in adsorption time. The effect of BWAC dose became the same as discussed above. Lastly, the effects of pH and time for MB dye removal at a constant BWAC dose of 0.05 g are displayed in Figure 5f,g. This was also a significant interaction with an F-value of 21.45. The observation for both was the same as discussed above and, in both cases, the removal rate was increased with an increase in pH and time, respectively.

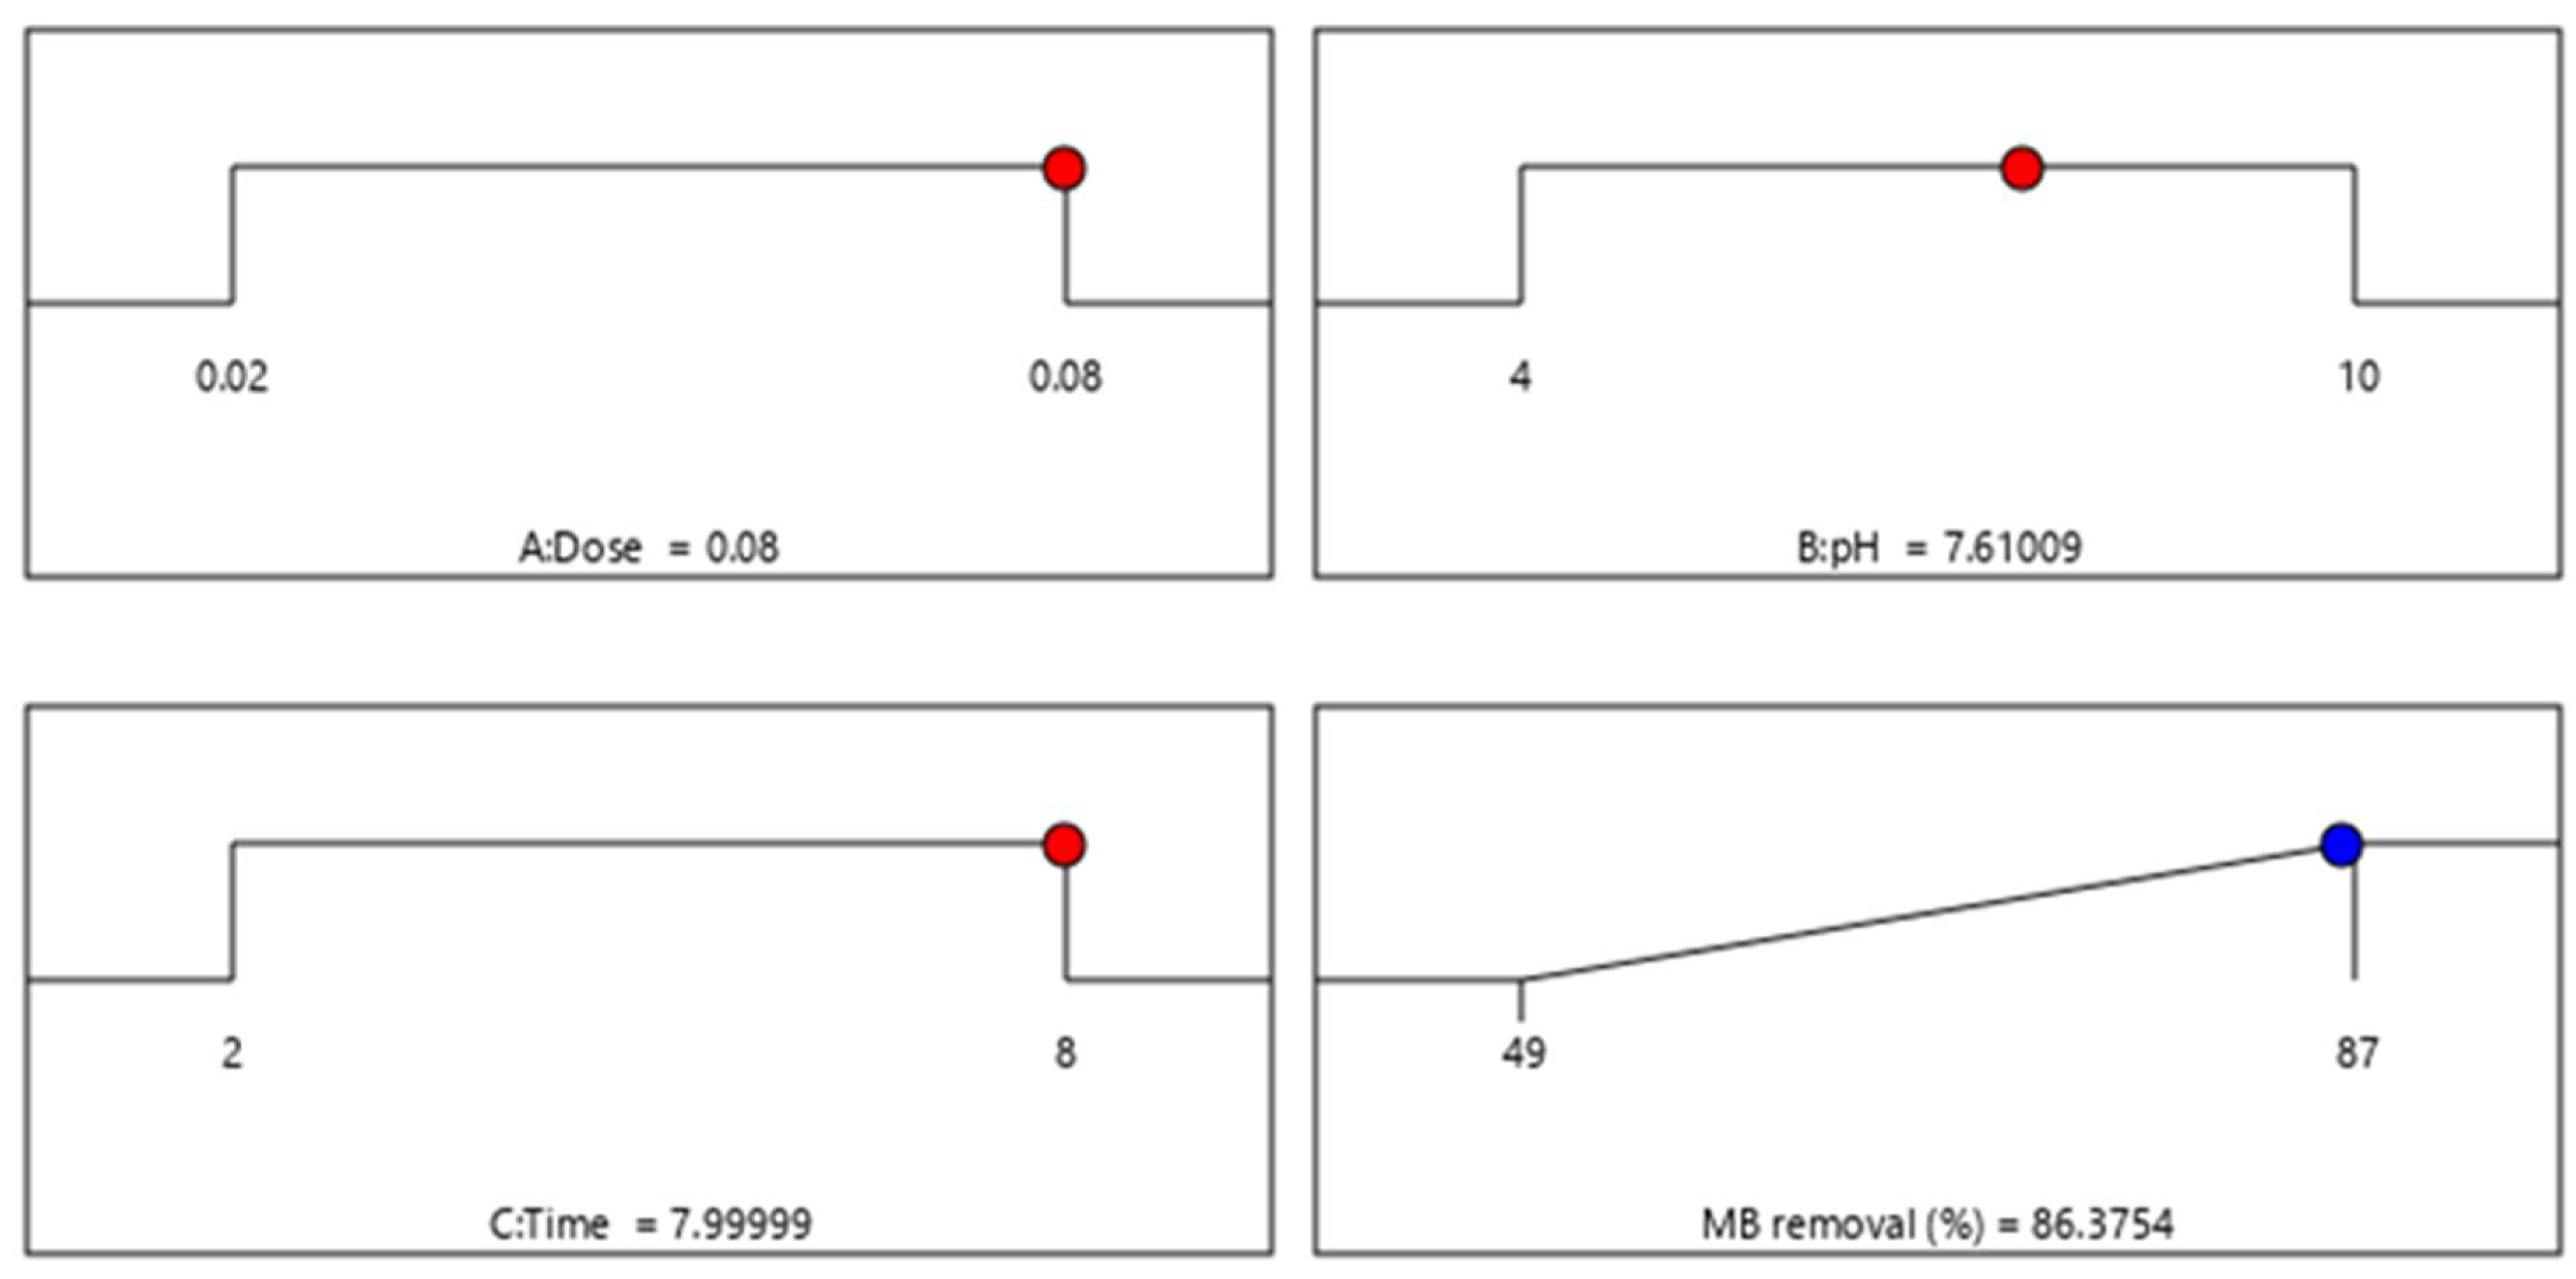
3.2.4. Model Validation and Desirability Function for MB Removal

The BBD model accuracy for MB removal by BWAC was validated by the desirability function approach. Figure 6 presents the best desirability functions of the BBD model for maximum removal of MB by BWAC. Under these most desirable operational conditions of adsorbent dose, pH, and time, the batch adsorption studies were conducted three times and the results found are presented in Table 5. The results suggested that batch studies were significantly aligned with the desirability approach of the model. Hence, this confirmed that the BBD model was accurate and best to explain the desirable conditions of adsorbent dose, pH, and time for MB removal.

3.3. Adsorption Experiments

The adsorption study for MB was carried out preferring the optimum investigational conditions as given in Table 5 (BWAC dose = 0.08 g and pH = 7.62) at various initial MB dye concentrations from 20 to 100 mg/L versus the variation in contact time as given in Figure 7. From the figure, it can be seen that with an increase in concentration from 20 to 100 mg/L, the adsorption capacity of BWAC was increased from 23.83 mg/g to 107 mg/g. Hence, it is suggested that MB dye molecules entered and infused into the pores of the BWAC adsorbent surface by a driving force in the higher concentrations, which can allow the adsorbent to better display its adsorption capacity at any given time [42,45].

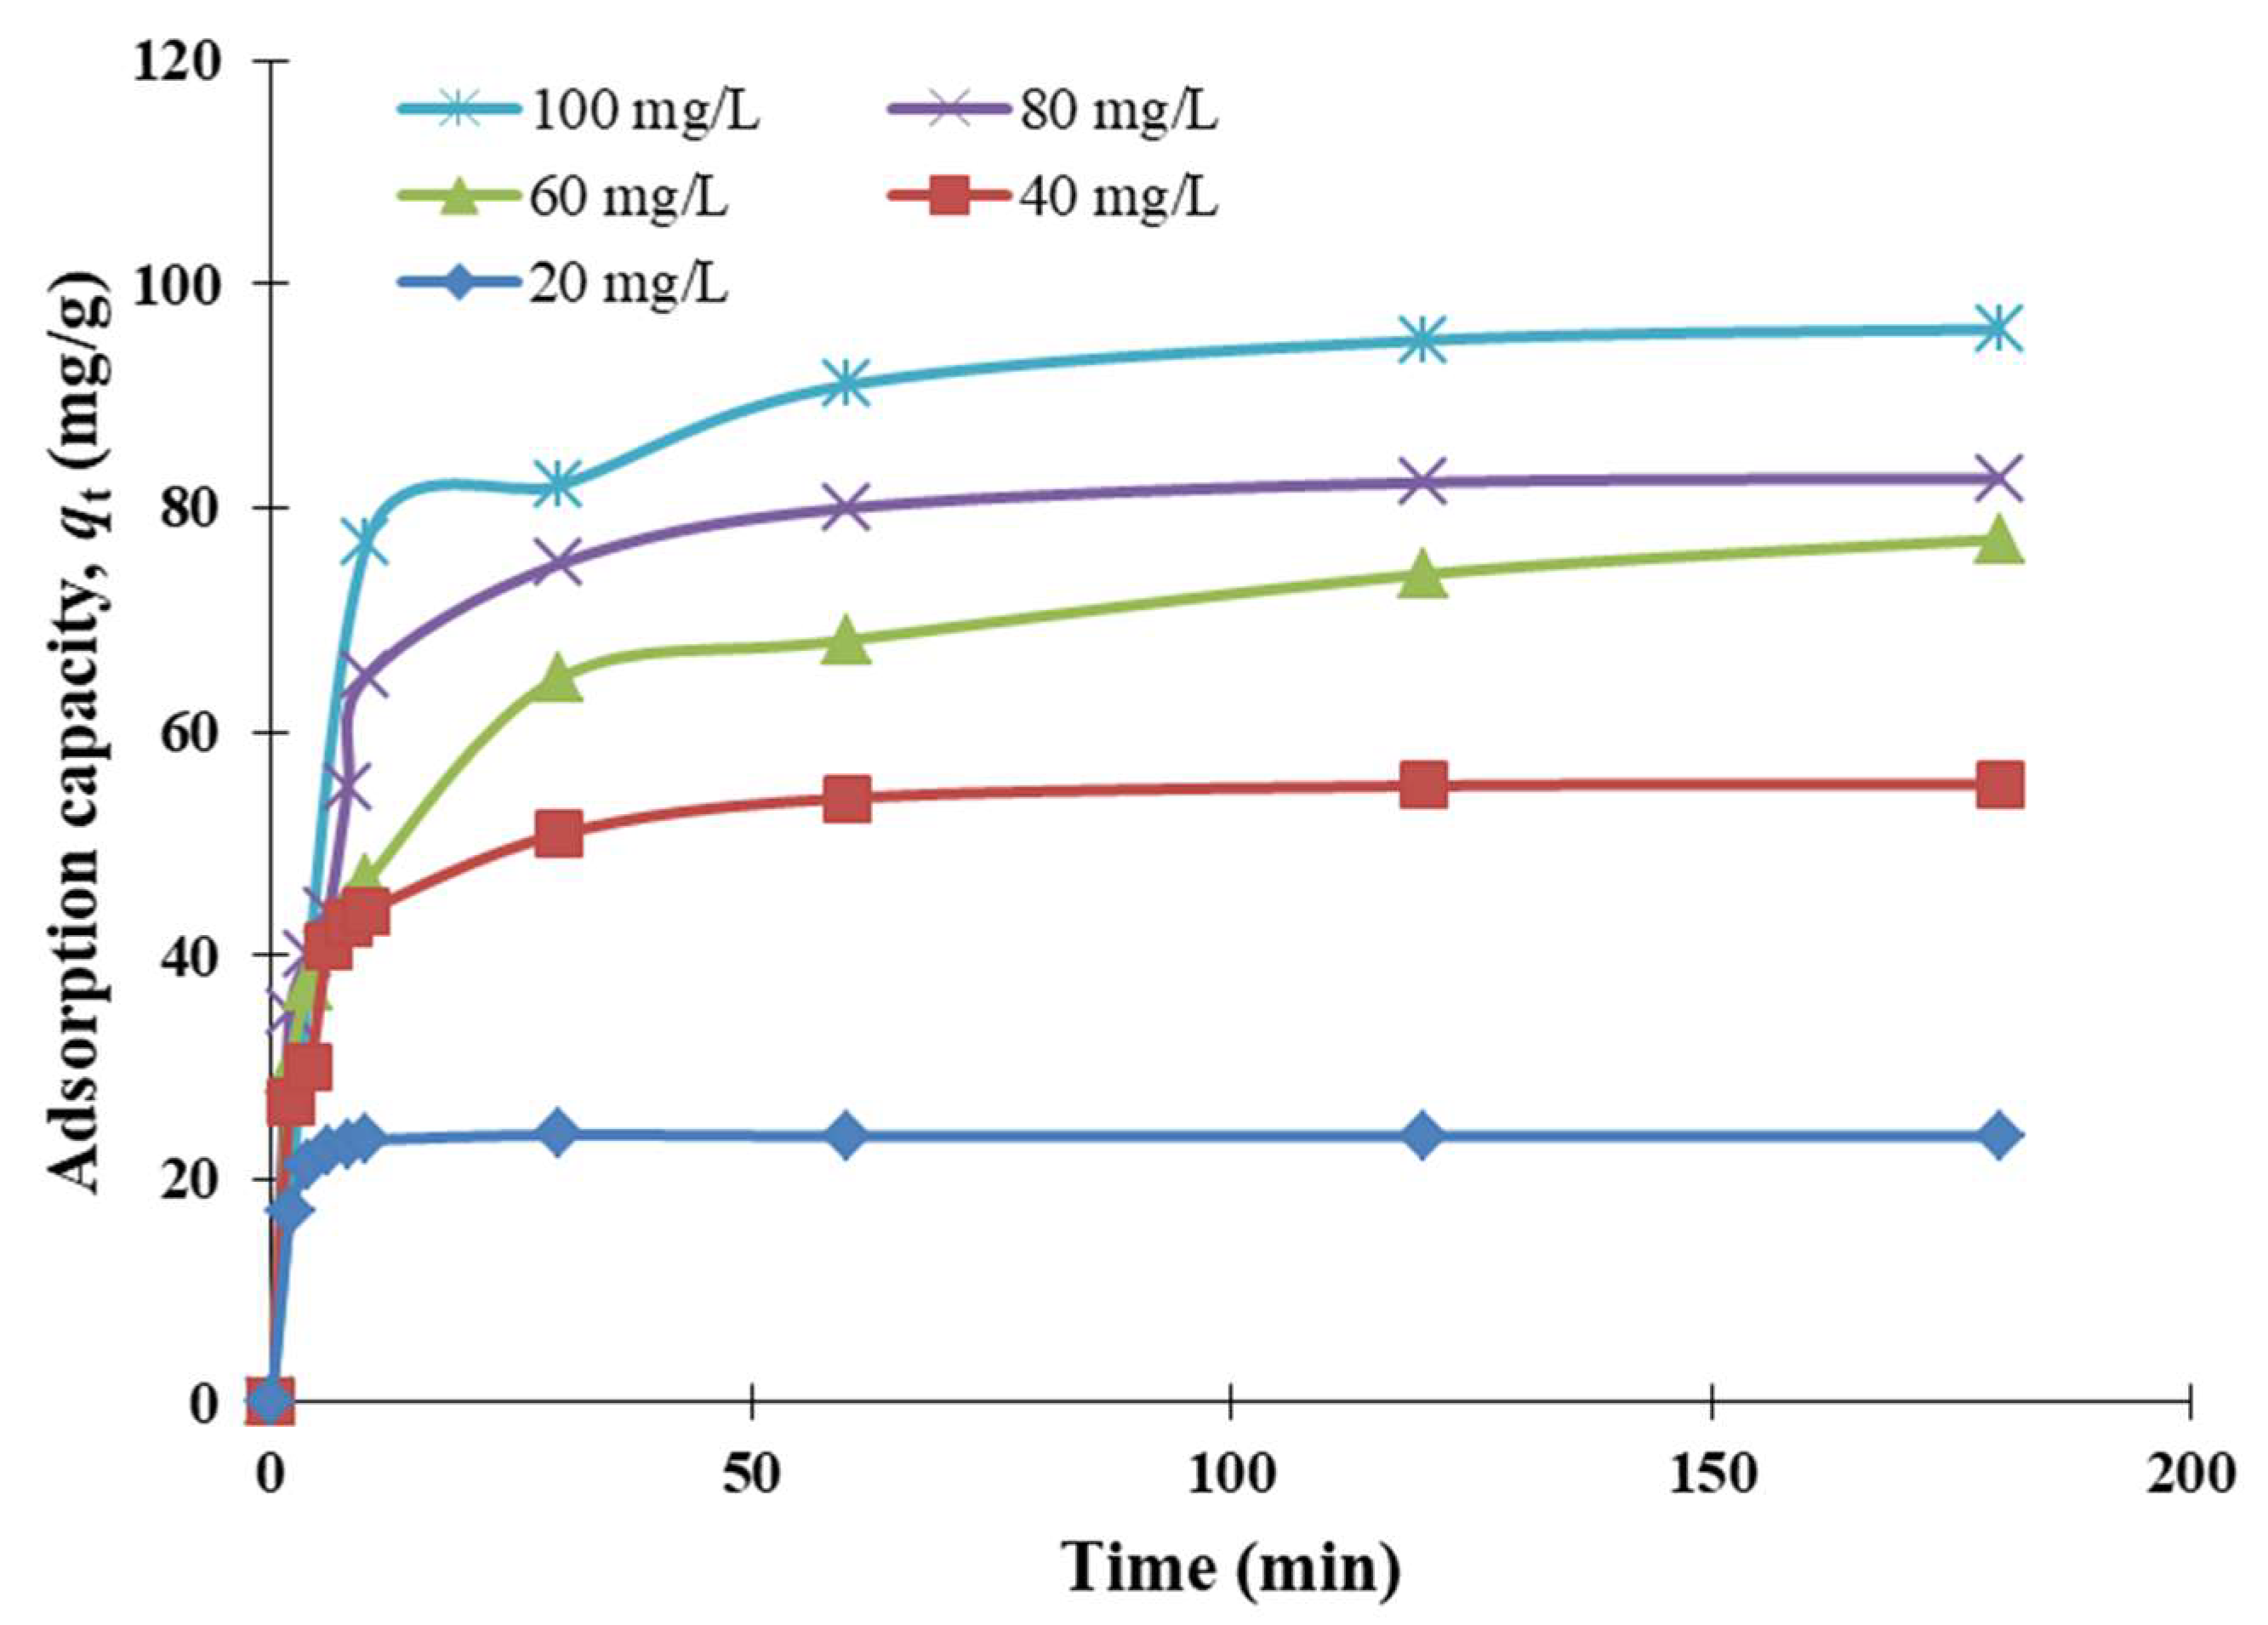
3.4. Adsorption Kinetics

The study of kinetics is an essential step in the process of adsorption as it can directly account for the feasibility of the process and the rate of the reaction. The MB dye adsorption experimental data were examined using the pseudo-first-order kinetic model (PFO) and pseudo-second-order kinetic model (PSO). The nonlinear PFO and PSO equations are given as Equations (5) and (6), respectively.
q t = q e   ( 1 exp k 1 t )
q t = q e 2 k 2 t 1 + q e k 2 t
where the rate constants for PFO and PSO models are k1 (1/minute) and k2 (g/mg minute), respectively; qe and qt (both mg/g) represent the quantity of the adsorbed MB dye at equilibrium and at time t, respectively. Table 6 represents the kinetics parameters including rate constants and correlation coefficients. In the case of the PFO model, a straight line was observed with a notable deviation in the calculated and experimental data. The PSO model was well fitted to the experimental results of MB with an R2 value of 0.99 and a good agreement between the calculated qe and qe experiment. The rate constant k2 was also higher than k1 in all the concentrations, which also suggested that the PSO model was best fitted to the experimental data than the PFO kinetic model. One more thing was observed here with the increase in the initial concentrations: both k1 and k2 values decreased because the adsorption process was concentration-dependent and, at higher concentrations, the removal capacity decreased as a result of which the observed and calculated adsorption capacities showed a deviation and mismatch in the kinetic model with experimental data, respectively [44]. This concludes that the adsorption systems studied can be categorized under the PSO kinetic model, based on the assumption that the rate-limiting step is mainly due to chemisorption [45].

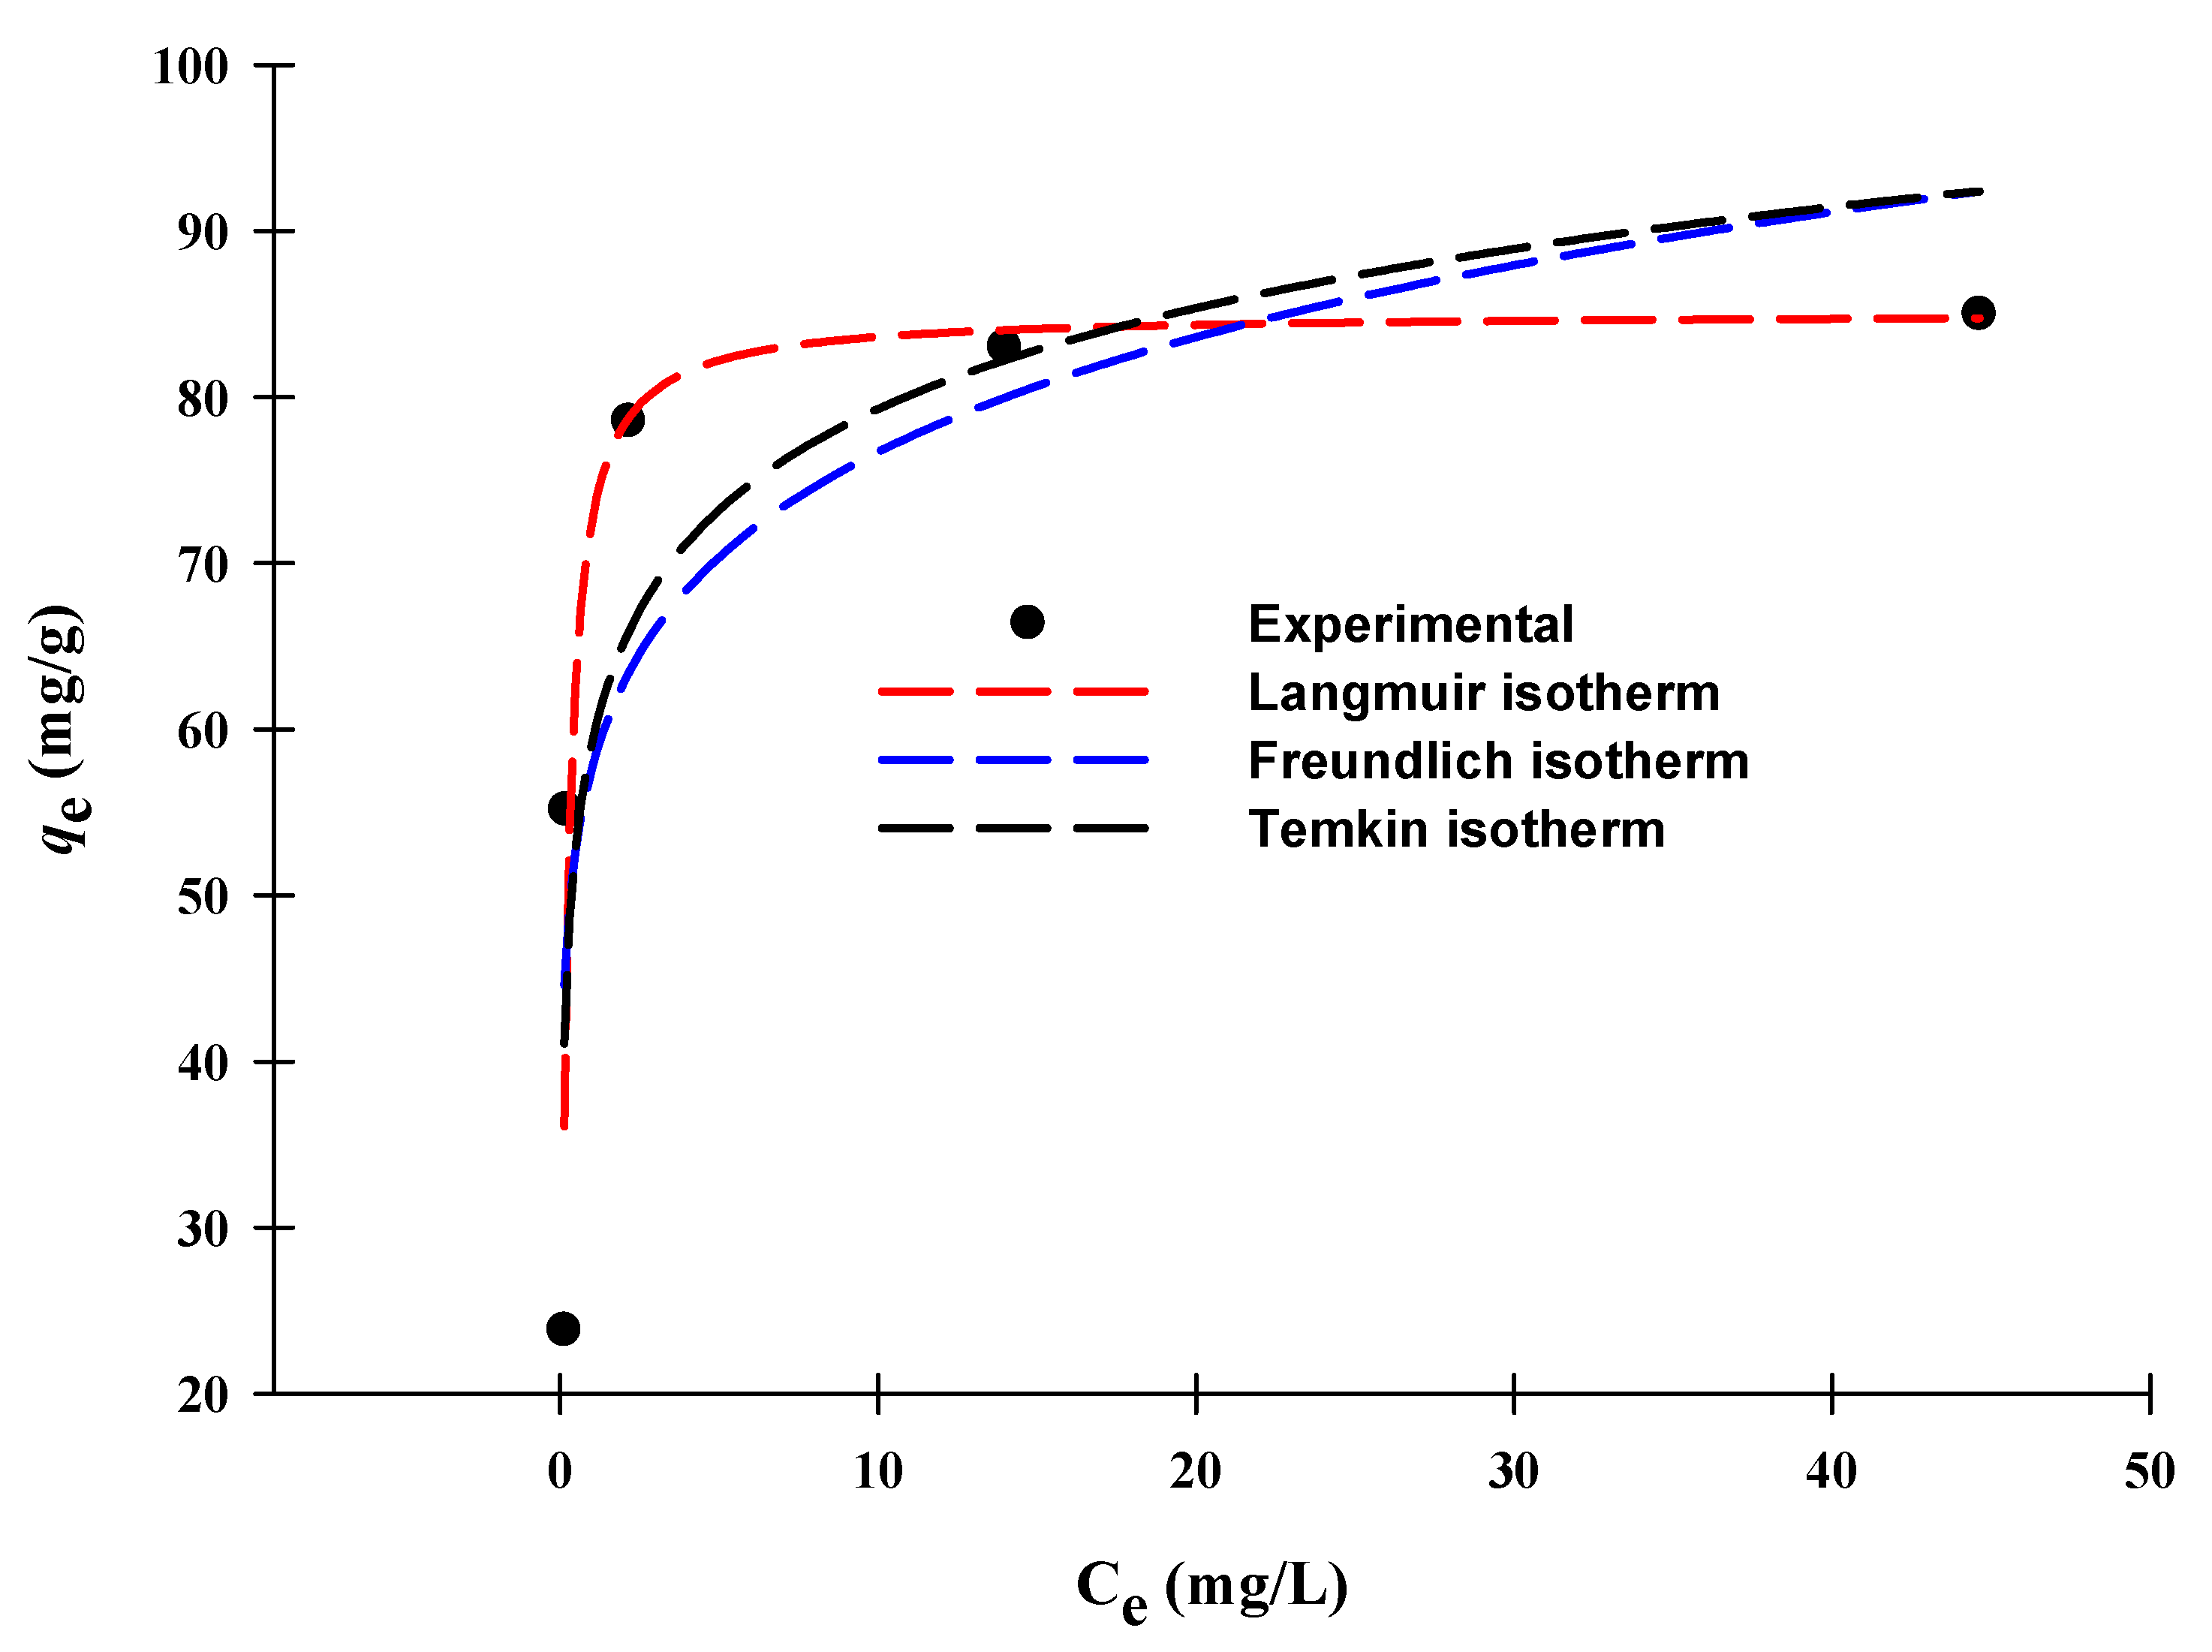
3.5. Adsorption Isotherm

The most frequently used adsorption isotherm models are Langmuir, Freundlich, and Temkin. The Langmuir isotherm model relates to the monolayer coverage of homogenous distribution, where the adsorption and desorption rates depend upon the covered and uncovered surfaces of the absorbent [46]. The adsorption process is homogeneous and multilayer adsorption occurs in the case of the Freundlich isotherm model [47]. The Temkin isotherm model explains the binding energy of the adsorbing molecules where there is a linear decrease in heat of adsorption for all the molecules [48]. The non-linear Langmuir, Freundlich, and Temkin isotherm models can be explained by Equations (7), (8), and (9), respectively.
q e = q max K a C e 1 + K a C e
q e = K f C e 1 / n
q e = RT b T   ln ( K T C e )
where Ce = equilibrium concentration (mg/L); qmax = maximum adsorption capacity (mg/g); qe = adsorption capacity (mg/g); Ka (L/mg) and Kf (mg/g (L/mg)1/n) = Langmuir and Freundlich model constants, respectively; bT (J/mol) and KT (L/mg) = Temkin constants; R and T = universal gas constant and temperature, respectively.
Figure 8 shows information about the adsorption isotherm models and the respective parameters are tabulated in Table 7. The Langmuir isotherm model was favorable with the experimental data, which had an appropriate R2 value of 0.95 as compared to the Freundlich isotherm model with an R2 value of 0.84 and the Temkin isotherm model with an R2 value of 0.87. According to the Langmuir isothermal model, the adsorption process of MB dye on the surface of BWAC had a homogenous distribution by the presence of a polar oxygen group and graphemic group on the surface [17]. The maximum adsorption capacity of BWAC was found to be 85.6 mg/g. The comparison of the adsorption capacity of BWAC with other biomass-based activated carbon materials prepared by different types of chemical activators can be found in Table 8. For the potential application of removing the cationic MB dye, BWAC can be considered an efficient and low-cost adsorbent.

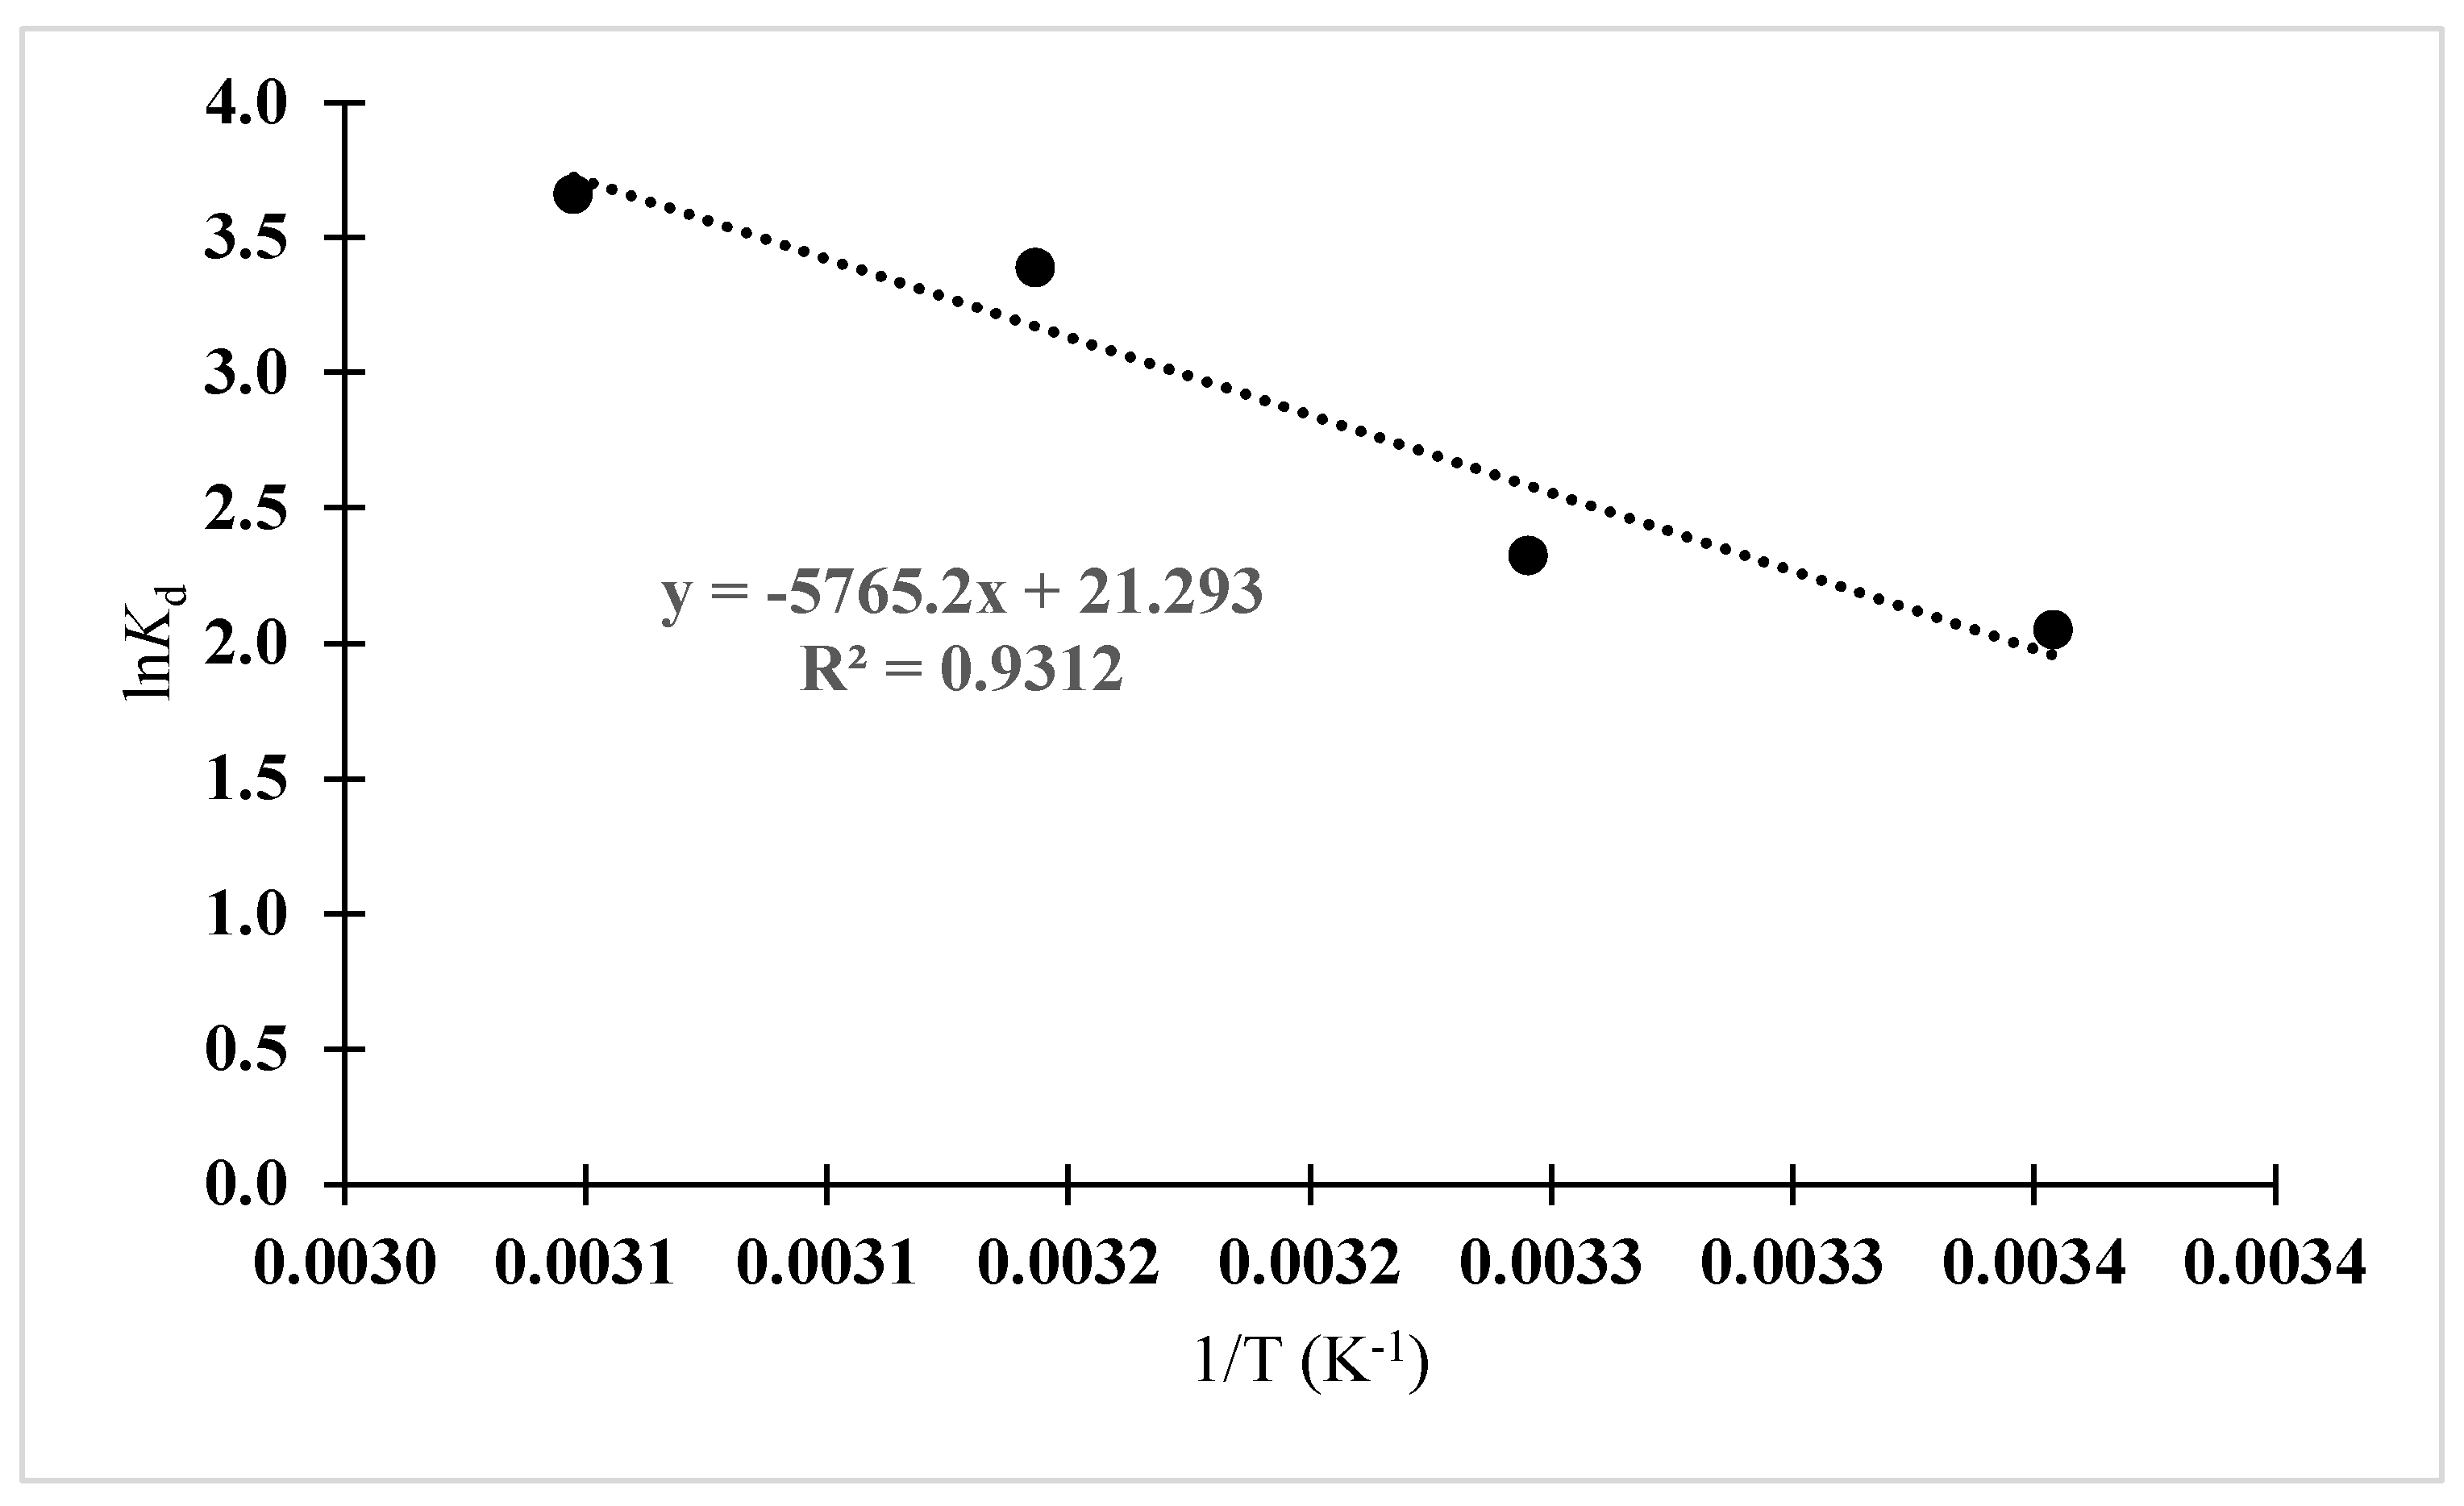
3.6. Thermodynamics Study

Adsorption studies were carried out at temperature conditions ranging from 25 to 55 °C, to investigate the effect of temperature on the adsorption of MB dye on BWAC. The standard change in Gibb’s free energy ΔG0 (kJ/mol), enthalpy ΔH0 (kJ/mol), and entropy ΔS0 (kJ/mol K) are adsorption functions that provide information about the process and adsorption behavior of an isothermal system, which were calculated using Equations (10)–(12) accordingly.
Δ G 0 = RT ln K d
K d = q e C e
ln K d = Δ S 0 R Δ H 0 RT
where ΔG0 = free energy change; ΔH0 = enthalpy change; Kd = thermodynamic distribution coefficient; ΔS0; = entropy change. The thermodynamic studies were conducted according to operational conditions in Table 5 with the change in temperature from 25 to 55 °C. The relative thermodynamic output from the Van’t Hoff plot (Figure 9) is presented in Table 9. Parameters such as ΔS0 (0.13 kJ/mol K) and ΔH0 (35.67 kJ/mol) had positive values, which confirms that the adsorption process was successful and endothermic [61]. On the other hand, the –ve values of ΔG0 (−5.08, −5.94, −8.96, and −9.98 kJ/mol) indicate that the adsorption of MB dye on the BWAC surface was a spontaneous process.

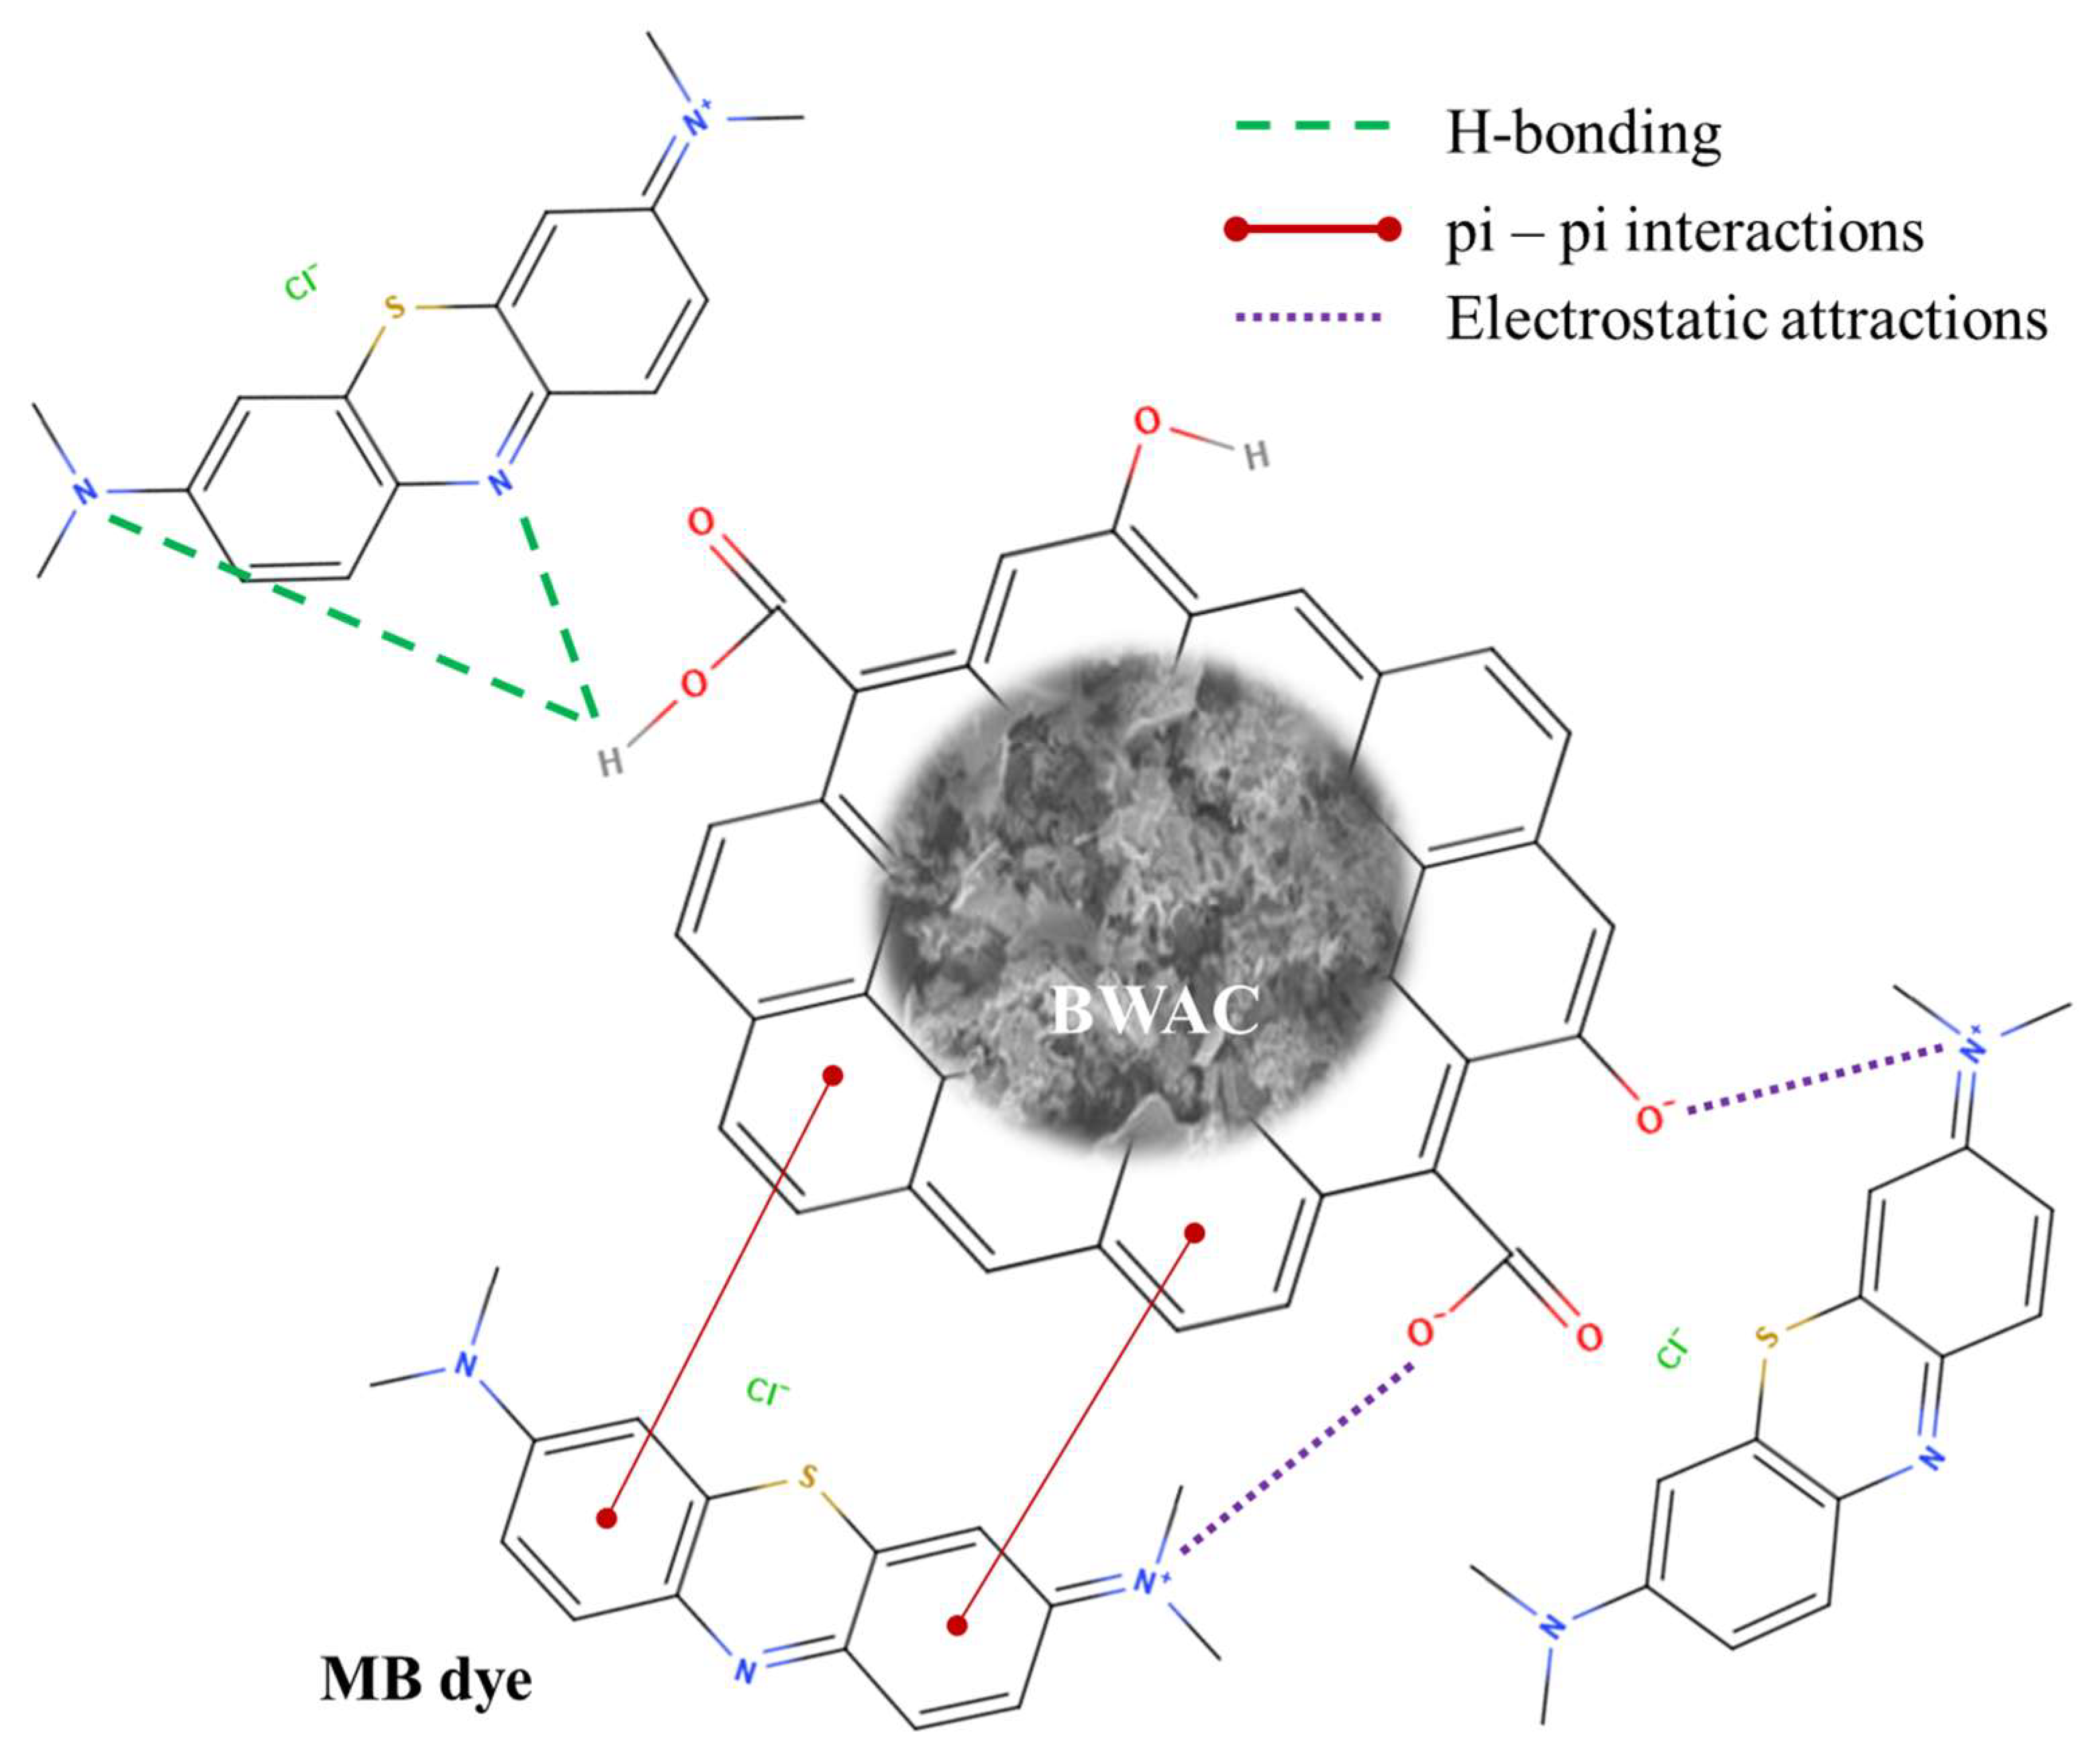
3.7. Adsorption Mechanism

The adsorption of MB on BWAC’s surface was explained in the basics of FTIR studies. FTIR results displayed that –OH vibration of the –COOH groups and C=O vibrations of the carbonyl groups were changed after MB adsorption on BWAC’s surface. Hence, these functional groups were involved in MB adsorption. The probable adsorption mechanisms for MB were electrostatic attractions, H-bonding, and pi–pi interactions, or hydrophobic to hydrophobic interactions. At higher pH levels, the surface of BWAC can become negatively charged and electrostatic attractions can take place with the positively charged MB dye molecules. Secondly, the –COOH and carboxyl groups present on BWAC’s surface can interact with the N atoms of MB dye molecules through H-bonding. The last one is the benzene rings or hexagonal structures of BWAC that were involved in the adsorption process as there was a change observed in the FTIR studies; hence, hydrophobic–hydrophobic interactions (π–π interactions) occurred between aromatic rings of MB dye species with the aromatic hexagonal structures of BWAC. Similar types of results have been observed in our previous works [17,42]. The probable adsorption mechanism of MB dye on the surface of the adsorbent (BWAC) is presented in Figure 10.

4. Conclusions

Bamboo-waste-activated carbon (BWAC) was successfully synthesized by the microwave heating process where activation of bamboo waste was carried out with K2CO3 as the activating agent. BWAC had good mesoporous pores with a surface area of 107.15 m2/g. The optimized conditions for maximum MB removal (87.36%) of 50 mg/L of MB using BWAC obtained from the BBD model were 0.08 g/100 mL of adsorbent dose, pH of 7.62, and contact time of 8 min. From ANOVA studies, it was found that the adsorbent dose showed the highest effect on MB removal with an F-value of 121.70 followed by contact time and pH. The Langmuir model was able to explain the experimental data and BWAC had an adsorption capacity of 85.6 mg/g. The MB adsorption on the surface of BWAC was endothermic and maximum removal took place at 25 °C. The pseudo-second-order model fitted to the experimental data, which suggested that chemisorption occurred between MB dye molecules and BWAC. Hence, from the above results, it can be concluded that BWAC can be used as a potential adsorbent for MB-dye-contaminated water treatment.

Author Contributions

K.F.A.Z.: Conceptualization, Data curation, Formal analysis, Investigation, Methodology. U.K.S.: Validation, Visualization, Writing—original draft. T.K.: Methodology Resources, Supervision. S.N.S.: Validation, Resources. Z.A.A.: Validation, Resources, Funding acquisition. A.H.J.: Conceptualization, Methodology, Resources, Software, Supervision, Writing—review and editing. All authors have read and agreed to the published version of the manuscript.

Funding

This research was funded by Saudi Arabia Project No. (RSP-2021/1). King Saud University, Riyadh.

Data Availability Statement

The datasets used and/or analyzed during the current study are available from the corresponding author on reasonable request.

Acknowledgments

The authors are thankful to the Faculty of Applied Sciences, Universiti Teknologi MARA (UiTM) Shah Alam, Malaysia for the research facilities. The author (Zeid A. ALOthman) is grateful to the Researchers Supporting Project No. (RSP-2021/1), King Saud University, Riyadh, Saudi Arabia.

Conflicts of Interest

The authors declare no conflict of interest.

References

  1. Elgarahy, A.M.; Elwakeel, K.Z.; Mohammad, S.H.; Elshoubaky, G.A. A critical review of biosorption of dyes, heavy metals and metalloids from wastewater as an efficient and green process. Clean. Eng. Technol. 2022, 4, 100209. [Google Scholar] [CrossRef]
  2. Obinnaa, I.B.; Ebere, E.C. A Review: Water pollution by heavy metal and organic pollutants: Brief review of sources, effects and progress on remediation with aquatic plants. Anal. Methods Environ. Chem. J. 2019, 6, 5–38. [Google Scholar] [CrossRef] [Green Version]
  3. Sah, M.K.; Edbey, K.; EL-Hashani, A.; Almshety, S.; Mauro, L.; Alomar, T.S.; AlMasoud, N.; Bhattarai, A. Exploring the biosorption of methylene blue dye onto agricultural products: A critical review. Separations 2022, 9, 256. [Google Scholar] [CrossRef]
  4. Azam, K.; Shezad, N.; Shafiq, I.; Akhter, P.; Akhtar, F.; Jamil, F.; Shafique, S. A review on activated carbon modifications for the treatment of wastewater containing anionic dyes. Chemosphere 2022, 306, 135566. [Google Scholar] [CrossRef] [PubMed]
  5. Sultana, M.; Rownok, M.H.; Sabrin, M.; Rahaman, M.H.; Alam, S.N. A review on experimental chemically modified activated carbon to enhance dye and heavy metals adsorption. Clean. Eng. Technol. 2022, 6, 100382. [Google Scholar] [CrossRef]
  6. Ramutshatsha-Makhwedzha, D.; Mavhungu, A.; Moropeng, M.L.; Mbaya, R. Activated carbon derived from waste orange and lemon peels for the adsorption of methyl orange and methylene blue dyes from wastewater. Heliyon 2022, 8, e09930. [Google Scholar] [CrossRef] [PubMed]
  7. Li, Q.; Li, Y.; Ma, X.; Du, Q.; Sui, K.; Wang, D.; Wang, C. Filtration and adsorption properties of porous calcium alginate membrane for methylene blue removal from water. Chem. Eng. J. 2017, 316, 623–630. [Google Scholar] [CrossRef]
  8. El-Moselhy, M.M.; Kamal, S.M. Selective removal and preconcentration of methylene blue from polluted water using cation exchange polymeric material. Groundw. Sustain. Dev. 2018, 6, 6–13. [Google Scholar] [CrossRef]
  9. Aouaini, F.; Dhaouadi, F.; Sellaoui, L.; Badawi, M.; Bonilla-Petriciolet, A.; Lamine, A.B. Using an enhanced multilayer model to analyze the performance of nickel alginate/graphene oxide aerogel, nickel alginate aerogel/activated carbon, and activated carbon in the adsorption of a textile dye pollutant. Environ. Sci. Pollut. Res. 2022, 29, 63622–63628. [Google Scholar] [CrossRef]
  10. Li, H.; Lin, Y.; Luo, Y.; Yu, P.; Hou, L. Relating organic fouling of reverse osmosis membranes to adsorption during the reclamation of secondary effluents containing methylene blue and rhodamine B. J. Hazard. Mater. 2011, 192, 490–499. [Google Scholar] [CrossRef]
  11. Dinh, V.-P.; Tran, N.Q.; Tran, Q.-H.; Nguyen, T.D. Facile synthesis of FeFe2O4 magnetic nanomaterial for removing methylene blue from aqueous solution. Prog. Nat. Sci. USA 2019, 29, 648–654. [Google Scholar] [CrossRef]
  12. Durrani, W.Z.; Nasrullah, A.; Khan, A.S.; Fagieh, T.M.; Bakhsh, E.M.; Akhtar, K.; Khan, S.B. Adsorption efficiency of date palm based activated carbon-alginate membrane for methylene blue. Chemosphere 2022, 302, 134793. [Google Scholar] [CrossRef] [PubMed]
  13. Saghi, M.H.; Qasemi, M.; Alidadi, H.; Alahabadi, A.; Rastegar, A.; Kowsari, M.H.; Shams, M. Vanadium oxide nanoparticles for methylene blue water remediation: Exploring the effect of physicochemical parameters by process modeling. J. Mol. Liq. 2020, 318, 114046. [Google Scholar] [CrossRef]
  14. Pradhan, A.C.; Paul, A.; Rao, G.R. Sol-gel-cum-hydrothermal synthesis of mesoporous Co-Fe@ Al2O3−MCM-41 for methylene blue remediation. J. Chem. Sci. 2017, 129, 381–395. [Google Scholar] [CrossRef] [Green Version]
  15. He, K.; Zeng, G.; Chen, A.; Huang, Z.; Peng, M.; Huang, T.; Chen, G. Graphene hybridized polydopamine-kaolin composite as effective adsorbent for methylene blue removal. Compos. B Eng. 2019, 161, 141–149. [Google Scholar] [CrossRef]
  16. Mustafa, I. Methylene blue removal from water using H2SO4 crosslinked magnetic chitosan nanocomposite beads. Microchem. J. 2019, 144, 397–402. [Google Scholar]
  17. Jawad, A.H.; Sahu, U.K.; Mastuli, M.S.; ALOthman, Z.A.; Wilson, L.D. Multivariable optimization with desirability function for carbon porosity and methylene blue adsorption by watermelon rind activated carbon prepared by microwave assisted H3PO4. Biomass Convers. Biomass Convers. Biorefinery 2022, 1–15. [Google Scholar] [CrossRef]
  18. Gupta, S.A.; Vishesh, Y.; Sarvshrestha, N.; Bhardwaj, A.S.; Kumar, P.A.; Topare, N.S.; Raut-Jadhav, S. Adsorption isotherm studies of methylene blue using activated carbon of waste fruit peel as an adsorbent. Mater. Today 2022, 57, 1500–1508. [Google Scholar] [CrossRef]
  19. Xue, H.; Wang, X.; Xu, Q.; Dhaouadi, F.; Sellaoui, L.; Seliem, M.K.; Lamine, A.B. Adsorption of methylene blue from aqueous solution on activated carbons and composite prepared from an agricultural waste biomass: A comparative study by experimental and advanced modeling analysis. J. Chem. Eng. 2022, 430, 132801. [Google Scholar] [CrossRef]
  20. Abdel-Ghani, N.T.; El-Chaghaby, G.A.; ElGammal, M.H.; Rawash, E.S.A. Optimizing the preparation conditions of activated carbons from olive cake using KOH activation. New Carbon Mater. 2016, 31, 492–500. [Google Scholar] [CrossRef]
  21. Deng, H.; Li, G.; Yang, H.; Tang, J.; Tang, J. Preparation of activated carbons from cotton stalk by microwave assisted KOH and K2CO3 activation. Chem. Eng. J. 2010, 163, 373–381. [Google Scholar] [CrossRef]
  22. Cansado, I.P.D.P.; Belo, C.R.; Mourao, P.A.M. Pesticides abatement using activated carbon produced from a mixture of synthetic polymers by chemical activation with KOH and K2CO3. Environ. Nanotechnol. Monit. Manag. 2019, 12, 100261. [Google Scholar]
  23. Saygılı, H.; Saygılı, G.A. Optimized preparation for bimodal porous carbon from lentil processing waste by microwave-assisted K2CO3 activation: Spectroscopic characterization and dye decolorization activity. J. Clean. Prod. 2019, 226, 968–976. [Google Scholar] [CrossRef]
  24. Wang, L.; Sun, F.; Hao, F.; Qu, Z.; Gao, J.; Liu, M.; Qin, Y. A green trace K2CO3 induced catalytic activation strategy for developing coal-converted activated carbon as advanced candidate for CO2 adsorption and supercapacitors. Chem. Eng. J. 2020, 383, 123205. [Google Scholar] [CrossRef]
  25. Zhu, Y.; Wang, D.; Zhang, X.; Qin, H. Adsorption removal of methylene blue from aqueous solution by using bamboo charcoal. Fresenius Environ. Bull. 2009, 18, 369–376. [Google Scholar]
  26. Suhaimi, N.; Kooh, M.R.R.; Lim, C.M.; Chou Chao, C.-T.; Chou Chau, Y.-F.; Mahadi, A.H.; Chiang, H.-P. The use of gigantochloa bamboo-derived biochar for the removal of methylene blue from aqueous solution. Adsorp. Sci. Technol. 2022, 2022, 8245797. [Google Scholar] [CrossRef]
  27. Ismail, I.S.; Rashidi, N.A.; Yusup, S. Production and characterization of bamboo-based activated carbon through single-step H3PO4 activation for CO2 capture. Environ. Sci. Pollut. Res. 2022, 29, 12434–12440. [Google Scholar] [CrossRef]
  28. Sahu, U.K.; Ji, W.; Liang, Y.; Ma, H.; Pu, S. Mechanism enhanced active biochar support magnetic nano zero-valent iron for efficient removal of Cr (VI) from simulated polluted water. J. Environ. Chem. Eng. 2022, 10, 107077. [Google Scholar] [CrossRef]
  29. Bonyadi, Z.; Noghani, F.; Dehghan, A.; van der Hoek, J.P.; Giannakoudakis, D.A.; Ghadiri, S.K.; Anastopoulos, I.; Sarkhosh, M.; Colmenares, J.C.; Shams, M. Biomass-derived porous aminated graphitic nanosheets for removal of the pharmaceutical metronidazole: Optimization of physicochemical features and exploration of process mechanisms. Colloids Surf. A Physicochem. Eng. Asp. 2021, 611, 125791. [Google Scholar] [CrossRef]
  30. Wang, N.; Li, X.; Yang, Y.; Shang, Y.; Zhuang, X.; Li, H.; Zhou, Z. Combined process of visible light irradiation photocatalysis-coagulation enhances natural organic matter removal: Optimization of influencing factors and mechanism. Chem. Eng. J. 2019, 374, 48–759. [Google Scholar] [CrossRef]
  31. Jawad, A.H.; Sahu, U.K.; Jani, N.A.; ALOthman, Z.A.; Wilson, L.D. Magnetic crosslinked chitosan-tripolyphosphate/MgO/Fe3O4 nanocomposite for reactive blue 19 dye removal: Optimization using desirability function approach. Surf. Interfaces 2022, 28, 101698. [Google Scholar] [CrossRef]
  32. Sahu, U.K.; Sahu, S.; Mahapatra, S.S.; Patel, R.K. Synthesis and characterization of magnetic bio-adsorbent developed from Aegle marmelos leaves for removal of As(V) from aqueous solutions. Environ. Sci. Pollut. Res. 2019, 26, 946–958. [Google Scholar] [CrossRef] [PubMed]
  33. Dalvand, A.; Nabizadeh, R.; Ganjali, M.R.M.; Nazmara, S.; Mahvi, A.H. Modeling of reactive Blue 19 azo dye removal from colored textile wastewater using L-arginine-functionalized Fe3O4 nanoparticles: Optimization, reusability, kinetic and equilibrium studies. J. Magn. Magn. Mater. 2016, 404, 179–189. [Google Scholar] [CrossRef]
  34. Jabar, J.M.; Odusote, Y.A. Utilization of prepared activated biochar from water lily (Nymphaea lotus) stem for adsorption of malachite green dye from aqueous solution. Biomass Convers. Biorefinery 2021. [Google Scholar] [CrossRef]
  35. Jabar, J.M.; Owokotomo, I.A.; Ayinde, Y.T.; Alafabusuyi, A.M.; Olagunju, G.O.; Mobolaji, V.O. Characterization of prepared eco-friendly biochar from almond (Terminalia catappa L) leaf for sequestration of bromophenol blue (BPB) from aqueous solution. Carbon Lett. 2021. [Google Scholar] [CrossRef]
  36. Jabar, J.M.; Odusote, Y.A. Removal of cibacron blue 3G-A (CB) dye from aqueous solution using chemo-physically activated biochar from oil palm empty fruit bunch fiber. Arab. J. Chem. 2020, 13, 5417–5429. [Google Scholar] [CrossRef]
  37. Genli, N.; Kutluay, S.; Baytar, O.; Şahin, Ö. Preparation and characterization of activated carbon from hydrochar by hydrothermal carbonization of chickpea stem: An application in methylene blue removal by rsm optimization. Int. J. Phytoremediation 2022, 24, 88–100. [Google Scholar] [CrossRef]
  38. Gohr, M.S.; Abd-Elhamid, A.; El-Shanshory, A.A.; Soliman, H.M. Adsorption of cationic dyes onto chemically modified activated carbon: Kinetics and thermodynamic study. J. Mol. Liq. 2022, 346, 118227. [Google Scholar] [CrossRef]
  39. Spagnoli, A.A.; Giannakoudakis, D.A.; Bashkova, S. Adsorption of methylene blue on cashew nut shell based carbons activated with zinc chloride: The role of surface and structural parameters. J. Mol. Liq. 2017, 229, 465–471. [Google Scholar] [CrossRef]
  40. Yusop, M.F.M.; Ahmad, M.A.; Rosli, N.A.; Abd Manaf, M.E. Adsorption of cationic methylene blue dye using microwave-assisted activated carbon derived from acacia wood: Optimization and batch studies. Arab. J. Chem. 2021, 14, 103122. [Google Scholar] [CrossRef]
  41. Sahu, U.K.; Mahapatra, S.S.; Patel, R.K. Application of box–behnken design in response surface methodology for adsorptive removal of arsenic from aqueous solution using CeO2/Fe2O3/graphene nanocomposite. Mater. Chem. Phys. 2018, 207, 233–242. [Google Scholar] [CrossRef]
  42. Jawad, A.H.; Abdulhameed, A.S.; Wilson, L.D.; Syed-Hassan, S.S.A.; ALOthman, Z.A.; Khan, M.R. High surface area and mesoporous activated carbon from KOH-activated dragon fruit peels for methylene blue dye adsorption: Optimization and mechanism study. Chin. J. Chem. Eng. 2021, 32, 281–290. [Google Scholar] [CrossRef]
  43. Liu, L.; Zhang, T.; Yu, X.; Mkandawire, V.; Ma, J.; Li, X. Removal of Fe2+ and Mn2+ from Polluted Groundwater by Insoluble Humic Acid/Tourmaline Composite Particles. Materials 2022, 15, 3130. [Google Scholar] [CrossRef] [PubMed]
  44. Husien, S.; El-taweel, R.M.; Salim, A.I.; Fahim, I.S.; Said, L.A.; Radwan, A.G. Review of activated carbon adsorbent material for textile dyes removal: Preparation, and modelling. Curr. Res. Green Sustain. Chem. 2022, 5, 100325. [Google Scholar] [CrossRef]
  45. Wang, X.; Fan, X.; Xie, H.; Li, X.; Hao, C. Polyacrylic acid/carboxymethyl cellulose/activated carbon composite hydrogel for removal of heavy metal ion and cationic dye. Cellulose 2022, 29, 483–501. [Google Scholar] [CrossRef]
  46. Langmuir, I. The adsorption of gases on plane surfaces of glass, mica and platinum. J. Am. Chem. Soc. 1918, 40, 1361–1403. [Google Scholar] [CrossRef] [Green Version]
  47. Freundlich, H. Freundlich’s adsorption isotherm. Phys. Chem. 1906, 57, 384. [Google Scholar]
  48. Temkin, M.I. Kinetics of ammonia synthesis on promoted iron catalysts. Acta Physiochim. URSS 1940, 12, 327–356. [Google Scholar]
  49. Foo, K.Y.; Hameed, B.H. Porous structure and adsorptive properties of pineapple peel based activated carbons prepared via microwave assisted KOH and K2CO3 activation. Microporous Mesoporous Mater. 2012, 148, 191–195. [Google Scholar] [CrossRef]
  50. Abdulhameed, A.S.; Firdaus Hum, N.N.M.; Rangabhashiyam, S.; Jawad, A.H.; Wilson, L.D.; Yaseen, Z.M.; Al-Kahtani, A.A.; Alothman, Z.A. Statistical modeling and mechanistic pathway for methylene blue dye removal by high surface area and mesoporous grass-based activated carbon using K2CO3 activator. J. Environ. Chem. Eng. 2021, 9, 105530. [Google Scholar] [CrossRef]
  51. Santana, G.M.; Trugilho, P.F.; Borges, W.M.; Bianchi, M.L.; Paes, J.B.; Nobre, J.R.C.; Morais, R.M. Activated carbon from bamboo (Bambusa vulgaris) waste using CO2 as activating agent for adsorption of methylene blue and phenol. Ciência Florest. 2019, 29, 769–778. [Google Scholar] [CrossRef] [Green Version]
  52. Jabar, J.M.; Odusote, Y.A.; Ayinde, Y.T.; Yılmaz, M. African almond (Terminalia catappa L) leaves biochar prepared through pyrolysis using H3PO4 as chemical activator for sequestration of methylene blue dye. Results Eng. 2022, 14, 100385. [Google Scholar] [CrossRef]
  53. Dao, T.M.; Le Luu, T. Synthesis of activated carbon from macadamia nutshells activated by H2SO4 and K2CO3 for methylene blue removal in water. Bioresour. Technol. Rep. 2020, 12, 100583. [Google Scholar] [CrossRef]
  54. Jawad, A.H.; Sabar, S.; Ishak, M.A.M.; Wilson, L.D.; Ahmad Norrahma, S.S.; Talari, M.K.; Farhan, A.M. Microwave-assisted preparation of mesoporous-activated carbon from coconut (Cocos nucifera) leaf by H3PO4 activation for methylene blue adsorption. Chem. Eng. Commun. 2017, 204, 1143–1156. [Google Scholar] [CrossRef]
  55. Dakhil, I.H.; Ali, A.H. Adsorption of methylene blue dye from industrial wastewater using activated carbon prepared from agriculture wastes. Desalination Water Treat. 2021, 216, 372–378. [Google Scholar] [CrossRef]
  56. Baytar, O.; Ceyhan, A.A.; Şahin, Ö. Production of activated carbon from elaeagnus angustifolia seeds using H3PO4 activator and methylene blue and malachite green adsorption. Int. J. Phytoremediation 2021, 23, 693–703. [Google Scholar] [CrossRef]
  57. Mashhadi, S.; Javadian, H.; Ghasemi, M.; Saleh, T.A.; Gupta, V.K. Microwave-induced H2SO4 activation of activated carbon derived from rice agricultural wastes for sorption of methylene blue from aqueous solution. Desalin. Water Treat. 2016, 57, 21091–21104. [Google Scholar]
  58. Özhan, A.; Şahin, Ö.; Küçük, M.M.; Saka, C. Preparation and characterization of activated carbon from pine cone by microwave-induced ZnCl2 activation and its effects on the adsorption of methylene blue. Cellulose 2014, 21, 2457–2467. [Google Scholar] [CrossRef]
  59. El-Sayed, G.O.; Yehia, M.M.; Asaad, A.A. Assessment of activated carbon prepared from corncob by chemical activation with phosphoric acid. Water Resour. Ind. 2014, 7, 66–75. [Google Scholar] [CrossRef] [Green Version]
  60. Patel, R.K.; Prasad, R.; Shankar, R.; Khare, P.; Yadav, M. Adsorptive removal of methylene blue dye from soapnut shell & pineapple waste derived activated carbon. Int. J. Eng. Sci. Technol. 2021, 13, 81–87. [Google Scholar]
  61. Sahu, S.; Pahi, S.; Sahu, J.K.; Sahu, U.K.; Patel, R.K. Kendu (Diospyros melanoxylon roxb) fruit peel activated carbon—An efficient bioadsorbent for methylene blue dye: Equilibrium, kinetic, and thermodynamic study. Environ. Sci. Pollut. Res. Int. 2020, 27, 22579–22592. [Google Scholar] [CrossRef] [PubMed]
Figure 1. SEM and EDX images of (a,b) BW, (c,d) BWAC, and (e,f) BWAC after MB adsorption.
Separations 09 00390 g001
Figure 2. FTIR spectra of (a) BWAC and (b) MB-loaded BWAC.
Separations 09 00390 g002
Figure 3. N2 adsorption–desorption isotherms of BWAC.
Separations 09 00390 g003
Figure 4. (a) Experimental and actual removal, (b) normal probability plot of MB (%), and (c) Cook’s distance plot.
Separations 09 00390 g004
Figure 5. Three-dimensional response surface plot and contour plots showing the interactions between (a,b) dose and pH, (c) pHpzc of BWAC, (d,e) dose and time, and (f,g) pH and time for MB removal by BWAC.
Separations 09 00390 g005
Figure 6. Input and output MB removal (%) responses in desirability ramp. Input variables (red point) and output response (blue point) MB removal (%) in desirability ramp.
Separations 09 00390 g006
Figure 7. Effect of contact time on MB removal.
Separations 09 00390 g007
Figure 8. Langmuir, Freundlich, and Temkin nonlinear adsorption isotherms for MB adsorption by BWAC.
Separations 09 00390 g008
Figure 9. Van’t Hoff plot for MB dye removal by BWAC.
Separations 09 00390 g009
Figure 10. Illustration of the possible interactions between BWAC’s surface and MB including electrostatic attractions, hydrogen bonding, and pi–pi interactions.
Separations 09 00390 g010
Table 1. Different variables and their levels for MB removal.
Variables CodesLevel 1 (−1)Level 2 (0)Level 3 (+1)
Dose (g/100 mL)A0.020.050.08
pH B4710
Time (min)C258
Table 2. BET textural data of BWAC.
SampleAverage Pore Size
(nm)
BET Surface Area
(m2/g)
Pore Volume
(cm3/g)
BWAC2.91107.1480.049
Table 3. Three-variable BBD matrix and experimental data for MB dye removal.
Run A: Dose (g) B: pHC: Time (min)MB Removal (%)
10.024549
20.084573
30.0210563
40.0810573
50.027261
60.087265
70.027861
80.087887
90.054251
100.0510263
110.054872
120.0510865
130.057561
140.057562
150.057563
160.057563
170.057558
Table 4. Analysis of variance (ANOVA) for MB removal (%) by BWAC.
SourceSum of SquaresdfMean SquareF-Valuep-ValueSignificant
Model1192.319132.4831.49<0.0001Significant
A-Dose512.001512.00121.70<0.0001*
B-pH45.13145.1310.730.0136*
C-Time253.131253.1360.170.0001*
AB49.00149.0011.650.0112*
AC121.001121.0028.760.0010*
BC90.25190.2521.450.0024*
A282.44182.4419.600.0031*
B27.3917.391.760.2266#
C230.13130.137.160.0317*
Residual29.4574.21
Lack of Fit12.2534.080.94960.4967#
Pure Error17.2044.30
Cor Total1221.7616
R2 = 0.9759, Adj-R2 = 0.9449, * = significant, # = not-significant.
Table 5. Experimental and model-optimized values of parameters.
Process Parameters Optimized Values (Predicted by Disability Function)Confirmation Values (Experimental)
BWAC Dose (g)0.080.08
pH7.617.62
Time (min)
MB removal (%)
7.99
86.37
8
83.5 ± 3
Table 6. PFO and PSO kinetic parameters for MB dye adsorption on BWAC.
PSOPFOqe exp. (mg/g)Concentration
(mg/L)
R2k2 × 102
(g/mg min)
qe cal (mg/g)R2k1 (1/min)qe cal (mg/g)
0.995.10724.890.990.6223.5123.8320
0.961.41253.540.900.4650.0755.2940
0.970.28976.830.930.1772.2178.5560
0.940.26384.180.860.1383.6483.0180
0.930.08894.750.850.0781.25107.5100
Table 7. Isotherm parameters and correlation coefficient of different models.
Model ParameterValues
Langmuirqmax (mg/g)85.6
Ka (L/mg)5.74
R20.95
FreundlichKF (mg/g (L/mg)1/n)57.5
N8.33
R20.84
Temkin KT (L/mg)816.1
bT (J/mol)282.8
R20.87
Table 8. Comparison study of activated carbon prepared from different materials.
Initial Material Adsorption Capacity (mg/g)Reference
Pineapple peel waste
Grass waste
Bamboo
African almond leaves
Nutshells
Coconut leaves
462.10
364
298.82
263.95
261
250
[49]
[50]
[51]
[52]
[53]
[54]
Agriculture wastes 148.8[55]
Bamboo waste85.6This Study
Elaeagnus Angustifolia seeds
Rice agricultural waste
Pine cone
72
62.5
60.97
[56]
[57]
[58]
Corncob 28.65[59]
Pineapple waste9.61[60]
Table 9. Thermodynamic parameters for the adsorption for MB dye by BWAC.
T (K)Ln KdΔG0 (kJ/mol)ΔH0 (kJ/mol)ΔS0 (kJ/mol K)
298.15
308.15
318.15
328.15
2.05
2.32
3.39
3.66
−5.08
−5.94
−8.96
−9.98
35.670.13
Publisher’s Note: MDPI stays neutral with regard to jurisdictional claims in published maps and institutional affiliations.

