Article

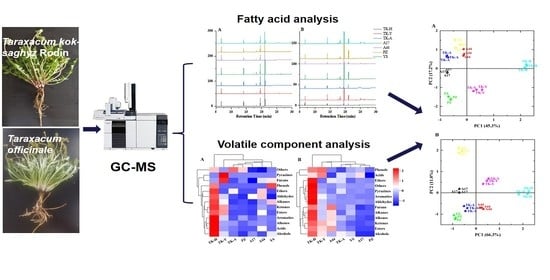
Comparative Analysis with GC–MS of Fatty Acids and Volatile Compounds of Taraxacum kok-saghyz Rodin and Taraxacum officinale as Edible Resource Plants

1
College of Life Science and Technology, Beijing University of Chemical Technology, Beijing 100029, China
2
Production & Construction Group Key Laboratory of Special Agricultural Products Further Processing in Southern Xinjiang, College of Food Science and Engineering, Tarim University, Alar 843300, China
3
Rubber Plant Research Center, Beijing University of Chemical Technology, Beijing 100029, China
*
Author to whom correspondence should be addressed.
Separations 2022, 9(10), 314; https://doi.org/10.3390/separations9100314
Submission received: 23 September 2022 / Revised: 10 October 2022 / Accepted: 13 October 2022 / Published: 15 October 2022

Abstract

:
Taraxacum kok-saghyz Rodin (TKS) is a potential edible resource plant that is rich in inulin, lipid, protein and other active ingredients. In this study, HS-SPME/GC–MS was used to analyze volatile compounds (VCs) and profile the fatty acids in TKS roots and leaves, and the results were compared with those from Taraxacum officinale (TO). A total of 105 and 107 VCs were detected in the leaves and roots of seven dandelion samples (three TKS and four TO), amongst which the main VCs were ethyl tetradecanoate, ethyl linolenate, ethyl linoleate, dihydroactinidiolide, ethyl palmitate, β-ionone, 3,5-octadien-2-one, β-ionone 5,6-epoxide, geranyl acetone, benzaldehyde, safranal, 2-Pentylfuran, farnesene and β-elemene. Linoleic acid and linolenic acid were the dominant fatty acids in seven dandelion samples, and the ratio of unsaturated to saturated fatty acids was larger than 4. Principal component analysis showed that the differences in VCs and fatty acid levels between different dandelion samples mainly came from different places of origin, while the differences between different varieties in the same place of origin was minor; i.e., the VCs and fatty acid levels of TKS and TO collected from the same place were basically similar.

Graphical Abstract

1. Introduction

Taraxacum kok-saghyz Rodin (TKS), also known as Russian dandelion or Sinkiang rubber dandelion, is a perennial edible herb of the dandelion genus in compositae and is native to northwest China, Kazakhstan and Uzbekistan [1]. TKS is an attractive alternative natural rubber (NR) source plant with abundant latex in its root [2]. It is reported that the content of natural rubber in TKS dry roots is 5% to 24% (w/w) [3,4,5]. The number average molecular weight (Mn) and weight average molecular weight (Mw) of TKS rubber are 0.7 × 10⁶ g/mol and 1.4 × 10⁶ g/mol, respectively, which are higher than most commercial grade NRs from Hevea standard Vietnamese rubber grade L (Mn and Mw are 0.4 × 10⁶ g/mol and 0.9 × 10⁶ g/mol, respectively) [6].
The TKS roots not only contain rich and high-quality rubber-containing latex, but also contain a variety of bioactive ingredients, including inulin, proteins, lipids, flavonoids, triterpenoids, sterols, phenolic acids and so on. Inulin content in dry TKS roots is greater than 17% and even attains as high as 40% w/w [3,7]. The total protein content of TKS water-soluble fractions is roughly 10% w/w, and the fatty acids in dry TKS roots are about 5.2% (w/w) [4]. TKS roots also contain substantial amounts of highly diverse triterpenoids. Thirteen triterpenes and triterpenoids have been identified from acetone extract of TKS roots [8]. The total content of pentacyclic triterpenoids (a-amyrin, b-amyrin, lupeol and taraxasterol) and sterols (campesterol, stigmasterol and b-sitosterol) in TKS (9.44 mg/g DW) was determined in our lab to be significantly higher than that in Taraxacum offificinale (3.35 mg/g DW) [9]. In addition, TKS leaves are rich in total flavonoids and phenolic acids, and have high antioxidant capacity. The content of chicoric acid and chlorogenic acid is 8.53–10.68 g /kg DW and 4.18–7.04 g /kg DW, respectively [10].
Plant-derived bioactive substances have a wide range of nutritional and pharmacological effects [11], amongst which fatty acids are very important representatives, especially linoleic acid (ω-6) and linolenic acid (ω-3) [12]. These fatty acids cannot be synthesized in vivo by the human body and have a wide range of nutritious or pharmacological effects [13], e.g., regulating lipid metabolism [14], lowering blood cholesterol, increasing the detoxification function of the liver [15], increasing exercise capacity [16], anti-oxidation [14] and anti-inflammation [17]. The volatile components (VCs) emitted from medicinal plants can easily enter the human body through the skin or respiratory system, which can directly or indirectly protect people’s physical and mental health [18] by their biological activities such as antidepressant, antibacterial, anti-inflammatory and anti-cancer effects, as well as by relieving fatigue and improving immunity [19,20,21]. The aforementioned VCs are thereby widely used in the pharmaceutical industry, cosmetics, food and other industries. In China, the administration of Taraxacum officinale (TO) as a Chinese herbal medicine with edible and medicinal purpose has a long history. It contains abundant active substances. To characterize in-depth TKS and TO, analyzing the non-rubber ingredients of the TKS roots and leaves, isolating the active components, and translating them into raw materials and/or finished products valuable to different commercial sectors is very important. Previous studies on TKS byproducts focused mainly on the analysis and separation of inulin in TKS roots. Nevertheless, a comprehensive investigation of the volatile compounds (VCs) and fatty acid profiles in TKS roots and leaves is, to date, unavailable.
In this study, the VCs and fatty acid profiles of TKS and TO from different places and varieties were investigated by HS-SPME/GC–MS. The specific aims of this work were to: (1) identify and quantify the main VCs and fatty acids in the TKS roots and leaves; (2) characterize the differences of the VCs and fatty acid profiles between TKS and TO. The results of this study could definitely help to reveal the economic value of edible dandelion species and provide valuable data for the comprehensive utilization of TKS as well.

2. Materials and Methods

2.1. Chemicals and Reagents

Glyceryl triundecanoate and 4-Methylpentan-1-ol (purities >98%) were purchased from Shanghai Macklin Biochemical Co., Ltd. (Shanghai, China). Supelco 37 Component FAME Mix were obtained from Shanghai yuanye Bio-Technology Co., Ltd. (Shanghai, China). N-alkanes series (C7 to C40, purity >98%) were obtained from Sigma Aldrich (St. Louis, MO, USA). Other chemicals were of analytical grade and purchased from Jin Di Ze Hao Technology Co., Ltd. (Beijing, China).

2.2. Plant Materials

One TKS sample named ‘TK-H’ was kindly provided by Dr. Guang Shen at the Institute of Natural Resources and Ecology, Heilongjiang Academy of Agricultural Sciences. One wild TKS plant named ‘TK-Y’ was collected from Yili (Xinjiang, China) and one TKS and four TO samples named ‘TK-A’ and ‘A17′, ‘A44′, ‘PZ’ and ‘YS’ were all obtained from the Anning Canal plantation (Xinjiang, China), in May–June 2022. The varieties of TKS and TO were identified by Dr. Gao Qiang from the Institute of Crop Variety Resources, Xinjiang Academy of Agricultural Sciences. All samples were washed and dried in a convection oven at 40 °C to constant weight, then ground and sieved through a 40-mesh sieve. Screened samples (99%) were collected, stored in sealable bags and refrigerated at 4 °C.

2.3. Determination of VCs using HS-SPME/GC–MS

2.3.1. HS-SPME Conditions

0.5 g of ground samples was added into a 20 mL headspace vial sealed with polytetrafluoroethylene-silicon septa and stainless steel cap. The sample vial was pre-equilibrated for 30 min at 60 °C and 400 rpm, followed by extraction using a divenylbenzene/carboxen/polydimethylsiloxane SPME fiber (DVB/CAR/PDMS, 50/30 µm, Supelco, Bellefonte, PA, USA) in the headspace for 30 min.

2.3.2. GC–MS Analysis

A gas chromatography–mass spectrometry instrument (Agilent 7890B-7000D triple quadrupole gas chromatography–mass spectrometer, Agilent Tech., Santa Clara, CA, USA) was equipped with a VF-WAXms capillary column (60 m × 0.25 mm × 0.25 μm, Agilent Tech., Santa Clara, CA, USA) for separating and identifying the VCs of the TKS and TO. GC–MS analysis was performed by using the method described by Chen Qinqin et al. [22] with some modifications. Isolated VCs were analyzed by thermal desorption at 250 °C for 3 min in the injection port of the GC–MS equipment. The oven temperature program was as follows: initially 50 °C for 2 min, ramped to 120 °C at the rate of 5 °C/min, ramped to 180 °C at the rate of 3 °C/min, held for 3 min, and then ramped to 240 °C at a rate of 6 °C/min, held for 10 min. High-purity helium (>99.99%) was used as the carrier gas at a constant flow rate of 1.2 mL/min with the splitless GC mode. The MS conditions were as follows: electronic ionization (EI) mode (electron ionization energy 70 eV; ion source temperature, 230 °C). The transmission line temperature was 270 °C. The mass acquisition range was set to 35–600 m/z in full-scan mode.

2.3.3. Qualitative and Quantitative Analysis

The qualitative identification of VCs was analyzed by both retention index (RI) values and matching mass spectra of VCs with those stored in the NIST17 library of the GC–MS data system. A mixture of C7–C40 alkane standards was analyzed under the same chromatographic conditions to calculate the retention indices [23].
Quantification of VCs was performed using the methods of Zhang Kaihua et al. [24] and Wang Lina et al. [25]. The contents of different VCs were calculated on the basis of the peak areas of the unknown compounds and internal standard (4-Methyl-1-pentanol).

2.4. Fatty Acid Analysis

The extraction and methylation of fatty acids in dandelion were performed according to National Food Safety Standard Determination of Fatty Acids in Food (GB 5009.168, 2016). Fatty acid methyl esters (FAMEs) were separated and identified using an Agilent 7890B-7000D GC–MS system equipped with a fused silica cyanopropyl HP-88 column (60 m × 0.25 mm × 0.20 µm, Agilent Tech.). The column incubator temperature program was as follows: initial temperature 140 °C, held for 5 min, then increased to 250 °C at a rate of 4 °C min−1 and held for 10 min. The injector port temperature was set at 240 °C. The carrier gas was He at a constant flow rate of 1.0 mL min−1 and the injection volume was 1 μL with a split ratio of 1:50. MS was performed in EI mode with an energy of 70 eV, ion source temperature of 230 °C, and mass scanning range of m/z 30–550.
Identification of the FAMEs were performed by comparing the retention times of the mixture of standards and using the NIST17 library of the GC–MS data system. Quantification of fatty acids was based on the peak areas of FAMEs and internal standard (methyl undecanoate).

2.5. Statistical Analysis

Experiments were performed in triplicate. ANOVA and Duncan’s tests were carried out using SPSS software (version 23.0, IBM Corp., Armonk, NY, USA) to evaluate the significant differences between samples at the level of p = 0.05. Principle component analysis (PCA) was conducted using OriginPro 2021 software (OriginLab Corp., Northampton, MA, USA).

3. Results and Discussion

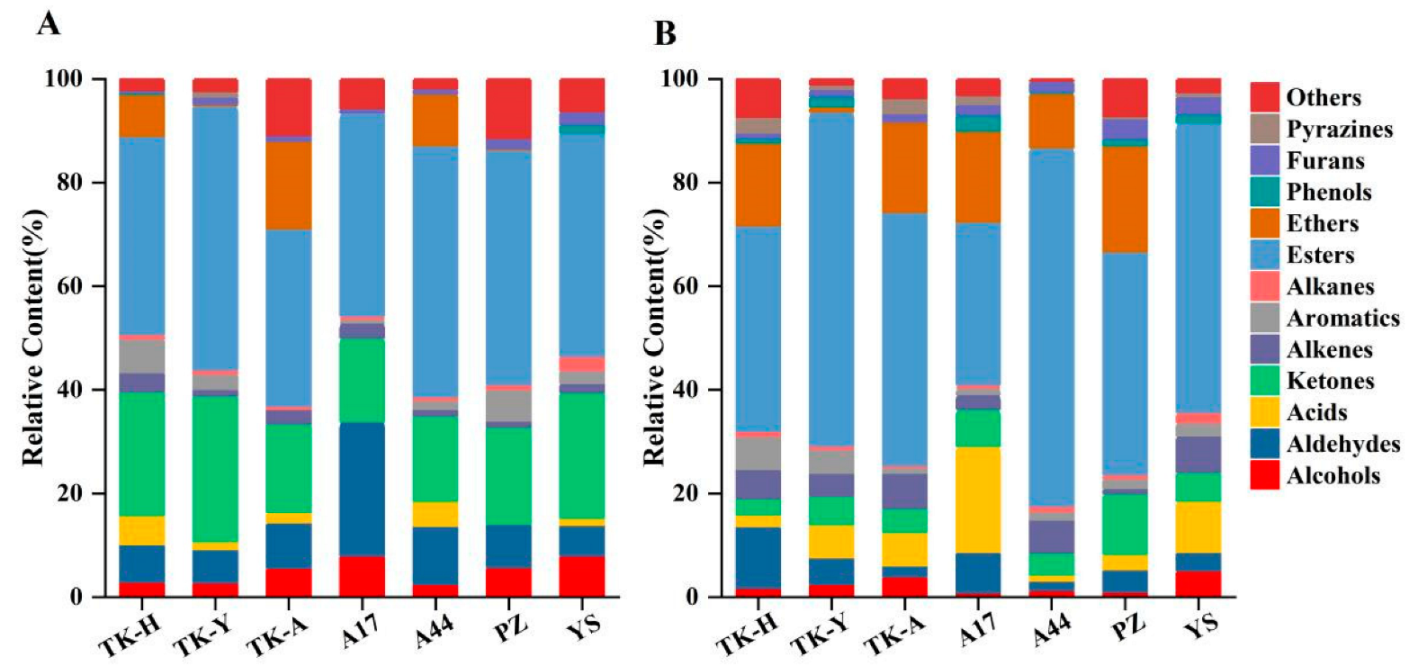
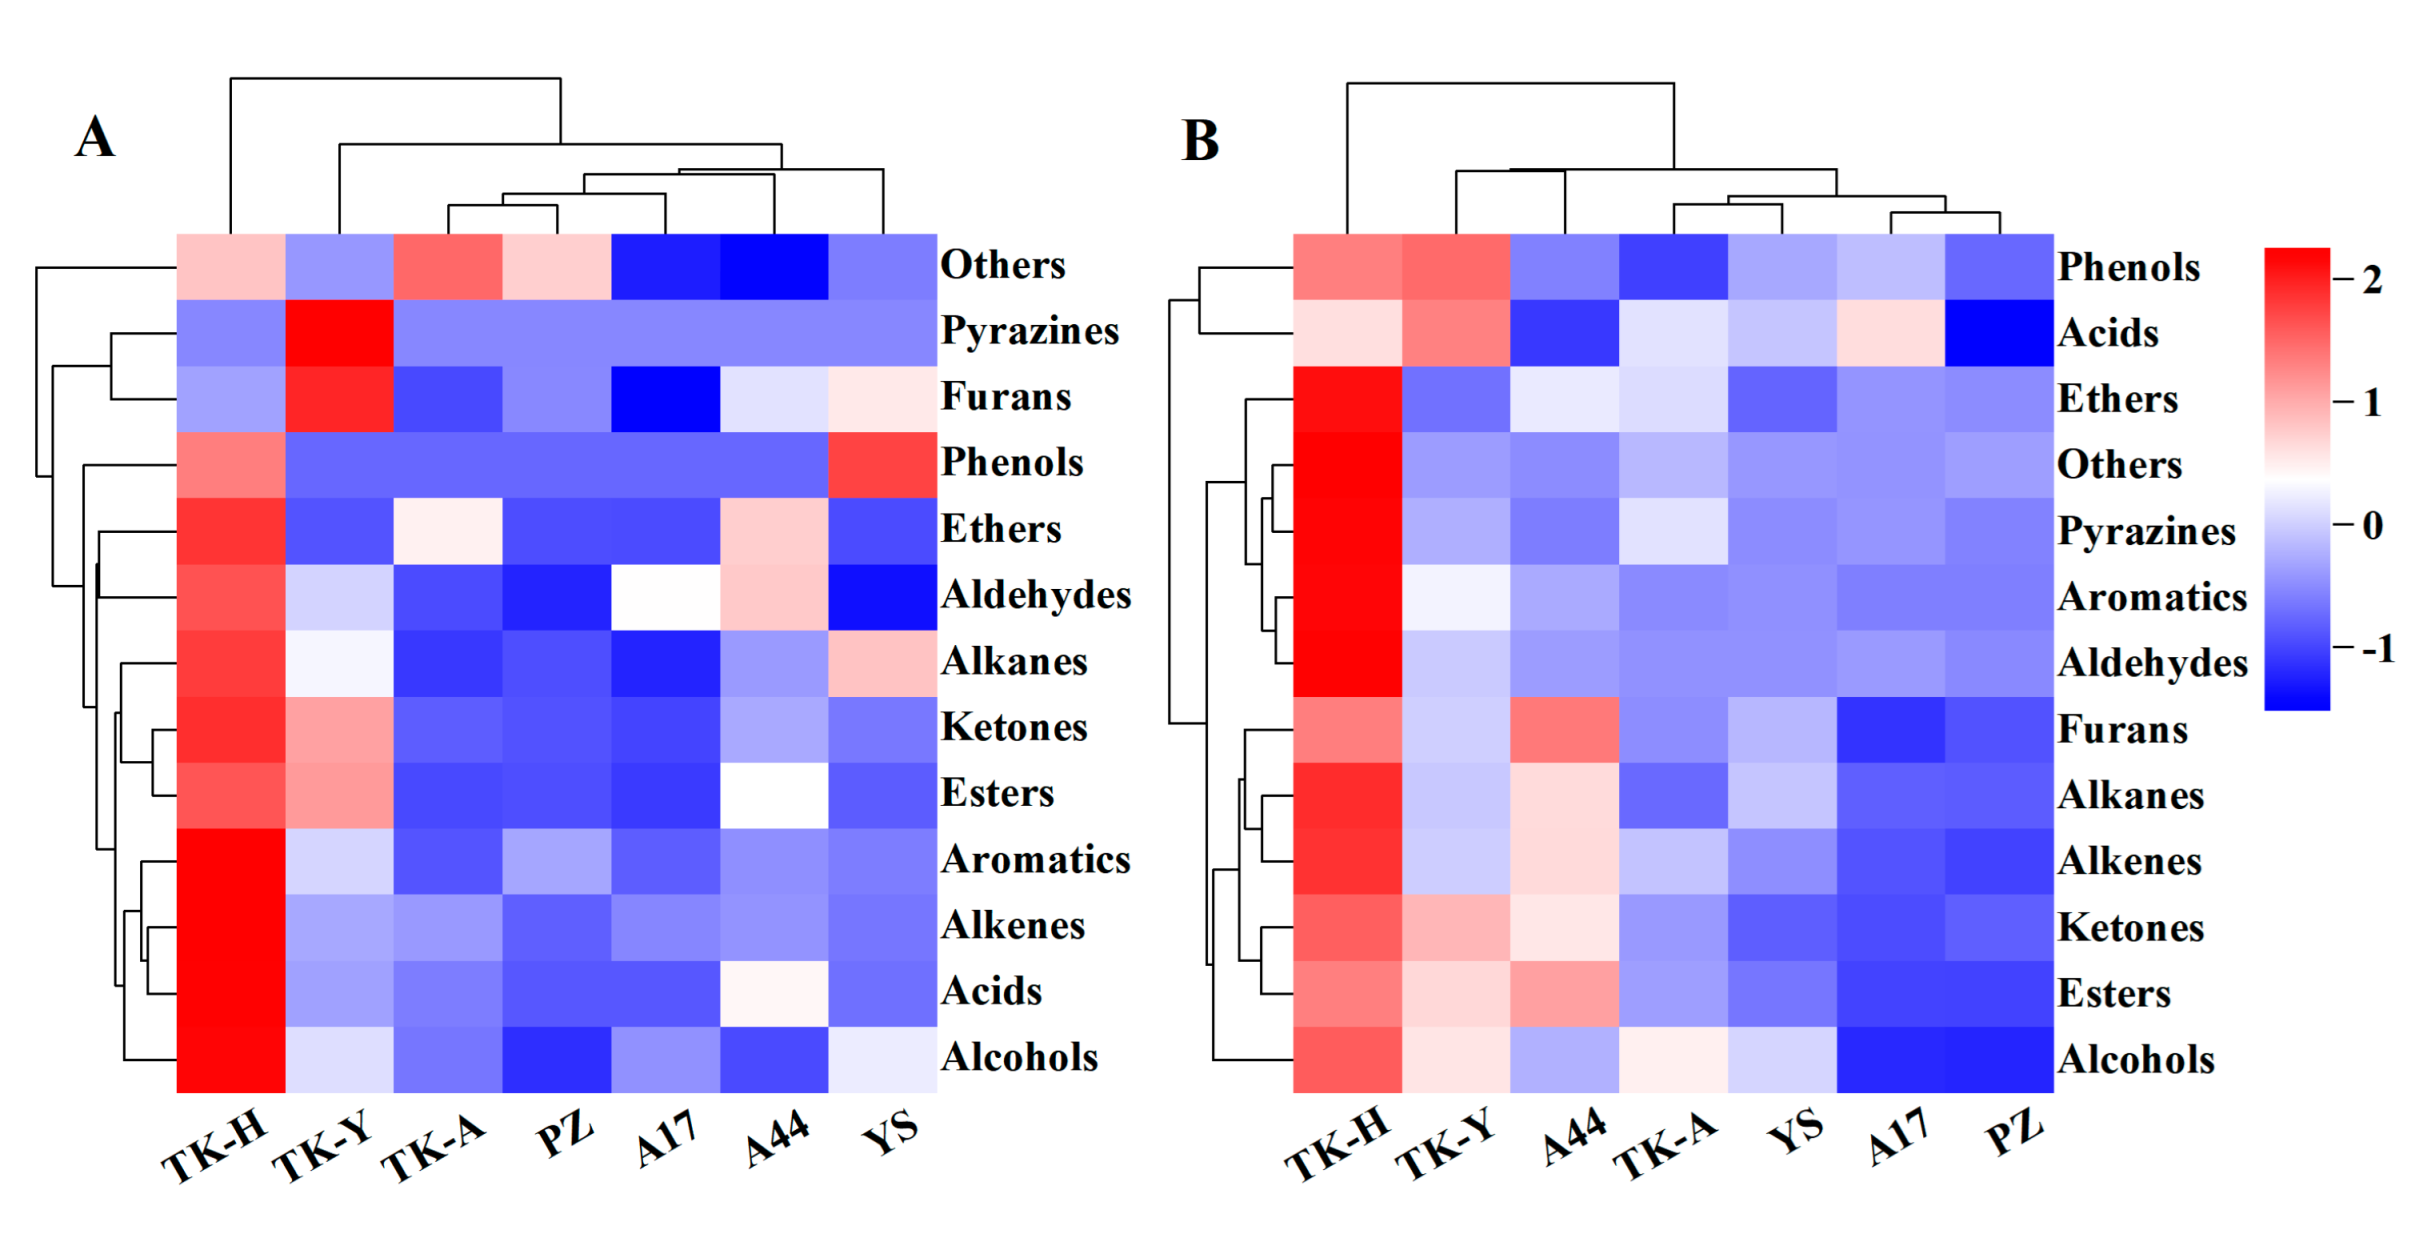
3.1. Identification and Quantification of VCs in Taraxacum Leaves

The VCs of Taraxacum leaves were detected by HS-SPME/GC–MS, and the representative total ion chromatograms (TICs) are shown in Figure 1A. A total of 105 VCs, including 9 alcohols, 15 aldehydes, 9 acids, 25 esters, 17 ketones, 7 alkenes, 7 aromatics, 4 alkanes, 2 ethers, 3 phenols, 1 furan, 1 pyrazine and 5 other compounds were identified, but not all of these compounds were detected in all cultivars (Table S1A). As shown in Figure 2A, esters were the most abundant volatile components, followed by ketones; the total content of these two compounds accounted for more than 50% of the total volatile components. Aldehydes and alcohols were also the two main volatile components in Taraxacum leaves, with contents of 3.34–17.87 μg/g and 2.71–7.07 μg/g, respectively. Alkenes, aromatics, alkanes, acids, furans and ethers were detected in most samples, but their contents accounted for only a small percentage. Phenols were only detected in ‘TK-H’ and ‘YS’, and pyrazine was only detected in ‘TK-Y’; their contents were relatively low.
There were significant differences in the content of VCs amongst different varieties (p < 0.05). As shown in Figure 3A, ‘TK-H’ had the largest content of various volatile components, followed by ‘TK-Y’, and ‘A17′ and ‘PZ’ had the lowest content. A total of 25 esters were detected in the leaves of seven samples, but only ethyl tetradecanoate, ethyl caprylate, ethyl linolenate, ethyl linoleate, ethyl laurate, ethyl palmitate, dihydroactinidiolide and diisobutyl phthalate were detected in all samples, and the contents were significantly different (p < 0.05) (Table S1A). For example, the content of dihydroactinidiolide ranged from 1.07 to 36.84 μg/g; ethyl palmitate was from 3.62 to 17.99 μg/g. The contents of ethyl linolenate and ethyl linoleate were the highest in ‘TK-H’ and ‘TK-Y’, and there was no significant difference between them, but were significantly higher than other varieties. The contents of ethyl tetradecanoate and ethyl laurate were the highest in ‘TK-Y’, followed by ‘A44′. The contents of ethyl caprylate and ethyl caprate were the highest in ‘A44′, followed by ‘TK-Y’. The differences in the content of VCs amongst different varieties were surmised to stem from the secondary metabolic behaviors of the natural compounds in the plant. In addition, diisobutyl phthalate was identified in each sample, which was considered to be possibly related to the plasticizer during sampling.
Ketones were the second largest VCs in Taraxacum leaves. β-ionone, β-ionone 5,6-epoxide, 3,5-octadien-2-one and geranyl acetone were detected in all varieties with contents of 2.89–24.66 μg/g, 1.16–11.74 μg/g, 0.97–6.62 μg/g and 0.47–2.36 μg/g, respectively. Other ketones were only detected in some varieties. A total of 15 aldehydes were detected in dandelion leaves. β-cyclocitral was detected in all varieties, but its content was very low (<1 μg/g). Benzaldehyde was not detected in ‘YS’, and its content in the other six varieties was from 2.76 to 7.86 μg/g. Benzeneacetaldehyde was only detected in ‘A17′ and ‘A44′, with a content of 7.22 and 6.24 μg/g, respectively. Safranal was only detected in ‘TK-H’ and ‘TK-A’; its content was 5.22 and 0.28 μg/g, respectively. Other aldehydes were only detected in some varieties and most of them were less than 1 μg/g. Phytol and benzyl alcohol were two alcohols detected in all samples. Phytol had the highest content in ‘TK-Y’ and benzyl alcohol had the highest content in ‘TK-H’. As terpene compounds, caryophyllene, farnesene, β-elemene, neophytadiene, which were detected in the leaves of some varieties of dandelion, have anti-inflammatory, antioxidant and anti-tumor biological activities [26].

3.2. Identification and Quantification of VCs in Taraxacum Roots

Typical TICs of Taraxacum roots VCs determined by HS-SPME/GC–MS are shown in Figure 1B. 107 VCs were detected in Taraxacum roots, including 10 alcohols, 8 aldehydes, 6 acids, 28 esters, 11 ketones, 10 alkenes, 6 aromatic hydrocarbons, 4 alkanes, 3 ethers, 6 phenols, 3 furans, 5 pyrazines and 7 other compounds (Table S1B). The total amount and functional group categories of the detected VCs were similar to those in the leaves. The cluster heat map (Figure 3) shows that, as in the leaves, the VCs in the roots were also the highest in ‘TK-H’ varieties, followed by ‘TK-Y’, and the content was lower in ‘YS’, ‘PZ’ and ‘A17’. Esters were still the most abundant VCs, accounting for more than 30% of the total VCs, and even more than 60% in ‘TK-Y’ and ‘A44’ varieties (Figure 2B). Ethyl palmitate, ethyl linoleate and ethyl linolenate andethyl tetradecanoate were also the main esters in dandelion roots. However, their contents were significantly different among different varieties (p < 0.05). For instance, the content of ethyl linoleate in ‘A17’ was only 0.48 μg/g, but the content in ‘A44’ was as high as 10.41 μg/g. Ten alkenes were detected in Taraxacum roots, amongst which β-elemene and farnesene were detected in the leaves and roots, but the content in the roots was much higher than that in the leaves. In some varieties of Taraxacum roots, cyclosativene, zingiberene, α-bulnesene, cembrene and silphiperfol-5-ene were also detected. Ketones were also the main VCs in Taraxacum roots; geranyl acetone and 3,5-octadien-2-one were detected in all samples, with the contents ranging from 0.36–4.00 μg/g and 0.52–3.35 μg/g, respectively. Pyrazine not only makes important contributions to the aroma of many baked and natural foods, but also has significant biological and pharmacological significance [27]. For example, tetramethylpyrazine has antithrombotic activity [28], and was detected in the roots and leaves of ‘TK-Y’, with the content of 1.37 μg/g and 1.58 μg/g, respectively; its content in ‘TK-H’ roots was as high as 9.72 μg/g. Several other pyrazines were also detected in the roots of some varieties; they were 2,3,5-trimethylpyrazine, 2,3-dimethyl-5-ethylpyrazine, 2-ethyl-5-methylpyrazine and 2,6-diethylpyrazine.
Most of the VCs in different varieties of dandelion had significant differences. When comparing TKS and TO, the VCs detected in the leaves and roots of ‘TK-H’ (TKS) were the greatest, and the content was the highest, followed by ‘TK-Y’ (TKS). Among TO, only ‘A44’ had a higher volatile component content, higher than ‘TK-A’ (TKS). The volatile components of the other three TO varieties were low. VCs are secondary metabolites of plants. Their composition and content are affected by plant genetic characteristics, development stages, temperature, light, water, atmospheric nutrients and other abiotic factors. Therefore, there are differences in volatile components among different dandelion varieties. The composition and content of volatile components of TKS from different habitats are also different due to their different growth environments. The common VCs detected in all dandelion samples are: ethyl tetradecanoate, ethyl linolenate, ethyl linoleate, ethyl caprylate, dihydroactinidiolide, ethyl laurate, ethyl palmitate, β-ionone 5,6-epoxide, β-ionone, 3,5-octadien-2-one, geranyl acetone, β-cyclocitral, phytol, benzyl alcohol, naphthalene, 3-methyl-tridecane, 2-Pentylfuran and β-elemene; these are the main VCs in dandelion plants, most of which not only contribute to aroma, but also have many pharmacological effects [29,30].

3.3. Fatty Acids Composition in Leaf of Taraxacum

The fatty acid composition in leaves of the three TKS and four TO samples are presented in Table 1. A total of 15 fatty acids, including 11 saturated fatty acids (SFAs), 2 monounsaturated fatty acids (MUFAs) and 2 polyunsaturated fatty acids (PUFAs) were identified. The types of fatty acids with higher contents in the samples were similar. For example, the PUFAs linoleic acid (C18:2n6c) and linolenic acid (C18:3n3), the MUFA oleic acid (C18:1n9c), and the SFAs hexadecanoic acid (C16:0 and stearic acid (C18:0) were consistently high in all dandelion samples. The most abundant fatty acid was C18:3n3, followed by C18:2n6c and C16:0. This result is consistent with the findings of Dias et al. [31]. Liu et al. [32] also showed that the major fatty acid in Taraxacum officinale leaves was α-linolenic acid.
ANOVA revealed that there were significant differences in the content of each fatty acid between different samples (p < 0.05). Among the seven Taraxacum varieties, the C18:3n3 content of ‘YS’ was the highest (12.73 mg/g), significantly higher than that of other varieties (p < 0.05). Second only to that in ‘YS’, the content of C18:3n3 in ‘TK-A’ and ‘A44’ was basically the same, 9.04 and 9.01 mg/g, respectively. The highest content of C18:2n6c was found in ‘TK-A’ (7.20 mg/g) and ‘YS’ (6.85 mg/g). There was no significant difference between these two varieties, but they are significantly higher than the rest of the cultivars (p < 0.05). C18:1n9c also presented a high content in the ‘TK-A’ cultivar (1.35 mg/g), followed by ‘A44’ (0.88 mg/g) and ‘YS’ (0.87 mg/g). The content of another MUFA, 9-palmitoleic acid (C16:1n7c), in each variety was relatively low, and it was not detected in ‘A44’; for the other cultivars, it was detected with contents ranging from 0.04 mg/g for ‘PZ’ and 0.27 mg/g for ‘TK-H’. The two main saturated fatty acids in dandelion leaves were C16:0 and C18:0, with values ranging from 0.82–2.02 mg/g and 0.19–0.57 mg/g, respectively. The contents of other saturated fatty acids in dandelion leaves were low. Significant differences also existed in the PUFA, MUFA and SFA contents amongst the seven Taraxacum samples. The SFAs contents ranged from 1.314 mg/g to 3.46 mg/g, with the highest values in leaves of ‘YS’ and ‘A44’ and lowest in leaves of ‘PZ’. The contents of MUFAs ranged from 0.58 mg/g to 1.44 mg/g, with the highest contents representing the ‘TK-A’ cultivar. The total PUFA contents in leaves of ‘PZ’, ‘A17’, ‘TK-H’, ‘TK-Y’, ‘A44’, ‘TK-A’ and ‘YS’ increased successively, ranging from 7.63 mg/g to 19.58 mg/g. In addition, the ratio of unsaturated/saturated fatty acids (USFA/SFA) had high values in the Taraxacum leaves, ranging between 4.445 for ‘A44’ to 6.252 for ‘PZ’. The USFA/SFA ratio of ‘PZ’, ‘TK-Y’, ‘TK-A’, ‘TK-H’ and ‘YS’ were slightly higher than those obtained by Dias et al. [31] in vegetative parts of wild Taraxacum sect. Ruderalia from northeastern Portugal. These high USFA/SFA ratios show the healthcare potential of the Taraxacum leaves.
On the other hand, when comparing the fatty acids profiles of TKS and TO, the C18:3n3 content of ‘TK-A’ (TKS) was only slightly lower than that of ‘YS’ (TO), but significantly higher than that of the other three TO varieties (‘A17’, ‘A44’ and ‘PZ’), and its c18:1n9c and c18:2n6c contents were the highest amongst the seven samples. The content of PUFAs and MUFAs of the other two TKS (‘TK-H’ and ‘TK-Y’) was also quite high. The content of C18:2n6c and C18:3n3 of ‘TK-H’ was equivalent to that of ‘A17’. The content of C18:2n6c and C18:3n3 of ‘TK-Y’ was higher than that of ‘A17’ and ‘PZ’, and the C16:1n7c of ‘TK-H’ was the highest amongst the seven varieties. These USFAs have many physiological functions, such as controlling triglyceride levels, preventing atherosclerosis, improving metabolic syndrome and inflammation and maintaining blood glucose levels [33,34]. The USFA/SFA values of these three TKS varieties were greater than 6, higher than those of A17, A44 and YS. Therefore, TKS also has high nutritional potential and medicinal value according to its fatty acid composition. On the other hand, there were also significant differences in the content of most fatty acids among the three TKS varieties from different origins. Aside from the contents of C16:1n7c and C18:0, which were slightly lower, the contents of other fatty acids in ‘TK-A’ were significantly higher than in the other two TKS varieties. There was no significant difference in the content of palmitic acid and the ratio of USFA/SFA between ‘TK-H’ and ‘TK-Y’, but the content of other fatty acids was mostly higher in ‘TK-Y’.

3.4. Fatty Acid Composition in Taraxacum Roots

Table 2 shows the fatty acid profile of Taraxacum roots in this work. A total of nine fatty acids were detected, which were the same as those detected in leaves, although C11:0, C12:0, C15:0, C17:0, C16:1n7c and C23:0 were not present in roots and the contents of these six fatty acids in leaves were relatively low. The SFAs in Taraxacum roots were mainly C16:0 and C18:0, accounting for more than 70% of the SFAs. MUFA was mainly c18:1n9c, showing the highest content in ‘YS’ (2.15 mg/g), followed by ‘TK-A’ and ‘A17’ with very similar contents (1.04 and 0.95 mg/g, respectively). Two kinds of PUFAs, c18:2n6c and c18:3n3, were detected in all seven Taraxacum root samples and were the main fatty acids in Taraxacum roots. This was consistent with the results obtained in Taraxacum leaves. However, different from the results obtained in Taraxacum leaves, the largest content of fatty acids in dandelion roots was not C18:3n3, but C18:2n6c, which accounted for 49.88–62.56% of the total fatty acids. ‘TK-A’ and ‘YS’ were detected with the highest and similar linoleic acid contents, which were 7.60 and 7.51 mg/g, respectively. Linolenic acid was the second most abundant fatty acid in Taraxacum roots, showing the highest content of 2.98 mg/g for ‘PZ’, followed by ‘TK-A’ and ‘YS’ with values of 2.74 and 2.57 mg/g, respectively.
Significant differences of fatty acids content were found amongst the roots of seven different varieties of dandelion. ‘YS’ had the highest content of linoleic acid, oleic acid, total unsaturated fatty acids and total fatty acids. As a TKS variety, ‘TK-A’ had no significant difference in linoleic acid and linolenic acid content with ‘YS’, and its USFA/SFA was the highest (7.33), a value significantly higher than ‘YS’ (4.29) and other varieties. In our study, the content of USFAs in leaves and roots was much higher than that of SFAs, the values of USFA/SFA were all greater than 4.0. USFAs were mainly linolenic acid, linoleic acid and oleic acid, which could increase the phytochemical value of Taraxacum plants, as they belong to the omega-3, omega-6 and omega-9 fatty acid groups, respectively, and play a very important role in the prevention of some chronic diseases [35].

3.5. Principal Components Analysis

Principal component analysis (PCA) was used to analyze the fatty acid levels (SFA, MUFA, PUFA and USFA/SFA) and volatile chemical groups (esters, ketones, aldehydes, alcohols, acids, alkenes, aromatics, alkanes, phenols, furans, pyrazines, ethers and others) of leaves and roots of seven samples to observe the overall differences in volatile components and fatty acid composition between different varieties from different places of origin. The results are shown in Figure 4, indicating that the first two principal components (PC1 and PC2) together can explain 62.5% and 77.3% of the total date variance obtained from Taraxacum leaves and roots, respectively. In Figure 4A, ‘TK-H’ was located in the first quadrant, distal to the positive axis of PC1; ‘TK-Y’ was located in the fourth quadrant; ‘TK-A’, ‘A17’, ‘PZ’ and ‘A44’ were close to each other, and ‘YS’ was farther away from them, but also located in the negative value region of PC1. In Figure 4B, ‘TK-H’ is also located at the distal end of the positive axis of PC1, away from other varieties; ‘TK-Y’ was also far from other varieties; The distance between ‘TK-A’, ‘PZ’, ‘A44’and ‘A17’ was small, and ‘YS’ was also located in the negative value region of PC1. ‘TK-H’ was from Heilongjiang, ‘TK-Y’ was from Yili, Xinjiang, and the other five varieties were all from the Anning canal plantation, Xinjiang. Therefore, the above description shows that the place of origin has great influence on the volatile components and fatty acid composition in dandelion leaves and roots, and there is little difference between TKS and TO from the same place of origin.

4. Conclusions

The VCs and fatty acids in leaves and roots of TKS were analyzed by HP-SPME/GC–MS and compared with TO. The results prove that TKS is rich in unsaturated fatty acids, especially linolenic acid and linoleic acid, and contains a large number of volatile components with medicinal value. Their contents in TKS are equal to or even higher than those of TO. Therefore, as a rubber resource plant, TKS’s non-rubber by-products have high development and utilization value and can be used in food, cosmetics and pharmaceutical industries. This research can provide valuable data for the comprehensive utilization of TKS.

Supplementary Materials

The following supporting information can be downloaded at: https://www.mdpi.com/article/10.3390/separations9100314/s1, Table S1. The concentration (μg/g DW) of volatile compounds (VCs) in Taraxacum leaves (A) and roots (B).

Author Contributions

Conceptualization, N.Z. and Y.D.; methodology, N.Z.; formal analysis, N.Z.; investigation, T.C., S.Y. and S.G.; data curation, N.Z. and S.G.; writing—original draft preparation, N.Z.; writing—review and editing, Y.D.; funding acquisition, Y.D. All authors have read and agreed to the published version of the manuscript.

Funding

This research was funded by Beijing University of Chemical Technology-China-Japan Friendship Hospital Biomedical Translation Engineering Research Center Joint Project (RZ2020-02), and Production & Construction Group Key Laboratory of Special Agricultural Products Further Processing in Southern Xinjiang Open Project (AP2204).

Institutional Review Board Statement

Not applicable.

Informed Consent Statement

Not applicable.

Data Availability Statement

Not applicable.

Conflicts of Interest

The authors declare no conflict of interest. The funders had no role in the design of the study; in the collection, analyses, or interpretation of data; in the writing of the manuscript; or in the decision to publish the results.

References

  1. Krotkov, G. A review of literature on Taraxacum koksaghyz Rod. Bot. Rev. 1945, 11, 417–461. [Google Scholar] [CrossRef]
  2. Van Beilen, J.B.; Poirier, Y. Gunyule and Russian dandelion as alternative sources of natural rubber. Crit. Rev. Biotechnol. 2007, 27, 217–231. [Google Scholar] [CrossRef]
  3. Buranov, A.U.; Elmuradov, B.J. Extraction and Characterization of Latex and Natural Rubber from Rubber-Bearing Plants. J. Agric. Food Chem. 2010, 58, 734–743. [Google Scholar] [CrossRef]
  4. Ramirez-Cadavid, D.A.; Comish, K.; Michel, F.C. Taraxacum kok-saghyz (TK): Compositional analysis of a feedstock for natural rubber and other bioproducts. Ind. Crops Prod. 2017, 107, 624–640. [Google Scholar] [CrossRef]
  5. Zhang, N.; Guo, T.; Ma, X.; Liu, J.; Dong, Y.; Zhang, J. Rational Rubber Extraction and Simultaneous Determination of Rubber Content and Molecular Weight Distribution in Taraxacum kok-saghyz Rodin by Size-Exclusion Chromatography. Chromatographia 2019, 82, 1459–1466. [Google Scholar] [CrossRef]
  6. Ramirez-Cadavid, D.A.; Cornish, K.; Hathwaik, U.; Kozak, R.; McMahan, C.; Michel, F.C., Jr. Development of novel processes for the aqueous extraction of natural rubber from Taraxacum kok-saghyz (TK). J. Chem. Technol. Biotechnol. 2019, 94, 2452–2464. [Google Scholar] [CrossRef]
  7. Salehi, M.; Bahmankar, M.; Naghavi, M.R.; Cornish, K. Rubber and latex extraction processes for Taraxacum kok-saghyz. Ind. Crops Prod. 2022, 178, 114562. [Google Scholar] [CrossRef]
  8. Putter, K.M.; van Deenen, N.; Müller, B.; Fuchs, L.; Vorwerk, K.; Unland, K.; Bröker, J.N.; Scherer, E.; Huber, C.; Eisenreich, W.; et al. The enzymes OSC1 and CYP716A263 produce a high variety of triterpenoids in the latex of Taraxacum koksaghyz. Sci. Rep. 2019, 9, 5942. [Google Scholar] [CrossRef] [Green Version]
  9. Kong, J.; Chen, J.; Yue, Y.; Ma, Q.; Dong, Y.; Zhang, J. Ultrasonic/microwave–assisted extraction and rapid quantitative determination of active ingredients in Taraxacum kok-saghyz Rodin by ultra-high-performance liquid chromatography tandem mass spectrometry. Int. J. Mass Spectrom. 2021, 470, 116700. [Google Scholar] [CrossRef]
  10. Molinu, M.G.; Piluzza, G.; Campesi, G.; Sulas, L.; Re, G.A. Antioxidant Sources from Leaves of Russian Dandelion. Chem. Biodivers. 2019, 16, e1900250. [Google Scholar] [CrossRef] [PubMed]
  11. Kooti, W.; Farokhipour, M.; Asadzadeh, Z.; Ashtary-Larky, D.; Asadi-Samani, M. The role of medicinal plants in the treatment of diabetes: A systematic review. Electron. Physician 2016, 8, 1832–1842. [Google Scholar] [CrossRef] [PubMed] [Green Version]
  12. Brown, T.J.; Brainard, J.; Song, F.; Wang, X.; Abdelhamid, A.; Hooper, L. Omega-3, omega-6, and total dietary polyunsaturated fat for prevention and treatment of type 2 diabetes mellitus: Systematic review and meta-analysis of randomised controlled trials. BMJ—Br. Med. J. 2019, 366, l4697. [Google Scholar] [CrossRef] [PubMed] [Green Version]
  13. Guil-Guerrero, J.L.; Delgado, A.; Gonzalez, M.C.; Isasa, M.T. Fatty acids and carotenes in some ber (Ziziphus jujuba Mill) varieties. Plant Foods Hum. Nutr. 2004, 59, 23–27. [Google Scholar] [CrossRef]
  14. Savych, A.; Basaraba, R.; Muzyka, N.; Ilashchuk, P. Analysis of fatty acid composition content in the plant components of antidiabetic herbal mixture by GC-MS. Pharmacia 2021, 68, 433–439. [Google Scholar] [CrossRef]
  15. Sears, B.; Perry, M. The role of fatty acids in insulin resistance. Lipids Health Dis. 2015, 14, 121. [Google Scholar] [CrossRef] [Green Version]
  16. Mizunoya, W.; Haramizu, S.; Shibakusa, T.; Okabe, Y.; Fushiki, T. Dietary conjugated linoleic acid increases endurance capacity and fat oxidation in mice during exercise. Lipids 2005, 40, 265–271. [Google Scholar] [CrossRef]
  17. Boutros, C.; Somasundar, P.; Razzak, A.; Helton, S.; Espat, N.J. Omega-3 Fatty Acids: Investigations from Cytokine Regulation to Pancreatic Cancer Gene Suppression. Arch. Surg. 2010, 145, 515–520. [Google Scholar] [CrossRef] [Green Version]
  18. Bengtsson, A.; Grahn, P. Outdoor environments in healthcare settings: A quality evaluation tool for use in designing healthcare gardens. Urban For. Urban Green. 2014, 13, 878–891. [Google Scholar] [CrossRef] [Green Version]
  19. Ji, W.W.; Li, R.-P.; Li, M.; Wang, S.-Y.; Zhang, X.; Niu, X.-X.; Li, W.; Yan, L.; Wang, Y.; Fu, Q.; et al. Antidepressant-like effect of essential oil of Perilla frutescens in a chronic, unpredictable, mild stress-induced depression model mice. Chin. J. Nat. Med. 2014, 12, 753–759. [Google Scholar] [CrossRef]
  20. Meng, X.X.; Li, D.; Zhou, D.; Wang, D.; Liu, Q.; Fan, S. Chemical composition, antibacterial activity and related mechanism of the essential oil from the leaves of Juniperus rigida Sieb. et Zucc against Klebsiella pneumoniae. J. Ethnopharmacol. 2016, 194, 698–705. [Google Scholar] [CrossRef] [PubMed]
  21. Manaharan, T.; Thirugnanasampandan, R.; Jayakumar, R.; Kanthimathi, M.S.; Ramya, G.; Ramnath, M.G. Purified Essential Oil from Ocimum sanctum Linn. Triggers the Apoptotic Mechanism in Human Breast Cancer Cells. Pharmacogn. Mag. 2016, 12, S327–S331. [Google Scholar] [CrossRef] [Green Version]
  22. Chen, Q.Q.; Song, J.; Bi, J.; Meng, X.; Wu, X. Characterization of volatile profile from ten different varieties of Chinese jujubes by HS-SPME/GC-MS coupled with E-nose. Food Res. Int. 2018, 105, 605–615. [Google Scholar] [CrossRef] [PubMed]
  23. Dong, W.J.; Hu, R.; Chu, Z.; Zhao, J.; Tan, L. Effect of different drying techniques on bioactive components, fatty acid composition, and volatile profile of robusta coffee beans. Food Chem. 2017, 234, 121–130. [Google Scholar] [CrossRef] [PubMed]
  24. Zhang, K.H.; Li, D.; Zang, M.; Zhang, Z.; Li, X.; Wang, S.; Zhang, S.; Zhao, B. Comparative characterization of fatty acids, reheating volatile compounds, and warmed-over flavor (WOF) of Chinese indigenous pork and hybrid pork. LWT—Food Sci. Technol. 2022, 155, 112981. [Google Scholar] [CrossRef]
  25. Wang, L.N.; Wang, Y.; Wang, W.; Zheng, F.; Chen, F. Comparison of volatile compositions of 15 different varieties of Chinese jujube (Ziziphus jujuba Mill.). J. Food Sci. Technol. Mysore 2019, 56, 1631–1640. [Google Scholar] [CrossRef]
  26. Kiyama, R. Estrogenic terpenes and terpenoids: Pathways, functions and applications. Eur. J. Pharmacol. 2017, 815, 405–415. [Google Scholar] [CrossRef] [PubMed]
  27. Ismail, B.B.; Huang, R.; Liu, D.; Ye, X.; Guo, M. Potential valorisation of baobab (Adansonia digitata) seeds as a coffee substitute: Insights and comparisons on the effect of roasting on quality, sensory profiles, and characterisation of volatile aroma compounds by HS-SPME/GC-MS. Food Chem. 2022, 394, 133475. [Google Scholar] [CrossRef] [PubMed]
  28. Liu, S.Y.; Sylvester, D.M. Antithrombotic/antiplatelet activity of tetramethylpyrazine. Thromb. Res. 1990, 58, 129–140. [Google Scholar] [CrossRef]
  29. Jeyadevi, R.; Sivasudha, T.; Ilavarasi, A.; Thajuddin, N. Chemical Constituents and Antimicrobial Activity of Indian Green Leafy Vegetable Cardiospermum halicacabum. Indian J. Microbiol. 2013, 53, 208–213. [Google Scholar] [CrossRef] [PubMed] [Green Version]
  30. Sadeghnia, H.R.; Kamkar, M.; Assadpour, E.; Boroushaki, M.T.; Ghorbani, A. Protective Effect of Safranal, a Constituent of Crocus sativus, on Quinolinic Acid-induced Oxidative Damage in Rat Hippocampus. Iran. J. Basic Med. Sci. 2013, 16, 73–82. [Google Scholar] [PubMed]
  31. Dias, M.I.; Barros, L.; Alves, R.C.; Oliveira MB, P.; Santos-Buelga, C.; Ferreira, I.C. Nutritional composition, antioxidant activity and phenolic compounds of wild Taraxacum sect. Ruderalia. Food Res. Int. 2014, 56, 266–271. [Google Scholar] [CrossRef]
  32. Liu, L.X.; Howe, P.; Zhou, Y.; Hocart, C.; Zhang, R. Fatty acid profiles of leaves of nine edible wild plants: An Australian study. J. Food Lipids 2002, 9, 65–71. [Google Scholar] [CrossRef]
  33. Souza, C.O.; Teixeira, A.A.S.; Lima, E.A.; Batatinha, H.A.P.; Gomes, L.M.; Carvalho-Silva, M.; Mota, I.T.; Streck, E.L.; Hirabara, S.M.; Neto, J.C.R. Palmitoleic Acid (N-7) Attenuates the Immunometabolic Disturbances Caused by a High-Fat Diet Independently of PPAR alpha. Mediat. Inflamm. 2014, 2014, 582197. [Google Scholar] [CrossRef] [Green Version]
  34. Luan, D.; Wang, D.; Campos, H.; Baylin, A. Adipose tissue palmitoleic acid is inversely associated with nonfatal acute myocardial infarction in Costa Rican adults. Nutr. Metab. Cardiovasc. Dis. 2018, 28, 973–979. [Google Scholar] [CrossRef] [PubMed]
  35. Alonso, D.L.; Maroto, F.G. Plants as ‘chemical factories’ for the production of polyunsaturated fatty acids. Biotechnol. Adv. 2000, 18, 481–497. [Google Scholar] [CrossRef]
Figure 1. Typical TICs of Taraxacum leaves (A) and roots (B) determined by HS-SPME/GC–MS.
Separations 09 00314 g001
Figure 2. The relative content of volatile chemical groups in different varieties detected by HS-SPME/GC–MS: (A) was detected in Taraxacum leaves; (B) was detected in Taraxacum roots.
Separations 09 00314 g002
Figure 3. The cluster heatmap of the concentration of VCs grouped by chemical families: (A) was detected in Taraxacum leaves; (B) was detected in Taraxacum roots.
Separations 09 00314 g003
Figure 4. Principal component analysis of leaves (A) and roots (B) of dandelion (score plots of PC1 and PC2).
Separations 09 00314 g004
Table 1. Fatty acid contents (mg/g DW) in dandelion leaves.
‘TK-H’‘TK-Y’‘TK-A’‘A17’‘A44’‘PZ’‘YS’
Decanoic acid (C11:0)NDNDND0.02 ± 0.00 a0.43 ± 0.02 bNDND
Dodecanoic acid (C12:0)NDND0.05 ± 0.00 c0.02 ± 0.00 a0.06 ± 0.00 dND0.04 ± 0.00 b
Myristic acid (C14:0)0.06 ± 0.00 b0.10 ± 0.00 c0.12 ± 0.00 d0.10 ± 0.00 c0.18 ± 0.01 f0.05 ± 0.00 a0.14 ± 0.01 e
Pentadecanoic acid (C15:0)0.03 ± 0.00 aND0.07 ± 0.00 c0.06 ± 0.00 b0.06 ± 0.00 bND0.08 ± 0.01 d
Hexadecanoic acid (C16:0)1.31 ± 0.07 b1.28 ± 0.03 b1.65 ± 0.03 c1.32 ± 0.02 b1.79 ± 0.14 c0.82 ± 0.03 a2.02 ± 0.15 d
9-Hexadecenoic acid (C16:1n7c)0.27 ± 0.01 d0.09 ± 0.00 b0.09 ± 0.01 b0.08 ± 0.02 bND0.04 ± 0.01 a0.18 ± 0.01 c
Margaric acid (C17:0)NDND0.07 ± 0.00 b0.06 ± 0.01 aNDND0.06 ± 0.01 a
Stearic acid (C18:0)0.26 ± 0.00 b0.49 ± 0.02 e0.44 ± 0.01 d0.30 ± 0.01 c0.51 ± 0.04 e0.19 ± 0.01 a0.57 ± 0.06 f
Oleic acid (C18:1n9c)0.35 ± 0.02 a0.56 ± 0.02 b1.35 ± 0.06 e0.78 ± 0.02 c0.88 ± 0.04 d0.53 ± 0.01 b0.87 ± 0.03 d
Linoleic acid (C18:2n6c)4.25 ± 0.17 b4.94 ± 0.17 c7.20 ± 0.13 d4.26 ± 0.12 b5.29 ± 0.48 c3.23 ± 0.11 a6.85 ± 0.39 d
Eicosanoic acid (C20:0)0.06 ± 0.00 a0.09 ± 0.01 b0.13 ± 0.00 c0.10 ± 0.01 b0.09 ± 0.00 b0.05 ± 0.00 a0.12 ± 0.01 c
Linolenic acid (C18:3n3)7.22 ± 0.29 b8.14 ± 0.30 c9.04 ± 0.20 d7.01 ± 0.23 b9.01 ± 0.62 d4.34 ± 0.14 a12.73 ± 0.53 e
Docosanoic acid (C22:0)0.09 ± 0.00 a0.12 ± 0.01 c0.14 ± 0.01 d0.14 ± 0.00 d0.11 ± 0.00 b0.09 ± 0.00 a0.16 ± 0.01 e
Tricosanoic acid (C23:0)0.05 ± 0.00 bND0.07 ± 0.00 d0.06 ± 0.00 c0.06 ± 0.01 c0.03 ± 0.00 a0.08 ± 0.00 e
Tetracosanoic acid (C24:0)0.16 ± 0.00 d0.12 ± 0.01 b0.14 ± 0.00 c0.17 ± 0.01 e0.14 ± 0.01 bc0.09 ± 0.01 a0.21 ± 0.01 f
The amount of PUFA11.47 ± 0.46 b13.08 ± 0.46 c16.25 ± 0.33 e11.36 ± 0.35 b14.30 ± 1.08 d7.63 ± 0.24 a19.58 ± 0.93 f
The amount of MUFA0.61 ± 0.02 ab0.65 ± 0.02 b1.44 ± 0.06 e0.86 ± 0.01 c0.88 ± 0.04 c0.58 ± 0.01 a1.04 ± 0.04 d
The amount of SFA2.01 ± 0.06 b2.21 ± 0.06 bc2.88 ± 0.05 d2.34 ± 0.04 c3.42 ± 0.20 e1.31 ± 0.06 a3.46 ± 0.25 e
USFA/SFA6.01 ± 0.07 cd6.22 ± 0.08 de6.15 ± 0.05 cde5.23 ± 0.11 b4.45 ± 0.20 a6.25 ± 0.11 e5.96 ± 0.15 c
‘TK-H’, ‘TK-Y’ and ‘TK-A’ are Taraxacum kok-saghyz Rodin samples from three different habitats; ‘A17’, ‘A44’, ‘PZ’ and ‘YS’ are Taraxacum officinale samples from the same habitats. Values (means ± SD) with the same letters in the same row indicate no significant difference (p < 0.05). ND: not detected. PUFA: polyunsaturated fatty acids; MUFA: monounsaturated fatty acids; SFA: saturated fatty acids; USFA: unsaturated fatty acids.
Table 2. Fatty acid contents (mg/g DW) in dandelion roots.
‘TK-H’‘TK-Y’‘TK-A’‘A17’‘A44’‘PZ’‘YS’
Myristic acid (C14:0)0.03 ± 0.00 a0.03 ± 0.01 ab0.04 ± 0.01 bc0.04 ± 0.00 c0.03 ± 0.00 a0.04 ± 0.00 c0.07 ± 0.00 d
Hexadecanoic acid (C16:0)0.61 ± 0.02 a0.62 ± 0.04 a1.02 ± 0.07 c1.14 ± 0.04 d0.78 ± 0.03 b1.05 ± 0.08 cd1.72 ± 0.09 e
Stearic acid (C18:0)0.20 ± 0.02 ab0.24 ± 0.03 c0.26 ± 0.00 d0.19 ± 0.01 a0.24 ± 0.00 c0.22 ± 0.01 bc0.35 ± 0.02 e
Oleic acid (C18:1n9c)0.16 ± 0.01 a0.71 ± 0.04 b1.04 ± 0.03 d0.95 ± 0.03 cd0.71 ± 0.08 b0.87 ± 0.09 c2.15 ± 0.07 e
Linoleic acid (C18:2n6c)3.49 ± 0.11 a3.27 ± 0.20 a7.51 ± 0.38 d6.24 ± 0.23 c4.45 ± 0.15 b6.59 ± 0.49 c7.60 ± 0.44 d
Eicosanoic acid (C20:0)NDND0.06 ± 0.01 b0.05 ± 0.01 ab0.05 ± 0.00 a0.05 ± 0.00 a0.08 ± 0.00 c
Linolenic acid (C18:3n3)0.84 ± 0.04 a1.07 ± 0.10 a2.74 ± 0.24 d2.32 ± 0.09 c1.40 ± 0.03 b2.98 ± 0.19 e2.57 ± 0.13 d
Docosanoic acid (C22:0)0.14 ± 0.01 d0.13 ± 0.01 cd0.09 ± 0.02 a0.12 ± 0.01 bc0.10 ± 0.01 ab0.09 ± 0.01 a0.28 ± 0.02 e
Tetracosanoic acid (C24:0)0.12 ± 0.01 bc0.08 ± 0.01 a0.07 ± 0.01 a0.13 ± 0.01 c0.10 ± 0.00 b0.08 ± 0.00 a0.36 ± 0.01 d
The amount of PUFA4.33 ± 0.15 a4.34 ± 0.29 a10.25 ± 0.49 d8.56 ± 0.31 c5.85 ± 0.18 b9.57 ± 0.68 d10.17 ± 0.57 d
The amount of MUFA0.16 ± 0.01 a0.71 ± 0.04 b1.04 ± 0.03 d0.95 ± 0.03 cd0.71 ± 0.08 b0.87 ± 0.06 c2.15 ± 0.07 e
The amount of SFA1.09 ± 0.05 a1.09 ± 0.07 a1.54 ± 0.12 cd1.70 ± 0.07 d1.29 ± 0.03 b1.53 ± 0.10 c2.92 ± 0.14 e
USFA/SFA4.10 ± 0.05 a4.63 ± 0.09 b7.33 ± 0.34 f5.59 ± 0.11 d5.07 ± 0.06 c6.82 ± 0.06 e4.22 ± 0.01 a
Values (means ± SD) with the same letters in the same row indicate no significant difference (p < 0.05). ND: not detected.
Publisher’s Note: MDPI stays neutral with regard to jurisdictional claims in published maps and institutional affiliations.

